14
Study of the effects of nanometer − in nickel hydroxide electrodes 1 Yue Li May. 5 th , 2015 Department of Chemical and Biological Engineering Illinois Institute of Technology, Chicago

Study of the effects of nanometer 𝛃 − 𝐍𝐢 𝐎𝐇 𝟐 in
nickel hydroxide electrodes
1
Yue Li
May. 5th , 2015
Department of Chemical and Biological Engineering
Illinois Institute of Technology, Chicago

Outline
• Background: A proposed mechanism
• Experimental parameters and conditions
• Results and discussions
a) Transmission electron mocrcosopy (TEM)
b) X-ray powder diffraction (XRD)
c) Cyclic voltammetry (CV)
d) Charge/discharge test
e) X-ray absorption spectroscopy (XAS)

3
Background: 𝐍𝐢 𝐎𝐇 𝟐 Charge/Discharge Mechanism
Nickel Substrate
NiOOH Ni(OH)2 e−
Discharge
H+
OH−
e−
H+
OH−
Sathya Motupally, Christopher C. Streinz, and John W. Weidner, J. Electrochem. Soc., 145 (1)
1998 29-34.
H2O
Ni(OH)2 + OH− NiOOH + H2O + ne
−
Charge
H2O

Transmission electron mocrcosopy (TEM)
4
TEM morphology of the nanometer
Ni(OH)2 prepared by supersonic
coordination–precipitation method.
The mean grain size was about 50 nm,
with a range of 20–70 nm. The
morphology of the nanometer
Ni(OH)2 prepared by this method
exhibited an irregular structure, which
is different from the spherical structure
of commercial Ni(OH)2.

X-ray powder diffraction (XRD)
5
The crystallite sizes of the main
feature lines were calculated from
Scherrer formula from which a mean
grain size of 13.1 nm of nanometer
Ni(OH)2 was attained. Average grain
size of spherical Ni(OH)2 is 455.4 nm,
which is nearly 35 times of that of
nanometer Ni(OH)2.

Cyclic voltammetry (CV)
6
Cyclic voltammetry was applied to measure the
proton diffusion coefficient. Peak current, Ip, in cyclic
voltammogram can be expressed as:
Ip = 0.446n3 2 F3 2 S(RT)−1 2 D1 2 c0ν1 2
n: electron number of the reaction (≈ 1 for Ni(OH)2);
F: Faraday’s constant;
S: Electrode surface area;
D: Diffusion coefficient;
𝜈: Scanning rate;
c0: Initial concentration of the reactant.

Approach: Cyclic voltammetry (CV)
7
It is easy to notice the linear relationship between Ip
and 𝜈1 2 as shown in the left figure, which to certain
extent confirms that electrode reaction of nickel
hydroxide is controlled by proton diffusion coefficient
D.
Smaller size of nanometer Ni(OH)2 provides more
chances for the particles to contact the electrode
solution, therefore proton diffusion is enhanced, which
in turn will accelerate the electrode reaction.
Cyclic voltammetry (CV)
8
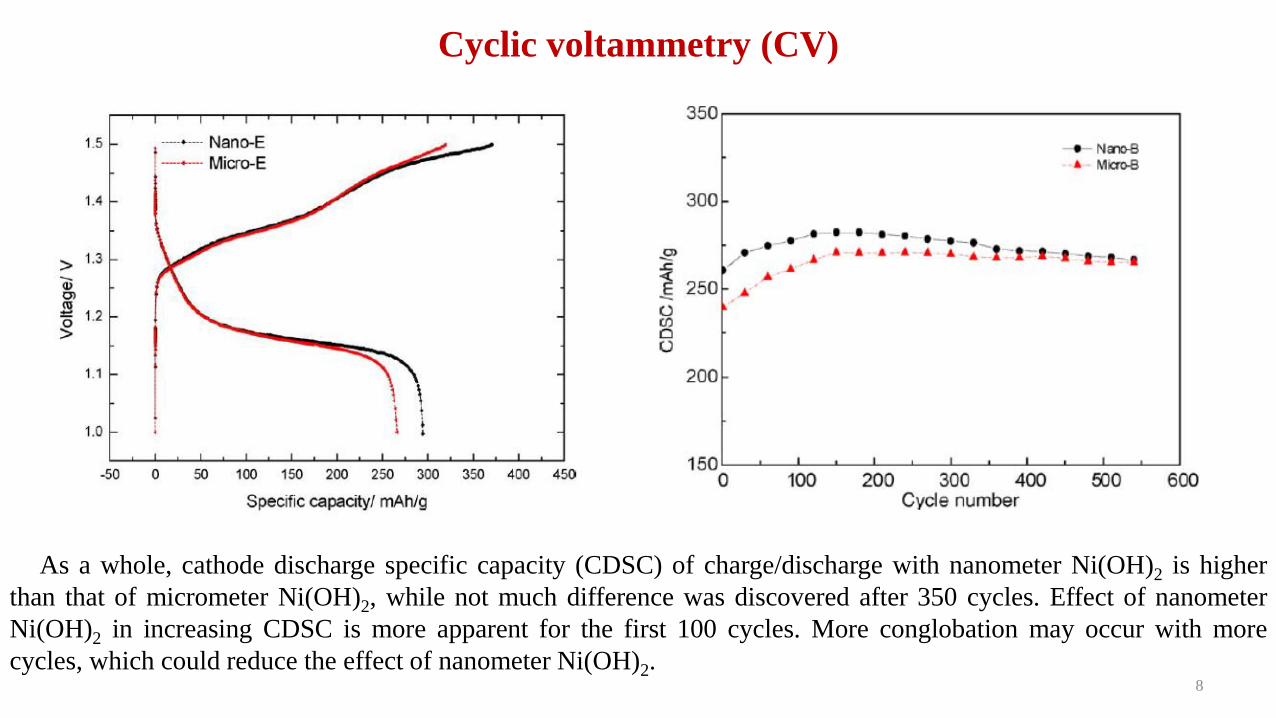
As a whole, cathode discharge specific capacity (CDSC) of charge/discharge with nanometer Ni(OH)2 is higher
than that of micrometer Ni(OH)2, while not much difference was discovered after 350 cycles. Effect of nanometer
Ni(OH)2 in increasing CDSC is more apparent for the first 100 cycles. More conglobation may occur with more
cycles, which could reduce the effect of nanometer Ni(OH)2.
X-ray absorption spectroscopy (XAS)
• X-ray absorption spectroscopy (XAS) refers to the details of how x-rays are absorbed by an
atom at energies near and above the core-level binding energies of that atom. Specifically,
XAFS is the modulation of an atom’s x-ray absorption probability due to the chemical and
physical state of the atom. XAFS spectra are especially sensitive to the formal oxidation state,
coordination chemistry, and the distances, coordination numberand species of the atoms
immediately surrounding the selected element.
a. X-ray absorption near-edge spectroscopy (XANES) is strongly sensitive to formal
oxidation state and coordination chemistry (e.g., octahedral, tetrahedral coordination) of the
absorbing atom.
b. Extended x-ray absorption fine-structure spectroscopy (EXAFS) is used to determine the
distances, coordination number, and species of the neighbors of the absorbing atom.
9

X-ray absorption spectroscopy (XAS)
10
• 4W1B beamline of Beijing Synchrotron Radiation Facility (BSRF);
• Transmission mode;
• The electron storage ring was operated at 2.2 GeV with a current of 30–50 mA;
• The incident and output beam intensities were monitored and recorded using a nitrogen gas flowing ionization
chamber;
• Scanning range: 8.2–9.2 keV, which covers the K edge absorption of Ni atoms;
• Energy resolution was about 1.5 eV for XANES and about 3.0 eV for EXAFS;
• The EXAFS functions were normalized by using the absorption jump and were Fourier transformed to R-space
with 𝜅3-weighting over the range from 2.3–12.7 Å−1
.

X-ray absorption spectroscopy (XAS)
11
Normalized XANES spectra of fully charged (a) and
discharged (b) Nano-E and Micro-E.
Plot (a): Fully charged state.
• Intensity of peak B is higher for Nano-E due to the structure
distortion;
• Visible edge shift to higher energies in Nano-E, which
means higher Ni oxidation state than
Plot (b): Discharged state.
• Higher intensity of peak B for Nano-E, indicating an
increase in structure distortion in discharged Nano-E;
• An obvious edge shift to lower energy for Nano-E interprets
a lower oxidation state of Ni at discharged state;
• A shape difference can be seen in region C. The peak for
Nano-E means that the conversion of NiOOH to Ni(OH)2 is
more complete.
12
X-ray absorption spectroscopy (XAS)
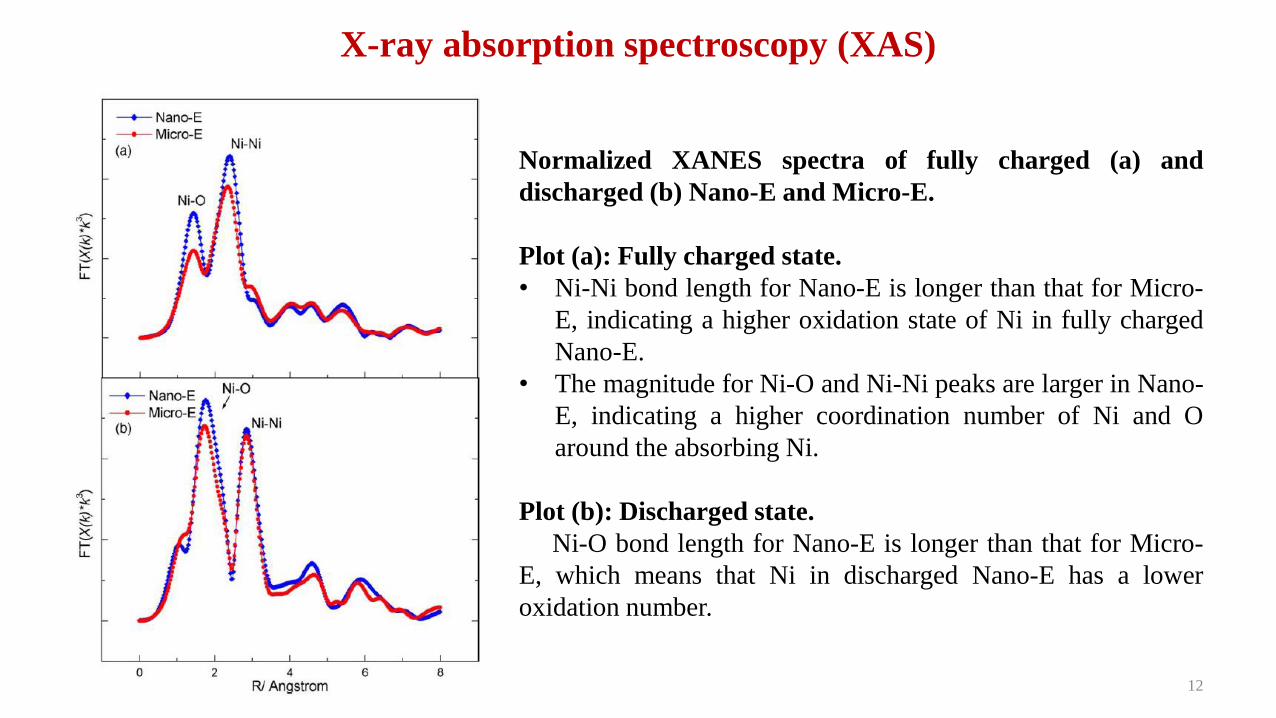
Normalized XANES spectra of fully charged (a) and
discharged (b) Nano-E and Micro-E.
Plot (a): Fully charged state.
• Ni-Ni bond length for Nano-E is longer than that for Micro-
E, indicating a higher oxidation state of Ni in fully charged
Nano-E.
• The magnitude for Ni-O and Ni-Ni peaks are larger in Nano-
E, indicating a higher coordination number of Ni and O
around the absorbing Ni.
Plot (b): Discharged state.
Ni-O bond length for Nano-E is longer than that for Micro-
E, which means that Ni in discharged Nano-E has a lower
oxidation number.
13
Conclusion
• Nanometer b-Ni(OH)2 prepared by the proposed method has larger proton diffusion coefficient than commercial
spherical Ni(OH)2;
• Nearly 10% increased cathode discharge specific capacity (CDSC) was obtained with addition of 8 mass%
nanometer Ni(OH)2;
• Effect of nanometer Ni(OH)2 in increasing CDSC is more obvious for the first 100 cycles;
• More disorder effects were found in nanometer Ni(OH)2 from a broadening of the (1 0 1) line;
• XAS(XANES and EXAFS) has revealed a higher oxidation state of Ni in fully charged Nano-E and a lower one in
discharged Nano-E;
• XANES showed increasing distortion in Nano-E during charge-discharge process;
• Promotion of the conversion between Ni2+ and Ni3+ due to enhanced proton diffusion in distorted Nano-E has been
supposed to be one explanation of increasing discharge specific capacity with the addition of nanometer Ni(OH)2.

Questions?
14


