Study of the performance of Thermoelectric Modules for use in Active Building Envelopes Xu Xu Steven Van Dessel Achille Messac Corresponding Author AchilleMessac, Ph.D. Distinguished Professor and Department Chair Mechanical and Aerospace Engineering Syracuse University, 263 Link Hall Syracuse, New York 13244, USA Email: [email protected]Tel: (315) 443-2341 Fax: (315) 443-3099 https://messac.expressions.syr.edu/ Bibliographical Information Xu Xu, Van Dessel, S., Messac, A., “Study of the performance of Thermoelectric Modules for use in Active Building Envelopes,” Building and Environment Journal, Vol. 42, No. 3, March 2007, pp. 1489-1502.
Transcript
Study of the performance of Thermoelectric Modules
Bibliographical Information Xu Xu, Van Dessel, S., Messac, A., “Study of the performance of Thermoelectric Modules for use in
Active Building Envelopes,” Building and Environment Journal, Vol. 42, No. 3, March 2007, pp.
1489-1502.
ARTICLE IN PRESS
0360-1323/$ - se
doi:10.1016/j.bu
�CorrespondE-mail addr
Building and Environment 42 (2007) 1489–1502
www.elsevier.com/locate/buildenv
Study of the performance of thermoelectric modules for use inactive building envelopes
Xu Xua, Steven Van Dessela,�, Achille Messacb
aSchool of Architecture, Rensselaer Polytechnic Institute, 110 Eighth Street, Troy, NY 12180, USAbMechanical and Aeronautical Eng., Rensselaer Polytechnic Institute, 110 Eighth Street, Troy, NY 12180, USA
Received 21 October 2005; received in revised form 1 December 2005; accepted 7 December 2005
Abstract
Active building envelope (ABE) systems are a new enclosure technology which integrate photovoltaic (PV) and thermoelectric (TE)
technologies. In ABE systems, a PV system supplies electrical power to a TE heat-pump system, which can transfer heat in one direction
or another depending on the direction of the current. Both the TE and PV systems are integrated into one enclosure surface. Hence, ABE
systems have the ability to actively control the flow of heat across their surface when exposed to solar radiation. Applications for this
technology include all types of enclosures that require cooling or heating, such as building enclosures. At this stage of our study, we are
developing various ABE system prototypes by using commercially available PV and TE technologies. In this study, two types of
commercial available TE modules are studied for their potential application in an ABE prototype window system. We have performed
various experiments to determine the coefficient of performance for these TE modules when operating under different voltage regimes,
and have tested different electrical connection diagrams. Based upon the measured data, and results based on the computational models
of a TE system, the most suitable type of TE modules, the voltage and current, and the preferable connection diagrams are discussed.
r 2006 Elsevier Ltd. All rights reserved.
Keywords: Photovoltaic; Thermoelectric; Building envelop; Heat transfer; Building integrated
1. Introduction
Active building envelope (ABE) systems are a newenclosure technology which integrate photovoltaic (PV)and thermoelectric (TE) technologies [1]. In ABE systems,a PV system is used to transfer solar energy directly intoelectrical energy. This electrical energy is subsequently usedto power a TE heat-pump system. Both the TE and PVsystems are integrated into one enclosure surface. Depend-ing on the direction of electrical current applied to the TEsystem, ABE systems can operate in a heating or coolingmode. Hence, ABE systems have the ability to activelycontrol the flow of heat across their surface when exposedto solar radiation. Applications for this technology includeall types of enclosures that require cooling or heating, suchas building enclosures. At this stage of our study, we are
e front matter r 2006 Elsevier Ltd. All rights reserved.
developing various ABE system prototypes by usingcommercially available PV and TE technologies.
1.1. ABE window-system
Fig. 1 depicts a prototype ABE window-system currentlyunder development. In this system, a building integratedPV panel (transparent or opaque) forms the externalenvelope over a window system such that a gap ismaintained between the window and the PV panel. Thisgap acts as an external heat dissipation zone for a TEsystem. The TE component of the ABE system consists of aseries of eight TE modules that are mounted on twoaluminum tubes, placed on both sides of the window. EachTE module is further connected with an external heat sink,as shown in Fig. 1(a). The external heat sink either absorbsor dissipates heat into the air, through natural convec-tion. The aluminum tubes are encapsulated with thermal
COP coefficient of the TE modulecp heat capacity ðJ=kg �CÞG geometric factor (area/length of TE element)
(m)h surface heat exchange coefficients ðW=m2 �CÞI applied current of TE module (A)K Thermal conductance of TE module ðW= �CÞm mass (kg)N number of TE elements in each moduleQ heat flux (W)S Seebeck coefficient of TE module (V/K)R electrical resistance of TE module ðOÞrs thermal resistance of heat sink (�C=W)T temperature (�C)V applied voltage of TE module (V)V s volume of heat sink ðm3Þ
Greek letters
a Seebeck coefficient of each TE element (V/K)di thickness of insulating material (m)k thermal conductivity of each TE element
ðW=m �CÞl thermal conductivity ðW=m �CÞr density ðkg=m3Þ
s resistively of each TE element ðOmÞt time (s)
Subcripts
0 initiala surrounding airc cold side of TE moduleh hot side of TE modulei Insulating materials heat sinkt aluminum tubesw water
X. Xu et al. / Building and Environment 42 (2007) 1489–15021490
insulation material on all sides except for the side facinginwards, and they are filled with a thermal storage mass(water). The Tubes act as a thermal bank for the ABEwindow-system; they slowly absorb or dissipate heattowards the inside of the space enclosed by the window.Note that the ABE window-system can also be operatedwith a stand-alone PV system. This window-system willbe tested in a small outdoor testing room as depicted inFig. 1(b).
1.2. Previous work and current study
In our previous studies we have developed and usedcomputationally inexpensive steady state models to predictthe performance of the TE sub-system. We have alsodeveloped a multi-objective optimization strategy to designa TE unit with heat sink [2]. In other experimental studieson TE modules powered by a PV system, Dai et al. [3] havestudied the relationship between the coefficient of perfor-mance (COP) of a TE refrigerator, and the intensity ofsolar radiation. They derived optimum solar insolationrates to obtain the maximum value of COP. Hara et al. [4]designed a TE cooling headgear prototype powered by asolar cell. Although these two studies also combined TEand PV technologies similar to our research, the proposedsystems are not considered for application in buildings. Anactive thermal wall based on thermoelectricity is furtherproposed by Vazquez et al. [5]. This system aims to reduceor replace conventional air conditioning technologies andis grid powered.
In order to proceed with the full scale testing of the ABEsystem prototype, a more detailed study of the TE sub-system is needed. As ABE systems are used to transfer heatin or out of building enclosures to maintain a comfortableroom temperature, it is important to understand the outputheat of TE modules and their surface temperatures.Furthermore, understanding the responses of a TE systemsubject to various power regimes will aid in the selection ofan appropriate PV system. The purpose of this study wastherefore to experimentally study the performance of theTE system and calculate the heat flux and COP through thecomputational model of the thermoelectric system with itsrelated parts—the heat storage mass and the heat sink.More specifically, we are interested in the TE systemworking under conditions of changing input power sincesolar energy input can change much over various timescales.In addition, most previous theoretical studies on the
performance of TE modules used the assumption of an‘infinite’ heat sink combined with the hot side of the TEmodule. In real applications, the heat sink resistance has animportant effect on the hot side temperature of the TEmodule and the net heat transfer rate from the cold side[6,7]. In this paper, the model of heat sink is included andthe heat sink resistance is analyzed.This paper is organized as follow. The model of the
thermoelectric system with its related parts is describedfollowed by the introduction of the experimental work fortesting the TE sub-system. Next, the results of experimentsare discussed. Our conclusions are given at the end ofpaper.
ARTICLE IN PRESS
Fig. 1. Active building envelope (ABE) system: (a) ABE window-system
structure; (b) testing room with ABE-window system.
X. Xu et al. / Building and Environment 42 (2007) 1489–1502 1491
2. Computational models for the thermoelectric system
This section describes the computational models for thevarious ABE sub-systems, these include: (i) the TE moduleoperating in a cooling mode (ii) the TE module operatingin a heating mode, (iii) the thermal storage material, and(iv) the heat sink component of the TE system. Thesemodels form the basis of coefficient of performance (COP)and heat flux calculations that will be presented in Section4 of this paper.
2.1. TE, cooling mode
Under summer conditions, the TE module will operate ina cooling mode, transferring heat out of the enclosure. Theamount of heat transferred by each module can be
where I is the current; Tc is the cold side temperature; Th isthe hot side temperature; S is the module’s effectiveSeebeck coefficient ðS ¼ 2NaÞ; R is the module’s electricalresistance ðR ¼ 2Ns=GÞ; and K is the module’s thermalconductance ðK ¼ 2NkGÞ. S, R and K are temperature-dependent parameters. N refers to the total number of TEelements used in each module. G is the so called geometricfactor (area/length of TE element). a;s;k are materialproperties for the specific type of TE element.The current going through the TE module is represented
by Eq. (2) [9]:
I ¼V � SðTh � TcÞ
R(Ampere), (2)
where V is the input voltage.The amount of heat transferred at the hot side of the TE
module is given by [9]:
Qh ¼ Qc þ VI (Watt). (3)
The overall coefficient of performance of the TE moduleoperating in a cooling mode is expressed as [8–11]:
COPc ¼Qc
VI. (4)
2.2. TE, heating mode
Under winter conditions, the TE modules will operate ina heating mode, transferring heat into the enclosure. Mostof the equations that govern the performance of a TEmodule operating in a heating mode are the same asthose presented in Section 2.1, except: the coefficient ofperformance is
COPh ¼Qh
VI(5)
based on Eq. (3), COPh is always larger than 1 since Qh isalways larger than VI.
Qh and Qc are further expressed by [9,10]
Qh ¼ SIðTh þ 273:15Þ þ 12I2R� KDT (Watt) (6)
and
Qc ¼ Qh � VI (Watt). (7)
All above Eqs. (1)–(7) are based on assumption that theThomson effect is absent [8,11].
2.3. Thermal mass
In our ABE systems, one side of each TE module isconnected with a thermal mass, consisting of twoaluminum tubes filled with liquid. This thermal mass actsas a heat storage system that can save the heat output ofTE modules and then evenly discharge this energy into theenclosed space, not only during the day but also at night
ARTICLE IN PRESSX. Xu et al. / Building and Environment 42 (2007) 1489–15021492
when there is no sunlight available. In our study we haveused water as the thermal storage material as it isinexpensive and convenient.
The heat transferred from the TE module to the thermalmass (Qw) is important to analyze as it effects the output ofthe TE module. The heat output (Qc in a cooling mode orQh in a heating mode) of the TE module can be calculatedaccording to Sections 2.1 and 2.2 of this paper. When usingan effective heat shink and in the absence of other heatgains or losses between the TE module and the thermalmass, this heat output will be similar to Qw. Based on theconservation of energy for the thermal mass (water), Qw isgiven by [12]:
Qw ¼ cpwmwqTw
qtþ
Ai
ðdi=liÞ þ ð1=hiÞðTw � TaÞ
þ htAtðTw � TaÞ (Watt). ð8Þ
It includes three parts: the heat stored by the water (thefirst term of Eq. (8)), the heat conducted through thethermal insulation material that surrounds the aluminumtubes (the second term) and the heat dissipated throughconvection at the surface of the aluminum tubes facinginwards (the third term).
2.4. Heat sink
When operating in a cooling mode, the heat sink has animportant effect on the performance of a TE module.Several different types of heat sinks exist; the mostcommon types are those that use natural convection,forced convection, or are liquid cooled. In the ABEsystems, forced convection and liquid cooled are notpreferable as such systems require additional componentsto work properly, such as fans. In our study we havetherefore selected a natural convection heat sink. Theamount of heat that can be dissipated by a naturalconvection heat sink is given by [13]
Qs ¼Th � Ta
rs(Watt), (9)
where rs is the thermal resistance of a natural convectionheat sink. For most commercially available convection heatsinks, rs has a value larger than 0:5 �C=W, and oftenexceeds 10 �C=W [13,14]. When the heat sink has a lowresistance path, that is when rs is very small, the amount ofheat transferred by the hot side of each TE module (Qh)can be similar to the amount of heat transferred by the heatsink (Qs), depending on the temperature gradient. How-ever, if the resistance of the heat sink is too large there willbe inefficient heat transfer between the TE module and thesurrounding air, causing part of Qh to flow back to the coldside of the TE module. This will effectively decrease theamount of potential heat transfer (Qc) for each TE module.In a heating mode, rs has no important effect on heattransfer between the TE module and the surrounding air,since the hot side of the TE module will be faced towards
the thermal mass and Qh of the TE module is used for theinward space heating.In our study we have selected a commercially available
natural convection heat sink as recommended by themanufacturer of the TE modules. Since there was someuncertainty with regards to the thermal resistance for thisheat sink, we have used the lumped thermal capacity modelto obtain the value of rs [12]. The Biot number (Bi) is asuitable criterion to determine the applicability of thismethod
Bi ¼hsðV s=AsÞ
lso0:1, (10)
where hs is the coefficient of heat transfer for the heat sink,and ls is the thermal conductivity of the heat sink. ns, As
represent the volume and area of the heat sink, respec-tively. When Eq. (10) is satisfied, the lumped thermalcapacity model can be used to obtain Eq. (11) and the heatsink is assumed to have a uniform inside temperature.
T s � T1
T s0 � T1¼ exp �
hsAs
rscpsV st
� �¼ exp �
1
rsrscpsV st
� �[12],
(11)
where rs, cps are the density and the specific heat of the heatsink respectively, and 1=hsAs can be substituted by rs. T s isthe heat sink temperature; T s0 is T s at the initial time, andT1 can be assumed as being the environmental tempera-ture since the temperature of the heat sink decreases withtime, and will finally approximate the environmentaltemperature. Furthermore, Eq. (11) can be transformedto Eq. (12), which provides the temperature of the heat sinkvarying with time.
T s ¼ ðT s0 � TaÞ exp �1
rsrscpsV st
� �þ Ta
¼ a1 exp �ta2
� �þ a3. ð12Þ
In our experimental study, we have recorded the changein temperature for our heat sink over time as shown inFig. 2, and then used Eq. (12) to correlate the experimentaldata and obtain the values of coefficients a1, a2 and a3. Thevalue of a2 was used to calculate the thermal resistance ofthe natural convection heat sink (rs) according to Eq. (12).From these results, rs was calculated to be 3:06 �C/W underindoor and wind still conditions.
3. Experimental work
In order to better understand the performance ofdifferent TE units, two types of commercial available TEmodules were tested, their properties are listed in Table 1.Both types were purchased from MELCOR Corp.We have performed tests on individual TE modules, and
on eight TE modules. There are three modes to apply inputvoltage: (i) a test run time of 2 h, repeated four times; (ii) atest run time of 7–12 h; and (iii) a test run time of 10 h,
ARTICLE IN PRESSX. Xu et al. / Building and Environment 42 (2007) 1489–1502 1493
changing voltage every 2 h. All three testing modes areseparately tested under 3, 5 and 7V with two modes,cooling and heating at each applied voltage. For eight TEunits, two different electrical connection diagrams werealso tested.
Table 1
Properties of TE modules
TE module Number of elements N Geomet
G � 102
CP1.4-127-045L 127 0.171
PT4-12-40 127 0.076
*At the average temperature of 20 �C.
Fig. 2. The temperature of heat sink decreases with time and the
correlation results.
Fig. 3. Single unit of TE m
3.1. System set-up for testing single unit
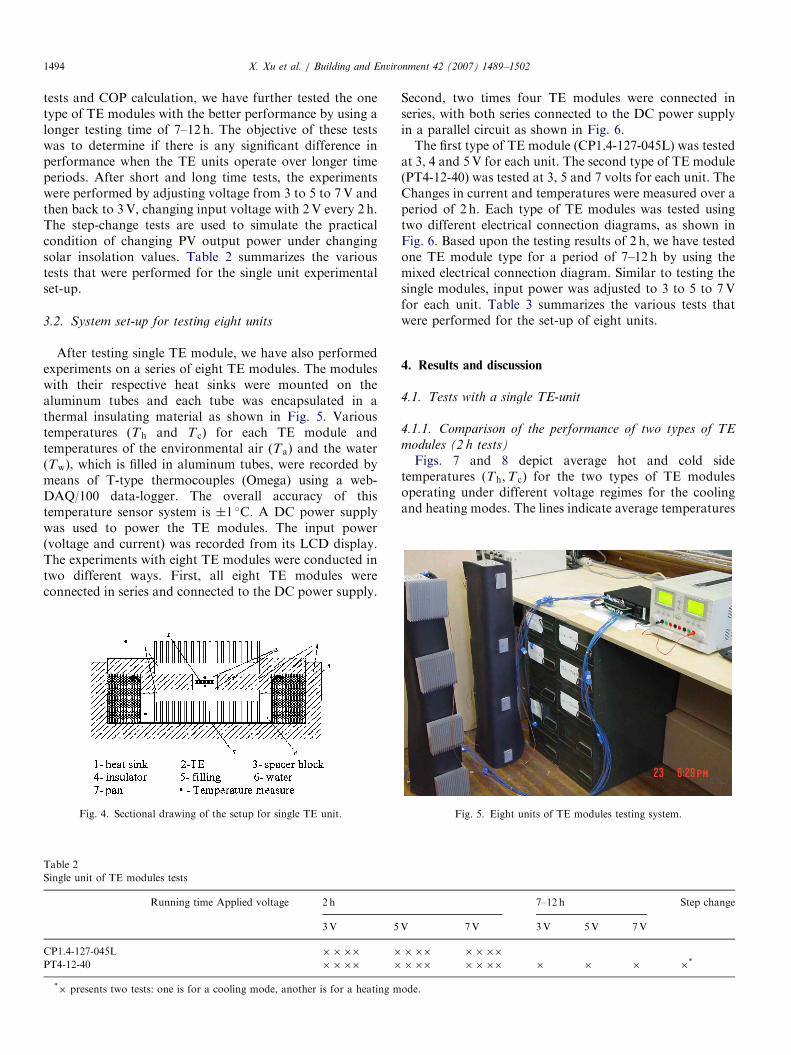
Experiments for single TE module tests have beenperformed using a thermally insulated testing box ofdimensions ð370� 340� 100mm3Þ as shown in Fig. 3. Inthis box, the heat storage mass (water) was filled in a metalpan ð228� 228� 30mm3Þ and foam was placed in thespace between the pan and the wall of the insulator box.The TE module was mounted on the heat sink, which wasplaced in the water. Another heat sink was placed at theopposite side of the TE module, and this heat sink wasexposed to the air. Fig. 4 depicts a sketch of theexperimental set-up, also indicating the various tempera-ture measurement points. Four temperatures (Th, Tc, Tw
and Ta) were recorded by means of thermocouples using aHOBO U12 data logger with temperature sensors. Theaccuracy of this temperature sensor system is �0:25 �C. ADC power supply was used to power the TE module. Theinput power (voltage and current) was recorded from theLCD display of the DC power supply.For single unit tests, each type TE module was tested
separately in a cooling and heating mode at 3, 5 and 7V.The changes in current and temperatures were measuredover a period of 2 h. Each experiment was repeated fourtimes. Based upon temperature measurement, we havecalculated heat flux and COP for the system. According tothe testing values of the two types of TE modules in 2 h
ric factor S * R* K*
(m) (V/K) ðOÞ ðW=�CÞ
0.05 1.50 0.66
0.05 3.38 0.29
odules testing system.
ARTICLE IN PRESSX. Xu et al. / Building and Environment 42 (2007) 1489–15021494
tests and COP calculation, we have further tested the onetype of TE modules with the better performance by using alonger testing time of 7–12 h. The objective of these testswas to determine if there is any significant difference inperformance when the TE units operate over longer timeperiods. After short and long time tests, the experimentswere performed by adjusting voltage from 3 to 5 to 7V andthen back to 3V, changing input voltage with 2V every 2 h.The step-change tests are used to simulate the practicalcondition of changing PV output power under changingsolar insolation values. Table 2 summarizes the varioustests that were performed for the single unit experimentalset-up.
3.2. System set-up for testing eight units
After testing single TE module, we have also performedexperiments on a series of eight TE modules. The moduleswith their respective heat sinks were mounted on thealuminum tubes and each tube was encapsulated in athermal insulating material as shown in Fig. 5. Varioustemperatures (Th and T c) for each TE module andtemperatures of the environmental air (Ta) and the water(Tw), which is filled in aluminum tubes, were recorded bymeans of T-type thermocouples (Omega) using a web-DAQ/100 data-logger. The overall accuracy of thistemperature sensor system is �1 �C. A DC power supplywas used to power the TE modules. The input power(voltage and current) was recorded from its LCD display.The experiments with eight TE modules were conducted intwo different ways. First, all eight TE modules wereconnected in series and connected to the DC power supply.
Fig. 4. Sectional drawing of the setup for single TE unit.
Table 2
Single unit of TE modules tests
Running time Applied voltage 2 h
3V 5
CP1.4-127-045L ���� �
PT4-12-40 ���� �
*� presents two tests: one is for a cooling mode, another is for a heating m
Second, two times four TE modules were connected inseries, with both series connected to the DC power supplyin a parallel circuit as shown in Fig. 6.The first type of TE module (CP1.4-127-045L) was tested
at 3, 4 and 5V for each unit. The second type of TE module(PT4-12-40) was tested at 3, 5 and 7 volts for each unit. TheChanges in current and temperatures were measured over aperiod of 2 h. Each type of TE modules was tested usingtwo different electrical connection diagrams, as shown inFig. 6. Based upon the testing results of 2 h, we have testedone TE module type for a period of 7–12 h by using themixed electrical connection diagram. Similar to testing thesingle modules, input power was adjusted to 3 to 5 to 7Vfor each unit. Table 3 summarizes the various tests thatwere performed for the set-up of eight units.
4. Results and discussion
4.1. Tests with a single TE-unit
4.1.1. Comparison of the performance of two types of TE
modules (2 h tests)
Figs. 7 and 8 depict average hot and cold sidetemperatures (Th;T c) for the two types of TE modulesoperating under different voltage regimes for the coolingand heating modes. The lines indicate average temperatures
Fig. 5. Eight units of TE modules testing system.
7–12 h Step change
V 7V 3V 5V 7V
��� ����
��� ���� � � � �*
ode.
ARTICLE IN PRESSX. Xu et al. / Building and Environment 42 (2007) 1489–1502 1495
for four testing cycles, and the points are the maximum andminimum variance in four cycles. Fig. 9 depicts thetemperatures (T̄h, T̄c and T̄w) at the end of each test,after power was turned off. Fig. 10 presents the currentchange over time under the condition of constant inputvoltage.
The following can be derived from Figs. 7–10:
�
Tab
Eig
Eig
CP
PT
Eig
CP
PT
*
When comparing cooling and heating modes, thetemperature remains more stable after half an hourwhen the TE module are operating in the cooling mode.In the heating mode, the temperature changes rapidly inthe first half hour, and then continues to increase slowly.
� When tested in the cooling mode, if we compare the cold
side temperatures (T c) of the two types of TE modules(shown in Figs. 7(a) and 8(a)), the PT-type module iscapable of maintaining a lower temperature at the coldside compared to the CP-type module. The PT-typemodule has T c near to 15 �C, whereas the CP-typemodule has Tc higher than 20 �C, and T c increases when5 or 7V is applied. The CP-type module cannot coolsufficiently; it will actually start to heat the thermalstorage mass at the cases of 5 and 7V applied as shownin Fig. 9(a), because the cool side temperature becomelarger than the thermal mass temperature under thesetwo cases.
le 3
ht units of TE modules tests
Running time Applied voltage for each unit 2 h
3V
ht units (all eight in series)
1.4-127-045L �
4-12-40 �
ht units (four in series separately and then parallel)
1.4-127-045L �
4-12-40 �
� presents two tests: one is for cooling mode, another is for heating mode
Fig. 6. Two ways of electric connection for eight TE units.
�
.
Fig
sin
When tested in the heating mode (shown in Figs. 7(b)and 8(b)), both types of TE modules are capable to heatthe storage mass and also their heating capabilities are
10 h Step change
4V 5V 7V 3V 5V 7V
� �
� �
� �
� � � � � �*
. 7. Hot and cold side temperatures for CP1.4-127-045L module in
gle TE unit tests: (a) cooling mode; (b) heating mode.
ARTICLE IN PRESS
Fig. 8. Hot and cold side temperature for PT4-12-40 module in single TE
unit tests: (a) cooling mode; (b) heating mode.Fig. 9. Ending temperatures (T̄h,T̄c and T̄w) in single TE unit tests: (a)
CP1.4-127-045L module; (b) PT4-12-40 module.
X. Xu et al. / Building and Environment 42 (2007) 1489–15021496
equivalent, since their T̄h and T̄w are both close to 50and 40 �C, respectively at 7V, and to 40 and 35 �C at 5Vas shown in Fig. 9.
� From Figs. 7 and 8, respectively, a change in supply voltage
has a larger effect on Th than on Tc. In other words, T c
shows no large difference when the voltage is changed, butTh increases much when changing voltage from 3 to 7V.
� It can be derived from Fig. 10 that the current is always
larger in a heating mode than in a cooling mode, andthat current will increase with increasing voltage. ThePT-type module requires less current than the CP-typemodule, when they are applied the same voltage in thesame operating mode.
� The temperature variance for four testing cycles is
0.5–2 �C, with the largest relative change being 5%under the same condition (the same voltage and type).So the reliability of Tc and Th can be accepted.
Based upon the above testing results, we have calculatedthe thermal heat flux and COP for single TE module for the
various test regimes, according to Eqs. (1)–(9). Theseresults are summarized in Table 4.The following can be derived from the results in Table 4:
�
The performance of the PT-type module is better than theperformance of the CP-type module, when the TEmodules operate in a cooling mode. The PT-type modulecan transfer more heat (Qw) from the heat storage mass(water), and has a larger COP. While, the performance ofboth types of TE modules is good for heating the storagemass (Qw), the PT-type module is slightly better becauseof the larger COP. Generally, the PT-type modulerequires less input power, while obtaining a higher COP. � In both modes, COPc and COPh are decreased when the
applied voltage increases from 3 to 7V.
ARTICLE IN PRESS
Fig. 10. The current I varies with time for single TE unit tests: (a) CP1.4-
127-045L module; (b) PT4-12-40 module.
Table 4
Thermal heat flux and COP in single TE unit tests
Qc (W) Qh (W) VI (W) COP Qw (W) Qs (W)
Cooling mode
3V CP1.4-127-045L 2.5 4.6 2.1 1.21 �0.2* 3.6
PT4-12-40 2.3 3.9 1.6 1.42 �2.2 4.7
5V CP1.4-127-045L 6.4 13.3 6.9 0.93 1.7 7.4
PT4-12-40 3.6 8.1 4.5 0.80 �2.9 7.9
7V CP1.4-127-045L 4.4 15.8 11.4 0.38 4.2 11.3
PT4-12-40 4.2 12.5 8.3 0.51 �2.7 11.2
Heating mode
3V CP1.4-127-045L 2.5 4.8 2.3 2.10 3.4 �1.5**
PT4-12-40 2.5 4.3 1.8 2.37 4.4 �3.4
5V CP1.4-127-045L 3.3 10.6 7.3 1.46 8.7 �1.5
PT4-12-40 3.3 8.2 4.9 1.67 9.4 �4.2
7V CP1.4-127-045L 0.8 13.8 13.0 1.06 16.3 �0.3
PT4-12-40 3.4 12.6 9.2 1.36 16.1 �4.2
*Based on the calculation of Eq. (8) that means the heat transferred from the thermal mass to TE modules.**Based on the calculation of Eq. (9) that means the heat transferred from environment to heat sink.
Fig. 11. Th, Tc and Tw for PT-type modules in a cooling mode of the long
time running: (a) Th and Tc; (b) Tc and Tw.
X. Xu et al. / Building and Environment 42 (2007) 1489–1502 1497
ARTICLE IN PRESSX. Xu et al. / Building and Environment 42 (2007) 1489–15021498
�
Fig
tim
In a cooling mode, the heat transfer (Qc) based on Eq. (1)is larger than that (Qw) based on Eq. (8). This is likelybecause the heat flux from the hot side to the cold sidethrough the insulation material is not considered in thecomputational model of the TE system (Eqs. (1)–(7)).
� Especially, Qw is the positive value when the CP-type
module was applied under 5 and 7V in a cooling mode,which means the TE modules heating the thermal mass.Those results are also shown the temperature compar-ison in Fig. 9(a).
�
Fig. 13. Currents for PT-type modules in both modes of the long time
running.
In a cooling mode Qs is always smaller than Qh, whichindicates that the heat sink is not able to effectivelydissipate the hot side heat, causing heat flow from thehot side back to the cold side.
4.1.2. Long time tests for the PT4-12-40 type TE module
Figs. 11 and 12 depict the hot and cold side temperaturesof TE modules (Tc;Th), and the temperature of the storagemass (water, Tw) under the long time tests (7–12 h) for thePT-type TE module. Fig. 13 depicts the change in currentover time.
From Figs. 11 and 12 it can be derived that T c can moreor less remain constant over a period of 12 hours, when themodules are operated in a cooling mode. When operatingin a heating mode however, Th keeps increasing and doesnot remain stable even after 7 h. When comparing thedifferent voltage regimes, 5V appears to be the bestoperating voltage for the long runtime since it results in thelowest T c and a moderate Th. Also the same results can beobtained from the short time running as shown in Fig. 9(b).
4.1.3. Change step tests for the PT4-12-40 type module
Fig. 14 depicts the performance of the PT-type moduleunder the step-change voltage regime, for both cooling andheating modes. All the measurement values for Th, T c, Tw,are presented.
. 12. Th, Tc and Tw for PT-type modules in a heating mode of the long
e running.
Fig. 14. Th, Tc, Tw and I for PT-type modules in step change tests: (a)
cooling mode; (b) heating mode.
ARTICLE IN PRESSX. Xu et al. / Building and Environment 42 (2007) 1489–1502 1499
According to Fig. 14, the changes in voltage input causea different current pattern between the increasing step(voltage from low to high) and the decreasing step (voltagefrom high to low). When voltage increases, the current firstincreases rapidly to a high point and then drops a little overa period of half an hour. Contrarily, when voltagedecreases, the current decreases rapidly to a low point,and then rises a little over a period of half an hour. Thestep change of voltage has not much effect on Tc in acooling mode, but Th changes much in a heating mode.
4.2. Tests with eight TE units
The previous sections mainly provided test results on theperformance of single unit of TE modules operatingseparately. In the following sections, the characteristics ofeight units working together are provided.
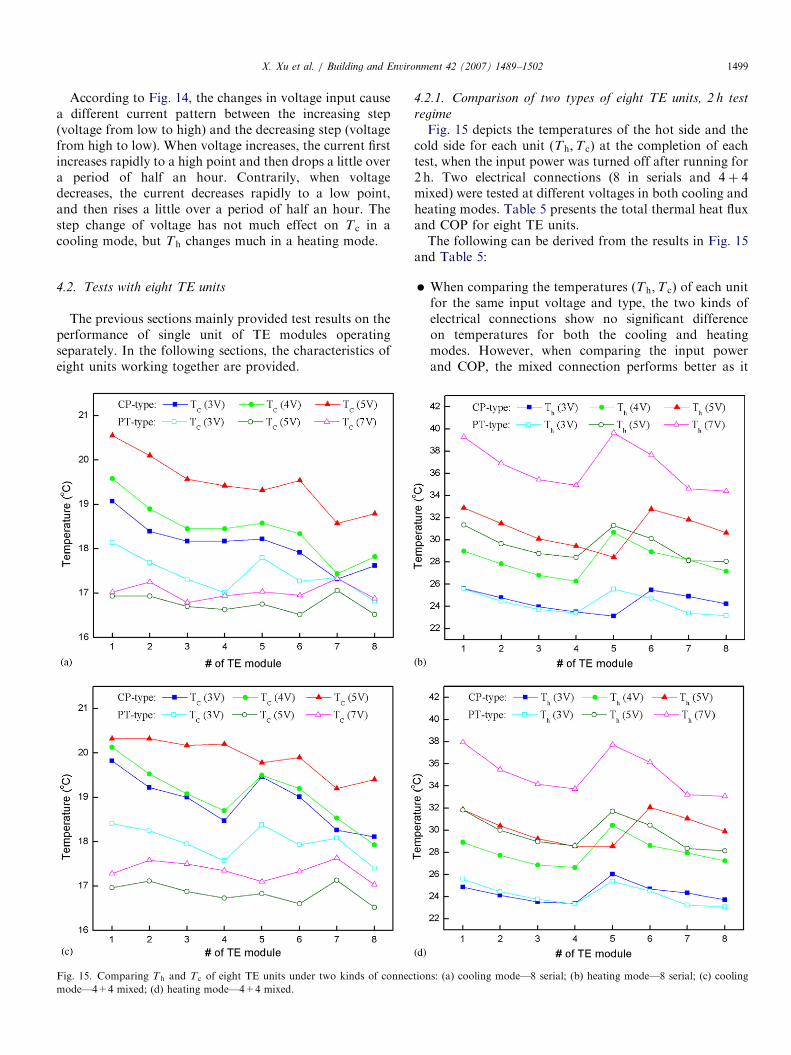
Fig. 15. Comparing Th and Tc of eight TE units under two kinds of connec
mode—4+4 mixed; (d) heating mode—4+4 mixed.
4.2.1. Comparison of two types of eight TE units, 2 h test
regime
Fig. 15 depicts the temperatures of the hot side and thecold side for each unit (Th;Tc) at the completion of eachtest, when the input power was turned off after running for2 h. Two electrical connections (8 in serials and 4þ 4mixed) were tested at different voltages in both cooling andheating modes. Table 5 presents the total thermal heat fluxand COP for eight TE units.The following can be derived from the results in Fig. 15
and Table 5:
�
tion
When comparing the temperatures (Th;T c) of each unitfor the same input voltage and type, the two kinds ofelectrical connections show no significant differenceon temperatures for both the cooling and heatingmodes. However, when comparing the input powerand COP, the mixed connection performs better as it
*Based on the calculation of Eq. (8) that means the heat transferred from the thermal mass to TE modules.
X. Xu et al. / Building and Environment 42 (2007) 1489–15021500
requires a lower input power, and accomplishes a higherCOP.
� Similar to the results of the single unit tests, the PT-type
module performs better and 5V is a better operatingvoltage compared to 3 and 7V as it can accomplish thelowest cold side temperature.
� Different temperatures were observed for the various
units operating under the same conditions. The largesttemperature difference for individual units is 2 �C for acooling mode, and 4 �C for a heating mode (Fig. 15). Wespeculate that these differences are caused by incon-sistencies in the heat sink assembly process.
4.2.2. Long time tests for 8-unit assembly of the PT4-12-40
type of module
Fig. 16 depicts the hot and cold side temperatures(Th;T c) of 8-unit assembly of the PT4-12-40 type ofmodule and the thermal mass temperature (water, Tw), fora testing time of 7–12 h by the mixed electrical connection.In Fig. 16, the lines indicate the average temperatures ofeight units, and the points are the maximum and minimumtemperatures in these eight units.
Fig. 16 indicates that the cold side temperatures keepdecreasing in a cooling mode and that the hot sidetemperatures keep increasing in a heating mode in a longtime tests. Compared to the 2 h testing regimes, there is nolarge difference between the temperatures of the individualunits.
In the long time tests for a cooling mode, the lowest coldside temperature (Tc) is obtained under the applied voltageof 7V. In the first 2 h, there is no large difference in T c
when the TE units operate under 5 or 7V. These results are
similar as the single unit tests (Fig. 15), however, after 3 h,Tc becomes lower under 7 than 5V.
4.2.3. Change-step tests for 8-unit assembly of the PT4-12-
40 type of TE-modules
Fig. 17 depicts the temperature response over time foreight units of the PT-type module that were tested underthe change-step voltage. In Fig. 17, the lines indicate theaverage temperatures of eight units, and the points are themaximum and minimum temperatures in these eight units.When comparing Figs. 14 and 17, the performance of
eight units under the change-step voltage is similar to thesingle unit, except the hot side temperature is lower.
4.3. Practical issues when coupling the TE system with a PV
system
From above the experiments, the COP for the TE units ishighest when each unit operates at 5V (for PT-type). Thisindicates that eight TE units require approximately 40 W ofinput power to keep the cool side temperature at 15 �C(cooling regime), and 45W to keep the hot side tempera-ture at 30 �C or higher (heating regime). In the presentexperiments, the TE system is powered by a DC power-supply, this power supply will be replaced by a PV panelsystem in further studies. The output power of the PVsystem should approximate 40 to 45W, or near 1.1 kWh, inorder to allow the TE system to work sufficiently over aperiod of one day, or 24 h. As ABE systems rely on solarenergy, it is indispensable to have a means of energystorage available when no solar energy is available. Thereare two practical means to store energy. The first storage
ARTICLE IN PRESS
Fig. 17. Th, Tc, Tw and I for change step tests in the mixed connection:
(a) cooling mode; (b) heating mode.
Fig. 16. Th, Tc and Tw for long time tests in the mixed connection: (a)
cooling mode; (b) heating mode.
X. Xu et al. / Building and Environment 42 (2007) 1489–1502 1501
strategy involves the storage of electrical energy by usingbatteries, which are loaded by a PV system. The secondstorage strategy involves the storage of thermal energy.
Alternatively, when batteries are used, the power outputof a PV system can be used more evenly over time.Therefore, the general output power analysis is more or lessindependent of time, and only affected by the total solarradiation and panel size. For example, the average solarradiation for NY state over a period of one year is about4:3 kWh=ðm2-dayÞ [15], and a typical crystalline silicon PVpanel has an efficiency of approximately 18% [16].Consequently, the total output power of the PV systemwill approximate 0:8 kWh=m2 for each day. In order tosatisfy the energy demand for the TE system, the total areafor the PV panels should therefore be at least 1:4m2. In thisscenario, the TE units can be powered evenly over time,and their performance is similar to the above experimentalresults. As an alternative to batteries, a feedback connec-
tion into the power grid can provide an alternative meansof storing electrical energy.For ABE systems without batteries, there are two
practical scenarios to be considered. First, at summer time,the ABE system will function in a cooling mode and the TEpeak-load will occur around noon when most cooling isneeded. During the night, the cooling load is reducedsignificantly due to the absence of the sun. Hence, for asummer scenario, there is a good match between energysupply and demand over a period of one full day. Duringthe winter, the ABE system will function in a heating modeand the TE system might require power both day andnight. Here, the use of a thermal buffer system can offer asolution. In our prototype ABE system we have incorpo-rated a thermal bank (two aluminum tubes filled withwater) to more evenly release thermal energy over time.Depending on desired comfort levels and location, moredetailed studies will be required to optimize the storagecapacity of the thermal storage system, and its relationshipto other ABE system parameters.
ARTICLE IN PRESSX. Xu et al. / Building and Environment 42 (2007) 1489–15021502
5. Conclusion
In order to assist in the design of a prototype ABEwindow system, we have presented experimental results forthe thermal performance of a TE system. TE modules weretested as single TE-units, and in an assembly of eight TE-units. Two types of commercial available TE modules weretested in these systems. In the experiments involving eightTE-units, the performance of two kinds of electricalconnections was compared. It was found that a mixedconnection of two times four TE modules connected inseries, and then both series connected in parallel, is betterthan all eight units connected in series. The mixedconnection scheme allows for a higher COP.
A change-step voltage regime was used to simulate thepractical condition of changing PV output power. It wasfound that changing the input power has little effect on T c
(less than 2 �C in a cooling mode), but has a large effect onTh with a 5 to 10 �C difference with each step.
Based on the single unit tests for 2 h repeated four times,the reliability of temperature changes of TE modules iswithin 5% under similar conditions. Also, from the eightunit tests for 2 h, the difference of individual units is about10%. We have used a cooling and heating mode,simulating summer and winter operating conditions.
When operating in a heating mode, the TE modules arecapable to satisfy the requirements for heating theexperimental enclosure. Both types of TE modules aresuitable for any of the applied voltage regimes of 3, 5, or7V. In the long time tests, the hot side temperature Th canbe near to 60 �C at environmental temperature of about20 �C, which is sufficiently high for space heating whilepreventing module damage due to over-heating.
When operating in a cooling mode, the TE modulesrequire more careful selection. Of the two types of TEmodules tested in this study, the PT4-12-40 type module isbetter for use in the ABE system. The operatingtemperatures, heat flux, and COP, both in the single unittests and the eight unit tests, were best for the PT typemodule. In most tests, 5V is the better operating voltagecompared to 3 and 7V for each unit as this voltage resultsin the lowest cold side temperature Tc and the largestamount of heat absorbed by the storage mass (water).Except in the long-time tests for eight units, 7V was thebetter voltage.
In the long time tests, the cold side temperature T c canremain stable after half an hour of operation and be closeto 15 �C at environmental temperature of 20 �C. This
temperature difference might be not sufficient to satisfycooling requirements under summer conditions. For ourprototype ABE window system, increasing the heat sink’sability to dissipate heat will help the TE modules to workbetter in the summer.
Acknowledgements
Support from the National Science Foundation, awardnumber CMS-0333568, Directorate for Engineering, Divi-sion of Civil and Mechanical Systems, and the USDepartment for Housing and Urban Development is muchappreciated.
References
[1] Van Dessel S, Messac A. Environmental benefits of active building
envelopes technology. Proceedings of the Asia renewable energy
conference, Beijing, China, April 7–9; 2004.
[2] Khire RA, Messac A, Van Dessel S. Design of a thermoelectric heat
pump system for active building envelope systems. International
Journal of Heat and Mass Transfer 2005;48(19–20):4028–40.
[3] Dai YJ, Wang RZ, Ni L. Experimental investigation and analysis on
a thermoelectric refrigerator driven by solar cells. Solar Energy
Materials & Solar Cells 2003;77(4):377–91.
[4] Hara T, Azuma H, Shimizu H, Obora H, Sato S. Cooling
performance of solar cell driven, thermoelectric cooling prototype