87
Study on Air Quality Jakarta, Indonesia Future Trends, Health Impacts, Economic Value and Policy Options

Study onAir Quality
Jakarta, Indonesia
Future Trends, Health Impacts,Economic Value and Policy Options

Study on Air Quality in Jakarta, Indonesia Future Trends, Health Impacts, Economic Value
and Policy Options
Prepared by
Shanty Syahril
Budy P. Resosudarmo*
Haryo Satriyo Tomo
September 2002
* Lucentezza Napitupulu is B. Resosudarmo’s research assistant for this work.

STUDY ON AIR QUALITY IN JAKARTA, INDONESIA
ii
Contents Abbreviations iv CHAPTER 1 INTRODUCTION 1
Background 1 Objectives of the Study 1 Boundaries and Methodology 2 Outline of the Report 3
CHAPTER 2 BACKGROUND INFORMATION 5
General Description of Jakarta 5 Overview of the Scope and Methodology of Previous Air Quality Assessments Studies 7 Overview of the Findings of Previous Air Quality Assessments 10
CHAPTER 3 AIR QUALITY MONITORING 13
Air Quality Monitoring Network 13 Ambient Air Quality Standards 16 Air Quality Monitoring Results 16 Evaluation of Air Quality Monitoring Results 18
CHAPTER 4 AIR POLLUTION ASSESSMENT 21
Grid System 21 Emission Load Estimation 21 Ambient Air Quality Simulation 27 Spatial Distribution of Emission Load and Ambient Air Quality 31 Control Targets for Vehicular Emissions Reduction 35
CHAPTER 5 ANALYSIS OF HEALTH AND ECONOMIC IMPACTS 36
Estimation Outline 36 Estimated Health and Economic Impacts in 1998 37 Estimated Health and Economic Impacts in 2015 37
CHAPTER 6 ESTIMATED IMPACT OF THE PROPOSED ACTION PLAN 44
Direct Interventions to Reduce Vehicle Emissions 44 Impacts of the Combined Countermeasures on Air Pollution Levels 47 Health and Economic Impacts of the Countermeasures 47

STUDY ON AIR QUALITY IN JAKARTA, INDONESIA
iii
CHAPTER 7 CONCLUSIONS AND RECOMMENDATIONS 50
Conclusions 50 Recommendations 51
REFERENCES 54 APPENDIX 1 56 Appendix 1.1. Data Requirements and Sources 56 APPENDIX 2 57 Appendix 2.1. Population of Jakarta by District in 1998 57 Appendix 2.2. Comparison between the URBAIR and IAQM Studies 58 APPENDIX 3 59 Appendix 3.1. BMG Air Quality Monitoring Activities 59 Appendix 3.2. Allocation of Ambient Air Quality Monitoring Stations 60 Appendix 3.3. PSI Index* 60 APPENDIX 4 61 Appendix 4.1. Methodology to Estimate Emission Load 61 Appendix 4.2. Dispersion Model 70 APPENDIX 5 73 Appendix 5.1. Methodology to Estimate Health Impacts 73 Appendix 5.2. Air Pollution and Population for 1998 77 Appendix 5.3. Air Pollution and Population for 2015 79 Appendix 5.4. Methodology to Estimate the Economic Value 80 APPENDIX 6 82 Appendix 6.1. Estimated Distribution of Vehicle Technology for Each Vehicle Group 82

STUDY ON AIR QUALITY IN JAKARTA, INDONESIA
iv
Abbreviations AAQS Ambient Air Quality Standards ADB Asian Development Bank AQMS Online ambient air quality monitoring network in Indonesia Bapedal Environmental Impact Management Agency BMG Bureau of Meteorology and Geophysics BPLHD-DKI Jakarta Local Environmental Management Agency BPPT Agency for Assessment and Implementation Technology CNG Compressed natural gas CO Carbon monoxide Ditlantas Polri State Police of Indonesia DKI Jakarta Jakarta City Government DLLAJ Traffic & Transport Office IAQM Study on the Integrated Air Quality Management (Bapedal and JICA,
1997A and 1997B) IDR Indonesia Rupiah ITB Institute of Technology, Bandung IVERS Integrated Vehicle Emission Reduction Strategy JICA Japan International Cooperation Agency KILDER Dispersion model as the air quality management strategy tool in the UR-
BAIR LPG Liquefied Petroleum Gas MBM Multi Box Model MEB Mitra Emisi Bersih, the Multisectoral Action Plan Group MoE Ministry of Environment MoH Ministry of Health NKLD-DKI Jakarta Local Environment Balance Reports NMHC Non-methyl hydrocarbon NO Nitrogen monoxide NO2 Nitrogen dioxide NOx Nitrogen oxides O3 Ozone OD Origin-Destination Pb Lead PM10 Fine Particle Less than 10 micrometers in Diameter PSI Pollutant Standard Index RC Regional Center RETA 5937 Regional Technical Assistance Project to Reduce Vehicle Emissions (ADB) RGDP Regional Gross Domestic Product SO2 Sulfur dioxide SURASH Dispersion model as the air quality management strategy tool in the IAQM THC Total Hydrocarbon TSP Total Suspended Particulates URBAIR Study on the Urban Air Quality Management Strategy (World Bank, 1997) USD US Dollar US-EPA United States Environmental Protection Agency WHO World Health Organization

CHAPTER 1
Introduction
Background Asian Development Bank (ADB) approved a Regional Technical Assistance Project (RETA-5937) to assist member countries in the development of strategies and plans to reduce ve-hicle emissions. RETA activities in Indonesia supported the formulation of an Integrated Vehicle Emission Reduction Action Plan for Jakarta. As part of the RETA-5937, an Integrated Vehicle Emission Reduction Strategy (IVERS) workshop was organized in October 2001 to ensure broad-based involvement of all stake-holders in drafting the Action Plan. An IVERS Workshop was a milestone in the formation of a Multisectoral Action Plan Group (MAPG) titled Mitra Emisi Bersih (MEB, the partnership for clean emissions). The MEB Forum’s main objective is to use a participatory and process approach to formulate and subsequently implement the Action Plan. The proposed Action Plan report was prepared by the MEB forum and discussed during the Concluding Work-shop of RETA-5937 in Manila (28 February–1 March 2002). An assessment of Jakarta's air quality was conducted as part of RETA-5937 from 24 Sep-tember 2001–24 March 2002. The purpose was to provide decision-makers with sound in-formation on air pollution levels in Jakarta, and an indication of the impact on pollution lev-els in different areas of Jakarta that will result from the application of various countermea-sures.
Objectives of the Study The objective of this study is to assess Jakarta's air quality. This comprised an assessment of Jakarta's air pollution levels and the health and economic impact of those air pollution levels. The principal tasks undertaken to assess the air pollution levels were:
a collection and review of all available data with respect to air pollution levels in Ja-karta;
a review of past efforts to compose a detailed emissions inventory for mobile pollu-tion sources in Jakarta;
the development of a simple model to assess the current contribution of mobile pollu-tion sources to overall pollution levels in various parts of Jakarta;
a prediction of future pollution loads caused by mobile pollution sources in various parts of Jakarta, based on simple scenario planning (variables included the number and types of vehicles, fuel standards, etc.);
an estimation of the relative impact on pollution levels in various parts of Jakarta of possible changes in fuel specifications and type, strengthening of new and in-use ve-hicle emissions standards, improvements in the inspection and maintenance system, and improvements in traffic flow due to better traffic management.
The principal tasks undertaken to assess the health and economic impacts were:

STUDY ON AIR QUALITY IN JAKARTA, INDONESIA
2
a collection, review and summary of earlier studies which attempted to assess the health impact of mobile source air pollution as well as the economic impact;
the development of a methodology to assess present health and economic impacts and one which can also be used to forecast future health and economic impacts based on simple scenario planning. Such a methodology should take into account available information from past studies as well as currently available information on air pollution levels;
the application of the designed methodology to calculate current and future health and economic impacts.
Boundaries and Methodology
STUDY BOUNDARIES Study boundaries include the geographical area, targeted pollutants, time frame, data sources and proposed countermeasures.
Study Area The study area focuses on the area which comprises the Special District of the capital city Jakarta, known as Daerah Khusus Ibukota Jakarta (DKI Jakarta). Jakarta is used through-out this report as terminology for the study area of DKI Jakarta.
Targeted Pollutants The targeted pollutants in the study are nitrogen oxides (NOx), sulfur dioxide (SO2), fine particles less than 10 µm in diameter (PM10), carbon monoxide (CO), and total hydrocar-bons (THC) from vehicle sources. However, the contribution of industrial and domestic sources is also estimated in order to evaluate the contribution of vehicle source emissions to overall pollution. Pollutant emissions from other mobile sources such as ships and air-craft – which attributed approximately 2% of total emissions load in 1995 (JICA and Bapedal, 1997A) -- and other sources (i.e. open burning and natural sources) are not esti-mated in this study.
Data Sources Efforts focused on collecting all previous studies and reliable secondary data on air pollu-tion levels in Jakarta for the period of 1994 to the latest year available (Appendix 1.1). The following are comprehensive studies that focused solely on Jakarta’s air pollution situation and formed part of this study’s background:
Urban Air Quality Management Strategy in Asia, Jakarta Report (World Bank, 1997). This study is henceforth referred to as URBAIR, and
The Study on the Integrated Air Quality Management for Jakarta Metropolitan Area (JICA and Bapedal, 1997A), referred to as IAQM.
Time Frame The study’s time frame was set as follows
The vehicle emission loads without countermeasures or baseline cases were esti-mated for year 1998 and predicted for both the short/medium term (year 2005) and long term (year 2015). The vehicle emission loads with countermeasures were pre-dicted for both the short/medium term (year 2005) and long term (year 2015).
The air pollution levels for baseline cases were simulated for years 1998 and 2015. The air pollution levels with countermeasures were simulated for year 2015.
The health and economic impacts of air pollution were estimated based on the re-sults of simulation as in point (ii) above.

STUDY ON AIR QUALITY IN JAKARTA, INDONESIA
3
Proposed Countermeasures A list of countermeasures that related to fuel specifications and type, emissions standards and vehicle technology, inspection and maintenance, and transport planning was derived from information formulated by the MEB Forum.
METHODOLOGY A flowchart of study methodology (Figure 1.1) shows the steps conducted in this study.
Outline of the Report The Introduction chapter presents background information to the research. It includes the study background, objectives, boundaries and methodology. The second chapter briefly describes the general pollution situation in Jakarta. It also re-views previous air quality assessment studies to indicate past efforts to assess Jakarta’s air pollution levels, and related health and economic impacts. The third chapter provides comprehensive information on air quality monitoring, which in-cludes descriptions of air quality monitoring networks, the ambient air quality standard, the results of air quality monitoring, and evaluation of the results. The fourth chapter is a core chapter in revealing Jakarta's air pollution level. It outlines the results of the emissions inventory, as well as the air dispersion simulation. The fifth chapter reveals the estimated health and economic impacts of air pollution based on the air pollution information provided in the fourth chapter of this report. The estimated impacts of the proposed action plan on the emission load, and the health and economic aspects, are presented in the sixth chapter of this report. Finally, the last chapter presents study conclusions and recommendations.

Figure 1.1 Flowchart of Study Methodology
AAQ Data Analyze AAQData
MeteorologicalData
DetermineMeteorological
Mechanism
EmissionSource
Inventory
EstimateCurrent
Emission Load
Develop MultiBox Model
CalculateCurrent AAQ
Validate MultiBox Model
Predict FutureEmission Loadw/o Measures
Action PlanFormulation
by MEBSimulate
Future AAQw/ Measures
SimulateFuture AAQ
w/o Measures
Predict FutureEmission Loadw/ Measures
Identify Actionwith Direct
Impact
DevelopEconomic CostValuation Model
Develop HealthImpact Model
Estimate HealthImpact of Future
AAQ w/ Measures
Socio-Economic
DataFuture
Framework
DevelopEmission Model
Estimate HealthImpact of Future
AAQ w/o Measures
EstimateHealth Impact of
Current AAQ
Valuate Economiccost of Current
AAQ
Valuate Economiccost of Future AAQ
w/ Measures
Valuate EconomicCost of Future
AAQ w/o Measures
Health CostSurvey
Previous HealthImpact Study

CHAPTER 2
Background Information
This chapter provides background information to the study via a general description of Ja-karta and an overview of previous air quality assessments. The overviews are presented in chronological order and broadly divided into two sections: (i) the scope and methodology of previous air quality assessments and (ii) the findings with respect to vehicle contributions to air pollution. The issues related to ambient air quality monitoring are addressed separately in Chapter 3. The lessons learned are outlined in this chapter and were very important in developing the study’s methodology.
General Description of Jakarta
PHYSICAL DESCRIPTION DKI Jakarta is situated on the northern coast of Java Island near the mouth of the Ciliwung River, at approximately 6o12’ South and 106o48’ East (BPS, 2000). According to Governor’s Decree No. 1227 (1989), DKI Jakarta comprises of 661.52 km2 land area and 6,977.5 km2 sea area, and includes more than 110 islands in the Thousand Islands Archipelago. As mentioned in Subsection C.1, the study area focused on the mainland of DKI Jakarta as shown in Figure 2.1. Along the coast, which extends approximately 35 km from west to east, the landscape is very flat with a mean elevation of seven meters above sea level (BPS, 2000). The southern area undulates slightly with a ground elevation of approximately 50 meters above sea level. Further south in Bogor, which is outside Jakarta, the mountains reach up to 3,000 meters. There are no natural topographical barriers near Jakarta. Jakarta’s climate is generally tropical. Daytime temperatures vary and the annual average temperature was around 27.1oC in 2000. Also in 2000, the average rainfall was 1,896.8 mm, the average humidity was 78.1%, and the average wind velocity was 3.5 m/s (BPS, 2000)
SOCIO-ECONOMIC DEVELOPMENT Before the 1997 Asian economic crisis, Jakarta’s annual regional gross domestic product (RGDP) growth rate for the preceding five years was in approximately 9%. In 1997 the an-nual RGDP growth rate dropped to approximately 5% and the 1998 rate was -18%. In 1999, the annual RGDP growth rate was -1%, but in 2000 Jakarta managed a positive RGDP as high as 4%. This study assumed that Jakarta’s annual RGDP growth rate would slowly increase and return to the pre-crisis condition of 2006, which was approximately 9%. After that time, it is assumed that its RGDP annual growth rate will remain stable at ap-proximately 9%.

Figure 2.1 Map of Jakarta
STUDY ON AIR QUALITY IN JAKARTA, INDONESIA
7
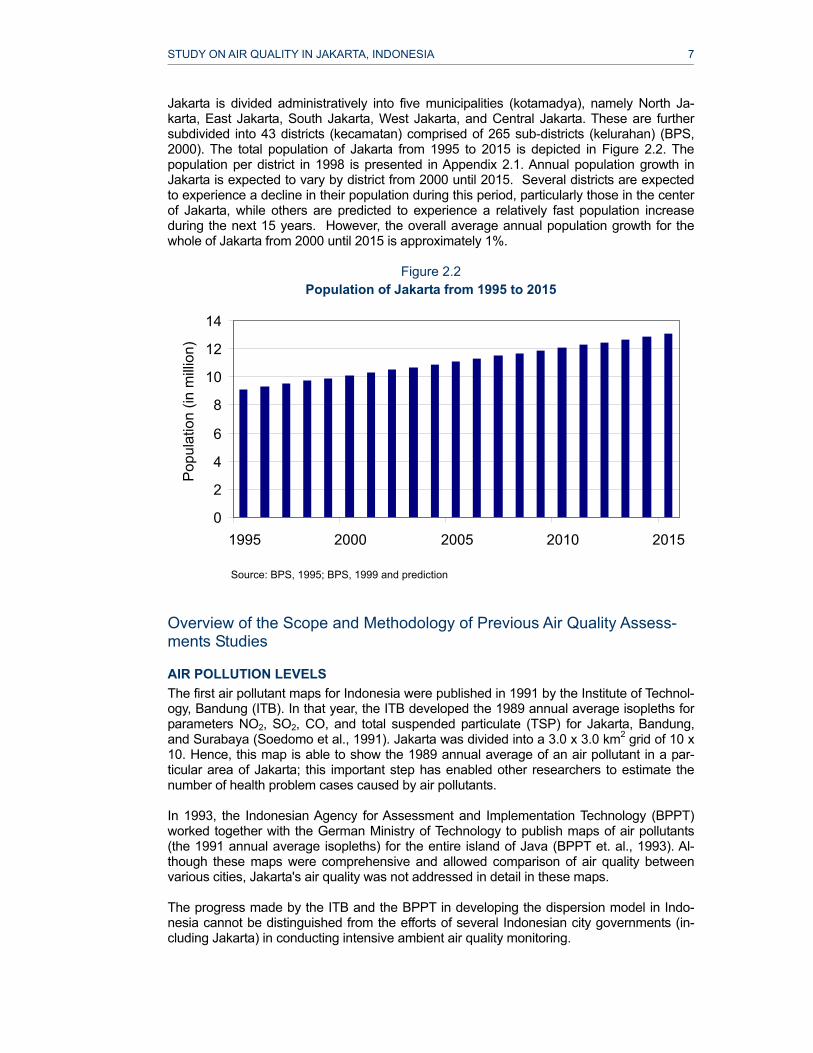
Jakarta is divided administratively into five municipalities (kotamadya), namely North Ja-karta, East Jakarta, South Jakarta, West Jakarta, and Central Jakarta. These are further subdivided into 43 districts (kecamatan) comprised of 265 sub-districts (kelurahan) (BPS, 2000). The total population of Jakarta from 1995 to 2015 is depicted in Figure 2.2. The population per district in 1998 is presented in Appendix 2.1. Annual population growth in Jakarta is expected to vary by district from 2000 until 2015. Several districts are expected to experience a decline in their population during this period, particularly those in the center of Jakarta, while others are predicted to experience a relatively fast population increase during the next 15 years. However, the overall average annual population growth for the whole of Jakarta from 2000 until 2015 is approximately 1%.
Figure 2.2 Population of Jakarta from 1995 to 2015
Source: BPS, 1995; BPS, 1999 and prediction
Overview of the Scope and Methodology of Previous Air Quality Assess-ments Studies
AIR POLLUTION LEVELS The first air pollutant maps for Indonesia were published in 1991 by the Institute of Technol-ogy, Bandung (ITB). In that year, the ITB developed the 1989 annual average isopleths for parameters NO2, SO2, CO, and total suspended particulate (TSP) for Jakarta, Bandung, and Surabaya (Soedomo et al., 1991). Jakarta was divided into a 3.0 x 3.0 km2 grid of 10 x 10. Hence, this map is able to show the 1989 annual average of an air pollutant in a par-ticular area of Jakarta; this important step has enabled other researchers to estimate the number of health problem cases caused by air pollutants. In 1993, the Indonesian Agency for Assessment and Implementation Technology (BPPT) worked together with the German Ministry of Technology to publish maps of air pollutants (the 1991 annual average isopleths) for the entire island of Java (BPPT et. al., 1993). Al-though these maps were comprehensive and allowed comparison of air quality between various cities, Jakarta's air quality was not addressed in detail in these maps. The progress made by the ITB and the BPPT in developing the dispersion model in Indo-nesia cannot be distinguished from the efforts of several Indonesian city governments (in-cluding Jakarta) in conducting intensive ambient air quality monitoring.
0
2
4
6
8
10
12
14
1995 2000 2005 2010 2015
Pop
ulat
ion
(in m
illio
n)

STUDY ON AIR QUALITY IN JAKARTA, INDONESIA
8
In 1992, the URBAIR built another map of air pollutants for Jakarta. This time Jakarta was divided into a 1.5 x 1.5 km2 grid of 20 x 20, so that these maps were more detailed than the ones produced in 1991. However, the URBAIR developed only the 1992 annual average isopleth for parameters NO2 and TSP. In 1995, JICA and Bapedal cooperated to conduct the IAQM study that also developed an air pollutants map for Jakarta, however the IAQM also included Bogor, Tangerang and Bekasi (this area is known collectively as Jabotabek). The IAQM produced the 1995 annual average isopleth for SO2, NO2, NOx and CO, and also predicted them for 2010. A compari-son of the URBAIR and the IAQM studies is summarized in Appendix 2.2. Note that the technical term for this air pollution map is a dispersion model. The dispersion model has become an important tool in the development of air quality management strate-gies due to its compelling function in predicting the spatial distribution of air pollutants, as well as evaluating the contribution of each source category. The development of a disper-sion model requires not only good emissions inventory data, but must also be organized in the same order as the dispersion model grid. In addition, the model needs to be validated using ambient air quality monitoring results. The URBAIR dispersion model was based on the Gaussian Plume and called KILDER. Later, the IAQM came up with the SURASH model for Jabotabek, which was a modification of KILDER. The KILDER and the SURASH models divided Jakarta into more than 290 grids (1.5 x 1.5 km2) and 660 grids (1.0 x 1.0 km2) respectively. Initially, the KILDER model was also intended to use a 1.0 x 1.0 km2 grid size, however it was difficult to transform the emissions data available at the time for a 1.5 x 1.5 km2 grid size. KILDER was applied to produce the 1992 annual average isopleth for parameters NOx and TSP for Jakarta, however it is was unclear whether KILDER could be used for other pa-rameters as well. On the other hand, the IAQM reported that according to its correlation analysis1, the SURASH could be used for present and future predictions of ambient air quality for parameters SO2, NO2, NOx and CO. An emissions inventory in the URBAIR and IAQM studies covered three main group sources; industrial, domestic activities and mobile (the IAQM included ships and aircraft). Both the URBAIR and the IAQM estimated emission loads by using adopted emission fac-tors. It is important to note that the IAQM made a considerable contribution in terms of ve-hicle emissions inventory by conducting various primary surveys, including on-road vehicle distribution and driving speed. In addition to the above-mentioned studies, the Jakarta Local Environmental Management Agency (BPLHD DKI)2 publishes Jakarta Local Environment Balance Reports (NKLD DKI) on an annual basis. The reports provide the emissions inventory results of various sources as covered in the IAQM. The emission loads are estimated based on fuel consumption data, and the emission factors are expressed in terms of kg emission per kg fuel consump-tion. With respect to air pollution produced by vehicles, the NKLD DKI does not distinguish the emission load based on vehicle category.
1The IAQM installed five monitoring stations that continuously measured ambient air quality during the period from January to December 1996, to validate the SURASH. 2Previously known as Kantor Pengkajian Perkotaan dan Lingkungan DKI Jakarta (KP2L DKI), the name was changed to Pusat Pengkajian Perkotaan dan Lingkungan DKI Jakarta (PPPL DKI) and then to Badan Pengenda-lian Dampak Lingkungan Daerah DKI Jakarta (Bapedalda DKI). It is now Badan Pengelola Lingkungan Hidup Daerah DKI Jakarta (BPLHD DKI). All changes have taken place between 1997 to 2001.

STUDY ON AIR QUALITY IN JAKARTA, INDONESIA
9
HEALTH AND ECONOMIC IMPACTS The study on the health impacts of air pollution can be categorized into two phases. In the first phase, studies focused on directly measuring the health impacts of air pollution (using blood and urine tests, as well as surveys3) on a certain population to measure the impact of Pb and CO. The second phase was not started until 1992, when the World Bank conducted a study of Jakarta that introduced a health impact estimation method using the dose-response func-tion (Ostro, 1994). In this study, this method is referred as Ostro's method. A dose-response function is a formula to calculate the number of people that will contract a certain health problem, given a certain number of people exposed to an air pollutant concentration above a certain threshold level. The threshold level is the WHO air quality guideline for ambient air pollutants.4 The Ostro method depends heavily on air quality monitoring results, which were not avail-able before 1991 even for Jakarta. Table 2.1 presents types of dose-response functions collected by Ostro from the epidemiological literature. Knowing the number of cases, an estimation can be made of the cost for medical care for a patient to recover from an air pol-lutant-related illness. The URBAIR also used the Ostro method.
Table 2.1 Available Dose-response Functions
NO2 SO2 TSP O3 PbPremature Mortality v v vIQ Decrement a/g Children vRestricted Activity Days vRespiratory Symptoms v v vRespiratory Symptoms a/g Children vChest Discomfort a/g Adult vLower Respiratory Illnesses a/g Children vAsthma Attacks v vChronic Bronchitis vEye Irritations vHypertension vNon-fatal Heart Attacks vRespiratory Hospital Admission v vEmergency Room Visit v
PollutantsHealth Impact
Source: Ostro, 1994.
3Conducted by the Ministry of Health (MoH) and the Department of Public Health, University of Indonesia. 4Standard air quality is a threshold level for a certain air pollutant, below which no health problem related to this pollutant is expected to occur.

STUDY ON AIR QUALITY IN JAKARTA, INDONESIA
10
Overview of the Findings of Previous Air Quality Assessments
AIR POLLUTION LEVEL
Emission Loads The URBAIR emissions inventory results revealed that in Jakarta in 1992, vehicle emission loads for parameters NOx and TSP were 35% and 73% respectively. The IAQM concluded that the vehicle share of the total emissions load of Jabotabek in 1995 was 69%, 15%, and 40% for NOx, SO2, and TSP respectively. The IAQM revealed that the passenger car group contributed the highest shares for all pa-rameters except SO2 among the vehicle groups in 1995. This is presented in Figure 2.3
Air Pollution Level Simulation Based on the simulation results for 1992, the URBAIR concluded that traffic was the most important source of TSP and contributed a maximum of 120 µg/m3 in the city center. IAQM simulation results for parameter SO2 in 1995 indicated that most concentrations were below standards, and mainly industrial sources caused a relatively high SO2 concentration (more than 26 µg/m3). There were only seven patchy grids with concentrations more than 26 µg/m3 that were caused by heavy vehicle traffic. The IAQM concluded that NO2 was a local problem in 1995 and most of the NO2 contribu-tions came from vehicles. Six grids with relatively high NO2 concentrations (more than 56 µg/m3) were clustered in Central Jakarta. Three grids with high NO2 concentrations above standard were located beside roads with heavy traffic in West Jakarta, East Jakarta and North Jakarta. CO concentrations were well below standard and posed no pollution prob-lem in 1995. In addition, the IAQM provides a prediction of the air pollution level without countermea-sures for the year 2010. The simulations suggested that areas with high SO2 concentration exceeding standards would be widely spread throughout Jakarta. The main cause of high SO2 concentrations was factories, and the impacts of vehicles were limited to certain local areas. NO2 concentrations in excess of the standard appeared mainly in Central Jakarta, where they were up to two times higher than the standard and caused mainly by automo-biles. CO concentrations were below the standard even in year 2010.
Figure 2.3 Emission Shares by Vehicle Type in Jabotabek in 1995
0%20%40%60%80%
100%
Em
issi
on L
oad
Shar
es
NOx SO2 TSP CO THC VKT*
Pass Car Truck Bus MC
Note: VKT* = shares of vehicle kilometer travel Source: JICA and Bapedal, 1997A

STUDY ON AIR QUALITY IN JAKARTA, INDONESIA
11
HEALTH IMPACTS In 1981, Achmadi conducted urine tests on 189 children whose schools were either in (i) busy traffic areas in Jakarta or (ii) outside Jakarta, i.e. not in busy traffic areas. The results consistently showed that the average urine lead concentration of children whose schools were in busy traffic areas was higher than that of children whose schools were outside Ja-karta (Achmadi, 1981). In 1987, Tri-Tugaswati et.al. carried out blood and urine tests on thirty public bus drivers and twenty-seven farmers living near the perimeter of Jakarta. Her tests showed that blood and urine lead levels of public transportation drivers was twice as high as those found in the farmer group (Tri-Tugaswati et.al., 1987). In 1989, Achmadi surveyed for the occurrence of CO and lead related health problems among Jakarta’s residents. Based on this survey, Achmadi argued that public transporta-tion drivers, street vendors, and people who live in high traffic areas have a 12.8 time greater risk of contracting health problems associated with air pollutants than people who live in suburban areas (Achmadi, 1989). Ostro found that air pollutants in Jakarta caused, among other illnesses, approximately 1,200 cases of premature mortality, 32 million cases of respiratory symptoms, and 464,000 cases of asthma attacks (Ostro, 1994). Table 2.2 shows the health impacts of air pollutants in Jakarta as estimated by Ostro.
Table 2.2
Ostro’s Estimate on Health Impacts of Air Pollutants in Jakarta in 1989
Number of cases NO2 TSP PbPremature Mortality 1,400 158IQ Decrement (in points) 2,073,205Restricted Activity Days 7,595,000Respiratory Symptoms 1,770,000 37,331,000Lower Respiratory Illness 125,100Asthma Symptoms 558,000Chronic Bronchitis 12,300Hypertension 135,660Non-fatal Heart Attack 190Respiratory Hospital Admission 2,500Emergency Room Visit 48,800
Source: Ostro, 1994. Using Ostro’s information on the number of health problems caused by air pollutants and the cost of medical care to treat air pollutant-related illnesses, the World Bank estimated the economic cost of air pollutants in Jakarta at approximately 220 million USD (or approxi-mately 500 billion IDR) (World Bank, 1994). In 1994, the URBAIR also estimated the cost of air pollutants in Jakarta based on both Os-tro's method and their own air pollution level maps. The URBAIR produced a list of different medical costs to treat air pollutant-related illnesses. Table 2.3 provides results of the UR-BAIR.

STUDY ON AIR QUALITY IN JAKARTA, INDONESIA
12
Table 2.3 Health Impacts from PM10 and Lead and their Valuation in Jakarta in 1990
Based on US* Based on Local (million IDR) (million IDR)
Impacts from PM10Mortality 4,364 2,836,645 102,336Restricted Activity Day 32,006,885 396,885 142,943Emergency Room Visit 131,033 7,246 1,463Bronchitis (children) 326,431 22,850 7,289Asthma Attacks 1,270,255 27,183 14,182Respiratory Symptoms 101,865,393 325,969 454,931Hospital Admission 6,680 40,078 2,238Impacts from leadMortality 340 221,000 7,973Coronary Heart Disease 350 17 4Hypertension 62,000 620,000 207,390IQ Points Loss 300,000 294,000 83,738Total 4,791,873 1,024,487
Health ImpactTotal Value
Cases
*Based on US means the total value of these health problems if they occur in the United States of America, then this value is converted into IDR unit. Source: World Bank, 1997

CHAPTER 3
Air Quality Monitoring This chapter gives a general description of Indonesia’s air quality monitoring network, and Jakarta's air quality monitoring system and an analysis of the situation in 1998 are de-scribed in detail.
Air Quality Monitoring Network Based on regulation No. 41 (1999), the responsibility for air pollution control is divided into two parts. The first concerns emissions monitoring and reduction, either from stationary or mobile sources, which is the owner’s responsibility. The second part concerns ambient air quality monitoring, which is the responsibility of both national and local governments.
NATIONAL AMBIENT AIR QUALITY MONITORING NETWORKS The Bureau of Meteorology and Geophysics (BMG) initiated ambient air quality monitoring activities in Indonesia in the 1970s, and these continue today. As of 1991, the BMG had approximately 20 monitoring stations in large cities throughout Indonesia (including Jakarta) which measured only parameter TSP (Appendix 3.1). The BMG even posted some of its results on the internet.5 In 1999, Indonesia established an online network of ambient air quality monitoring stations in ten cities,6 supported by a loan from the Austrian Government (AQMS network). The net-work is centered in Bapedal (see Appendix 3.2) and has the following aims:
public provision of information on the status of air quality; implementation of the Pollutant Standard Index (PSI) system; monitoring of transboundary air quality issues, such as forest fires and acid deposi-tion;
monitoring for emergency response in the event of any catastrophic emission; and provision of technically valid data to assist measures to control air pollution.
The ambient air quality network in each city consists of a monitoring station, meteorology station, a Regional Center (RC) and data display. The RCs operate and maintain the moni-toring stations, and function as data centers. The monitoring station monitors the concentration values of five key point ambient air pol-lutants: NO2, SO2, PM10, CO, and O3. In addition, the monitoring stations also measure me-teorological data that include wind direction, wind speed, humidity, solar radiation, and tem-perature. The online data are used to calculate the PSI values at each regional center, which are subsequently published on data displays to the public. According to Head of Bapedal De-cree No. 107 (1997), the PSI is calculated based on 24-hour averages for PM10, 24-hour averages for SO2, 8-hour averages for CO, 1-hour averages for O3, and 1-hour averages for NO2 (Appendix 3.3). The PSI number gives information about the city’s air quality condi-tions with the following index: good (1-50), moderate (51-100), unhealthy (101-199), very unhealthy (200-299), and dangerous (300 and more). Furthermore, each RC compiles monthly and annual reports to evaluate air quality status using statistical methods. 5 (http://www.bmg.go.id/) 6 DKI Jakarta, Bandung, Semarang, Surabaya, Denpasar, Medan, Pekanbaru, Palangkaraya, Jambi, and Pontianak

STUDY ON AIR QUALITY IN JAKARTA, INDONESIA
14
JAKARTA’S AIR QUALITY MONITORING SYSTEM In 1975, the Ministry of Health (MoH) also began an ambient air quality monitoring activity as part of the United Nations-Global Environment Monitoring System (UN-GEMS) project. The monitoring stations were located in Rawasari (residential area) and Pulo Gadung (in-dustrial area) and monitored local ambient levels of NO2, SO2, TSP, CO, and Pb. The UN-GEMS project, terminated throughout the world in 1996, indicated that Jakarta's ambient air quality is one the worst in the world (Table 3.1). In that year, the ambient air quality monitor-ing activity conducted by the MoH was also discontinued.
Table 3.1 Annual Average TSP Concentration at Industrial Areas in Jakarta
and Several Large International Cities
Countries Cities 1976 1985 1990 1995PRC Beijing n.a. n.a. 430 377
Guangzhou n.a. 160 142 n.a.Shanghai n.a. n.a. 269 246Shenyang n.a. 554 447 n.a.Xian n.a. 528 444 306
Hong Kong, China 114 95 n.a. n.a.India Bombay 166 227 n.a. 240
Calcutta 369 405 n.a. 375Delhi 432 488 n.a. 415
Indonesia Jakarta 210 204 273 271Japan Osaka n.a. 48 56 43
Tokyo n.a. 56 56 49Malaysia Kuala Lumpur 153 139 121 85Thailand Bangkok 281 204 198 223United States Chicago 161 104 74 n.a.
Houston 107 59 n.a. n.a.New York 74 74 67 n.a.
Note: Unit in microgram per cubic meter of air
Jakarta’s air quality is currently monitored by BPLHD DKI using manual and continuous monitoring stations. In addition, BPLHD DKI also owns and operates one mobile monitoring unit. The air monitoring system is summarized in Table 3.2. Twelve manual monitoring stations (Numbers 1 to 12) are operated on a rotational basis, and the parameters are measured for twenty-four hours every eight days at each manual monitoring station. Measurements taken at the manual monitoring stations are dictated by the availability of equipment and resources. The measurements from six continuous moni-toring stations that consist of four ambient (Numbers 13 to 16) and two roadside stations (Numbers 17 and 18) are recorded every ten minutes. Five new monitoring stations (Num-bers 19 to 23) were activated at the end of 2001; consequently, no results are available yet.

Table 3.2 Description of Air Quality Monitoring Stations in Jakarta
No Station Name Municipality Type Method Parameter Data Availability*)
1 Cilincing North Jakarta Ambient Manual2 Dunia Fantasi North Jakarta Ambient Manual3 Pulogadung I East Jakarta Ambient Manual4 Pondok Gede East Jakarta Ambient Manual5 East Jakarta Municipality Building I East Jakarta Ambient Manual6 Radio Dalam South Jakarta Ambient Manual7 Tebet South Jakarta Ambient Manual8 Kahfi South Jakarta Ambient Manual9 Gelora Bung Karno South Jakarta Ambient Manual
10 Rawa Buaya West Jakarta Ambient Manual11 Al-Firdaus Mosque West Jakarta Ambient Manual12 Istiqlal mosque Central Jakarta Ambient Manual13 Pluit (City forest) North Jakarta Ambient Continuous a, b, c14 Kelapa Gading North Jakarta Ambient Continuous a, b, c15 Pulogadung II East Jakarta Ambient Continuous b, c16 BPLHD DKI South Jakarta Ambient Continuous b, c17 Thamrin Central Jakarta Roadside Continuous a, b, c18 Gambir Central Jakarta Roadside Continuous d19 East Jakarta Municipality Building II East Jakarta Ambient Continuous e20 Pondok Indah South Jakarta Ambient Continuous e21 Gelora Bung Karno South Jakarta Ambient Continuous e22 Kemayoran Central Jakarta Ambient Continuous e
SO2, NO, NO2, CO, TSP, Pb
SO2, NO, NO2, NOx, CO, PM10, O3, CH4, NHMC, THC,
wind speed and direction, temperature, solar radiation
and relative humidity
SO2, SOx, NO2, NOx, CO, PM10, O3, wind speed and direction, temperature, solar
radiation and relative humidity*During commencement of this study -- October 2001 aMeasurement results in 1999 were not complete for all parameters bCalibrated during year 2000 cMeasurement results in 2001 had not been uploaded during the study dDown after 1998 ePart of the national online ambient air quality monitoring network. Started measurement end of year 2001 Source: Supalal, 2001 and Loedin, 2001.

STUDY ON AIR QUALITY IN JAKARTA, INDONESIA
16
In addition, the summary of air quality monitoring results from manual and continuous sta-tions for each parameter is published annually by BPLHD DKI in the NKLD DKI. The result of continuous air quality monitoring is also presented as the PSI index. At the commencement of this study in October 2001, only one station among the six initial continuous monitoring stations gave complete results for all parameters in 1999. All six monitoring stations were calibrated in 2000. During 2001, four monitoring stations were still under maintenance, and the data from the remaining two were not uploaded. Due to these reasons, the latest complete data sets available from the six continuous monitoring stations used in this study were from 1998. However, as the five new monitoring stations are inte-grated into the online monitoring system, which is part of the AQMS network, providing the latest ambient monitoring data for Jakarta should present no problems in the future. In terms of the number of monitoring stations, the evaluation based on Soedomo (2001) indicated that the current nine continuous monitoring stations still meet the minimum requirements for Jakarta, which is populated by 10 million people. It is, however, important to keep these nine stations operating continuously otherwise the city will not meet the minimum requirement.
Ambient Air Quality Standards National ambient air quality standards (AAQS) in Indonesia are based on Government De-cree of Republic of Indonesia No. 41 (1999). Jakarta also has ambient air quality standards that are more stringent than the national standards based on DKI Jakarta Governor’s De-cree No. 551 (2001). Both of the standards are presented in Table 3.3 together with World Health Organization (WHO) air quality guidelines and United States Environmental Protec-tion Agency (US-EPA) AAQS.
Air Quality Monitoring Results The results of air quality monitoring for Jakarta in 1998 from four ambient air quality moni-toring stations (Pulogadung II, Pluit, BPLHD-DKI and Kelapa Gading) and two roadside air quality monitoring stations (Thamrin and Gambir) are discussed below.
One-year Average First, it is important to note that in this study the one-year average refers to the geometric mean concentration of the air quality data calculated for the period January to December 1998. Figure 3.1 presents the normalized one-year average to DKI AAQS calculation re-sults for parameter NOx, SO2 and O3, and to US-EPA AAQS for PM10. NOx concentrations were higher than 50 µg/m3 at all stations, and exceeded the DKI AAQS at Pulogadung II, Pluit, Thamrin and Gambir stations, by 1.02, 2.01, 4.32, and 1.61 times respectively. SO2 concentrations were less than half of the level specified in the DKI AAQS, and O3 concen-trations exceeded the DKI AAQS at Pulogadung II and Kelapa Gading stations. No annual DKI or National AAQS are currently available for parameter PM10, however Figure 3.1 clearly shows that PM10 concentrations at all stations approached, if not, exceeded the US-EPA AAQS.

STUDY ON AIR QUALITY IN JAKARTA, INDONESIA
17
Table 3.3 Ambient Air Quality Standards
DKI National WHO* EPASulfur dioxide (SO2) 10 minutes n.a. n.a. 500 n.a.
1 hour 900 900 n.a. n.a.3 hours n.a. n.a. n.a. 1,30024 hours 260 365 125 3651 year 60 60 50 80**)
Carbon monoxide (CO) 15 minutes n.a. n.a. 100,000 n.a.30 minutes n.a. n.a. 60,000 n.a.
1 hour 26,000 30,000 30,000 40,0008 hours n.a. n.a. 10,000 10,00024 hours 9,000 10,000 n.a. n.a.
Nitrogen dioxide (NO2) 1 hour 400 400 200 n.a.24 hours 92.5 150 n.a. n.a.1 year 60 100 40 100**)
Ozone (O3) 1 hour 200 235 n.a. 2358 hours n.a. n.a. 120 1571 year 30 50 n.a. n.a.
Hydrocarbon 3 hours 160 160 n.a. n.a.Particulate < 10 micrometer (PM10) 24 hours 150 150 n.a. 150
1 year n.a. n.a. n.a. 50**)Total Suspended Particulate (TSP) 24 hours 230 230 n.a. n.a.
1 year 90 90 n.a. n.a.Lead (Pb) 1 year n.a. 1 0.5 n.a.Note : Unit in microgram per cubic meter of air Values are based on atmospheric conditions of temperature 25 deg. Celsius and pressure 1atm. *) WHO air quality guidelines **) Annual arithmetic mean
Averaging Time Threshold valuePollutant
Shorter Time Averages Table 3.4 presents the number of days exceeding the DKI AQQS in 1998 for the 24-hour average concentration for parameters NOx, SO2, PM10 and CO. The 24-hour average NOx concentration values exceeded the DKI AAQS at all stations on at least 42 days or 20% of the data available at all stations. The highest number of days exceeding the standard was 111 out of 115 days, at Thamrin station. All 24-hour average concentration values of SO2 from each monitoring station satisfied the DKI AAQS. PM10 and CO also exceeded the DKI AAQS at all stations, except at Kelapa Gading. For PM10, up to 23% of the available data exceeded the DKI AAQS for 24-hour average concentrations at Pulogadung II and Thamrin stations, while all data available for parameter CO at Gambir stations exceeded the DKI AAQS.

STUDY ON AIR QUALITY IN JAKARTA, INDONESIA
18
Figure 3.1 Normalized One-Year Average Concentrations in 1998
0
1
2
3
4
5
NOx (60) SO2 (60) PM10* (50) O3 (30)
Nor
mal
ized
One
-Yea
r Ave
rage
Pulogadung II Pluit BPLHD DKI Kelapa Gading Thamrin Gambir Note: Normalized to DKI AAQS, except PM10* to US-EPA AAQS.
The figures in the brackets are annual AAQS in microgram per cubic meter of air.
The three-hour average concentration of THC exceeded the DKI AAQS in not less than 50% of the data available at all stations, as shown in Table 3.4. Table 3.4 also presents the number of hours exceeding the DKI AQQS in 1998 for the hourly average concentration for parameters NOx, SO2, CO, and O3. NOx hourly concentra-tions exceeded the DKI AAQS at all stations except Pulogadung II, while SO2 hourly aver-age concentrations at each monitoring station satisfied the DKI AAQS. CO hourly concen-trations exceeded the DKI AAQS at all stations. The highest number of hours exceeding the CO standard occurred at Gambir station, for 619 out of 744 hours (83% of the samples). O3 concentrations exceeded the DKI AAQS for at least one hour at Kelapa Gading station, and up to 258 out of 1704 hours (15% of the samples) at Pulogadung II station.
Evaluation of Air Quality Monitoring Results At all stations, NOx concentrations barely satisfied the DKI AAQS for all categories (annual, 24-hour, and hourly average). In addition to the toxicity of NOx itself, NOx is a primary pol-lutant in O3 formation. The three-hour average concentration of THC exceeded the DKI AAQS in not less than 50% of total samples at all stations; THC concentrations were thus also an important problem. THC is not known to cause human health problems at the stan-dard concentration, but in the presence of sunlight, atmospheric hydrocarbons and NOx, it causes a photochemical reaction that produces O3. Given that the annual concentration of O3 exceeded the DKI AAQS at Pulogadung II and Kelapa Gading stations, THC and NOx should be reduced to decrease O3 concentrations. According to the WHO (2000), CO diffuses rapidly across the alveolar, capillary and placen-tal membranes, therefore WHO guideline values are set to shorter time averages (15 min-utes, 30 minutes, 1 hour and 8 hour) than other parameters. With these averages, the pre-sent findings suggest that CO is a serious problem in almost all areas of Jakarta.

(i) 24-Hour Average (maximum 24-hour average concentration data that can be collected in a year = 365)Parameter DKI
AAQS Total Exceed Total Exceed Total Exceed Total Exceed Total Exceed Total ExceedNOx 92.5 Count 343 67 151 99 299 81 127 42 115 111 334 215
Percentage 94% 20% 41% 66% 82% 27% 35% 33% 32% 97% 92% 64%SO2 260 Count 58 0 162 0 203 0 195 0 157 0 362 0
Percentage 16% 0% 44% 0% 56% 0% 53% 0% 43% 0% 99% 0%PM10 150 Count 77 18 135 1 293 3 225 0 30 7 285 1
Percentage 21% 23% 37% 1% 80% 1% 62% 0% 8% 23% 78% 0%CO 9000 Count 94 63 365 112 291 143 241 0 93 9 31 31
Percentage 26% 67% 100% 31% 80% 49% 66% 0% 25% 10% 8% 100%(ii) 3-Hour Average (maximum 3-hour average concentration data that can be collected in a year = 2920)Parameter DKI
AAQS Total Over Total Over Total Over Total Over Total Over Total OverTHC 160 Count 160 149 1128 1108 2216 2152 512 272 1560 1073 0 0
Percentage 5% 93% 39% 98% 76% 97% 18% 53% 53% 69% - -(iii) 1-Hour Average (maximum 1-hour average concentration data that can be collected in a year = 8760) Parameter DKI
AAQS Total Over Total Over Total Over Total Over Total Over Total OverNOx 400 Count 8232 0 3624 39 7176 32 3048 5 2760 646 8016 54
Percentage 94% 0% 41% 1% 82% 0% 35% 0% 32% 23% 92% 1%SO2 900 Count 1392 0 3888 0 4872 0 4680 0 3768 0 8688 0
Percentage 16% 0% 44% 0% 56% 0% 53% 0% 43% 0% 99% 0%CO 26000 Count 2256 373 8760 413 6984 1167 5784 1 2232 60 744 619
Percentage 26% 17% 100% 5% 80% 17% 66% 0% 25% 3% 8% 83%O3 200 Count 1704 258 1848 0 3168 0 4800 1 552 0 0 0
Percentage 19% 15% 21% 0% 36% 0% 55% 0% 6% 0% - -Note: Unit DKI AAQS in microgram per cubic meter of air Count total = total data for a certain averaging time for each station in 1998 Count exceed = total data or a certain averaging time that exceeding the DKI respective AAQS for each station in 1998 Percentage total = percentage of count total over maximum data that can be collected in a year for a certain averaging time Percentage exceed = percentage of count exceed over count total for a certain averaging time
Table 3.4: Comparison of Air Pollutant Concentrations with DKI AAQS for Shorter-time Average
Thamrin GambirPulogadung II Pluit BPLHD DKI Kelapa Gading
Thamrin Gambir
Thamrin Gambir
Pluit BPLHD DKI Kelapa Gading
Pulogadung II Pluit BPLHD DKI Kelapa Gading
Pulogadung II

STUDY ON AIR QUALITY IN JAKARTA, INDONESIA
20
The annual concentration of PM10 satisfied the DKI AAQS at all stations, however, up to 23% of the samples exceeded the DKI AAQS for 24-hour average concentrations at Pu-logadung II and Thamrin stations. These findings suggest that PM10 may be considered a problem in certain areas. No evaluation of TSP concentration was conducted as it was not monitored at the stations. SO2 did not present a problem as measurements at all monitoring stations satisfied the DKI AAQS categories. These findings do not clearly indicate that roadside pollutant concentrations are significantly higher than ambient pollutant concentrations. The fact, however, that the DKI AAQS were often exceeded at various air quality monitoring stations cannot be neglected. Moreover, a recent study on hourly variation for parameters CO, NO, SO2, PM10 and O3 in Jakarta (Supalal, 2001) shows that almost all the monitored parameters except SO2 and O3 have a sharp concentration peak in the morning. This coincides with traffic congestion, and previ-ous results indicate that the concentrations of those parameters are influenced by vehicle emissions.

CHAPTER 4
Air Pollution Assessment This chapter provides an assessment of Jakarta's air pollution level. An emissions inventory that comprised industrial, domestic and vehicle sources in Jakarta was conducted to evalu-ate the contribution of vehicle emissions to the city’s overall pollution, however only the ve-hicle emissions inventory was completed in detail. The Multi Box Model (MBM) was introduced to simulate the ambient air pollution level due to various pollutants emitted in different areas of Jakarta. As a baseline case without coun-termeasures, the emission loads from various sources were predicted for both the short-medium term (year 2005) and long-term (year 2015) based on simple scenario planning (with variables being the number and type of vehicles, and fuel standards). The spatial dis-tribution of ambient air quality emitted by various sources in Jakarta was subsequently pre-dicted for year 2015 using the MBM. As mentioned in Subsection 2.B.1, the emissions inventory data must be organized in the same order as the dispersion model grid, hence this chapter starts with a description of the grid system applied for this study.
GRID SYSTEM In the MBM, the area to be studied is divided into cells that are not necessarily identical in area and height. To simplify the management aspects and harmonize with the existing da-tabase management, Jakarta is divided into grids based on its district administrative boundaries. Any number of grid squares may be combined into a single grid based on uni-form topography, uniform surface type and uniform source distribution. Hence, Jakarta was divided into 23 grids, as depicted in Figure 4.1. The list of district names for each grid is also presented in Figure 4.1. Two unique numerical digit codes [XY] were assigned for each grid. Value X, from 1 to 5, indicates the administrative location of the grid which are north Jakarta, east Jakarta, south Jakarta, west Jakarta and central Jakarta, respectively. Value Y started from 1 to as many grids as contained in each municipality. For example, number 25 indicated the fifth grid in east Jakarta.
EMISSION LOAD ESTIMATION
Estimation Outline This subsection outlines only the data, assumptions and methodology utilized to estimate the emission load. The comprehensive data and the methodology applied are presented in the Appendix 4.1.
Industrial Source The total emission load from industrial sources was estimated based on the corresponding year's ratio of Jakarta's RGDP for 1995. The RGDP ratios are 0.94, 1.30 and 3.07 for years 1998, 2005 and 2015, respectively. Therefore, the total emission loads in 1998, 2005 and 2015 were respectively estimated to be 0.94, 1.30 and 3.07 times the total emission load from industrial sources in 1995 estimated in the IAQM. For industrial sources, the total emission load was normalized into emission load in each grid based on the land use for industry distribution.

STUDY ON AIR QUALITY IN JAKARTA, INDONESIA
22
Domestic Source The domestic emission load in each grid was estimated based on running kilometers multi-plied by the emission factors. The total emission load from domestic sources was predicted to increase according to population growth. Total population in Jakarta is expected to grow from approximately 9.68 million in 1998 to 10.97 million in 2005, and to 13.02 million in 2015. The emission factor for domestic sources (in unit ton/cap/year) was derived from the IAQM.
Vehicle Source The emission load from each vehicle fleet category in each grid was estimated based on running kilometers multiplied by the emission factors. Running kilometers of each vehicle category were calculated based on origin-destination (OD) matrices multiplied by the vehi-cle utilization derived from the IAQM. The OD matrices were developed from the IAQM 1995 OD matrices. The expansion factor between 1995 and 1998 was estimated as the annual vehicle growth rate in Jakarta that can be calculated from the vehicle population data of the State Police of Indonesia (Dit-lantas Polri). The annual expansion factor between 1995 and 2005 or 2015 was forecasted as the annual vehicle growth rate in Jakarta from 1999 to 2000. This was used instead of the actual growth rates from 1990 to 2000, which was considered an unusual period due to the economic recession. The 1999 to 2000 annual growth rates applied were 10%, 4%, and 5.8% for passenger cars, trucks, and motorcycles respectively, and a zero growth rate was assumed for the bus category. These are still low by historical standards. The vehicle popu-lation in Metro Jaya7 from 1990 to 2015 is depicted in Figure 4.2. The vehicle emission loads without countermeasures are estimated using emission factors for uncontrolled technology vehicles. Emission factors for CO, THC, NOx and PM10 (in unit gram/kilometer) are modified based on Walsh (2002A) and the IAQM. SO2 emission factors are derived from fuel economy, with fuel sulfur content based on the equation provided in the IAQM. The sulfur content in gasoline and diesel fuel in 1998 was assumed to be the same as in the IAQM, which was recorded as 0.015% and 0.396% respectively. After the leaded gasoline phase-out was initiated in Jakarta in July 2001, fuel sulfur content is 0.0083% for gasoline and 0.3203% for diesel fuel (Purwanto, 2001). Parameters that influence emission factors are engine type and vehicle utilization, and ex-haust gas categories for motorcycles. Therefore, the vehicle fleet in Jakarta was further divided into seventeen categories, as tabulated in Table 4.1.
Estimation Results and Findings Figure 4.3 presents the modal share of each source in the total emission load (of NOx, SO2, and PM10) in Jakarta in 1998. Vehicle emissions contributed approximately 71% NOx, 21% SO2 and 71% PM10 to total emission loads. In 1998, the vehicle population comprised of 29% passenger cars, 10% trucks, 8% buses and 54% motorcycles. Based on the OD matrices (Appendix 4.1), the on-road vehicle dis-tribution was basically the same as the vehicle population, with the proportion of trucks rela-tively lower (approximately 2%) and the proportion of passenger cars and motorcycles slightly higher at 31% and 59%, respectively.
7 Metro Jaya includes Jakarta, Bekasi, Depok

STUDY ON AIR QUALITY IN JAKARTA, INDONESIA
23
Vehicle Group*) Description Fuel Type Emission Factor**)
Vehicle Category***) Composition****)
Passenger car Private Gasoline LDGV PPG 0.6712Private Diesel LDDV PPD 0.1678Taxi Gasoline LDGV PTG 0.1047Taxi Diesel LDDV PTD 0.0564
Truck Micro Gasoline LDGT2 TMG 0.2805Micro Diesel LDDT TMD 0.2805Large Diesel HDDV TLD 0.4390
Bus Micro Gasoline LDGT2 BMG 0.3850Micro Diesel LDDT BMD 0.3850Large Diesel HDDV BLD 0.2300
Motorcycle 2/4 Stroke, > 250 cc Gasoline MC1 MC1 0.00002-Stroke, 126 - 250 cc Gasoline MC2 MC2 0.11554-Stroke, 126 - 250 cc Gasoline MC3 MC3 0.14412-Stroke, 51 - 125 cc Gasoline MC4 MC4 0.16474-Stroke, 51 - 125 cc Gasoline MC5 MC5 0.20552-Stroke, < 50 cc Gasoline MC6 MC6 0.16474-Stroke, < 50 cc Gasoline MC7 MC7 0.2055
Note:*) Vehicle group according to Ditlantas Polri' categories**) According to Walsh (2002A), except for motorcycle refer to JICA and Bapedal (1997A).***) Vehicle category for this study****) Composition of each vehicle category in this study for each DitIantas Polri vehicle group based on JICA and Bapedal (1997A).
Table 4.1: Vehicle Fleet Description and Engine Type Composition
Figure 4.4 shows the share of emissions by vehicle type for NOx, SO2, PM10, CO and THC. Passenger cars emitted more than 30% of the entire measured vehicle emission load. Motorcycles emitted more than 20% of both PM10 and CO and 40% of THC. Trucks released approximately 30% of the NOx, SO2 and PM10 emission load, and buses emitted no more than 20% of all parameters measured. Figure 4.5 shows the predicted total emission loads from various sources during 2005 and 2015 in Jakarta. Vehicle emissions contributed to approximately 73% NOx, 18% SO2 and 72% PM10 total emission loads in 2005 and 71% NOx, 15% SO2 and 70% PM10 total emis-sion loads in 2015.
.

STUDY ON AIR QUALITY IN JAKARTA, INDONESIA
24
Figure 4.1 Grid System
Legend
11 = Penjaringan, Pademangan, 12 = Tj. Priok, Koja, 13 = Kelapa Gading, Cilincing, 21 = Cakung, 22 = Pulogadung, 23 = Matraman, 24 = Duren Sawit, 25 = Jatinegara, 26 = Kramat Jati, Makasar, 27 = Ps. Rebo, Ciracas, Cipayung, 31 = Pesanggrahan, 32 = Kebayoran Lama, 33 = Kebayoran Baru, Cilandak, 34 = Mampang Prapatan, Setiabudi, 35 = Pancoran, Tebet, 36 = Jagakarsa, Ps. Minggu, 41 = Cengkareng, Kalideres, 42 = Kembangan, Kebon Jeruk, 43 = Palmerah, Grogol Petamburan, 44 = Tambora, Taman Sari, Sawah Besar, 51 = Menteng, Gambir, 52 = Tanah Abang, 53 = Senen, Johor Bahru, Cempaka Putih, Kemayoran
Figure 4.2: Vehicle Population in Metro Jaya* (1990-2015)Note: *) Metro Jaya includes Jakarta, Bekasi, Depok
Source: Ditlantas Polri (1990-2000) and prediction (2001-2015).
1.64903.0211
4.15945.7275
8.0117
11.3740
0
2
4
6
8
10
12
1990 1995 2000 2005 2010 2015Year
Vehi
cle
Pop
ulat
ion
(milli
on)
Passenger Cars Trucks Buses Motorcycles Total

STUDY ON AIR QUALITY IN JAKARTA, INDONESIA
25
Figure 4.3 Emission Shares by Source Type in Jakarta in 1998
26%
3%
71%
Industry Domestic Vehicle
25%
4%
71%71%
21%
7%
SO2(27,494)
PM10(8,671)
NOx(78,979)
Note: The figures in the brackets are estimated total emission load in tons/year. All CO and THC only emitted from vehicle as much as 942,840 and 187,545 tons/year, respectively.
Figure 4.4
Emission Load Shares by Vehicle Category in Jakarta in 1998
0%
20%
40%
60%
80%
100%
Em
issi
on L
oad
Sha
res
NOx SO2 PM10 CO THC
Pass Car Truck Bus MC

STUDY ON AIR QUALITY IN JAKARTA, INDONESIA
26
Figure 4.5: Prediction of Total Emission Load in Jakarta for Baseline Case
3.0 2.9 2.9
3.43.7
1.4 1.61.61.41.3
0
1
2
3
4
NOx SO2 PM CO THCRat
io to
the
1998
Tot
al E
mis
sion
Loa
d
2015 2005 1998
AMBIENT AIR QUALITY SIMULATION
Simulation Outline This subsection outlines the data, assumptions and methodology utilized to simulate ambi-ent air quality. The comprehensive data and the methodology applied are presented in the Appendix 4.2. The ambient air quality was simulated for 1998 and 2015 based on a MBM using the follow-ing basic equation.
∑=
+=16
1161
iTiT C
QEaC (4.1)
where:
a is percentage of calm wind
E is total emission per parameter of grid
Q is air rate according to wind and interaction area of each direction
CT is total concentration
i is index of wind direction
As mentioned in Section A, Jakarta’s area was divided into 23 grids. The emission loads for 1998 and 2015 served as input data for the MBM. As air pollutant dispersions are influ-enced by meteorological conditions, the atmospheric mechanism analysis in terms of wind and mixing height are crucial elements in the model. The annual average wind speed in

STUDY ON AIR QUALITY IN JAKARTA, INDONESIA
27
Jakarta is very weak; it is often calm (wind speed lower than 0.4 m/s) with around 20.3% of wind incidents. The highest annual average wind speed is around 1.6 m/s, and most of the wind blows from the southwest. The mixing height is approximated by the cloud height, and assumed uniform at around 200 m for all grids. Another crucial element in the model is the background concentration, which is defined as the concentration of pollutant in the air en-tering Jakarta from the surrounding area. Despite the importance of the 1998 simulation to evaluate the spatial distribution of ambient air quality emitted by various Jakarta sources, the 1998 simulation was conducted mainly for the purpose of model calibration prior to use. Having known all the above mentioned elements and the 1998 ambient air quality monitoring results, the correlation coefficient be-tween the simulated results using the MBM and actual measurement at monitoring stations can be determined. Unfortunately, the absence of background concentration data for year 1998 hindered the process. Instead, the MBM was calibrated with the 1998 Pulogadung II and Pluit monitoring results for parameters NOx, SO2, PM10, CO and THC by changing the background concentration until the iterations reached 5000 steps or had an error no more than 0.0001. Later, the 1998 background concentrations obtained from the iteration process were ap-plied to the 1998 simulation with the MBM, and used to estimate the 2015 background con-centrations for the 2015 simulation with the MBM. The 2015 background concentrations were estimated at 1.3 times higher than the 1998 background concentrations due to re-gional development. The estimated background concentrations for both 1998 and 2015 exceeded the AAQS for several parameters in various boundary areas (Appendix 4.3). To evaluate the ambient air quality status due to the pollutant being emitted in Jakarta only, the simulations for both 1998 and 2015 were replicated by modifying the background concen-trations that exceeded the AAQS to the same as the threshold value specified by the AAQS. In summary, there were four different background concentration categories applied in this study as presented in Appendix 4.3. It is important to note that the accuracy of the simulation model will become higher with (i) a higher quality source inventory, (ii) precise meteorological data and (iii) sufficient back-ground concentration data from the area surrounding Jakarta.
Simulation Results and Findings Table 4.2 presents the MBM simulation characteristics and results for Jakarta. The results are expressed in terms of the number of grids exceeding the AAQS from the 23 grids for parameter NOx, SO2, PM10 and THC. Each parameter is addressed separately in this sub-section. In reading Table 4.2 it is important to acknowledge that the number of grids exceeding the AAQS does not indicate the absolute value of the ambient air quality concentration. Conse-quently, the number of grids exceeding the AAQS due to multiple sources is not necessarily the same as the summation of grids exceeding the AAQS due to a single source.
NOx For parameter NOx, the results show that 22 grids exceeded the DKI AAQS due to the pol-lutants being emitted in the area surrounding Jakarta and from vehicle sources in 1998. Thirteen grids exceeded the DKI AAQS for NOx due only to the pollutant being emitted in the area surrounding Jakarta. In spite of this fact, had the NOx background been set to meet the DKI AAQS, 20 grids would still have exceeded the DKI AAQS due to NOx being emitted by vehicle sources alone in 1998. In addition, no grid would have exceeded the DKI AAQS due only to the industrial and domestic emission load. However, the accumulative emission load from vehicles, industrial and domestic sources would cause one more grid to exceed the DKI AAQS. Therefore, 21 grids in total would have exceeded the DKI AAQS

STUDY ON AIR QUALITY IN JAKARTA, INDONESIA
28
due to the pollutant emitted by all sources in 1998. These findings suggest that in 1998, vehicle sources had already created a serious NOx pollution problem in a wide area of Ja-karta. The prediction results also show that in 2015, all grids exceeded the DKI and US-EPA AAQS for NOx. It also demonstrates that all grids already exceeded those AAQS due only to the pollutant being emitted in the area surrounding Jakarta. In spite of this fact, had the NOx background been set to meet the AAQS, all grids would still have exceeded the AAQS due to this pollutant being emitted by vehicle sources in 2015. Thus, if no countermeasures are applied to present conditions, NOx will heavily pollute all areas of Jakarta by year 2015.
SO2 The estimation results reveal that SO2 was not a problem in 1998 (Table 4.2), but it be-comes one in 2015 when 12 grids in total exceed the DKI AAQS. Five grids were due solely to this pollutant emitted from industrial sources, one grid was due to the cumulative effect of industrial and domestic emission loads, and six grids were due to the cumulative effect of all sources. These findings suggest that the main contributor of SO2 is industrial sources. The contribution of vehicle sources cannot be neglected however, since 50% of the total grids exceeding the DKI AAQS were due to the cumulative contribution of the other sources. It is interesting to observe that for parameter SO2, the MBM simulation results are not in agreement with those of the IAQM study. One possible explanation is the industrial emis-sions data that were applied in these two studies are different.

(i) Ambient air quality standardParameter NOx SO2 PM10 THCAveraging Time Annual Annual Annual 3-HourType of AAQS DKI DKI US-EPA DKITreshold Value (microgram per cubic meter of air) 60 60 50 160(ii) Simulation characteristics and results
NOx SO2 PM10 THCVehicle Industry Domestic
1 1998 Category 1 No No No 13 0 22 02 1998 Category 1 Yes No No 22 0 22 213 1998 Category 1 No Yes Yes 17 0 22 04 1998 Category 1 Yes Yes Yes 22 0 22 215 1998 Category 2 No No No 0 0 0 06 1998 Category 2 Yes No No 20 0 15 217 1998 Category 2 No Yes Yes 0 0 1 08 1998 Category 2 Yes Yes Yes 21 0 19 219 2015 Category 3 No No No 19 0 3 210 2015 Category 3 Yes No No 23 0 23 2311 2015 Category 3 No Yes Yes 23 6 23 212 2015 Category 3 Yes Yes Yes 23 12 23 2313 2015 Category 4 No No No 0 0 0 014 2015 Category 4 Yes No No 23 0 21 2315 2015 Category 4 No Yes Yes 22 6 1 016 2015 Category 4 Yes Yes Yes 23 12 22 23
Note:
Table 4.2: The MBM Simulation Characteristics and Results for Jakarta
*) Background is a condition when it was assumed no emission at all from Jakarta area, therefore the pollutant in the Jakarta air was only due to the pollutant emitted from the surrounding area of Jakarta (background concentration). The category definition can be seen in Appendix 4.3.
Simulation ResultsNumber of Grid Exceeding Standard (count)Simulation
No.
Simulation CharateristicsEmission SourceSimulation
Year JakartaBackground Concentration*)

STUDY ON AIR QUALITY IN JAKARTA, INDONESIA
30
PM10 It is also interesting to observe in Table 4.2 that only one grid did not exceed the US-EPA AAQS for parameter PM10, due to pollutants being emitted in the area surrounding Jakarta. In spite of this fact, had the PM10 background been set to meet the US-EPA AAQS, 15 grids would still exceed that standard due to PM10 being emitted by vehicle sources in 1998. In addition, one grid would exceed the DKI AAQS due to the cumulative effect of industrial and domestic emissions loads. However, the cumulative emission load from industrial, domestic and vehicle sources would cause three more grids to exceed the DKI AAQS. Therefore, in total 19 grids would exceed the DKI AAQS due to the pollutant being emitted by all sources in 1998. This suggests that in 1998 not only had vehicles created a serious PM10 pollution problem in a wide area of Jakarta, but that the contribution from industrial and domestic sources was also quite significant. The prediction result (Table 4.2) shows that in 2015, all grids exceeded the DKI and US-EPA AAQS for parameter PM10. In addition, all grids already exceeded those AAQS due only to the pollutant being emitted in the area surrounding Jakarta. In spite of this fact, had the PM10 background been set to meet the AQQS, all 21 grids would have still exceeded the AAQS due to this pollutant being emitted by vehicle sources in 2015. Thus, if no coun-termeasures are applied to present conditions, PM10 will heavily pollute all areas of Jakarta by year 2015.
CO No DKI AAQS, National AAQS, US-EPA AAQS or WHO air quality guideline is available for an annual CO concentration. Therefore, no comparison of the 1998 simulation results with AAQS has been made. Figure 4.6 presents the ratio of ambient air quality in 2015 to 1998 for parameter CO due only to the pollutant being emitted from vehicle sources in Jakarta and its surrounding area. This shows that the 2015 concentration in more than 60% of the total grids are double the 1998 concentration for parameter CO.
Figure 4.6: 2015 to 1998 CO Concentration Ratio in Jakarta
0.0
1.0
2.0
3.0
11 12 13 21 22 23 24 25 26 27 31 32 33 34 35 36 41 42 43 44 51 52 53
Grid
2015
to 1
998
Con
cent
ratio
n R
ati o
Similar to parameter SO2, the MBM simulation results for parameter CO suggest different findings to those of the IAQM study. This discrepancy may be due to different background concentrations being applied in these two studies.
THC No DKI AAQS, National AAQS, US-EPA AAQS or WHO air quality guideline is available for an annual THC concentration. Therefore, no comparison of the 1998 simulation results with AAQS was made. Nevertheless, it is important to note that the simulation results for parameter THC exceeded the DKI AAQS for 3-hour average in 21 grids (Table 4.2).

STUDY ON AIR QUALITY IN JAKARTA, INDONESIA
31
In addition, Figure 4.7 presents the ratio of ambient air quality in 2015 to 1998 for parame-ter THC due only to the pollutant being emitted from vehicle sources in Jakarta and its sur-rounding area. It can be seen that the 2015 concentration in more than 95% of the total grids is double the 1998 concentration for parameter THC.
Figure 4.7: 2015 to 1998 THC Concentration Ratio in Jakarta
0.0
1.0
2.0
3.0
11 12 13 21 22 23 24 25 26 27 31 32 33 34 35 36 41 42 43 44 51 52 53
Grid
2015
to 1
998
Con
cent
ratio
n R
atio
SPATIAL DISTRIBUTION OF EMISSION LOAD AND AMBIENT AIR QUALITY Figures 4.8 and 4.9 show the spatial distribution of normalized vehicle emission load8 and normalized total emission load9 respectively, in Jakarta in 1998. The highest emission load for parameter NOx, SO2 and PM10 in both figures was observed in grid 34 (Mampang Pra-patan and Setia Budi Districts). The highest emission load for parameter CO and THC was in grid 44 (Sawah Besar, Tambora, and Taman Sari Districts). The spatial distribution of normalized ambient air quality10 in 1998 as depicted in Figure 4.10 indicates that the grid with the highest emission load does not necessarily have the highest ambient air quality. The highest air pollutant concentrations for parameters NOx and PM10 were observed in Grid 31 (Pesanggrahan District); for parameter SO2 in Grid 53 (Se-nen, Johor Baru, Cempaka Putih and Kemayoran Districts); and for parameter CO and THC in Grid 51 (Menteng and Gambir Districts). This may be explained by considering the air dispersion mechanism and background concentration, i.e. the carrying capacity of the study area.
8 Normalized vehicle emission load for each parameter was obtained by dividing the vehicle emission load for
each grid by the highest total emission load value. 9 Normalized total emission load for each parameter was obtained by dividing the total emission load for each
grid by the highest total emission load value. 10 Normalized ambient air quality for each parameter was obtained by dividing the concentration of each grid by
the highest concentration load value among all grids.

Figure 4.8: Spatial Distribution of Vehicle Emission Load in Jakarta in 1998
0.0
0.2
0.4
0.6
0.8
1.0
11 12 13 21 22 23 24 25 26 27 31 32 33 34 35 36 41 42 43 44 51 52 53Grid
Nor
mal
ized
V
ehic
le E
mis
sion
Loa
d
NOx SO2 PM10 CO THC

Figure 4.9: Spatial Distribution of Total Emission Load in Jakarta in 1998
0.0
0.2
0.4
0.6
0.8
1.0
11 12 13 21 22 23 24 25 26 27 31 32 33 34 35 36 41 42 43 44 51 52 53Grid
Nor
mal
ized
To
tal
Em
issi
on L
oad
NOx SO2 PM10 CO THC

Figure 4.10: Spatial Distribution of Total Ambient Concentration in Jakarta in 1998
0.0
0.2
0.4
0.6
0.8
1.0
11 12 13 21 22 23 24 25 26 27 31 32 33 34 35 36 41 42 43 44 51 52 53Grid
Nor
mal
ized
A
mbi
ent C
once
ntra
tion
NOx SO2 PM10 CO THC

STUDY ON AIR QUALITY IN JAKARTA, INDONESIA
35
CONTROL TARGETS FOR VEHICULAR EMISSIONS REDUCTION According to the NKLD-DKI (BPLHD-DKI Jakarta, 2000), reducing vehicle emissions is one of the DKI Jakarta government’s policies to improve Jakarta’s overall ambient air quality. According to international experience, air pollution control should be carried out with a cer-tain target. In this study, based on the target of improving the ambient air quality and the prediction of pollution without countermeasures, the level of control for targeted pollutants from vehicle sources was calculated by considering the carrying capacity of Jakarta's air. If Jakarta plans to meet the DKI AAQS, it will need to reduce emissions of NOx by up to 50% of the 1998 emission load. Since no DKI or National AAQS is available for PM10, if Jakarta plans to meet the US-EPA AAQS for this parameter the city will also need to reduce PM10 emissions by up to 50% of the 1998 emission load. The AAQM results (Section 3.C) clearly indicate that the CO level significantly exceeded the DKI AAQS for shorter-time average. If Jakarta plans to improve conditions for shorter-time average, Jakarta will consequently be required to reduce the annual CO concentration. If a concentration of 2500 µg/m3 is set for CO, Jakarta will need to reduce CO emissions by more than 50% of the 1998 emission load. Assuming the THC concentration should meet the DKI AAQS for 3-hour average, Jakarta will need to reduce THC emissions by more than 50% of the 1998 emission load. It is important to note that the measures will only be effective in achieving the target if the area surrounding Jakarta also meets the DKI AAQS, and industrial and domestic emission loads do not extend beyond the assumption set for this study. Lastly, it is also important to acknowledge that various air quality simulation models may lead to different results due to different input values in the model. Therefore, with a higher quality source inventory, precise meteorological data and sufficient background concentra-tion data from the area surrounding Jakarta, more accuracy may be expected in the simula-tion results. This in turn may enable the model to be utilized with certainty to set control tar-gets for emissions reduction, as well as air quality management tools for Jakarta.

CHAPTER 5
Analysis of Health and Economic Impacts
This chapter describes the health impacts of air pollution in Jakarta. It outlines the basic methodology used to calculate the health impacts of air pollution and their economic val-ues, and presents the estimated health impacts of air pollution in Jakarta for 1998 and 2015.
ESTIMATION OUTLINE
Health Impact This study implements the same methodology in estimating health impacts of air pollutants as described earlier in Subsection 2.B.2 (Ostro's method). A dose-response function is a formula to calculate the number of people, in a certain area, that contract a certain health problem, since these people are exposed to an air pollutant concentration above an air quality standard. The air quality standard is a threshold level for a certain air pollutant, be-low which no health problem related to this pollutant is expected to occur. In applying these dose-response functions, we utilize the WHO air quality guidelines for annual allowable pollutant levels. If there is no WHO guideline for a certain pollutant, then the US-EPA or Indonesian standard is adopted (Table 3.1). The general form of these dose-response functions is: dHi = bi · POPi · dA (5.1)
where:
dHi is the number of people that contract health effect i or number of cases for health problem i.
bi is the slope of the dose-response function.
POPi is the population within the polluted area under consideration, i.e. the popula-tion at risk of health effect i.
dA is the ambient level of a certain air pollutant in the area under consideration, above the WHO air quality guidelines.
It is important to note the slope of the dose-response function. The slope tells indicates the additional health problem caused by a unit increase of a certain air pollutant above the WHO guidelines. The specific dose-response function for each pollutant is presented in Appendix 5.1. The dose-response functions collected by Ostro are derived from epidemiological studies in United States cities. These functions are used in this work, since functions derived from studies in tropical conditions are not yet available. In applying these dose-response func-tions, Jakarta is divided into several grids or areas (Section 4.A). In each grid, information on ambient levels of air pollutants and population is collected. Hence, numbers of air pollu-tion health problems can be estimated in each grid/area.

STUDY ON AIR QUALITY IN JAKARTA, INDONESIA
37
Among the pollutants for which dose-response functions are available (Table 2.1), this study is only able to provide information on ambient levels of NO2, SO2, and PM10, per grid for 1998 and 2015. The population data per kecamatan were obtained from BPS for 1998 and predicted for 2015. (Appendix 5.2 and Appendix 5.3).
Economic Impact In this study, the economic impact of air pollution is defined as the economic value of health problems associated with air pollutants, or the cost of air pollution health problems. The economic value of health problems associated with air pollutants is calculated with a gen-eral formula as follows: The health cost of pollutants under consideration is: TCi = Vi · dHi (5.2) where: TCi is the total economic value of health problem i. Vi is the value of health problem i (per unit/case). In general, this will be
the treatment cost, per case, of health effect i, or the value of human life in the case of mortality.
dHi is the number of cases for health problem i. Methods to calculate the value of each health problem are presented in Appendix 5.4. A survey of health cost has been conducted at the Cipto hospital representing public hospi-tals, Universitas Kristen Indonesia hospital representing private hospitals, and several indi-vidual medical doctor practices. The estimated economic value per unit of health problems associated with air pollution can be seen in Table 5.1. Note that in the final calculation, it is assumed that 90% of patients seek medical treatments at public hospitals, 7% of them go to private hospitals, and the last 3% consult with individual medical doctor practices. To facilitate comparison with previous studies, Table 5.1 also presents values per unit of air pollution health problem from previous studies.
ESTIMATED HEALTH AND ECONOMIC IMPACTS IN 1998 Table 5.2 presents the estimated health problems associated with PM10, NO2 and SO2 in 1998. Table 5.3 shows their economic cost, which reveals that the total economic value (cost) of health problems associated with PM10, NO2 and SO2 for the whole of Jakarta in 1998 is approximately 1,786,803 million IDR (181 million USD). This is approximately only 1 percent of Jakarta’s GDP, however it is as much as approximately 100 percent of the Ja-karta Government’s total revenue for 1998.
ESTIMATED HEALTH AND ECONOMIC IMPACTS IN 2015 Table 5.4 presents the estimated health problems associated with PM10, NO2 and SO2 in 2015. Figure 5.1 shows the ratio of health problems in 2015 to those in 1998 associated with PM10 and NO2. It can be seen that the number of health problems associated with PM10 for the whole of Jakarta in 2015 is approximately 2.4 times the 1998 numbers. This increase is not equal throughout Jakarta: in North Jakarta, the number of health problems associated with PM10 in 2015 are more than 3 times the 1998 numbers, while in Central Jakarta, the number is roughly the same as in 1998.

Health EffectWB Report Resosudarmo Own Calc. Cipto Hosp. UKI Hosp. Private MD (IDR) (USD)
Indonesian US-derived PM10Premature Mortality 23,450,000 650,000,000 92,157,163 92,157,163 8,533.07Restricted Activity Days 4,466 12,400 17,050 17,050 1.58
Hospital Admission 547,300 335,000 6,000,000 1,500,000 805,000 985,500 n.a. 823,050 76.21Emergency Room Visits 11,165 55,300 15,000 75,000 676,700 n.a. 135,170 12.52
Asthma Attacts 5,263 11,165 21,400 5,000 21,000 57,500 n.a. 24,650 2.28Lower Resp.Illnesses a/g Children
10,000 20,000 50,000 11,900 1.1
Respiratory Symptoms 842 4,466 3,200 850 10,000 20,000 50,000 11,900 1.1
Chronic Bronchitis 33,680 22,330 70,000 17,500 55,000 68,000 100,000 57,260 5.3NO2 Respiratory Symptoms 4,466 12,400 850 10,000 20,000 50,000 11,900 1.1
SO2 Premature Mortality 92,157,163 92,157,163 8,533.07Respiratory Symptoms a/g Children
10,000 20,000 50,000 11,900 1.1
Chest Discomfort a/g Adult
10,000 20,000 50,000 11,900 1.1
Note:The USD-IDR conversion in 2001, USD 1 = IDR 10,800.
URBAIR
Table 5.1: Economic Value per Unit Air Pollution Health Problem
Number UsedCurrent Estimates (in IDR 2001)Previous Studies (in IDR for 1990)

Health Effect South Jkt East Jkt Central Jkt West Jkt North Jkt TotalPM10Premature Mortality 1,018 881 263 903 242 3,307Restricted Activity Days 5,601,704 4,844,416 1,447,572 4,967,790 1,333,339 18,194,822Hospital Admission 1,818 1,572 470 1,612 433 5,905Emergency Room Visits 35,665 30,844 9,217 31,629 8,489 115,845Asthma Attacts 407,486 352,399 105,301 361,373 96,991 1,323,551Lower Resp.Illnesses a/g Children 91,411 79,053 23,622 81,066 21,758 296,909Respiratory Symptoms 27,726,335 23,978,042 7,164,939 24,588,698 6,599,528 90,057,542Chronic Bronchitis 9,272 8,019 2,396 8,223 2,207 30,118NO2Respiratory Symptoms 1,051,763 722,571 412,891 1,071,202 248,108 3,506,535SO2Premature Mortality - - - - - -Respiratory Symptoms a/g Children - - - - - -Chest Discomfort a/g Adult - - - - - -Note:
Unit in number of cases
Table 5.2: Estimated Health Problems Associated with PM10, NO2 and SO2 in 1998

South Jkt East Jkt Central Jkt West Jkt North Jkt Total Total (million IDR) (million IDR) (million IDR) (million IDR) (million IDR) (million IDR) (million USD)
PM10Premature Mortality 93,830 81,145 24,247 83,211 22,334 304,767 30.94Restricted Activity Days 95,509 82,597 24,681 84,701 22,733 310,222 31.49Hospital Admission 1,496 1,294 387 1,327 356 4,860 0.49Emergency Room Visits 4,821 4,169 1,246 4,275 1,147 15,659 1.59Asthma Attacts 10,045 8,687 2,596 8,908 2,391 32,626 3.31Lower Resp.Illnesses a/g Children 1,088 941 281 965 259 3,533 0.36Respiratory Symptoms 329,943 285,339 85,263 292,606 78,534 1,071,685 108.80Chronic Bronchitis 531 459 137 471 126 1,725 0.18NO2Respiratory Symptoms 12,516 8,599 4,913 12,747 2,952 41,728 4.24SO2Premature Mortality - - - - - - -Respiratory Symptoms a/g Children - - - - - - -Chest Discomfort a/g Adult - - - - - - -TOTAL 549,779 473,229 143,751 489,211 130,834 1,786,803 181.40Note:
The USD-IDR conversion in 1998, USD 1 = IDR 9,850
Health Effect
Table 5.3: Estimated Economic Costs associated with PM10, NO2 and SO2 in 1998

Health Effect South Jkt East Jkt Central Jkt West Jkt North Jkt TotalPM10Premature Mortality 2,027 2230 288 2568 780 7,893Restricted Activity Days 11,150,476 12,270,293 1,585,433 14,129,950 4,290,463 43,426,615Hospital Admission 3,619 3,983 515 4,586 1393 14,095Emergency Room Visits 70,994 78,124 10,094 89,964 27,317 276,493Asthma Attacts 811,122 892,581 115,330 1,027,859 312,102 3,158,993Lower Resp.Illnesses a/g Children 181,957 200,231 25,872 230,577 70,013 708,650Respiratory Symptoms 55,190,674 60,733,344 7,847,297 69,937,952 21,236,182 214,945,450Chronic Bronchitis 18,457 20,311 2,624 23,389 7,102 71,883NO2Respiratory Symptoms 2,710,968 2,709,801 680,297 3,703,257 1,350,636 11,154,959SO2Premature Mortality 53 123 89 86 91 441Respiratory Symptoms a/g Children 101 236 170 166 175 849Chest Discomfort a/g Adult 100,799 235,048 169,454 165,157 174,295 844,753Note:
Unit in number of cases
Table 5.4: Estimated Health Problems Associated with PM10, NO2 and SO2 in 2015

STUDY ON AIR QUALITY IN JAKARTA, INDONESIA
42
Figure 5.1 2015 to 1998 Health Impacts Ratio Associated with NO2 and PM10 in Jakarta
0
1
2
3
4
5
6
North East South West Central Total North East South West Central Total
2015
to 1
998
Hea
lth Im
pact
Rat
io
PM10NO2
For the case of NO2, the number of health problems for the whole Jakarta in 2015 is ap-proximately three times the number in 1998. In North Jakarta, the number in 2015 is actu-ally more than five times the 1998 number. SO2 presents an interesting case; it is predicted that no health problems are associated with SO2 in 1998, while in 2015, SO2 is also pre-dicted to cause health problems in Jakarta. Table 5.5 provides the economic costs associated with PM10, NO2 and SO2 in 2015. Figure 5.2 shows the ratio of total economic cost in 2015 to that in 1998. Figure 5.2 shows that the total economic value (cost) of health problems associated with PM10, NO2 and SO2 for the whole of Jakarta in 2015 is approximately 2.4 times the number in 1998. The increase in this total cost is not equal throughout Jakarta. In North Jakarta, the total cost in 2015 is more than three times that in 1998, while in Central Jakarta, the total cost in 2015 is rela-tively the same as the total cost in 1998.
Figure 5.2 2015 to 1998 Total Economic Cost Ratio in Jakarta
0
1
2
3
4
North East South West Central Total
2015
to 1
998
Eco
nom
ic C
ost R
atio

South Jkt East Jkt Central Jkt West Jkt North Jkt Total Total (million IDR) (million IDR) (million IDR) (million IDR) (million IDR) (million IDR) (million USD)
PM10Premature Mortality 186,773 205,530 26,556 236,679 71,866 727,404 67.35Restricted Activity Days 190,116 209,208 27,032 240,916 73,152 740,424 68.56Hospital Admission 2,979 3,278 424 3,775 1146 11,601 1.07Emergency Room Visits 9,596 10,560 1,364 12,160 3,692 37,374 3.46Asthma Attacts 19,994 22,002 2,843 25,337 7,693 77,869 7.21Lower Resp.Illnesses a/g Children 2,165 2383 308 2744 833 8,433 0.78Respiratory Symptoms 656,769 722,727 93,383 832,262 252,711 2,557,851 236.84Chronic Bronchitis 1057 1163 150 1339 407 4,116 0.38NO2Respiratory Symptoms 32,261 32,247 8,096 44,069 16,073 132,744 12.29SO2Premature Mortality 4854 11319 8160 7953 8393 40681 3.77Respiratory Symptoms a/g Children 1 3 2 2 2 10 0.00Chest Discomfort a/g Adult 1200 2797 2017 1965 2074 10053 0.93TOTAL 1,107,764 1,223,216 170,334 1,409,201 438,043 4,348,558 402.64Note:
The USD-IDR conversion used, USD 1 = IDR 10,800
Health Effect
Table 5.5: Estimated Economic Costs associated with PM10, NO2 and SO2 in 2015

CHAPTER 6
Estimated Impact of the Proposed Action Plan
This chapter presents information about the estimated impacts of measures to reduce vehi-cle emissions in order to reduce air pollution. The list of measures was compiled from the proposed action plan formulated by the MEB Forum.11 Characteristics of abatement meas-ures are described in terms of effectiveness in emissions reduction, in both the short-medium term (year 2005) and long term (year 2015), as well as the health and economic impacts.
DIRECT INTERVENTIONS TO REDUCE VEHICLE EMISSIONS Interventions from the proposed action plan are categorized into actions that have either a direct impact or an enabling impact; the former and their effectiveness are discussed here. The proposed interventions that will have a direct impact on reducing Jakarta’s air pollution problem are:
A reduction in sulfur content in fuel A switch in fuel type, i.e. from gasoline or diesel to CNG, LNG, and bio-diesel Implementation of emissions standards for new-type vehicles Introduction of catalytic converters for taxis Improvements in I/M programs for public vehicles Implementation of I/M programs for passenger cars Development of public transport, i.e. improvements to rail-based transport and the implementation of bus rapid transit
Table 6.1 presents the predicted vehicle emission load in tonnage ratio to the predicted base case due to respective measures.
Reduce Sulfur in Fuel Content Reducing the sulfur content in fuel leads to a proportional decline in SO2 emissions. With this measure, PM10 emissions also decrease because a portion of the particulate matter comes from sulfur in fuel. A reduction in sulfur content also enables the implementation of advanced vehicle technology. Before the effectiveness of this measure can be quantified, the MEB forum must state in detail the fuel specification target and time frame.
Fuel Switch Switching from gasoline and diesel to CNG, LPG, and bio-diesel is an effective measure to reduce all transport-related pollutants (NOx, SO2, PM10, CO, THC,). In order to quantify the effectiveness of this intervention, the target vehicle groups and time frame for fuel switches still need to be specified by the MEB forum.
11 The problem summary and detailed list of interventions proposed in the action plan to reduce vehicle emis-sions can be found in the draft discussion document produced for the RETA 5937 Concluding Workshop in Ma-nila, February 28-1March, 2002.

STUDY ON AIR QUALITY IN JAKARTA, INDONESIA
45
2005 2015 2005 2015NOx 83,087 170,014 0.00% 0.00%SO2 6,386 11,885 0.00% 0.00%
PM10 8,874 17,301 0.00% 0.00%CO 1,531,876 3,524,935 0.00% 0.00%
THC 292,230 630,763 0.00% 0.00%NOx 79,907 94,002 3.83% 44.71%SO2 5,945 5,599 6.90% 52.89%
PM10 8,555 10,248 3.60% 40.76%CO 1,435,904 1,736,293 6.26% 50.74%
THC 274,060 288,866 6.22% 54.20%NOx 82,482 168,446 0.73% 0.92%SO2 6,386 11,885 0.00% 0.00%
PM10 8,643 16,703 2.60% 3.45%CO 1,486,556 3,407,472 2.96% 3.33%
THC 285,030 612,102 2.46% 2.96%NOx 83,087 170,014 0.00% 0.00%SO2 6,386 11,885 0.00% 0.00%
PM10 8,874 17,300 0.00% 0.00%CO 1,507,973 3,492,762 1.56% 0.91%
THC 291,022 629,160 0.41% 0.25%NOx 83,087 170,014 0.00% 0.00%SO2 6,386 11,885 0.00% 0.00%
PM10 8,874 17,300 0.00% 0.00%CO 1,353,458 3,062,498 11.65% 13.12%
THC 285,071 612,209 2.45% 2.94%NOx 80,458 125,167 3.16% 26.38%SO2 6,284 9,688 1.60% 18.49%
PM10 8,444 12,618 4.85% 27.06%CO 1,430,511 2,234,972 6.62% 36.60%
THC 275,240 413,945 5.81% 34.37%
Implement I/M program for public vehicle using idle test
Develop public transport
Counter Measures Pollutant
Table 6.1: Vehicle Emission Loads for Respective Countermeasures
Vehicle Emission Load (Ton/Year)
Percentage Reduction to Respective Year Base
Implement I/M program for passenger car using idle test
Base case (without any counter measures)
Establish new-type vehicle emission standard
Introduce catalytic converter to Jakarta's Taxis
Implement New-Type Vehicle Emissions standard Implementation of a new-type vehicle emissions standard will be very effective in reducing all pollutants (NOx, CO, THC, SO2, and PM10) over the long term. Introducing such a new standard will require the infrastructure for producing and distributing unleaded and low sul-fur fuel. According to the draft of the new-type vehicle emissions standard, new vehicles in Indone-sia will harmonize with Euro 1 and Euro 2 standards with effect from 2004 and 2007, re-spectively. Thus, the ratio of vehicles based on control technology were estimated from the vehicle population data from 1990 to 2000 by assuming the vehicle age reached 25 years at the maximum (Appendix 6.1). If the entire vehicle fleet complies with the standard, emis-sions would ultimately be reduced by at least 30% of the 2015 emission load predicted for the base case (Subsection 4.B.2). The effect of these standards will be shown gradually, reflecting the rate of replacement of existing vehicles.
Introduce Catalytic Converters for Jakarta's Taxis Unleaded fuel has only been available throughout Jakarta since July 2001. Therefore, cata-lytic converters will be introduced only to Jakarta's taxis, which have their own fueling sta-

STUDY ON AIR QUALITY IN JAKARTA, INDONESIA
46
tions. The rate of emissions reduction will be influenced by the type of catalytic converter. Assuming all Jakarta's taxis eventually will be modified by the oxidation catalyst (which re-duces CO and THC by more than 50% according to Walsh, 2002A), the 2005 predicted emission load will be reduced by only 2-3 % of the 2005 emission load predicted for the base case. If Jakarta's taxis are modified with catalytic converters by June 2002, the effect will be ob-served immediately. Over the longer term, vehicles modified with catalytic converters will be replaced by more advanced technology vehicles.
Improve Performance of I/M Program for Public Vehicles The I/M program for Jakarta’s public transport is currently conducted in inspection centers (PKB) and uses an idle test that measures CO and THC for gasoline vehicles and smoke for diesel vehicles. Enhancing the performance of this emission control testing will greatly reduce emissions, namely CO, THC, and PM10, over the short-term period. The effectiveness of an I/M program depends on the testing method applied. According to Walsh (2002B), an I/M program using the idle test is predicted to reduce CO and THC emissions by 18% and 5% respectively. The simulation results reveal that the I/M program for public vehicles will not significantly reduce CO and THC emission loads (approximately 1% and 0.5% of the emission load is predicted for CO and THC in the base case). In addition, unless the emission test is performed using a more advanced test, there is no literature available that relates the effectiveness of the smoke test with a quantitative value for a PM10 emission load reduction. For this reason, this study was unable to quantify the impact of PM10 reduction for this specific action.
Implement I/M for Passenger Cars Maladjusted carburetors and fuel injection systems increase vehicle fuel consumption and contribute to high emissions. The effectiveness of an I/M program depends on the testing method being applied. As Jakarta will implement an I/M program using the idle test, the CO and THC emissions are predicted to decrease by 18% and 5% respectively (Walsh, 2002B). In other words, the I/M program for passenger cars will be effective in reducing approximately 2% and 12% of the emission loads predicted for CO and THC in the base case. An I/M program for passenger cars will start in October 2002, and its effectiveness can be expected immediately. In the long-term, vehicles modified with catalytic converters will be replaced by more advanced technology vehicles. However, the rate of replacement of pas-senger cars will be much lower than the taxi replacement rate.
Develop Public Transport Public transport may solve environmental problems caused by the growing demand for transportation, as well as reduce traffic congestion. The target has not been addressed in a specific manner in the proposed action plan. However, a decent public transport system may be able to lower the annual growth rate of passenger cars and motorcycles during the periods 2000 to 2005 and 2006 to 2015 by 0.8 times and 0.5 of the 1999-2000 growth rate. This will result in emissions reductions of 35% for CO and THC and 25% for NOx and PM10 from the 2015 emission load predicted for base case. Building a sound public transport system is a long-term process. Advanced vehicle technol-ogy alone will not solve the air pollution problem faced by Jakarta, due to the city’s high vehicle fleet growth. Therefore, the effectiveness of public transport is key to making a sub-stantial reduction in vehicle emissions over the long term.

STUDY ON AIR QUALITY IN JAKARTA, INDONESIA
47
IMPACTS OF THE COMBINED COUNTERMEASURES ON AIR POLLUTION LEVELS Efforts by multi-stakeholders to formulate the action plan should subsequently be followed by implementation of air pollution abatement measures in order to lower vehicle emissions. Despite the prediction that some of the measures may lead to a significant emissions re-duction compared to the 2015 base case emission load prediction, the 2015 emission loads predicted with countermeasures are still not less than the 1998 load. Consequently, the control target discussed in Section 4.E may not be fully attainable. Based on the MBM simulation, a relatively modest improvement in air quality for parameters NOx, PM10 and CO can be expected in 2015.
HEALTH AND ECONOMIC IMPACTS OF THE COUNTERMEASURES The previous section explained the abatement measures proposed for Jakarta. Among these measures, this study is so far able to estimate only the impact of ambient PM10, NO2 and SO2 in 2015 for four policies. These are (i) the new vehicle emissions standard, (ii) catalytic converters for taxis, (iii) public transportation management and (iv) the combination of these three policies. Hence, the health and economic impacts discussed here relate to these four policies only. Table 6.2 presents the changes in health impacts caused by the four policies. The following example clarifies the way to read the table: The new vehicle emissions standard will pre-vent approximately 5.5 percent of South Jakarta’s health problems associated with PM10 that may occur in 2015. As a result, the new vehicle emissions standard policy is more ef-fective than introducing catalytic converters for taxis and public transportation management policies to reduce the health impacts associated with PM10, NO2 and SO2. In terms of percentages, the reduction in health problems is not the same for all regions in Jakarta (Table 6.2). Take the example of implementation of the new vehicle emissions standard: Central Jakarta’s greatest health benefit comes from a reduction in PM10, while North Jakarta’s arises from NO2 reductions and West Jakarta’s from decreases in SO2. However, in terms of the number of cases, Table 6.3 indicates that the largest reduction in health problems associated with PM10, NO2 and SO2 occurs in West Jakarta. Table 6.4 shows the reduction in health costs associated with implementation of the four abatement policies. The percentage numbers are the percentage reduction in health cost caused by the implementation of an abatement policy compared to the base condition; i.e. no abatement policy. This demonstrates that the new vehicle emissions standard policy is more effective than installing catalytic converters in taxis and public transportation man-agement policies in reducing the health costs associated with PM10, NO2 and SO2. Most health cost reductions occur in West Jakarta. However, in terms of percentage health cost reductions, Central Jakarta benefits most from implementation of these policies.

STUDY ON AIR QUALITY IN JAKARTA, INDONESIA
48
Changes of health effects New Emission Standard
Catalytic Converter
Public Transport
Combine All Policies
North Jakartaassociated with PM10 9.36% 0.79% 6.21% 13.10%associated with NO2 30.34% 0.63% 17.90% 40.15%associated with SO2 29.43% 0.00% 10.29% 29.85%
East Jakartaassociated with PM10 5.90% 0.50% 3.92% 8.29%associated with NO2 27.23% 0.56% 16.07% 36.24%associated with SO2 28.74% 0.00% 10.05% 29.34%
South Jakartaassociated with PM10 5.50% 0.47% 3.65% 7.72%associated with NO2 23.08% 0.48% 13.62% 30.63%associated with SO2 36.58% 0.00% 12.79% 37.17%
West Jakartaassociated with PM10 5.66% 0.48% 3.76% 7.97%associated with NO2 22.01% 0.45% 12.98% 29.36%associated with SO2 40.69% 0.00% 14.22% 41.96%
Central Jakartaassociated with PM10 12.61% 1.07% 8.38% 17.90%associated with NO2 29.94% 0.62% 17.66% 40.27%associated with SO2 17.83% 0.00% 6.23% 18.41%
Total Jakartaassociated with PM10 6.31% 0.53% 4.19% 8.87%associated with NO2 25.03% 0.52% 14.77% 33.31%associated with SO2 29.97% 0.00% 10.48% 30.65%
Table 6.2: Changes in 2015 Health Impacts Caused by the Countermeasures

STUDY ON AIR QUALITY IN JAKARTA, INDONESIA
49
Changes of Respiratory Symptoms
New Emission Standard
Catalytic Converter
Public Transport
Combine All Policies
North Jakartaassociated with PM10 1,987,132 168,388 1,319,305 2,782,241associated with NO2 409,778 8,452 241,769 542,329associated with SO2 51,295 0 17,930 52,020
East Jakartaassociated with PM10 3,582,460 303,576 2,378,481 5,036,244associated with NO2 737,885 15,220 435,352 981,902associated with SO2 67,554 0 23,614 68,967
South Jakartaassociated with PM10 3,036,319 257,296 2,015,885 4,259,706associated with NO2 625,653 12,905 369,135 830,431associated with SO2 36,870 0 12,888 37,465
West Jakartaassociated with PM10 3,957,278 335,338 2,627,331 5,575,760associated with NO2 814,912 16,808 480,798 1,087,162associated with SO2 67,206 0 23,493 69,292
Central Jakartaassociated with PM10 989,926 83,886 657,235 1,404,679associated with NO2 203,656 4,201 120,157 273,951associated with SO2 30,220 0 10,564 31,195
Total Jakartaassociated with PM10 13,553,114 1,148,483 8,998,238 19,058,630associated with NO2 2,791,883 57,586 1,647,210 3,715,774associated with SO2 253,146 0 88,489 258,939
Note:For SO2, it is actually Chest Discomfort among Adult.
Table 6.3: Changes in the Incidence of 2015 Respiratory Symptom Cases Associated with PM10, NO2 and SO2
Proposed Action Plan North Jakarta
East Jakarta
South Jakarta
West Jakarta
Central Jakarta Total Jakarta
46,463 82,257 68,496 90,416 23,421 311,053 (28.80)10.61% 6.72% 6.18% 6.42% 13.75% 7.15%
3,363 6,064 5,139 6,698 1,675 22,940 (2.12)0.77% 0.50% 0.46% 0.48% 0.98% 0.53%29,519 52,688 44,229 58,043 14,800 199,279 (18.45)6.74% 4.31% 3.99% 4.12% 8.69% 4.58%63,491 113,416 94,674 125,143 32,353 429,077 (39.73)
14.49% 9.27% 8.55% 8.88% 18.99% 9.87%Note:
Unit in million IDR and percentages.For total Jakarta, the unit for the figures in the bracket is million USD (USD 1 = IDR 10,800)
Combined Policy
Table 6.4: Reduction in Health Costs caused by the Abatement Policies
New Vehicle Emission StandardCatalytic Converter for TaxisPublic Transportation Management
Table 6.4 also shows that the total health cost reduction that can be achieved in 2015 by implementing all three policies is approximately 429 billion IDR (40 million USD). This re-duction is equal to approximately 13 percent of the Jakarta government’s total revenue in 2000.

CHAPTER 7
Conclusions and Recommendations
CONCLUSIONS This report has presented the results of Jakarta's air quality assessment and predicted the im-pact of proposed countermeasures in reducing Jakarta’s air pollution level with respect to vehi-cle-related pollutants. This assessment has also led to several important findings with respect to the status of current air quality management, which includes the availability of an air pollution related database. Therefore, the overall conclusions of this study are grouped into two broad sections: (i) the status of current air quality management and (ii) the results of Jakarta's air quality assessment.
The Status of Current Air Quality Management Jakarta's air quality is currently evaluated on a regular basis using the results of several ambient monitoring stations. Despite the availability of a dispersion model from previous studies, there is no continuity in utilizing and modifying those dispersion models as air quality management strategy tools for Jakarta, and Indonesia in general. In turn, the absence of air dispersion mod-eling hinders the evaluation of implemented air pollution abatement measures. The main impediments to running a model and obtaining reliable simulation results are as fol-lows:
i. The availability of emissions inventory data. No detailed vehicle emissions inventory is currently available on a regular basis. Nevertheless, there is an effort to publish the NKLD reports that comprise the emissions inventory. The data, however, are hardly enough to perform a simulation using an air dispersion model. In fact, previous studies such as the IAQM collected a tremendous amount of data with respect to emissions inventory.
ii. The source of the model. Most previous studies were performed by various interna-tional counterparts and the sources are not available to Indonesian counterparts. In turn, it is not clear to what extent the models may be modified to keep up with changes.
iii. The availability of the supporting data. The paucity of various supporting data (such as local emission factors for driving modes, ambient air concentrations in the area sur-rounding Jakarta, and meteorology data such as mixing height) is also a drawback in developing an accurate air dispersion model.
These main impediments, in turn, are caused mainly by a lack of coordination among relevant sectors and agencies at national and local level; many sectors and agencies are still facing or-ganizational and structural changes, and a lack of human capacity and funding. However, the analysis of institutional arrangements for air quality management is beyond the scope of this study. Therefore, this subject is not addressed further here.

STUDY ON AIR QUALITY IN JAKARTA, INDONESIA
51
In addition to the aforementioned factors, according to the NKLD (BPLHD DKI, 2000), reducing vehicle emissions is one of the DKI Jakarta government’s policies to improve the overall ambi-ent air quality of Jakarta. However, no further information regarding quantitative targets and a time frame to implement that policy has been made available.
Jakarta's Air Quality Assessment Jakarta's air quality assessment has led to several important and interesting findings as follows:
i. The 1998 ambient air quality monitoring results suggest that NOx, CO and THC are a serious problem in almost all areas of Jakarta. PM10 may be considered a problem in certain areas. SO2 did not present a problem.
ii. The 1998 emission load estimation revealed that motor vehicles are a major contribu-tor of NOx, PM10, CO and THC emissions (more than 70% for each parameter). The prediction for a baseline case shows the total emission load will increase by not less than 1.3 and 2.9 of the 1998 total emission load for both short-medium term (2005) and long-term (2015), respectively, and the vehicle emission shares will also increase for those terms.
iii. In 1998, passenger cars emitted more than 30% of NOx, SO2, PM10, CO and THC. This finding suggests that passenger cars are the major contributor among all vehicle groups, followed by motorcycles which emitted more than 20% of both PM10 and CO, and 40% THC. Trucks released approximately 30% of the NOx, SO2 and PM10 emission load, and buses emitted no more than 20% of all parameters measured.
iv. Based on the carrying capacity of Jakarta's air, this study suggests that if Jakarta plans to meet the DKI AAQS for annual average, the city will need to reduce emissions of NOx up to 50% of the 1998 emission load. This study also suggests reducing PM10, CO, and THC by up to 50% of the 1998 emission load in order to improve Jakarta's air quality. It is critical to note that the measures will be effective in achieving this tar-get only if the area surrounding Jakarta also meets the DKI AAQS, and the emission load from industrial and domestic sources does not extend beyond the assumption set for this study.
v. The implementation of the action plan formulated by the MEB Forum can be expected to lower vehicle emissions. Although some of the measures lead to a significant emis-sions reduction compared to the 2015 base case emission load prediction, the 2015 emission loads predicted with countermeasures are not less than the 1998 load. Con-sequently, the control target mentioned in point (iv) may not be fully attainable. This study estimates that only a relatively modest improvement in air quality for parameters NOx, PM10 and CO can be expected in 2015.
vi. The impact analysis clearly indicates that advanced vehicle technology alone will not solve the air pollution problem faced by Jakarta, due to the city’s high vehicle fleet growth. Therefore, the effectiveness of public transport is key to making a substantial reduction in vehicle emissions over the long-term.
RECOMMENDATIONS Based on the above findings, this study has the following recommendations:
i. To Build a Strong Commitment among the Stakeholders. It is important that all stakeholders realize that the air pollution improvement program is a long-term proc-ess. The type of abatement measures implemented will affect the time required to achieve the target. Some of the most effective measures, such as a stringent emissions standard and a good public transportation system, will show results over a long pe-riod. A strong commitment to support this process is very important.
ii. To Formally Set a Target in Improving Air Quality. It is crucial for Jakarta's gov-ernment to formally set a quantitative target and time frame to reduce vehicle related air pollution based on reliable baseline case assessments. This target will function as a guideline in formulating the vehicle emissions reduction strategy.
iii. To Perform Assessment by Itself. The present study and several previous ones have provided Jakarta's air quality assessment, however it is important for Jakarta's gov-

STUDY ON AIR QUALITY IN JAKARTA, INDONESIA
52
ernment agencies to be able to perform such evaluations by themselves to ensure the sustainability of programs. In conducting this task, it is possible for Jakarta's govern-ment agencies to cooperate with local independent institutions that are able to consis-tently assess Jakarta's air quality from time to time.
iv. To Use an Air Dispersion Model. To be effective in addressing Jakarta’s air pollution problems, the effectiveness of air quality management strategies should be regularly evaluated by introducing an air dispersion model as the air quality management strat-egy tool. Given the present limitation on data availability, to start with, such a disper-sion model should not be too data hungry.
v. To Strengthen the Emissions Inventory. To strengthen the vehicle emissions inven-tory as well as other sources of emissions inventory, special importance should be given to: o Identify the data owners, establish a network and integrate the database struc-
ture among them (such as state police); o Harmonize the database structure with the dispersion model grid.
vi. To Establish a Network with the Surrounding Area Local Governments. As Ja-karta's air quality is very much affected by the air quality of the area surrounding the city, it is necessary to establish an air quality network among the local governments of Jakarta, Bogor, Tangerang, Bekasi and Depok. As a precaution of rapid urban growth in the area surrounding Jakarta, the local governments in those areas should start to develop an air quality management strategy.
vii. To Enhance the Ambient Air Quality Monitoring Network. In terms of number, the ambient air quality monitoring stations in Jakarta are practically sufficient. It is, however, important to maintain the continuity of monitoring data and integrate all monitoring stations. On the other hand, it is recommended that ambient air quality monitoring stations be installed in the area surrounding Jakarta to provide back-ground concentration for Jakarta's air quality simulation, as well as to monitor the air quality of those areas. It is also recommended that the location of the monitoring sta-tions be expressed using a global positioning system.
viii. To Control Air Pollution from Stationary Sources. Although vehicle sources are the major source of air pollution in Jakarta, it is critical to implement an abatement program for the stationary sources.
ix. To Include Air Shed Quality in Land Use Planning. The health impact of air pollu-tion does not depend solely on ambient air quality. In fact, for the same level of ambi-ent air quality, health impacts will be more severe in higher population areas as more people will breathe poor air quality. It is important therefore to take into account air shed quality in formulating a land use plan.
x. To Increase Awareness of Air Pollution Impact. In addition to point (ix), it is also important to systematically increase people’s awareness of the health impact of air pollution. In the short term, this action should focus on reducing the number of peo-ple exposed and the period of exposure to poor air quality. In the long run, such a no-tion is expected to ultimately transform people’s behavior, and encourage the public to actively participate in reducing air pollution (by taking public transport, etc.).
xi. To Initiate Immediately the Formulated Abatement Program. It is also important to realize the urgent need to initiate immediately the abatement program proposed by the MEB Forum before Jakarta’s air pollution problem becomes more severe. The MEB Forum still has to develop the proposed action into a more detailed format. In addi-tion, special importance should be given to the formulation of a comprehensive pro-gram that will ultimately reduce the vehicle fleet.
xii. To Refine the Current Action Plan. In order to be effective in achieving the control target, the current action plan still needs to be refined. However, prior to this process, it is strongly recommended that a quantitative target and time frame be set as sug-gested in point (ii). The improvement may include:

STUDY ON AIR QUALITY IN JAKARTA, INDONESIA
53
o applying a vehicle scrapping program may enhance effective implementation of the new emissions standard, as this will be shown gradually and reflect the rate of replacement of existing vehicles;
o all commercial vehicles should be equipped with more advanced vehicle tech-nologies that necessarily go beyond Euro 2; and
o a more stringent emissions standard should be set for motorcycles, especially to address THC emissions.
xiii. To Conduct Further Research. This study has indicated several areas that need further research, including: o How to derive a local emission factor under various driving modes o How to establish a database network related to air pollution

STUDY ON AIR QUALITY IN JAKARTA, INDONESIA
54
REFERENCES _____. Analisis Resiko Efek Pencemaran Udara CO dan Pb terhadap Penduduk Jakarta.
Department of Public Health Working Papers, University of Indonesia, 1989. (In Indo-nesian).
_____. An Assessment of the Environmental Impact of Air Pollution, Jakarta, Indonesia. Paper presented in the Workshop on Urban Air Quality, May 26-27, 1994, Jakarta, In-donesia.
_____. Indonesia. Environment and Development: Challenges for the Future. Report No. 12083-IND, World Bank. 1994.
_____. Potensi Desa DKI Jakarta 1995, BPS, 1995. _____. The Study on the Integrated Air Quality Management for Jakarta Metropolitan Area.
Final Report Volume I Main Report, JICA and Bapedal. 1997A. _____. The Study on the Integrated Air Quality Management for Jakarta Metropolitan Area.
Final Report Volume II Supporting Report, JICA and Bapedal. 1997B. _____. Jakarta dalam Angka 1999, BPS, 1998. _____. Jakarta dalam Angka 1999, BPS, 1999. _____. Jakarta dalam Angka 2000, BPS, 2000. _____. Guidelines for Air Quality. WHO. 2000. _____. Neraca Kualitas Lingkungan Hidup Daerah DKI Jakarta Tahun 2000. Buku I,
BPLHD DKI Jakarta, 2000. Achmadi, U.F. Efek Pencemaran Pb (Timah Hitam) pada Siswa Sekolah Dasar Terpilih di
Jakarta. Department of Public Health Working Papers, University of Indonesia, 1981. (In Indonesian).
BPPT and Forschungszentrum Jülich GmbH (KFA). Environmental Impact of Energy Strategies for Indonesia. Final Summary Report, BPPT. 1993.
Chestnut, L.G., B.D. Ostro, and N.V. Vadakan. Transferability of Air Pollution Control Health Benefits Estimates from the United States to Developing Countries: Evidence from the Bangkok Study.” American Journal of Agricultural Economics, 79, pp.1630-1635. 1997.
Loedin, L. Pemantauan Kualitas Udara di Propinsi DKI Jakarta. Paper Presented in Inte-grated Vehicle Emission Reduction Strategy Workshop, October 16-18, 2001, Jakarta, Indonesia.
Nurrohim, A., M.S. Boedoyo, and C. Malik. Technological Options of Air Pollution Abate-ment, Costs, and Benefits. Internal Report, BPPT. 1994.
Ostro, B. Estimating the Health Effects of Air Pollutants: A Method with an Application to Jakarta. Policy Research Working Paper No. 1301, World Bank. 1994.
Purwanto, E. Kualitas Bahan Bakar dan Pemantauan Bahan Bakar untuk Kendaraan Ber-motor Pasca 1 Juli 2001. Paper Presented in Integrated Vehicle Emission Reduction Strategy Workshop), October 16-18, 2001, Jakarta, Indonesia.
Rasudin, Y. and F. Harwati, Jaringan Pemantauan Kualitas Udara Ambien. Paper Pre-sented in Integrated Vehicle Emission Reduction Strategy Workshop, October 16-18, 2001, Jakarta, Indonesia.
Resosudarmo, B.P. The Impact of Environmental Policies on A Developing Economy: An Application to Indonesia. Unpublished Ph.D. dissertation, Cornell University. 1996.
Resosudarmo, B.P. and E. Thorbecke. The Impact of Environmental Policies on Household Incomes for Different Socio-Economic Classes: The Case of Air Pollutants in Indone-sia. Ecological Economics, 17, pp.83-94. 1996.
Shah J.J and T. Nagpal (ed.). Urban Air Quality Management Strategy in Asia: Jakarta Re-port. Technical Paper No. 379, World Bank. 1997.
Soedomo, M., K. Usman, and M. Irsyad. Analisis dan Prediksi Pengaruh Strategi Pengen-dalian Emisi Transportasi Terhadap Konsentrasi Pencemaran Udara di Indonesia: Studi Kasus di Jakarta, Bandung dan Surabaya. ITB. 1991. (In Indonesian).
STUDY ON AIR QUALITY IN JAKARTA, INDONESIA
55
Soedomo, M. Kumpulan Karya Ilmiah mengenai Pencemaran Udara. Penerbit ITB, Band-ung. 2001.
Supalal, Y.A. Air Quality in Jakarta - Indonesia. Unpublished Masters Thesis, TU-Graz. 2001.
Sutamihardja, R.T.M. Air Quality Management. Paper presented in the Workshop on Urban Air in Jakarta, May 26-27, 1994, Jakarta, Indonesia.
Tomo, H.S. Pengembangan Database Berbasis Couple System untuk Pendukung Kebija-kan Pengelolaan Kualitas Udara dari sektor Transportasi, Studi Kasus Program Pe-meriksaan dan Perawatan Jakarta. Unpublished Master Thesis, ITB. 2001. (In Indone-sian)
Tomo, H.S, S.B. Nugroho, S.M.F. Syahril. The Preliminary Study to Develop Ambient Air Quality Estimation Guidelines for Kabupaten in Indonesia. Paper presented in the En-vironment Technology and Management Seminar in Bandung, January 9-10, 2002. (In Indonesian)
Tri-Tugaswati, A., S. Suzuki, H. Koyama, and T. Kawada. Health Effects of Automotive Lead Air Pollution in Jakarta. Asia-Pacific Journal of Public Health, 1, pp. 23-27. 1987.
Tri-Tugaswati, A., Sukar, A. Anwar, and S.S. Soesanto. “Air Quality Monitoring in Rawasari and Pulogadung, Jakarta. Buletin Penelitian Kesehatan, 24, pp. 1-10. 1996.
United Nations Environment Programme. Environmental Data Report. New York: Blackwell, 1992 and 1994.
Walsh, M.P. Motor Vehicle Emission Inventory Model. 2002A. Walsh, M.P. Inspection and Maintenance Reductions. 2002B. World Bank. Indonesia. Energy and the Environment: A Plan of Action for Pollution Con-
trol. Report No. 11871-IND, World Bank. 1993.

STUDY ON AIR QUALITY IN JAKARTA, INDONESIA
56
APPENDIX 1
APPENDIX 1.1. DATA REQUIREMENTS AND SOURCES Data requirements Data Sources Ambient air quality monitoring • Ambient air quality standard BPLHD-DKI, Bapedal, WHO, US-EPA • Ambient air quality monitoring results BPLHD-DKI Industrial source • Emission load from industrial source
in1995 IAQM
• Regional gross domestic product in 1995-1998
BPS
• Land use distribution for industries Jakarta dalam angka 1998 (BPS) Domestic source • Population in 1998 BPS • Emission factor in 1995 IAQM Vehicle source • Vehicle population Ditlantas POLRI • Origin and destination matrices in
1995 IAQM
• Emission factors Walsh (2002A), IAQM • Fuel characteristics IAQM, Purwanto (2002) • Running kilometers per vehicle per
year IAQM
• Engine type composition IAQM • Travelling speed IAQM • Emissions standard for idle mode Bapedal • I/M Program for public transport DLLAJ • Effectiveness of I/M program Walsh (2002B) Health and economic impact analysis • Methodology Ostro (1994), Nurrohim et.al. (1994),
Resosudarmo (1996), Resosudarmo et.al. (1996), Chesnut et. al. (1997).
• Ambient air quality in 1998 and 2015 Technical assessment results • Population in 1998 BPS • Health cost Primary survey Multi box model Tomo (2001), Tomo et.al. (2002) • Grid area Map of Jakarta • Meteorology BPLHD-DKI Jakarta

STUDY ON AIR QUALITY IN JAKARTA, INDONESIA
57
APPENDIX 2
APPENDIX 2.1. POPULATION OF JAKARTA BY DISTRICT IN 1998 Municipality District PopulationNorth Jakarta* Penjaringan 240,794 Pademangan 184,622 Tanjung Priok 450,831 Koja 327,971 Kelapa Gading 149,589 Cilincing 322,675 East Jakarta Pasar Rebo 169,803 Ciracas 198,265 Cipayung 136,825 Makasar 220,178 Kramat Jati 254,503 Jatinegara 367,734 Duren Sawit 381,051 Cakung 263,218 Pulo Gadung 343,376 Matraman 271,448 South Jakarta Jagakarsa 192,917 Pasar Minggu 252,336 Cilandak 208,924 Pesanggrahan 178,411 Kebayoran Lama 308,297 Kebayoran Baru 194,654 Mampang Prapatan 142,705 Pancoran 163,118 Tebet 289,622 Setia Budi 177,417 West Jakarta Kembangan 193,129 Kebon Jeruk 276,378 Palmerah 317,143 Grogol Petamburan 345,048 Tambora 446,819 Taman Sari 252,830 Cengkareng 321,627 Kalideras 225,425 Central Jakarta Tanah Abang 140,887 Menteng 95,633 Senen 104,811 Johor Baru 87,923 Cempaka Putih 73,463 Kemayoran 194,957 Sawah Besar 116,820 Gambir 96,005 Note:*) Excluding Pulau Seribu district Source: BPS, 1999.

STUDY ON AIR QUALITY IN JAKARTA, INDONESIA
58
APPENDIX 2.2. COMPARISON BETWEEN THE URBAIR AND IAQM STUDIES
Items URBAIR IAQM Study Area Jakarta Jabotabek Data Sources Secondary Primary & Secondary AAQM Data Year 1982 - 1992 Year 1996
Pollutant Source Industrial Domestic Vehicle
Industrial Domestic Mobile (incl. ships & aircraft)
Air Quality Simulation KILDER by NILU SURASH by JICA • Current Year 1992 Year 1995 • Future Not available Year 2010

STUDY ON AIR QUALITY IN JAKARTA, INDONESIA
59
APPENDIX 3
APPENDIX 3.1. BMG AIR QUALITY MONITORING ACTIVITIES
City NO2 SO2 TSP O3 Acid Rain
Lhokseumawe √ √ Medan √ √ Pekanbaru √ √ Jakarta √ √ √ √ √ Jambi √ √ Palembang √ √ Tanjungkarang-Lampung √ √ Bengkulu √ √ Citeko √ √ Bandung √ √ Pontianak √ √ Surabaya √ √ Denpasar √ √ Mataram √ √ Kupang √ √ Banjarbaru √ √ Palangkaraya √ √ Winangun-Manado √ √ Sam Ratulangi-Manado √ √ Palu √ √ Ambon √ √ Baubau, Sulawesi Tengah √ √ Jayapura √ √ Tangerang √ Semarang √ Cilacap √ Tabing, Padang √ Biak √

STUDY ON AIR QUALITY IN JAKARTA, INDONESIA
60
APPENDIX 3.2. ALLOCATION OF AMBIENT AIR QUALITY MONITORING STATIONS
No City Fixed Station
Mobile Station RC/MC Data
Display 1 Bapedal - 1 MC 1 2 DKI Jakarta 5 1 RC 5 3 Bandung 5 1 RC 5 4 Semarang 3 1 RC 3 5 Surabaya 5 - RC 5 6 Denpasar 3 1 RC 5 7 Medan 4 1 RC 4 8 Pekanbaru 3 1 RC 1 9 Palangkaraya 3 1 RC 1 10 Jambi 1 - - - 11 Pontianak 1 - - -
Total 33 9 30 Source: Rasudin and Harwati, 2001
APPENDIX 3.3. PSI INDEX*
PSI24-hour PM10 24-hour SO2 8-hour CO 1-hour O3 1-hour NO2
50 50 80 5 120 (2) 100 150 365 10 235 (2) 200 350 800 17 400 1,130 300 420 1,600 34 800 2,260 400 500 2,100 46 1,000 3,000 500 600 2,620 58 1,200 3,750
Note: Values are based on the atmospheric conditions of temperature 25C and pressure 1 atm.No PSI can be reported for low concentration on short exposure time.*) According to Head of Bapedal Decree No. 107 (1997).
Parameter (in microgram per cubic meter of air)

STUDY ON AIR QUALITY IN JAKARTA, INDONESIA
61
APPENDIX 4
APPENDIX 4.1. METHODOLOGY TO ESTIMATE EMISSION LOAD
Emissions Load from Industrial Sources The total emissions load from industrial sources was predicted as follows:
1995,1995,,,,, RGDP
RGDPxEE y
totalpitotalypi = (App. 4.1)
where: Ei,p,y,total (ton/year) : total emissions load from industrial sources for pollutant p, in year y Ei,p,1995,total (ton/year) : total emissions load from industrial sources for pollutant p, in 1995 RGDPy : Jakarta's regional gross domestic product in year y RGDP1995 : Jakarta's regional gross domestic product in 1995 p : pollutant index (THC, CO, NOx, PM10, SO2) y : estimated year index The estimated results of total emissions from industrial sources are tabulated in Table App. 4.1.
Table App. 4.1 Total Emissions from Industrial Sources
Year RGDPy/RGDP1995 NOx PM10 SO2
1995* 1.00 21,510 2,336 20,879 1998 0.94 20,219 2,196 19,626 2005 1.30 27,963 3,037 27,142 2015 3.07 66,035 7,171 64,098
*Total emission load from industrial sources in 1995 referred to the IAQM. The emission load served as input data for the MBM (Appendix 4.2). Therefore, the emis-sion load from each source must be calculated for each grid. The emissions load from in-dustrial sources for each grid was normalized as follows:
[ ]∑=
=
= nx
xixk
ixkktotalypixypi
DA
DAFEE
1,
,,,,,,,
*
*** (App. 4.2)
where: Ei,p,y,x (ton/year) : emissions load from industrial sources for pollutant p, in year y, in grid x Ei,p,y,total (ton/year) : total emissions load from industrial sources for pollutant p in year y Fk : fraction of land use for industry in municipality k Ax : area of grid x, in municipality k Di : dummy for content of any industrial source p : pollutant index (THC, CO, NOx, PM10, SO2) y : estimated year index k : municipality index (north, east, south, west, centre) x : grid index (x=1 to x=23)

STUDY ON AIR QUALITY IN JAKARTA, INDONESIA
62
Land use distribution for industries in each Jakarta municipality is presented in Table App. 4.2.
Table App. 4.2 Land Use Distribution for Iindustries in Each Jakarta Municipality
Municipality PercentageNorth Jakarta 42.9%East Jakarta 22.5%South Jakarta 7.5%West Jakarta 12.8%Centre Jakarta 14.3%Sum 100.0% Source: Jakarta dalam angka 1998
Emissions Load from Domestic Sources The total emissions load from domestic sources was predicted as follows:
pdyypd EFxPE ,,, = (App. 4.3)
where: Ed,p,y (ton/year) : emissions load from domestic sources for pollutant p, in
year y Py : population in year y EFd,p (ton/cap/year) : emission factor for domestic sources of pollutant p p : pollutant index (THC, CO, NOx, PM10, SO2) y : estimated year index The emission factor for domestic sources was derived from the IAQM (Table App. 4.3). The estimated results of total emissions from domestic sources are tabulated in Table App. 4.4.
Table App. 4.3
Emission Factor for Domestic Sources
Parameter NOx SO2 PM10 Unit: Ton/Cap/Year 2.459E-04 2.095E-04 3.173E-05
Source: IAQM
Table App. 4.4 Total Emissions from Domestic Sources
Year Population NOx PM10 SO2
1998 9,680,183 2,380 307 2,028 2005 10,966,474 2,696 348 2,297 2015 13,024,237 3,202 413 2,728

STUDY ON AIR QUALITY IN JAKARTA, INDONESIA
63
The emissions load from domestic sources for each grid was normalized as follows:
∑=
=
= nx
xx
xtotalypdxypd
A
AEE
1
,,,,,, * (App. 4.4)
where: Ed,p,y,x (ton/year) : emissions load from domestic sources in grid x, for pollutant
p, in year y Ed,p,y,total (ton/year) : total emission load from domestic sources for pollutant p in
year y Ax : area of grid x p : pollutant index (THC, CO, NOx, PM10, SO2) y : estimated year index x : grid index (x=1 to x=23)
Emissions Load from Vehicle Sources The emissions load from each vehicle fleet category was estimated as follows:
6),(
,,),( 10pcv
ycypcvEF
xVKTE = (App. 4.5)
where: Ev(c),p,y (ton/year) : emissions load from vehicle sources (category c) for
pollutant p in year y VKTy(c),y (km/year) : vehicle kilometer travel of vehicle category c in year y EFv(c),p (gram/km) : emissions factor for vehicle sources (category c) of
pollutant p p : pollutant index (THC, CO, NOx, PM10, SO2) y : estimated year index c : vehicle category
Vehicle Category Parameters that influence emission factors are engine type and vehicle utilization, and ex-haust gas categories for motorcycles. Therefore, the RETA 5397 study divided vehicle groups into four major categories by Ditlantas Polri (passenger cars including taxis, trucks, buses and motorcycles) and these were further divided into seventeen categories, as tabu-lated in Table 4.1. The normalization factors were also tabulated in Table 4.1.
Vehicle Kilometer Travel The vehicle kilometer travel was estimated as follows:
yccyc CODVKTVKT ,1995,, *= (App. 4.6)
Motorized vehicle trips for origin and destination (OD) matrices were divided into three categories: passenger cars including motorcycles, trucks and buses. Vehicle trips are rep-resented in passenger car units (pcu), with a passenger car equivalent to 1.00 pcu, a truck to 2.22 pcu, and a bus to 1.50 pcu. Total generated and attracted trips in 1995 are pre-sented in Table App. 4.5. Then, the OD categories were converted into Ditlantas Polri's categories as follows:

STUDY ON AIR QUALITY IN JAKARTA, INDONESIA
64
Table App. 4.5 Origin and Destination Matrices in 1995
Trip Generation Trip Attraction No Pass (incl. MC) Truck Bus No Pass (incl. MC) Truck Bus
1 64176 2085 9952 1 76643 2096 113732 28960 1914 4578 2 34447 1924 52553 49144 1821 7612 3 57292 1828 90164 84298 2442 13223 4 81042 2446 127985 30340 1335 4543 5 41528 1349 62176 51515 1369 8355 6 52734 1353 92727 52724 1240 8565 7 51553 1248 84568 33939 1478 5959 8 32743 1487 64319 52558 1751 7842 9 64489 1735 8819
10 78411 2657 12305 10 88430 2697 1352911 45282 2282 7236 11 48116 2320 721712 58195 2005 9026 12 67202 1990 1011613 19150 1828 2628 13 23962 1817 325914 111542 6750 20913 14 115232 6761 2043015 66154 4646 10550 15 73332 4642 1098816 68133 3212 11416 16 70128 3226 1118117 52088 1380 8439 17 49371 1386 796818 73147 2257 11391 18 71124 2291 1101719 58104 3029 9529 19 61225 3319 944120 23195 7267 3545 20 27746 7276 389821 30538 5020 4555 21 34853 5019 494922 33226 5022 5394 22 36519 5018 566823 55223 2173 9931 23 58302 2174 993024 66068 5724 12968 24 63392 5645 1209725 105195 4318 19545 25 99404 4340 1826626 56128 2962 11093 26 53698 2887 1016527 30016 2525 5420 27 29798 2532 515428 31563 1422 5781 28 30380 1419 550729 66558 1958 11132 29 67936 1948 1142030 19548 2090 3438 30 19663 2107 337731 34460 3325 5900 31 33627 3306 557732 58975 2347 10061 32 58089 2363 980433 49660 2010 8776 33 48221 1977 935534 90508 2243 15236 34 91887 2224 1566035 33832 1521 5795 35 32851 1538 531936 98184 2123 14959 36 115860 2116 1733537 77222 2675 12261 37 82499 2677 1242938 42832 2899 6632 38 51131 2883 827039 28879 1532 4484 39 28020 1561 454340 25377 2753 3959 40 30154 2760 443741 55104 1883 9285 41 53101 1793 918742 35532 1721 5903 42 34323 1761 596043 21223 2065 3406 43 24257 2009 365544 44750 3569 7997 44 46420 3547 783145 63172 3901 10864 45 62683 3889 10672

STUDY ON AIR QUALITY IN JAKARTA, INDONESIA
65
46 27569 1162 4712 46 25832 1163 432147 68073 2828 10798 47 81771 2811 1317248 45132 2464 7873 48 42709 2396 751749 36768 828 6477 49 35028 851 619850 39743 1120 7122 50 36784 1120 673951 32687 1360 5878 51 31159 1350 575752 28458 3520 5051 52 29613 3495 505153 31859 1844 5685 53 29718 1849 538154 44624 1753 8307 54 44215 1717 866655 38021 1212 6855 55 35476 1222 666256 43026 1466 7729 56 41479 1440 775157 27161 1003 5353 57 24244 1007 522158 13915 734 2729 58 12830 712 284659 60217 1481 10386 59 59144 1528 1075660 63783 1979 10159 60 70355 1963 1129561 125124 6091 20392 61 127065 6073 2214962 47398 2289 7833 62 44181 2275 773863 33171 1556 5810 63 35317 1595 563164 49183 1288 8929 64 47024 1261 841265 48740 1509 8936 65 46860 1544 921566 59451 1092 10472 66 52379 1114 975267 36529 1469 6313 67 36516 1400 660568 28552 1146 4672 68 26132 1180 479969 37327 1175 7040 69 33799 1147 653370 18538 2301 3099 70 23099 2309 331671 49238 4380 8872 71 51542 4340 844972 34186 1231 6017 72 32772 1240 592373 32300 2851 6198 73 33811 2823 654474 65415 1228 11807 74 59535 1212 1102775 43801 2438 8675 75 40245 2451 781276 17779 2064 3496 76 17765 2050 3251
Bogor 1990227 18625 372420 Bogor 1901859 18634 358818Tangerang 632316 20901 117326 Tangerang 668458 20907 118656
Bekasi 1862935 37646 344462 Bekasi 1814012 37702 344872Source: IAQM Note: Conversion of No. to Grid (Summation)
Grid No Grid No
11 13,14,15 33 47,48,56 12 16,17,18,20,21,23 34 38,39,40,43,46 13 19,22 35 41,42,44,45 21 64,71 36 54,55,57,58 22 61,63,70 41 24,25,26 23 59 42 32,33,34 24 65,66 43 27,28,29,30,31 25 60.62 44 2,3,35,36,37 26 67,68,69,72,73 51 1,9,10 27 74,75,76 52 11,12 31 50.53 53 4,5,6,7,8 32 49,51,52

STUDY ON AIR QUALITY IN JAKARTA, INDONESIA
66
1995,1995,
1995,1995,1995, *
mccarpass
carpasscarpasscarpass VV
VODDCO
+= (App. 4.7)
22.21995,
1995,truck
truckOD
DCO = (App. 4.8)
50.11995,
1995,bus
busOD
DCO = (App. 4.9)
1995,1995,
1995,1995,1995, *
mccarpass
mccarpassmc VV
VODDCO
+= (App. 4.10)
The converted OD for year y was estimated as follows:
)1995()(1995,, )1(* −+= y
gvgyg rCODCOD (App. 4.11)
The converted OD categories that still followed the Ditlantas Polri categories were normal-ized into RETA 5397 categories as follows:
1995),,(,, * cgvygyc FCODCOD = (App. 4.12)
The vehicle utilization for each vehicle category was derived from the IAQM (Table App. 4.6).
Table App. 4.6
Vehicle Utilization in 1995
(Unit in km/vehicle/year) Passenger Car Private 3,945 Taxi 2,068 Truck Micro 17,087 Large 13,322 Bus Micro 1,934 Large 1,845 Motorcycle All 959
Source: IAQM

STUDY ON AIR QUALITY IN JAKARTA, INDONESIA
67
Emission Factor The estimations of pollution load for a baseline case requires the emission factor for local driving mode. Due to lack of those data, the emission factors are set based on Walsh (2002A) and the IAQM (Table App. 4.7).
i. Emission Factor for CO, THC, NOx and PM10 Emission factors for CO, THC, NOx and PM10 (in unit gram/kilometer)
ii. Emission factor for SO2 SO2 emission factors are derived from fuel economy with fuel sulfur content as follows:
10003264
100% xxSGxSxFCEF SOxdr = (App.
4.13) where: EFdr SOx (g/km) : Emission factor for SO2 under driving conditions
(Table App. 4.7)
FC (liter/km) : Fuel consumption (the IAQM)
% S (%) : Sulfur content (Purwanto, 2001)
SG (g/cm3) : Specific gravity (the IAQM)
The emissions load from vehicle sources for each grid was normalized as follows:
∑=
=
= nx
xxyc
xyctotalypcvxypcv
COD
CODEE
1,,
,,,,),(,,),( * (App. 4.14)
where: Ev(c),p,y,x (ton/year) : emission load from vehicle sources (category c), for pollut-
ant p, in year y, in grid x Ev(c),p,y,total (ton/year) : total emission load from vehicle sources (category c), for
pollutant p in year y CODc,y,x : converted OD for vehicle categories c, in year y, in grid x p : pollutant index (THC, CO, NOx, PM10, SO2) y : estimated year index x : grid index (x=1 to x=23)
Emission Load from All Sources
xypvxypdxypiy,xp, EEEE ,,,,,,,,, ++= (App. 4.15)

Table App. 4.7 Emission Factors
(Unit in gram/kilometer) LDGV Walsh (2002A)
Type Technology Uncontrolled bef. July 2001
Uncontrolled aft. July 2001
Engine Mods Ox Cats Euro 1Step 2
Euro 2Step 3
Euro 3 Euro 4
THC 8.375 8.375 4.174 3.616 1.203 0.697 0.576 0.122 CO 59.546 59.546 37.261 26.677 13.738 13.686 13.499 2.851 NOx 2.138 2.138 2.701 2.024 0.975 0.544 0.327 0.174 PM10 0.081 0.081 0.081 0.044 0.025 0.012 0.001 0.001 SO2 0.031 0.017 0.017 0.017 0.017 0.017 0.017 0.010
LDGT2 Walsh (2002A)
Type Technology Uncontrolled bef. July 2001
Uncontrolled aft. July 2001
Engine Mods Ox Cats Euro 1Step 2
Euro 2Step 3
Euro 3 Euro 4
THC 13.441 13.441 8.309 7.766 1.662 1.259 1.074 0.172 CO 72.762 72.762 53.577 52.798 20.310 17.800 12.460 3.064 NOx 3.382 3.382 4.005 3.163 1.165 1.055 0.633 0.337 PM10 0.124 0.124 0.124 0.056 0.044 0.016 0.001 0.001 SO2 0.022 0.012 0.012 0.012 0.012 0.012 0.012 0.007
LDDV Walsh (2002A)
Type Technology Uncontrolled bef. July 2001
Uncontrolled aft. July 2001
Engine Mods Ox Cats Euro 1Step 2
Euro 2Step 3
Euro 3 Euro 4
THC 1.253 1.253 0.331 0.165 0.165 0.165 0.116 0.066 CO 2.414 2.414 0.924 0.974 0.974 0.974 0.584 0.487 NOx 1.148 1.148 0.698 0.526 0.526 0.526 0.368 0.210 PM10 0.435 0.435 0.373 0.186 0.186 0.186 0.112 0.056 SO2 0.538 0.435 0.435 0.435 0.435 0.068 0.048 0.007
LDDT Walsh (2002A)
Type Technology Uncontrolled bef. July 2001
Uncontrolled aft. July 2001
Engine Mods Ox Cats Euro 1Step 2
Euro 2Step 3
Euro 3 Euro 4
THC 1.082 1.082 0.529 0.421 0.421 0.421 0.295 0.168 CO 1.929 1.929 1.095 1.192 1.192 1.192 0.715 0.596 NOx 1.707 1.707 0.842 0.964 0.964 0.964 0.675 0.482 PM10 0.559 0.559 0.435 0.205 0.205 0.205 0.123 0.062 SO2 0.676 0.547 0.547 0.547 0.547 0.085 0.060 0.009

HDDV Walsh (2002A)
Type Technology Uncontrolled bef. July 2001
Uncontrolled aft. July 2001
Engine Mods US91/Euro 1 Step 2
US94/Euro 2Step 3
US98/Euro 3 US 04/ Euro 4 US 07/'Euro 5
THC 2.145 2.145 1.460 0.437 0.438 0.306 0.214 0.214 CO 10.284 10.284 7.858 7.707 7.703 5.392 3.774 3.774 NOx 14.520 14.520 9.661 8.080 2.811 1.968 1.377 0.843 PM10 1.243 1.243 1.212 0.609 0.298 0.249 0.050 0.019 SO2 1.945 1.573 1.573 1.573 0.246 0.172 0.025 0.025
MC All Modified from the IAQM
Type Technology Uncontrolled bef. July 2001
Uncontrolled aft. July 2001
Step 1 Step 2 Step 3
THC 12.110 12.110 10.855 4.596 2.596 CO 34.510 34.510 34.510 26.499 11.136 NOx 0.404 0.404 0.404 0.404 0.404 PM10 0.205 0.205 0.205 0.205 0.205 SO2 0.015 0.008 0.008 0.008 0.008

STUDY ON AIR QUALITY IN JAKARTA, INDONESIA
70
APPENDIX 4.2. DISPERSION MODEL The Gaussian Plume model developed in the URBAIR and IAQM studies as an air quality management strategy tool is commonly used to gain excellent calculation accuracy in the prediction of air pollution levels. Unfortunately, there are situations in which the Gaussian Plume model is impracticable, such as in this case where many district authorities in Indo-nesia (Jakarta included) face a lack of emissions inventory data and sophisticated meteoro-logical data. Consequently, in the present study, the ambient air quality calculations are based on the MBM that were initially developed to support implementation of inspection and maintenance programs in Jakarta by Tomo, 2001. Considerable modifications were made to the MBM prior to use for the RETA 5397 study. To compute the air pollutant concentration using the MBM, the following major simplifying assumptions applied:
The concentration in each cell or box is considered uniform. No diffusion inside and between the boxes is assumed. Steady state condition (flow and emission rates and wind speed and direction are in-dependent of time).
Thus, the pollutant concentration for each grid can be calculated by solving this general formula:
∑∑ += outrateFlowinrateFlow0 (App. 4.16)
Two kinds of pollutant flow rates into the system are (i) the flow rate of a pollutant into the upwind side of the grid and (ii) the flow rate of a pollutant emitted by the grid into the lower boundary of the system. The only way a pollutant leaves the system is by flow out through the downwind face. To depict the actual condition, the calculation for each grid should be performed for the same time frame data, such weekday, duration, etc. Calculation of ambient air quality was conducted as in the following procedure:
Grid Definition Calculating the grid area according to previous studies in administrative boundaries Grid definition also mentions the length of interface to meet 16 wind directions.
Wind Influence Based on wind roses analysis from meteorology monitoring. Wind data are compiled in 16 directions, including calm wind conditions. Calculating geometric mean of wind value of each direction.
Mixing Height Assumption Mixing heights of each grid are assumed from the atmospheric stability in Jakarta.
Calculation of the Area of Interface Interaction among Grids Based on the length of interface and mixing height.

STUDY ON AIR QUALITY IN JAKARTA, INDONESIA
71
Calculation of Ambient Air Quality
∑=
+=16
1161
iTiT C
QEaC (App. 4.17)
a : Percentage of calm wind E : Total emissions per parameter of grid Q : Air rate according to wind and interaction area of each direction CT : Total concentration i : Number of wind directions Calculation of all grids will be stopped if the iterations reach 5000 calculation steps or have an error up to 0.0001. It is verified by changing outer Jakarta concentration input to meet air quality monitoring data at the same grid location.

Appendix 4.3: Estimated BackgroundC t ti(i) Ambient air quality standardParemeter NOx SO2 PM10 THC CO*)Averaging Time Annual Annual Annual 3-HourType of AAQS DKI DKI US-EPA DKI EstimatedAnnual DKI AAQS 60 60 50 160 2500(ii) Category 1-- Estimated background concentration in 1998Boundary NOx SO2 PM10 THC COJava Sea 1.0 0.000 50 50 1500Bekasi 50.0 0.010 110 160 1500Bogor 5.0 0.000 50 160 500Tangerang 230.0 0.010 180 80 2300(iii) Category 2 -- Estimated background concentration in 1998, if the background complied with the AAQS**)Boundary NOx SO2 PM10 THC COJava Sea 1.0 0.000 50 50 1500Bekasi 50.0 0.010 50 160 1500Bogor 5.0 0.000 50 160 500Tangerang 60.0 0.010 50 80 2300(iv) Category 3 -- Estimated background concentration in 2015***)Boundary NOx SO2 PM10 THC COJava Sea 1.3 0.000 65 65 1950Bekasi 65.0 0.013 143 208 1950Bogor 6.5 0.000 65 208 650Tangerang 299.0 0.013 234 104 2990(v) Category 4 -- Estimated background concentration in 2015, if the background complied with the AAQS****)Boundary NOx SO2 PM10 THC COJava Sea 1.3 0.000 50 65 1950Bekasi 60.0 0.013 50 160 1950Bogor 6.5 0.000 50 160 650Tangerang 60.0 0.013 50 104 2500Note: Unit in microgram per cubic meter of air *) No DKI, WHO or US-EPA AAQS is available. The value stated here was estimated from historical air quality data of Jakarta. **)The concentrations that exceeded the AAQS in part (ii) were assumed to be the same as the AAQS specified in part (i). ***)The concentration in 2015 was assumed to be 1.3 times concentration in1998 ****)The concentrations that exceeded the AAQS in part (iv) were assumed to be the same as the AAQS specified in part (i).

STUDY ON AIR QUALITY IN JAKARTA, INDONESIA
73
APPENDIX 5
APPENDIX 5.1. METHODOLOGY TO ESTIMATE HEALTH IMPACTS This work uses the same methodology in estimating health impacts of air pollutants as the one employed by Ostro (1994). Health impacts of air pollutants are estimated using dose-response functions. A dose-response function is a formula to calculate the number of peo-ple, in a certain area, that contract a certain health problem, since these people are ex-posed to an air pollutant concentration above an air quality standard. The general form of these dose-response functions is: dHi = bi · POPi · dA (App. 5.1) where:
dHi is the number of people that contract health effect i or number of cases of health prob-lem i.
bi is the slope of the dose-response function.
POPi
is the population within the polluted area under consideration, i.e. the population at risk for health effect i.
dA is the ambient level of a certain air pollutant in the area under consideration above the WHO air quality guidelines.
These dose-response functions collected by Ostro are derived from epidemiological studies in United States cities. These functions are used in this work since none derived from stud-ies in tropical condition is available yet. In applying these dose-response functions, Jakarta is divided into several grids or areas. In each grid, information on ambient levels of air pollutants (TSP, NO2 and lead) and popula-tion is collected. Hence, numbers of air pollution health problems can be estimated in each grid/area.
The Case of Particulate Matter Epidemiological studies provide dose-response functions for the relationship between am-bient particulate matter and several health problems, including: mortality, respiratory hospi-tal admission, emergency room visits, restricted activity days for adults, lower respiratory illnesses for children, asthma attacks, and chronic disease. Most of these studies use PM10 as the measure of particulate matter. Particulate matter dose-response functions utilized in this work are as follows.
Mortality: Number of death = 0.096 · (PM10 – Standard for PM10) · POP · CM (App. 5.2) where:
PM10 is the annual average ambient level of PM10 (µg/m3) in grid/area.
Standard for PM10 is the allowable PM10 annual average concentration. Typically, it is the WHO guidelines or EPA standard or
Indonesian standard.
POP is population per grid/area.
CM is the crude mortality rate for Jakarta (approximately 0.07)

STUDY ON AIR QUALITY IN JAKARTA, INDONESIA
74
Respiratory Hospital Admission (RHA): Number of RHA case = 0.000012 · (PM10 – Standard for PM10) · POP (App. 5.3)
Emergency Room Visit (ERV): Number of ERV case = 0.0002354 · (PM10 – Standard for PM10) · POP (App. 5.4)
Restricted Activity Days (RAD): Number of RAD case = 0.0575 · (PM10 – Standard for PM10) · POP (App. 5.5)
Lower Respiratory Illnesses among Children (LRI): Number of LRI case = 0.00169 · (PM10 – Standard for PM10) · POP (App. 5.6)
Asthma Attacks (AA): Number of AA case = 0.0326 · (PM10 – Standard for PM10) · POP ·AP (App. 5.7) where: AP is percentage of asthmatic persons in the population (approximately 0.07).
Respiratory Symptom Day (RSD): Number of RSD case = 0.183 · (PM10 – Standard for PM10) · POP (App. 5.8)
Chronic Bronchitis (CB): Number of CB case = 0.0000612 · (PM10 – Standard for PM10) · POP (App. 5.9)
The Case of Lead (Pb) Dose-response functions for premature mortality, hypertension, coronary heart disease, and IQ (Intelligence Quotient) loss among children are available in the epidemiological lit-erature for the relationship between ambient levels of lead and health problems. The dose-response functions are as follows.
Mortality among Adult: Number of deaths = Pr(Mort) · PropA · POP · CM (App. 5.10) where:
PropA is the proportion of adults (approximately 0.643).
POP is the population per grid/area.
CM is the crude mortality rate for Jakarta (approximately 0.07).
Pr(Mort) is the change of mortality rate due to lead concentration.
Pr(Mort) is calculated with the following formula: Pr(Mort) = (1+exp(5.32 – 0.035DBP1))-1-(1+exp(5.32 – 0.035DBP2))-1 (App. 5.11)
DBP is diastolic blood pressure. DBP1 is the reference diastolic blood pressure. Using the average value used in the United States, the DBP1 is 76. DBP2 is calculated with the following formula: DBP2 = DBP1 – change in DBP (App. 5.12)
while:
Change in DBP = 2.74 · (ln(Pb in blood)1 – ln(Pb in blood)2) (App. 5.13)
In Ostro’s work, the (Pb in blood)2 is equal to 1, while for an adult, (Pb in blood)1 = 2 · Pb (App. 5.14)

STUDY ON AIR QUALITY IN JAKARTA, INDONESIA
75
where: Pb is lead concentration (µg/m3) in a grid/area where the concentration of lead is above the
WHO guidelines for lead.
Hypertension among Adult (H): Number of H case = [(1 + exp(2.744 – 0.793 · ln(Pb in blood)1)-1 - (1 + exp(2.744 – 0.793 · ln(Pb in blood)2)-1] · PropA · POP (App. 5.15)
Coronary Heart Disease among Adult (CHD): Number of CHD case = [(1 + exp(5 – 0.03 · DBP1)-1 - (1 + exp(5 – 0.03 · DBP2)-1] · PropA · POP (App. 5.16)
IQ Loss among Children: IQ Decrement = 0.975 · (Pb – Standard for Pb) · PropC · POP (App. 5.17)
where:
PropC is the proportion of children (= 1 - PropA).
Standard for Pb is the allowable standard for Pb (lead).
The Case of Nitrogen Dioxide The dose-response function for NO2 is only for respiratory symptoms (RSD) among adults. The func-tion is as follows: Number of RSD = 10.22 · (NO2 – Standard for NO2) · 1877.55 · PropA · POP (App. 5.18)
where:
NO2 is the NO2 concentration (µg/m3) in a grid/area.
Standard for NO2 is the allowable standard for NO2.
1877.55 is the conversion factor from ppm to (µg/m3).
The Case of Sulfur Dioxide (SO2) Dose-response functions for premature mortality, repiratory illness among children, and chest discom-fort among adults are available in the epidemiological literature for the relationship between ambient levels of SO2 and health problems. The dose-response functions are as follows.
Mortality: Number of death = 0.048 · (SO2 – Standard for SO2) · POP · CM (App. 5.19)
where:
SO2 is the annual average ambient level of SO2 (µg/m3) in grid/area.
Standard for SO2 is the standard for allowable SO2 annual average
concentration.
POP is the population per grid/area.
CM is the crude mortality rate for Jakarta (approximately 0.07).
Respiratory Illnesses among Children (LRI): Number of LRI case = 0.00000181 . (SO2 – Standard for SO2) · POP (App. 5.20)

STUDY ON AIR QUALITY IN JAKARTA, INDONESIA
76
Chest Discomfort among Adults (CDA):
Number of CDA case = 0.010 · (SO2 – Standard for SO2) · POP (App. 5.21)
The Case of Ozone Ozone is the primary component of photochemical smog. The dose-response functions associated with ozone are respiratory hospital admissions, restriction in activity, exacerba-tion of asthma, respiratory symptoms, and eye irritation (oxidants). The dose-response functions are as follows:
Respiratory Hospital Admission (RHA): Number of RHA case = 0.0077 · (Oz – Standard for Ozone) · POP (App. 5.22) where:
Oz is the daily 1-hour ambient level of Ozone (ppm) in grid/area.
Standard for Ozone is the standard for allowable Ozone in daily 1-hour concentration (ppm).
POP is the population per grid/area.
Restricted Activity Days (RAD): Number of RAD case = 34.0 · (Oz – Standard for Ozone) · POP (App. 5.23)
Respiratory Symptom Day (RSD): Number of RSD case = 54.75 · (Oz – Standard for Ozone) · POP (App. 5.24)
Eye Irritation (EI) Number of EI case = 26.6 · (Oz – Standard for Ozone) · POP (App. 5.25)
Asthma Exacerbation (AE): Number of AE case = 68.44 · (Oz – Standard for Ozone) · POP ·AP (App. 5.26) where:
AP is the percentage of asthmatic persons in the population (approximately 0.07).

STUDY ON AIR QUALITY IN JAKARTA, INDONESIA
77
APPENDIX 5.2. AIR POLLUTION AND POPULATION FOR 1998 (in µg/m3 and number of people)
Municipality District Ambient Concentration Population PM10 SO2 NO2
South Jakarta Jagakarsa 139.77 10.90 186.80 192,917
Pasar Minggu 139.77 10.90 186.80 252,336
Cilandak 104.64 18.55 154.68 208,924
Pesanggrahan 145.94 10.80 208.55 178,411
Kebayoran Lama 120.84 17.87 186.54 308,297
Kebayoran Baru 104.64 18.55 154.68 194,654
Mampang Prapatan 113.40 30.71 191.56 142,705
Pancoran 116.78 24.92 183.77 163,118
Tebet 116.78 24.92 183.77 289,622
Setia Budi 113.40 30.71 191.56 177,417
East Jakarta Pasar Rebo 94.31 9.55 78.51 169,803
Ciracas 94.31 9.55 78.51 198,265
Cipayung 94.31 9.55 78.51 136,825
Makasar 111.25 14.14 130.01 220,178
Kramat Jati 111.25 14.14 130.01 254,503
Jatinegara 106.51 23.81 153.00 367,734
Duren Sawit 97.55 13.15 91.62 381,051
Cakung 95.76 19.94 92.92 263,218
Pulo Gadung 93.89 30.29 141.03 343,376
Matraman 99.99 32.73 166.86 271,448
Central Jakarta Tanah Abang 107.99 25.95 186.10 140,887
Menteng 96.65 29.64 177.44 95,633
Senen 90.60 40.56 168.17 104,811
Johor Baru 90.60 40.56 168.17 87,923

STUDY ON AIR QUALITY IN JAKARTA, INDONESIA
78
Cempaka Putih 90.60 40.56 168.17 73,463
Kemayoran 90.60 40.56 168.17 194,957
Sawah Besar 78.43 26.91 142.23 116,820
Gambir 96.65 29.64 177.44 96,005
West Jakarta Kembangan 134.60 13.86 199.79 193,129
Kebon Jeruk 134.60 13.86 199.79 276,378
Palmerah 106.83 23.13 178.45 317,143
Grogol Petamburan 106.83 23.13 178.45 345,048
Tambora 78.43 26.91 142.23 446,819
Taman Sari 78.43 26.91 142.23 252,830
Cengkareng 117.85 12.80 163.98 321,627
Kalideras 117.85 12.80 163.98 225,425
North Jakarta Penjaringan 45.03 12.83 56.63 240,794
Pademangan 45.03 12.83 56.63 184,622
Tanjung Priok 76.14 22.51 93.23 450,831
Koja 76.14 22.51 93.23 327,971
Kelapa Gading 76.14 22.51 93.23 149,589
Cilincing 86.56 21.57 84.60 322,675

STUDY ON AIR QUALITY IN JAKARTA, INDONESIA
79
APPENDIX 5.3. AIR POLLUTION AND POPULATION FOR 2015 (in µg/m3 and number of people)
Municipality District Ambient Concentration Population PM10 SO2 NO2
South Jakarta Jagakarsa 187.03 28.80 313.11 357,539 Pasar Minggu 187.03 28.80 313.11 365,976 Cilandak 145.28 48.99 322.68 287,269 Pesanggrahan 195.65 28.00 346.43 297,615 Kebayoran Lama 166.46 46.59 363.37 356,859 Kebayoran Baru 145.28 48.99 322.68 135,050 Mampang Prapatan 159.42 84.90 422.25 171,531 Pancoran 163.36 66.62 394.57 213,303 Tebet 163.36 66.62 394.57 246,276 Setia Budi 159.42 84.90 422.25 58,772East Jakarta Pasar Rebo 124.96 27.98 143.86 283,995 Ciracas 124.96 27.98 143.86 354,067 Cipayung 124.96 27.98 143.86 290,854 Makasar 151.20 37.80 257.28 307,263 Kramat Jati 151.20 37.80 257.28 362,102 Jatinegara 149.03 64.22 343.66 396,189 Duren Sawit 131.74 36.75 191.17 600,701 Cakung 129.12 59.06 206.05 599,711 Pulo Gadung 132.68 85.47 343.95 383,969 Matraman 142.61 90.76 400.20 291,249Central Jakarta Tanah Abang 152.94 69.59 409.77 46,728 Menteng 139.37 80.76 417.77 48,525 Senen 130.79 116.41 424.45 56,018 Johor Baru 130.79 116.41 424.45 66,195 Cempaka Putih 130.79 116.41 424.45 54,365 Kemayoran 130.79 116.41 424.45 139,161 Sawah Besar 113.46 73.98 346.10 68,589 Gambir 139.37 80.76 417.77 43,353West Jakarta Kembangan 181.84 36.91 349.90 416,762 Kebon Jeruk 181.84 36.91 349.90 498,173 Palmerah 149.20 62.80 373.66 365,300 Grogol Petamburan 149.20 62.80 373.66 325,394 Tambora 113.46 73.98 346.10 473,875 Taman Sari 113.46 73.98 346.10 228,445 Cengkareng 157.37 36.75 278.00 759,448 Kalideras 157.37 36.75 278.00 623,266North Jakarta Penjaringan 62.37 37.04 136.00 398,635 Pademangan 62.37 37.04 136.00 218,226 Tanjung Priok 105.86 64.47 231.49 613,354 Koja 105.86 64.47 231.49 323,519 Kelapa Gading 105.86 64.47 231.49 310,128 Cilincing 116.08 65.46 189.85 586,485

STUDY ON AIR QUALITY IN JAKARTA, INDONESIA
80
APPENDIX 5.4. METHODOLOGY TO ESTIMATE THE ECONOMIC VALUE The economic value of health problems associated with air pollutants is calculated with a general formula as follows: The health costs of pollutants under consideration are:
TCi = Vi · dHi (App. 5.27)
where:
TCi is the total economic value of health problem i.
Vi is the value of health problem i (per unit/case). In general, this will be the treatment cost, per case, of health effect i, or the value of human life in the case of mortality.
dHi is the number of cases for health problem i.
Methods to calculate the value of each health problem are as follows:
Mortality: The value of a mortality case, also known as the value of statistical life (VSL), is esti-mated as the discounted value of expected future income at the average age. In this work, the VSL is calculated as:
∑ +=
ttd
wVSL)1(
(App. 5.28)
where: w is the average expected annual individual income in Jakarta.
d is the discount rate (approximately 5 percent).
t is the average individual working period. This work will assume that t is 38, since the aver-age individual age of population in Jakarta is 26 and the life expectancy at birth is 65.
If w is assumed to equal the annual minimum wage standard set for Jakarta, which is ap-proximately 5.1 million IDR per year, the VSL is approximately equal to 92 million IDR.
Respiratory Hospital Admission (RHA): The value of an RHA case is estimated as the average cost of medical treatment per RHA case. This cost covers medical doctor service, medicine, and approximately two days in the hospital.
Emergency Room Visit (ERV): The value of an ERV case is estimated as the average cost of using emergency room ser-vices. This cost includes the costs of medical doctor, medicine, and one day at the emer-gency room.

STUDY ON AIR QUALITY IN JAKARTA, INDONESIA
81
Restricted Activity Days (RAD): The value of a RAD case is assumed to be equal to the average daily individual income in Jakarta. If the average daily individual income is assumed to equal the daily minimum wage, then the value of a RAD case is approximately equal to 17 thousand IDR.
Lower Respiratory Illnesses among Children (LRI): The value of an LRI case is calculated as the average cost of medical treatment per LRI case, which equals the cost of a medical doctor and medicine needed to treat the case.
Asthma Attacks (AA): The value of an AA case is approximated as the average cost of medical treatment per AA case, which equals the cost of a medical doctor and medicine needed to treat the case
Respiratory Symptom Day (RSD): The value of an RSD is assumed to equal the average cost of medical treatment per RSD case.
Chronic Bronchitis (CB): The value of a CB case is estimated as the average cost of medical treatment per CB case.
Hypertension among Adult s(H): The value of an H case is estimated as the average cost of medical treatment per individual contracted with hypertension. The cost is relatively expensive, since most likely a life sav-ing treatment is needed for this disease.
Coronary Heart Disease among Adult s(CHD): The value of a CHD case is assumed to equal the average cost of medical treatment. The cost includes payments for visiting a medical doctor and medicine needed to treat the case.
IQ Loss among Children: The value of, per point, IQ loss is estimated as the lost of income caused by one point IQ loss. The average IQ among children in Jakarta, if air lead concentration in Jakarta is be-low the WHO air quality guidelines for lead, is assumed to be 100. With an IQ of 100 points, the value of a child’s life is estimated as the same as the value of statistical life (VSL). If with an IQ of 40 one could not find a job in Jakarta, then the value of, per point, IQ loss is assumed to be equal to the VSL/60.
Chest Discomfort among Adults (CDA): The value of a CDA case is estimated as the average cost of medical treatment per CDA case.
Eye Irritation The value of an eye irritation case is estimated as the average cost of medical treatment per eye irritation case.

APPENDIX 6
APPENDIX 6.1. ESTIMATED DISTRIBUTION OF VEHICLE TECHNOLOGY FOR EACH VEHICLE GROUP
(Unit: in percentage) Year 2005 (Step 2) Year 2007 (Step 3)
Vehicle Group Uncontrolled Euro 1 Euro 2 Uncontrolled Euro 1 Euro 2
Passenger Car 81.0 19.0 0.0 25.5 11.5 63.0 Truck 89.2 10.8 0.0 42.6 10.9 46.5 Bus 96.6 3.4 0.0 57.5 5.5 37.0 Motorcycle 87.6 12.4 0.0 42.3 10.9 46.8


