† Postal address: A301, College of ArcUniversity, Chengdu, 610065, China.
Cite this: RSC Adv., 2021, 11, 27322
Received 27th April 2021Accepted 23rd July 2021
DOI: 10.1039/d1ra03286k
rsc.li/rsc-advances
27322 | RSC Adv., 2021, 11, 27322–27
d nitrogen removal efficiency ofdomestic sewage by hybrid carrier biofilm reactor
Yuqiu Hou, Mei Liu, Xiao Tan, Siyu Hou and Ping Yang †*
A moving bed biofilm reactor (MBBR) is a kind of commonly used biological sewage treatment process. A
carrier, the core of MBBR, could directly affect the treatment efficiency of MBBR. In this experiment, a hybrid
carrier composed of an MBBR carrier and fluidized bed porous carrier was innovatively utilized to treat low-
concentration simulated domestic sewage through an MBBR reactor to investigate the effects of different
hydraulic retention times (HRT) and different carrier dose ratios on the reactor performance. The results
indicated that when the volume ratio of the carrier dosage was 5% : 20% when the reactor HRT was 5 h,
the removal rates of ammonia nitrogen, total nitrogen (TN) and chemical oxygen demand (CODCr) were
optimal, which were 96.5%, 60.9% and 91.5%, respectively. The ammonia nitrogen, total nitrogen and
CODCr concentrations of the effluent were 1.04 mg L�1, 12.20 mg L�1 and 29.02 mg L�1, respectively.
Furthermore, the total biomass concentration in the hybrid carrier biofilm reactor (HCBR) was
3790.35 mg L�1, which also reached the highest value. As the experiment progressed, the concentrations
of protein, polysaccharide and soluble microbial products (SMP) were reduced to 7.68 mg L�1,
11.10 mg L�1 and 18.08 mg L�1, respectively. This was basically consistent with the results of the three-
dimensional fluorescence spectrum. The results showed that the combined-carrier biofilm reactor could
reduce the volumetric filling rate, improving the removal capability of organic matter and the
denitrification efficiency. This study provided technical support for the composite carrier biofilm
wastewater treatment technology, and also had a good prospect of application.
1. Introduction
With the development of economy and the progress of times,the sewage generated in the production and life of society hasbecome more and more diversied. At the same time, with thecontinuous development of economic and ecological concepts,the discharge standards of sewage have become more and morestrict.1 Conventional wastewater treatment methods have beenchallenging to meet the increasing sewage treatment require-ments. At present, the most commonly used methods are acti-vated sludge method and biolm method. However, they havedisadvantages, such as large land area, high cost and weakadaptability to changes in wastewater quality and quantity.Furthermore, the biolm method has the disadvantages of easyclogging and regular backwashing. In order to solve the prob-lems of these two processes,2 the MBBR method came intoexistence.
The MBBR method was developed in 1988 by the NorwegianKaldnes company, and the Norwegian University of Science andTechnology and the SINTEF research institute. The core of this
process was directly adding the suspended ller with a specicgravity close to water into the aeration tank as a carrier formicrobial adhesion growth. The MBBR method combines theadvantages of the activated sludge method and the biolmmethod, including small oor area, no need for sludge reux orbackwashing, low head loss, low power consumption, and highresistant to temperature changes and changes in sewagecomposition. Moreover, the treatment capacity of sewage hasbeen improved, and the nitrication effect also has beensignicantly enhanced. In the past few decades, the MBBRprocess has been employed worldwide.3,4 It has been applied intreating urban domestic sewage,3,5,6 food industry wastewater,7
papermaking wastewater8 and landll leachate.9,10 In recentyears, theMBBRmethod was also suggested for the treatment ofpharmaceutical wastewater11 and phosphorus removal.12,13
The biological uidized bed method is a sewage treatmentprocess developed in the early 1970s. Its principle is to use smallinert porous particles, such as activated carbon, as carriers todegrade the aerobics of pollutants in wastewater. The micro-organisms were immobilized on the surface of the carrier, andthe carrier was uidized to degrade the contaminants in thewastewater.14 Until now, biological uidized bed reactors havebeen developed in various forms. They were also widely studiedand applied in urban domestic sewage,15 industrial wastewater14
The integrated xed-lm activated sludge (IFAS) methodintegrates the hybrid biolm process and activated sludgeprocess to treat sewage.17 The bacterial richness and microbialdiversity in biolms and ocs of the IFAS system were different,which would promote highmicrobial diversity to achieve higherpollutant removal efficiency.
Carrier research is an important direction for the develop-ment of the biolm process.18 Commonly used carrier materialscan be divided into inorganic carrier materials, natural organiccarrier materials, synthetic polymer carrier materials andcomposite carrier materials, according to their properties. Withthe objective to act as an effective support media for activebiomass growth in a biolm reactor, the ideal carrier materialshould have several desirable characteristics. Optimally,carriers should (i) have good compatibility with microorgan-isms and will not affect the biological activity of the microor-ganisms, (ii) be environmentally friendly, biodegradable, andwill not cause secondary pollution, (iii) shield unfavorableexternal environmental conditions, provide carbon sources,nutrients and a good microenvironment, (iv) have a relativelylarge specic surface area; rawmaterials are easily available andlow in price, (v) have good stability and can be used for a longtime or repeatedly.19 The specic surface area, pore structure,mechanical strength and other factors of different carriermaterials will signicantly affect the immobilization process ofmicroorganisms.20 A suitable carrier can improve the sewagetreatment capacity. According to a previous study, in addition topolyethylene (PE), polypropylene (PP), and high-density PE(HDPE), polymers such as polyurethane (PU) and poly-caprolactone (PCL) have been used as biolm carriers inMBBRs.21 Among these, biolm carriers composed of PE areoen used in MBBRs because the density of PE is lower thanthat of other polymers.22 Moreover, polyethylene terephthalate(PET), produced from waste plastic bottles, can be utilized asa packing material for up-ow anaerobic sludge bed (UASB)reactor as demonstrated by M. A. EI-Khateeb.23 The quality ofthe packed UASB (P-UASB) effluent was found to be better thanthat of the classical UASB reactor.23 What is more, the down owhanging non-woven (DHNW) reactor packed with PET hasachieved excellent performance in the treatment of tanningeffluents.24 Abu Bakar used two types of biolm carriers to llthe MBBR to treat palm oil mill effluent. The results indicatedthat the hexalter performed better than black plastic media at50% media lling fractions (retention time of 72 h).21 Theoret-ically, the mixed-carrier biolm reactor can simultaneously takeadvantage of the advantages of the two carriers and make up foreach other's defects, which will greatly promote the improve-ment of the processing efficiency of the biolm reactor.However, there are few research studies on mixed carrier bio-lm reactors at home and abroad.
Based on this, the experiment quoted the method of IFAS,combining the MBBR carrier and the uidized bed carrier intoa combined-carrier. The simulating domestic sewage was pro-cessed through the MBBR reactor, and the inuence of differentHRT and carrier dosage ratios is discussed on the performanceof the reactor.
The experimental device is shown in Fig. 1. The HCBRwasmadeof plexiglass, 30 cm in length, 10 cm wide, and had an effectiveheight of 40 cm. The reactor was divided into an aeration zoneand a precipitation zone, with the effective volumes of 7.5 L and4 L, respectively. A baffle was arranged in the middle of theaeration zone, and the aeration head was placed under thebaffle to control the amount of aeration by adjusting the rota-meter (connected to the air pump). Two kinds of carriers withdifferent volume ratios were added to the pool. With the actionof aeration and the ow guiding of the deector, the hybridcarrier attached with the biolm was counterclockwise aroundthe deector in the aeration zone. Most of the blank area le bythe BioM™ carrier was lled by the owing porous polymerparticle carrier to ensure adequate mixing of the water, gas andsolid phases in the aeration zone. Fig. 2 shows that the twocarriers used in the experiment were BioM™ carrier and porouspolymer particle carrier. The BioM™ carrier was produced fromDalian Yudu Environmental Engineering Technology Co. Ltd,and the porous polymer particle carrier was developed by thelaboratory. The main parameters of the two carriers are shownin Table 1.
2.2 Experimental wastewater
The experimental wastewater was articially prepared to simu-late domestic sewage. The main components were anhydrousglucose, sodium bicarbonate, ammonium chloride, potassiumdihydrogen phosphate and nutrient solution. Among them,anhydrous glucose was used to provide CODCr, ammoniumchloride was used to provide the nitrogen source, potassiumdihydrogen phosphate was used to provide the phosphorussource, nutrient solution was used to provide other traceelements, and sodium bicarbonate was used to adjust the pH inthe simulated sewage. The inuent CODCr was about350 mg L�1, the NH4
+–N and TN concentrations were about30 mg L�1, the TP concentration was about 5 mg L�1, and thepH was about 8.44. The composition of the nutrient solution(both of which is 0.50 mL of nutrient solution per L of syntheticwastewater) is shown in Table 2.
Type WD-F10-4 Dry particle size (mm) 0.45–0.90Size (mm) F10 � 10 Skeleton density (kg m�3) 1320.00Surface area (m2 m�3) 1200.00 Wet bulk density (kg m�3) 1010.00Packing number (m�3) 495 000 Vacancy capacity (mL g�1) 0.301Packing density (kg m�3) 125.00 Wet surface area (m2 m�3) 5357.00Pre-lm density (g cm�3) 0.96–0.98Post-lm density (g cm�3) 1.00
RSC Advances Paper
Ope
n A
cces
s A
rtic
le. P
ublis
hed
on 1
0 A
ugus
t 202
1. D
ownl
oade
d on
1/4
/202
2 2:
43:2
7 A
M.
Thi
s ar
ticle
is li
cens
ed u
nder
a C
reat
ive
Com
mon
s A
ttrib
utio
n 3.
0 U
npor
ted
Lic
ence
.View Article Online
2.3 Analysis and determination methods
The water quality indexes were measured by the Chinese StateEnvironmental Protection Administration (SEPA) standardmethods. Among them, CODCr wasmeasured by rapid digestionspectrophotometry; NH4
+–N was measured by Nessler's reagentspectrophotometry; and TN was measured by alkaline potas-sium persulfate digestion ultraviolet spectrophotometry. Thepolysaccharide concentration was measured by the uorenone–sulfuric acid method, and the protein concentration wasmeasured by the phenol reagent method (Lowry method). Thecarrier attachment biomass wasmeasured by the lye dissolutionspalling method and the microscopic test diameter densitycalculation method. MLSS was measured by gravimetricmethod.
The measurement of the attached biomass on the BioM™
carrier was measured by the lye dissolution spalling method.25
Five randomly selected BioM™ carriers were charged into thereactor, dried at 105 �C to a constant weight, and then weighed.Then, the carriers were placed in a 0.1 mol L�1 NaOH solutionand heated to 60 �C for 20 minutes. The degree of bondingbetween the biolm and the carrier surface was greatly reduced,and the biolm on the carrier was peeled off mechanically toremove water. The carriers were washed and dried at 105 �C toa constant weight, and then weighed. The total weight of theattached biomass on the carriers was calculated and converted
27324 | RSC Adv., 2021, 11, 27322–27332
to the biomass concentration of the attached biolm on theBioM™ carrier throughout the reactor.
The amount of attached biomass on the porous polymerparticle carrier was determined by the microscopic test diam-eter density calculation method. Boaventura et al.26 and Coel-hoso et al.27 found that the density of the biolm attached to thebiolm carrier was related to its thickness. When the thicknessof the biolm was less than a certain value, the density of thebiolm decreased linearly with the increase of the thickness.Moreover, when the lm thickness increased to a certain value,the density of the biolm no longer changed with the increaseof the lm thickness. The biolm density r tted by Boaventuraet al.28 through experimental data was calculated by thefollowing eqn.
r (mg cm�3) ¼ 104.3 � 0.224L L < 622 mm (1)
r (mg cm�3) ¼ 26.9 L > 622 mm (2)
The thickness L of the biolm adhered to the porous polymerparticle carrier was measured by referring to the experimentalmethod of Pan et al.29 The irregular porous polymer particlecarrier was regarded as an ellipsoid, and the long axis a of theellipsoid was measured by an optical microscope. The short axisbwas converted into the equivalent sphere diameter d¼ (a$b2)1/3.In each test, 100 carrier particles were randomly selected fromthe reactor for testing. The average diameter of Sauter was used to
represent the average diameter of 100 carrier particles De¼Pd3/
(P
d2). In addition, 100 optical carrier particles were selected inthe same way to test the average diameter Dc ¼ 1351.66 mm, thevolume V0¼ 1.293mm3, and the biolm thickness L is (De�Dc)/2. Aer the biolm density r was obtained according to thethickness of the biolm, the biolm volume was determined:
V ¼ 43p
�L2
�3
� V0: Finally, the biomass concentration of the
biolm was X ¼ rV.
2.4 Experimental start-up
The hybrid carrier biolm reactor used in this experiment wasfrom another experiment that has treated high-salt wastewaterin the same laboratory. Aer using the simulated domesticsewage to recover the reactor in a low-salt state for a period oftime, the biolm was replenished by using a quick biolmculturing method. The aerobic-activated sludge inoculated withthe biolm was from the sedimentation tank of Baijia SewageTreatment Plant in Shuangliu County, Chengdu.
3. Results and discussion3.1 HCBR for treatment efficiency of simulated domesticsewage
To investigate the effects of different hydraulic retention times(HRT) and different carrier dose ratios on the reactor perfor-mance, the simulated domestic sewage in this experiment wastreated by adjusting the ratio of the two kinds of carriers atdifferent operating conditions. The specic operating condi-tions of our experiment are shown in Table 3. The experimentwas divided into 12 working conditions according to thedifferent HRT and carrier dosage ratios: in the rst part P1, theHRT of the reactor operation was 11 h, 8 h, 5 h and 2.5 h,respectively. The ratio of the porous polymer particle carrier tothe BioM™ carrier was 2% : 20%, and the specic dosages were0.15 L and 1.5 L. In the second part P2, the HRT of the reactoroperation was 2.5 h, 5 h, 8 h and 11 h, respectively. The ratio ofthe porous polymer particle carrier to the BioM™ carrier was5% : 20%, and the specic dosages were 0.375 L and 1.5 L. Inthe third part P3, the HRT of the reactor operation was 11 h, 8 h,5 h and 2.5 h, respectively. The ratio of the porous polymerparticle carrier to the BioM™ carrier was 8% : 20%, and thespecic dosages were 0.6 L and 1.5 L. The performance of theHCBR for the treatment of synthetic simulated domestic sewagewas studied. The optimum carrier dosing ratio of the HCBR wasexplored under the different pollutant removal loads.
Furthermore, the changes of biomass and SMP in the reactorunder different working conditions were investigated.
3.1.1 Removal of CODCr in the HCBR. The removal of CODis related to biodegradable carbon.30 The COD in the simulateddomestic sewage of this experiment was all provided by glucose,and the microbial degradation reaction is as follows:31
C6H12O6 + 6O2 / 6CO2 + 6H2O (3)
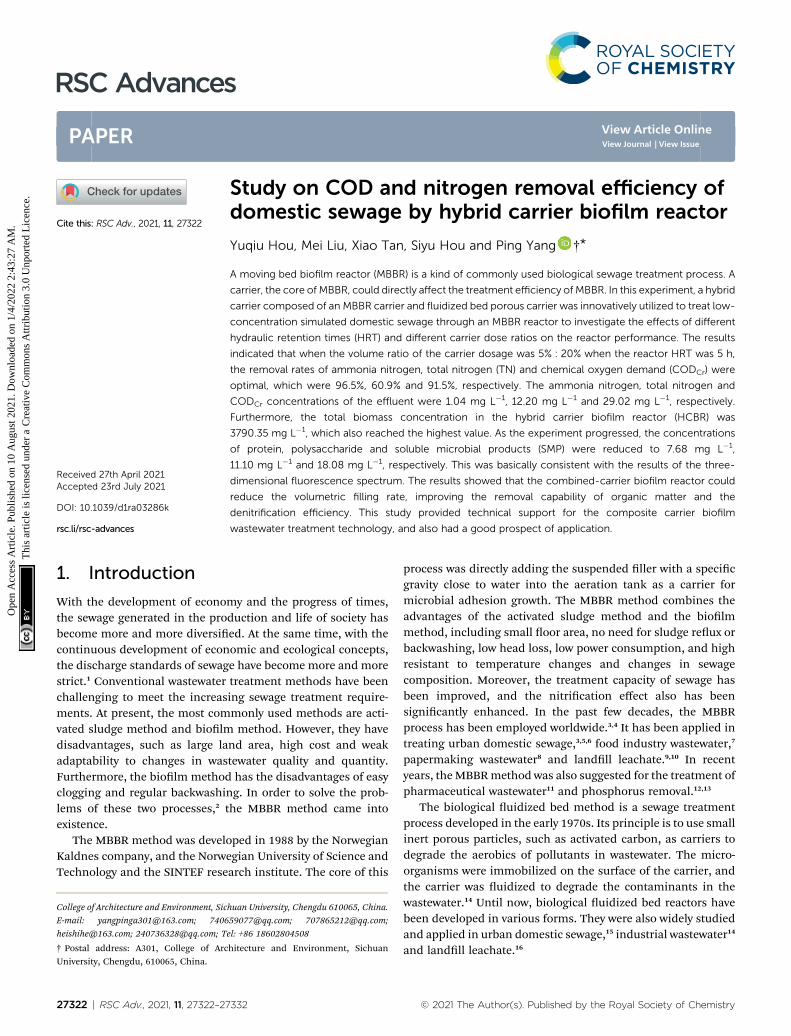
The removal of CODCr during the experiment is shown inFig. 3. Under different carrier ratios, the CODCr removal effect ofthe reactor was almost at. When the HRT were 5 h, 8 h and11 h, the average effluent CODCr of the reactor was about30 mg L�1, and the average CODCr removal rate was about 90%.When the HRT was 2.5 h, the CODCr removal rate of the reactordecreased slightly, and the effluent CODCr concentrationincreased slightly. The average concentration was 45.2 mg L�1,and the average removal rate was about 87%. In the 12 workingconditions of the experiment, when the carrier ratio was2% : 20% and the HRT was 5 h, the average effluent CODCr ofthe reactor was 22.89 mg L�1 and the average removal rate ofCODCr was 93%. That was optimal processing efficiency.
The results indicated that the carrier ratio had little effect onthe CODCr removal effect of the HCBR. The removal rate ofCODCr was positively correlated with the change of HRT.32 Thischange may due to the fact that different HRTs would cause theF/M in the reactor to be different.33 The shorter the HRT was, thelarger the F/M was. Meanwhile, the carrier provides a stablegrowth environment for microorganisms, thus improving the
Fig. 3 Dynamic changes of HCBR for CODCr removal (P1, P2 and P3represented the operations in which the ratios of the porous polymerparticle carrier to the BioM™ carrier were 2% : 20%, 5% : 20% and8% : 20%, respectively).
RSC Advances Paper
Ope
n A
cces
s A
rtic
le. P
ublis
hed
on 1
0 A
ugus
t 202
1. D
ownl
oade
d on
1/4
/202
2 2:
43:2
7 A
M.
Thi
s ar
ticle
is li
cens
ed u
nder
a C
reat
ive
Com
mon
s A
ttrib
utio
n 3.
0 U
npor
ted
Lic
ence
.View Article Online
degradation effect of the reactor.34 However, when the loadingwas so high that the microorganisms in the reactor could notdegrade the organic matter in time, this resulted in a decreaseof the CODCr removal rate. When the HRT was prolonged, themicroorganisms attached to the carriers would have enoughtime to contact the organic matter and remove it.32 However, inthis experiment, the change of the CODCr removal rate withHRT changes was not prominent, which indicated that theHCBR had a wide load range and strong impact resistance.
3.1.2 Removal of NH4+–N in the HCBR. Microorganisms
degrade NH4+–N through nitrication, and the reactions are as
follows:35
2NH4+ + 3O2 / 2NO2� + 2H2O + 4H+ (4)
2NO2� + O2 / 2NO3
� (5)
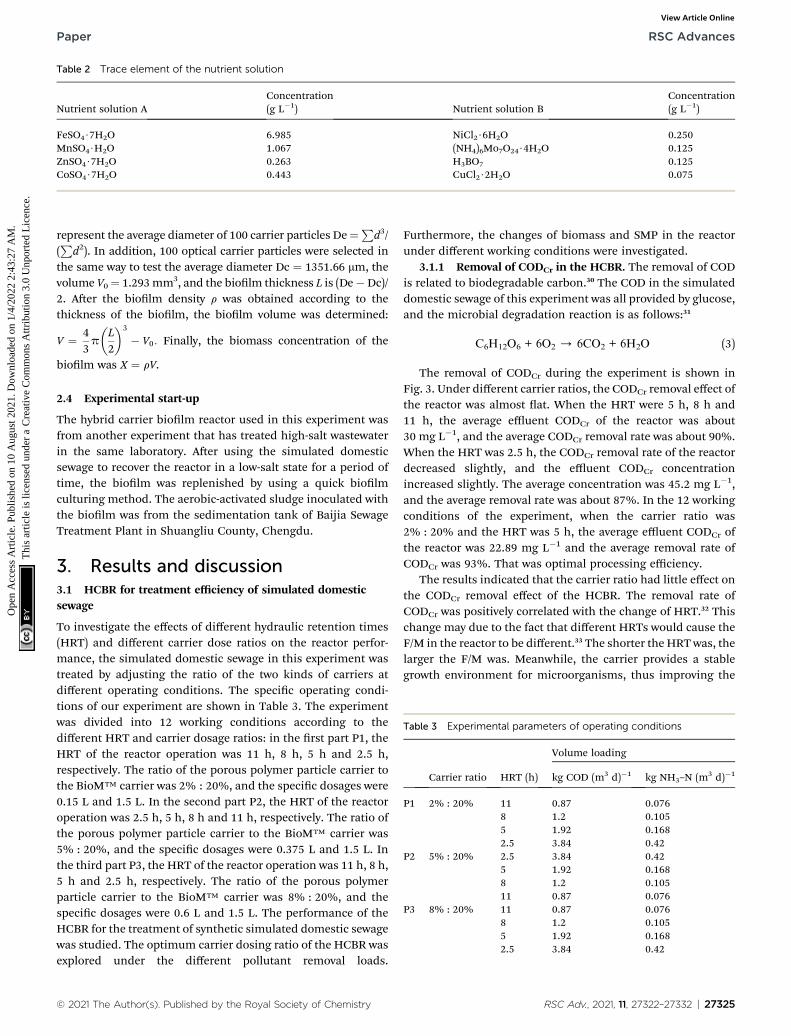
The degradation of NH4+–N during the experiment is shown
in Fig. 4. When the ratios of the carrier dosage were 5% : 20%
Fig. 4 Dynamic changes of HCBR for the ammonia–nitrogenremoval.
27326 | RSC Adv., 2021, 11, 27322–27332
and 8% : 20%, the removal rate of NH4+–N in the whole process
of the reactor was higher than the removal rate when the dosageratio was 2% : 20%. Furthermore, when the ratios of the carrierdosage were 5% : 20% and 8% : 20%, the removal rates ofNH4
+–N were not signicantly different from each other. Aerthe reactor stabilized, when HRT was 5 h, the removal rate ofNH4
+–N was optimal with the dose ratios of 5% : 20% and8% : 20%. The average NH4
+–N effluent was 1.10 mg L�1 and0.99 mg L�1, and the removal rates were 96% and 97%,respectively. When the HRT was 2.5 h, the effluent NH4
+–Nremoval rate was less than 90%. Moreover, when the carrierdosage ratios were 5% : 20% and 8% : 20%, the effluent NH4
+–
N concentration was 5 mg L�1 � 1 mg L�1. When the HRT were8 h and 11 h, the removal rate of NH4
+–N in the reactor wasabove 90%, which was slightly lower than the removal rate of 5 hHRT.
The results indicated that different carrier dosage ratios anddifferent HRT both had effects on the removal of NH4
+–N. Thereason may be that there was less space for microorganisms toattach on the carrier to generate biolm in the reactor when thecarrier dosage ratio is 2% : 20%, resulting in less microbialbiomass in the reactor and low removal rate of NH4
+–N.However, when the ratio of the carrier was 8% : 20%, theremoval rates of NH4
+–N was not higher than the removal rateswhen the carrier dosage ratio was 5% : 20%. It may be becausethe excessive carrier lling rate also means the collisionbetween the carriers frequently increased, resulting in anincrease in the rate of biolm desorption on the surface of thecarrier.36 Therefore, the amounts of microorganisms in thereactor would not increase greatly with the increase of thecarrier ratio, and the removal rate of NH4
+–N. The change ofHRT had a great inuence on the efficiency of NH4
+–N removalin the reactor.37 The removal rate of NH4
+–N would decreaserapidly by shortening the HRT,38 and the removal rate of NH4
+–
N would increase signicantly by increasing the HRT. Thereason may be that the excessive HRT leads to a decrease in theorganic load in the reactor, which in turn reduced the microbialmetabolic activity39 and the removal rate of NH4
+–N. At the sametime, the increase of the amount of the porous carrier wasbenecial to the removal of NH4
+–N, while the effect was notvery obvious.
3.1.3 Removal of TN in the HCBR. The biolm is attachedto the carriers, and the oxygen concentration graduallydecreases during the dissolved oxygen mass transfer process.Three areas are formed inside the biolm: anaerobic zone,facultative anaerobic zone and aerobic zone. The aerobic zone iswhere the nitrication reaction takes place (eqn (4) and (5)), andthe facultative anaerobic zone and anaerobic zone are where thedenitrication reaction takes place, thus realizing the removalof TN. The denitrication reaction is as follows:40
6NO3� + 2CH3OH / 6NO2
� + 2CO2 + 4H2O (6)
6NO2� + 3CH3OH / 3N2 + 3CO2 + 3H2O + 6OH� (7)
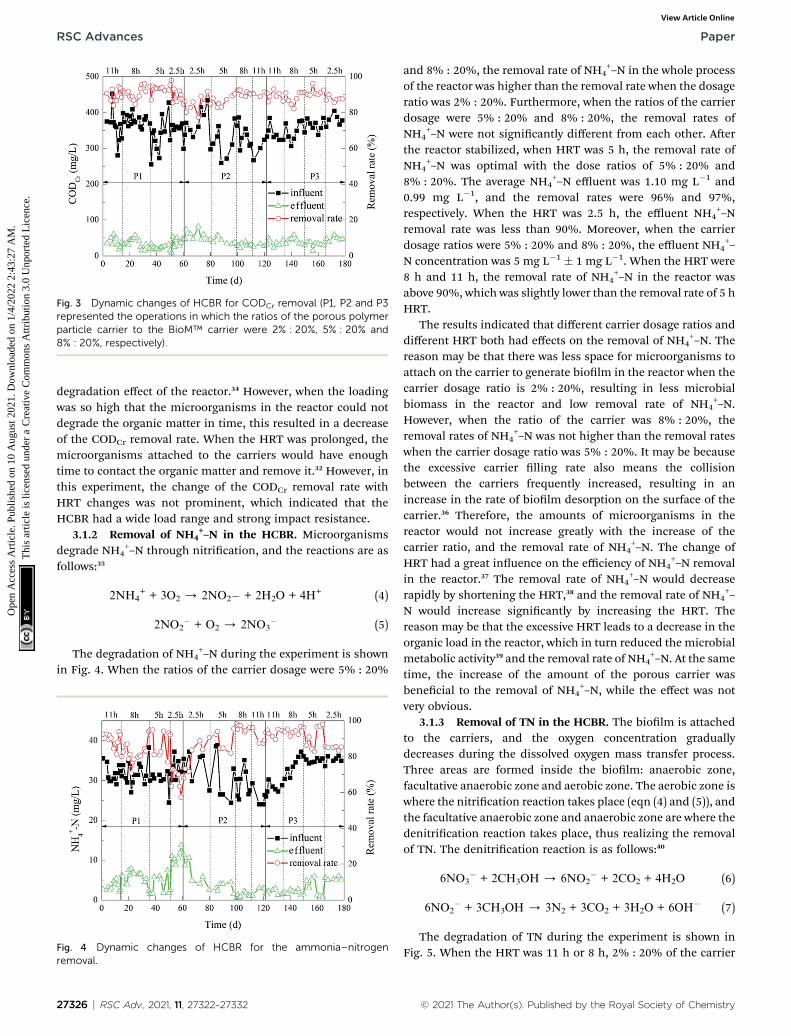
The degradation of TN during the experiment is shown inFig. 5. When the HRT was 11 h or 8 h, 2% : 20% of the carrier
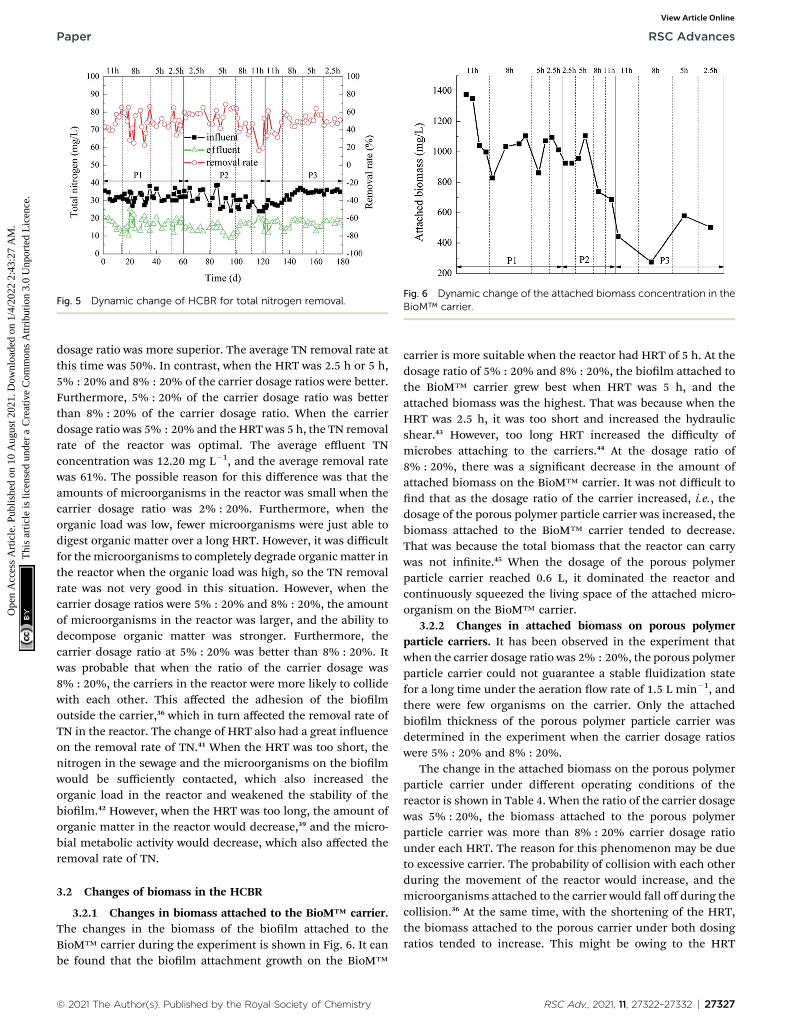
Fig. 5 Dynamic change of HCBR for total nitrogen removal.Fig. 6 Dynamic change of the attached biomass concentration in theBioM™ carrier.
Paper RSC Advances
Ope
n A
cces
s A
rtic
le. P
ublis
hed
on 1
0 A
ugus
t 202
1. D
ownl
oade
d on
1/4
/202
2 2:
43:2
7 A
M.
Thi
s ar
ticle
is li
cens
ed u
nder
a C
reat
ive
Com
mon
s A
ttrib
utio
n 3.
0 U
npor
ted
Lic
ence
.View Article Online
dosage ratio was more superior. The average TN removal rate atthis time was 50%. In contrast, when the HRT was 2.5 h or 5 h,5% : 20% and 8% : 20% of the carrier dosage ratios were better.Furthermore, 5% : 20% of the carrier dosage ratio was betterthan 8% : 20% of the carrier dosage ratio. When the carrierdosage ratio was 5% : 20% and the HRT was 5 h, the TN removalrate of the reactor was optimal. The average effluent TNconcentration was 12.20 mg L�1, and the average removal ratewas 61%. The possible reason for this difference was that theamounts of microorganisms in the reactor was small when thecarrier dosage ratio was 2% : 20%. Furthermore, when theorganic load was low, fewer microorganisms were just able todigest organic matter over a long HRT. However, it was difficultfor themicroorganisms to completely degrade organic matter inthe reactor when the organic load was high, so the TN removalrate was not very good in this situation. However, when thecarrier dosage ratios were 5% : 20% and 8% : 20%, the amountof microorganisms in the reactor was larger, and the ability todecompose organic matter was stronger. Furthermore, thecarrier dosage ratio at 5% : 20% was better than 8% : 20%. Itwas probable that when the ratio of the carrier dosage was8% : 20%, the carriers in the reactor were more likely to collidewith each other. This affected the adhesion of the biolmoutside the carrier,36 which in turn affected the removal rate ofTN in the reactor. The change of HRT also had a great inuenceon the removal rate of TN.41 When the HRT was too short, thenitrogen in the sewage and the microorganisms on the biolmwould be sufficiently contacted, which also increased theorganic load in the reactor and weakened the stability of thebiolm.42 However, when the HRT was too long, the amount oforganic matter in the reactor would decrease,39 and the micro-bial metabolic activity would decrease, which also affected theremoval rate of TN.
3.2 Changes of biomass in the HCBR
3.2.1 Changes in biomass attached to the BioM™ carrier.The changes in the biomass of the biolm attached to theBioM™ carrier during the experiment is shown in Fig. 6. It canbe found that the biolm attachment growth on the BioM™
carrier is more suitable when the reactor had HRT of 5 h. At thedosage ratio of 5% : 20% and 8% : 20%, the biolm attached tothe BioM™ carrier grew best when HRT was 5 h, and theattached biomass was the highest. That was because when theHRT was 2.5 h, it was too short and increased the hydraulicshear.43 However, too long HRT increased the difficulty ofmicrobes attaching to the carriers.44 At the dosage ratio of8% : 20%, there was a signicant decrease in the amount ofattached biomass on the BioM™ carrier. It was not difficult tond that as the dosage ratio of the carrier increased, i.e., thedosage of the porous polymer particle carrier was increased, thebiomass attached to the BioM™ carrier tended to decrease.That was because the total biomass that the reactor can carrywas not innite.45 When the dosage of the porous polymerparticle carrier reached 0.6 L, it dominated the reactor andcontinuously squeezed the living space of the attached micro-organism on the BioM™ carrier.
3.2.2 Changes in attached biomass on porous polymerparticle carriers. It has been observed in the experiment thatwhen the carrier dosage ratio was 2% : 20%, the porous polymerparticle carrier could not guarantee a stable uidization statefor a long time under the aeration ow rate of 1.5 L min�1, andthere were few organisms on the carrier. Only the attachedbiolm thickness of the porous polymer particle carrier wasdetermined in the experiment when the carrier dosage ratioswere 5% : 20% and 8% : 20%.
The change in the attached biomass on the porous polymerparticle carrier under different operating conditions of thereactor is shown in Table 4. When the ratio of the carrier dosagewas 5% : 20%, the biomass attached to the porous polymerparticle carrier was more than 8% : 20% carrier dosage ratiounder each HRT. The reason for this phenomenon may be dueto excessive carrier. The probability of collision with each otherduring the movement of the reactor would increase, and themicroorganisms attached to the carrier would fall off during thecollision.36 At the same time, with the shortening of the HRT,the biomass attached to the porous carrier under both dosingratios tended to increase. This might be owing to the HRT
Table 4 Change of the attached biomass concentration in porouspolymer particle carriers
Dosage 2.5 h 5 h 8 h 11 h
Particle size (mm) 0.375 L 1454.59 1451.27 1436.57 1422.070.6 L 1446.25 1445.64 1428.40 1411.73
Film thickness (mm) 0.375 L 51.46 49.81 42.46 35.200.6 L 47.30 46.99 38.37 30.04
Density (mg cm�3) 0.375 L 97.89 98.10 99.01 99.920.6 L 98.41 98.45 99.52 100.56
Biomass (mg L�1) 0.375 L 1682.76 1628.13 1385.97 1147.640.6 L 1545.43 1535.39 1251.72 978.18
RSC Advances Paper
Ope
n A
cces
s A
rtic
le. P
ublis
hed
on 1
0 A
ugus
t 202
1. D
ownl
oade
d on
1/4
/202
2 2:
43:2
7 A
M.
Thi
s ar
ticle
is li
cens
ed u
nder
a C
reat
ive
Com
mon
s A
ttrib
utio
n 3.
0 U
npor
ted
Lic
ence
.View Article Online
shortened so that the organic load increased, which in turn ledto a faster growth of biomass.46
Comparing Fig. 7 with Table 4, the attached biomass of theporous polymer particle carrier was generally higher than theBioM™ carrier. When the HRT was 2.5 h, the organic load washigh and the attached biomass on the BioM™ carrier wasaffected and reduced, while the attached biomass on the porouspolymer carrier still maintained an increasing trend. Thisindicated that the porous polymer particle carrier had a bettermicrobial immobilization effect than the BioM™ carrier. Thereason is that the porous polymer particle carrier has a porousstructure and good permeability. The microbial ora could besimultaneously attached to the surface of the carrier and theinternal pores. This porous structure can signicantly increasethe degree of microbial aggregation, and facilitate both themetabolism of microorganisms and the diffusion of metabo-lites, thereby increasing the immobilization effect of the carrieron microorganisms.47
3.2.3 Variation of suspended sludge concentration. Duringthe operation of the reactor, a part of the porous polymerparticle carrier was naturally deposited at the bottom of theaeration zone and the sedimentation zone. Furthermore, a partof the suspended sludge was intercepted by these carriersentering the sedimentation zone from the aeration zone byltering, so the activated sludge in the reactor can be main-tained in a certain amount. In the experiment, the changes ofparameters, such as MLSS, MLVSS, MLVSS/MLSS, wereobserved by gravimetric method.
Fig. 7 Dynamic changes of the sludge concentration in anaerobicgranular sludge.
27328 | RSC Adv., 2021, 11, 27322–27332
The variation of sludge concentration under differentworking conditions is shown in Fig. 7. As the ratio of the carrierdosage increased, the sludge concentration in the reactor rstincreased and then decreased. When the carrier ratio was5% : 20% and the HRT was 5 h, MLVSS reached highest, whichwas 1273.33 mg L�1. Under different HRT, the MLVSS/MLSSvalue showed a low trend in the middle. That is, MLVSS/MLSSwas higher when the HRT was longer or shorter. However, theactivity of the suspended sludge in the reactor was generallylow, and the MLVSS/MLSS was kept at about 0.5. Since thisexperiment mainly studied the attachment of biolm on thecarrier, the change of the concentration of the suspendedsludge in the reactor was not considered as the key analysis.
3.2.4 Changes in total biomass. The biomass concentra-tion of the BioM™ carrier in the reactor and the porous polymerparticle carrier under different operating conditions (the carrierdosage ratio was 2% : 20%, the biomass concentration wasrecorded as 0), and the mixture volatile sludge concentration(the sum ofMLVSS) was used as the total biomass concentrationof the reactor during this period and analyzed.
The results are shown in Table 5. When the ratios of carrierdosage were 5% : 20% and 8% : 20%, the total biomass in thereactor increased with the HRT approaching 5 h. The totalbiomass in the reactor reached the highest when the HRTreached 5 h. It was speculated that this phenomenon was due tothe increasing hydraulic shear caused by too short HRT.43
Hydraulic shearing had a great inuence on the peeling ofbiolms.48 Excessive hydraulic shearing could increase thedifficulty of attaching and xing microorganisms to thecarrier.44 However, if the HRT was too long, the organic load inthe reactor would decrease, which may affect the increase of theamount of biomass attached. Moreover, the biomass at5% : 20% of the carrier dosage ratio was more than 8% : 20%,indicating that the growth of microorganisms in the reactorwould be affected if the carrier dosage ratio was too high.
When the carrier dosage ratio was 2% : 20%, the change oftotal biomass in the reactor was exactly opposite. When the HRTwas 2.5 h or 11 h, the biomass in the reactor was signicantlyhigher. The reason for this phenomenon was presumed to bethat the carrier dosing ratio was too low, and the total biomasswas mainly derived from the biomass attached to the BioM™
carrier.
3.3 Changes in SMP in the HCBR
Soluble microbial products (SMP) were one of the importantcomponents of dissolved CODCr in the effluent of the biore-actor.49 It was the dissolved substances released to the outsideduring the matrix decomposition process of microorganisms,the process of degrading pollutants and its own metabolism, aswell as attenuation, death, endogenous respiration process orresponse to environmental stress. SMP can be divided into twotypes according to the generation method:50 UAP and BAP,which were associated with substrate metabolism and biomassgrowth and associated with biomass decay, respectively. Theywere mainly produced by the microbial matrix decompositionprocess (UAP) and endogenous respiration process (BAP).51
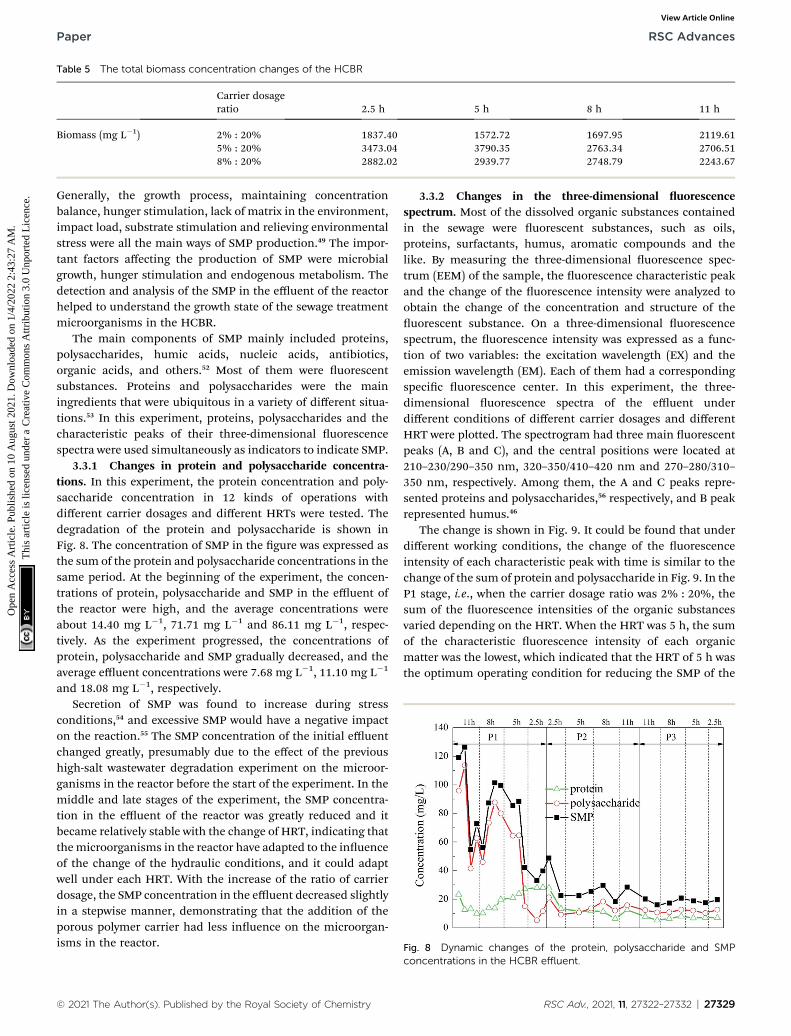
Fig. 8 Dynamic changes of the protein, polysaccharide and SMP
Paper RSC Advances
Ope
n A
cces
s A
rtic
le. P
ublis
hed
on 1
0 A
ugus
t 202
1. D
ownl
oade
d on
1/4
/202
2 2:
43:2
7 A
M.
Thi
s ar
ticle
is li
cens
ed u
nder
a C
reat
ive
Com
mon
s A
ttrib
utio
n 3.
0 U
npor
ted
Lic
ence
.View Article Online
Generally, the growth process, maintaining concentrationbalance, hunger stimulation, lack of matrix in the environment,impact load, substrate stimulation and relieving environmentalstress were all the main ways of SMP production.49 The impor-tant factors affecting the production of SMP were microbialgrowth, hunger stimulation and endogenous metabolism. Thedetection and analysis of the SMP in the effluent of the reactorhelped to understand the growth state of the sewage treatmentmicroorganisms in the HCBR.
The main components of SMP mainly included proteins,polysaccharides, humic acids, nucleic acids, antibiotics,organic acids, and others.52 Most of them were uorescentsubstances. Proteins and polysaccharides were the mainingredients that were ubiquitous in a variety of different situa-tions.53 In this experiment, proteins, polysaccharides and thecharacteristic peaks of their three-dimensional uorescencespectra were used simultaneously as indicators to indicate SMP.
3.3.1 Changes in protein and polysaccharide concentra-tions. In this experiment, the protein concentration and poly-saccharide concentration in 12 kinds of operations withdifferent carrier dosages and different HRTs were tested. Thedegradation of the protein and polysaccharide is shown inFig. 8. The concentration of SMP in the gure was expressed asthe sum of the protein and polysaccharide concentrations in thesame period. At the beginning of the experiment, the concen-trations of protein, polysaccharide and SMP in the effluent ofthe reactor were high, and the average concentrations wereabout 14.40 mg L�1, 71.71 mg L�1 and 86.11 mg L�1, respec-tively. As the experiment progressed, the concentrations ofprotein, polysaccharide and SMP gradually decreased, and theaverage effluent concentrations were 7.68 mg L�1, 11.10 mg L�1
and 18.08 mg L�1, respectively.Secretion of SMP was found to increase during stress
conditions,54 and excessive SMP would have a negative impacton the reaction.55 The SMP concentration of the initial effluentchanged greatly, presumably due to the effect of the previoushigh-salt wastewater degradation experiment on the microor-ganisms in the reactor before the start of the experiment. In themiddle and late stages of the experiment, the SMP concentra-tion in the effluent of the reactor was greatly reduced and itbecame relatively stable with the change of HRT, indicating thatthemicroorganisms in the reactor have adapted to the inuenceof the change of the hydraulic conditions, and it could adaptwell under each HRT. With the increase of the ratio of carrierdosage, the SMP concentration in the effluent decreased slightlyin a stepwise manner, demonstrating that the addition of theporous polymer carrier had less inuence on the microorgan-isms in the reactor.
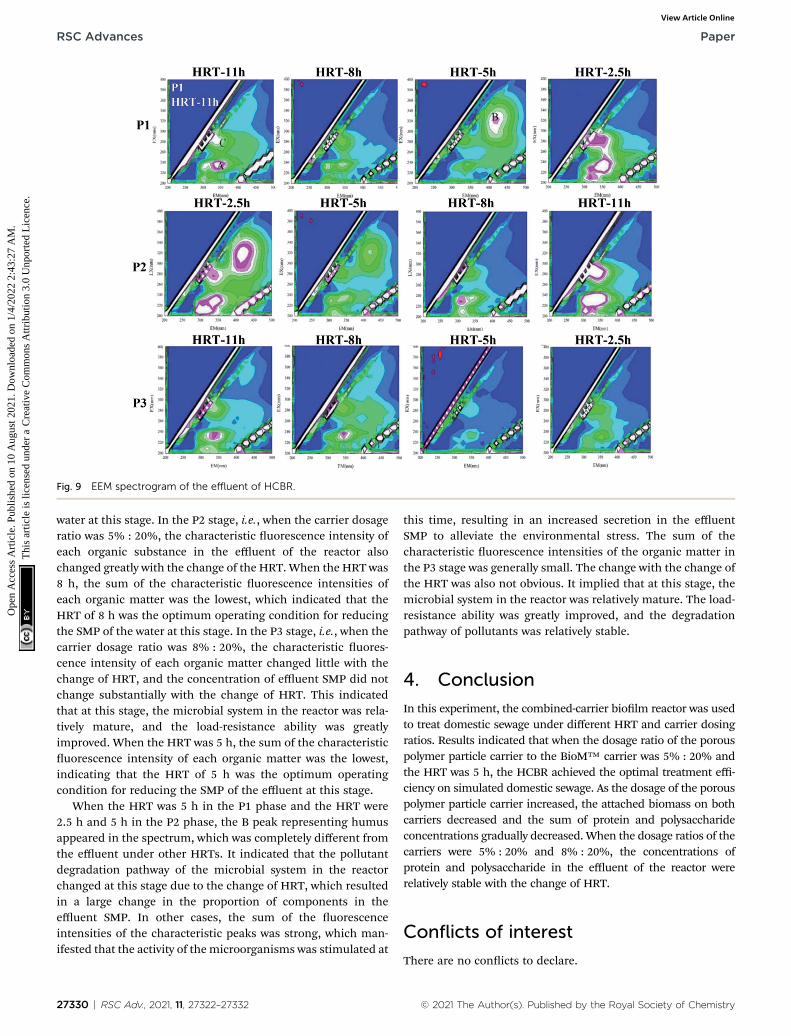
3.3.2 Changes in the three-dimensional uorescencespectrum. Most of the dissolved organic substances containedin the sewage were uorescent substances, such as oils,proteins, surfactants, humus, aromatic compounds and thelike. By measuring the three-dimensional uorescence spec-trum (EEM) of the sample, the uorescence characteristic peakand the change of the uorescence intensity were analyzed toobtain the change of the concentration and structure of theuorescent substance. On a three-dimensional uorescencespectrum, the uorescence intensity was expressed as a func-tion of two variables: the excitation wavelength (EX) and theemission wavelength (EM). Each of them had a correspondingspecic uorescence center. In this experiment, the three-dimensional uorescence spectra of the effluent underdifferent conditions of different carrier dosages and differentHRT were plotted. The spectrogram had three main uorescentpeaks (A, B and C), and the central positions were located at210–230/290–350 nm, 320–350/410–420 nm and 270–280/310–350 nm, respectively. Among them, the A and C peaks repre-sented proteins and polysaccharides,56 respectively, and B peakrepresented humus.46
The change is shown in Fig. 9. It could be found that underdifferent working conditions, the change of the uorescenceintensity of each characteristic peak with time is similar to thechange of the sum of protein and polysaccharide in Fig. 9. In theP1 stage, i.e., when the carrier dosage ratio was 2% : 20%, thesum of the uorescence intensities of the organic substancesvaried depending on the HRT. When the HRT was 5 h, the sumof the characteristic uorescence intensity of each organicmatter was the lowest, which indicated that the HRT of 5 h wasthe optimum operating condition for reducing the SMP of the
water at this stage. In the P2 stage, i.e., when the carrier dosageratio was 5% : 20%, the characteristic uorescence intensity ofeach organic substance in the effluent of the reactor alsochanged greatly with the change of the HRT. When the HRT was8 h, the sum of the characteristic uorescence intensities ofeach organic matter was the lowest, which indicated that theHRT of 8 h was the optimum operating condition for reducingthe SMP of the water at this stage. In the P3 stage, i.e., when thecarrier dosage ratio was 8% : 20%, the characteristic uores-cence intensity of each organic matter changed little with thechange of HRT, and the concentration of effluent SMP did notchange substantially with the change of HRT. This indicatedthat at this stage, the microbial system in the reactor was rela-tively mature, and the load-resistance ability was greatlyimproved. When the HRT was 5 h, the sum of the characteristicuorescence intensity of each organic matter was the lowest,indicating that the HRT of 5 h was the optimum operatingcondition for reducing the SMP of the effluent at this stage.
When the HRT was 5 h in the P1 phase and the HRT were2.5 h and 5 h in the P2 phase, the B peak representing humusappeared in the spectrum, which was completely different fromthe effluent under other HRTs. It indicated that the pollutantdegradation pathway of the microbial system in the reactorchanged at this stage due to the change of HRT, which resultedin a large change in the proportion of components in theeffluent SMP. In other cases, the sum of the uorescenceintensities of the characteristic peaks was strong, which man-ifested that the activity of the microorganisms was stimulated at
27330 | RSC Adv., 2021, 11, 27322–27332
this time, resulting in an increased secretion in the effluentSMP to alleviate the environmental stress. The sum of thecharacteristic uorescence intensities of the organic matter inthe P3 stage was generally small. The change with the change ofthe HRT was also not obvious. It implied that at this stage, themicrobial system in the reactor was relatively mature. The load-resistance ability was greatly improved, and the degradationpathway of pollutants was relatively stable.
4. Conclusion
In this experiment, the combined-carrier biolm reactor was usedto treat domestic sewage under different HRT and carrier dosingratios. Results indicated that when the dosage ratio of the porouspolymer particle carrier to the BioM™ carrier was 5% : 20% andthe HRT was 5 h, the HCBR achieved the optimal treatment effi-ciency on simulated domestic sewage. As the dosage of the porouspolymer particle carrier increased, the attached biomass on bothcarriers decreased and the sum of protein and polysaccharideconcentrations gradually decreased. When the dosage ratios of thecarriers were 5% : 20% and 8% : 20%, the concentrations ofprotein and polysaccharide in the effluent of the reactor wererelatively stable with the change of HRT.
This study was supported by grants from the Township SewageTreatment Technology Integration and Demonstration Project(2017SZ0180) of R & D Projects of Sichuan Science and Tech-nology Program.
References
1 Q. H. Zhang, W. N. Yang, H. H. Ngo, W. S. Guo, P. K. Jin,M. Dzakpasu, S. J. Yang, Q. Wang, X. C. Wang and D. Ao,Environ. Int., 2016, 92–93, 11–22.
2 A. Barwal and R. Chaudhary, Rev. Environ. Sci. Bio/Technol.,2014, 13, 285–299.
3 M. Rodgers, X. M. Zhan and B. Gallagher, Bioresour. Technol.,2003, 89, 139–143.
4 A. Zafarzadeh, B. Bina, M. Nikaeen, H. M. Attar andM. H. Nejad, Iran. J. Environ. Health Sci. Eng., 2010, 7, 353–364.
5 H. Odegaard, Water Sci. Technol., 2006, 53, 17–33.6 B. Rusten, L. J. Hem and H. Odegaard, Water Environ. Res.,1995, 67, 75–86.
7 B. Rusten, J. G. Siljudalen, A. Wien and D. Eidem, Water Sci.Technol., 1998, 38, 19–28.
8 S. J. Jahren, J. A. Rintala and H. Odegaard, Water Res., 2002,36, 1067–1075.
9 S. Chen, D. Sun and J.-S. Chung, J. Waste Manage., 2008, 28,339–346.
10 M. X. Loukidou and A. I. Zouboulis, Environ. Pollut., 2001,111, 273–281.
11 K. Tang, G. T. H. Ooi, K. Litty, K. Sundmark,K. M. S. Kaarsholm, C. Sund, C. Kragelund,M. Christensson, K. Bester and H. R. Andersen, Bioresour.Technol., 2017, 236, 77–86.
12 H. Helness and H. Odegaard, Water Sci. Technol., 1999, 40,161–168.
13 G. Pastorelli, R. Canziani, L. Pedrazzi and A. Rozzi,Water Sci.Technol., 1999, 40, 169–176.
14 P. B. Hatzinger, C. Lewis and T. S. Webster,Water Res., 2017,126, 361–371.
15 M. Rajasimman and C. Karthikeyan, J. Hazard. Mater., 2007,143, 82–86.
16 M. J. Nelson, G. Nakhla and J. Zhu, Engineering, 2017, 3, 330–342.
17 M. Fouad and R. Bhargava, J. Environ. Manage., 2005, 74,245–253.
18 R. Sowmeyan and G. Swaminathan, Bioresour. Technol.,2008, 99, 3877–3880.
19 F. Morgan-Sagastume, Crit. Rev. Environ. Sci. Technol., 2018,48, 439–470.
20 A. R. Barros, M. A. Tallarico Adorno, I. K. Sakamoto,S. I. Maintinguer, M. B. Amancio Varesche and E. L. Silva,Bioresour. Technol., 2011, 102, 3840–3847.
21 S. N. H. Abu Bakar, H. Abu Hasan, A. W. Mohammad,S. R. S. Abdullah, R. Ngteni and K. M. M. Yusof, ProcessSaf. Environ. Prot., 2020, 144, 1.