STUDY ON IMPLEMENTATION OF INTEGRATED SPATIAL PLAN FOR THE MAMMINASATA METROPOLITAN AREA 10. Development Program 10-1 10. DEVELOPMENT PROGRAM 10.1 Development Program Mamminasata development programs to the year 2020 are proposed for implementation, following the regional development strategy for Mamminasata set as shown below. Mamminasata Development Strategy (i) Mamminasata as a Logistic and Trade Hub in East Indonesia (ii) Mamminasata to Spearhead Overall Development of Sulawesi (iii) Reduction in Pollutant and Environmental Loads (iv) Creation of a Cycle-oriented Society (v) Enhancement of Locally Added Value (vi) Demand-oriented Service Delivery (vii) Participatory Approach in Spatial Planning and Implementation (viii) Implementability of Spatial Plans Proposed programs are grouped into, (1) Economic development support program, (2) Urban environment and infrastructure development program, (3) Economic infrastructure development program, and (4) Urban management/institutional strengthening program. Figure 10.1: Four Programs (2) Urban environment & infrastructure development program Flood control & drainage Water supply & sewerage Solid waste management Environmental improvement (4) Urban management/ institutional strengthening program Organization strengthening Legislation strengthening Urban management operation system (1) Economic development support program Agriculture Industry Trade & Investment Promotion Tourism Mamminasata Development Program (3) Economic infrastructure development program Electric power supply Telecommunication service Transportation
Transcript
STUDY ON IMPLEMENTATION OF INTEGRATED SPATIAL PLAN FOR THE MAMMINASATA METROPOLITAN AREA 10. Development Program
10-1
10. DEVELOPMENT PROGRAM
10.1 Development Program
Mamminasata development programs to the year 2020 are proposed for implementation, following the regional development strategy for Mamminasata set as shown below.
Mamminasata Development Strategy (i) Mamminasata as a Logistic and Trade Hub in East Indonesia (ii) Mamminasata to Spearhead Overall Development of Sulawesi (iii) Reduction in Pollutant and Environmental Loads (iv) Creation of a Cycle-oriented Society (v) Enhancement of Locally Added Value (vi) Demand-oriented Service Delivery (vii) Participatory Approach in Spatial Planning and Implementation (viii) Implementability of Spatial Plans
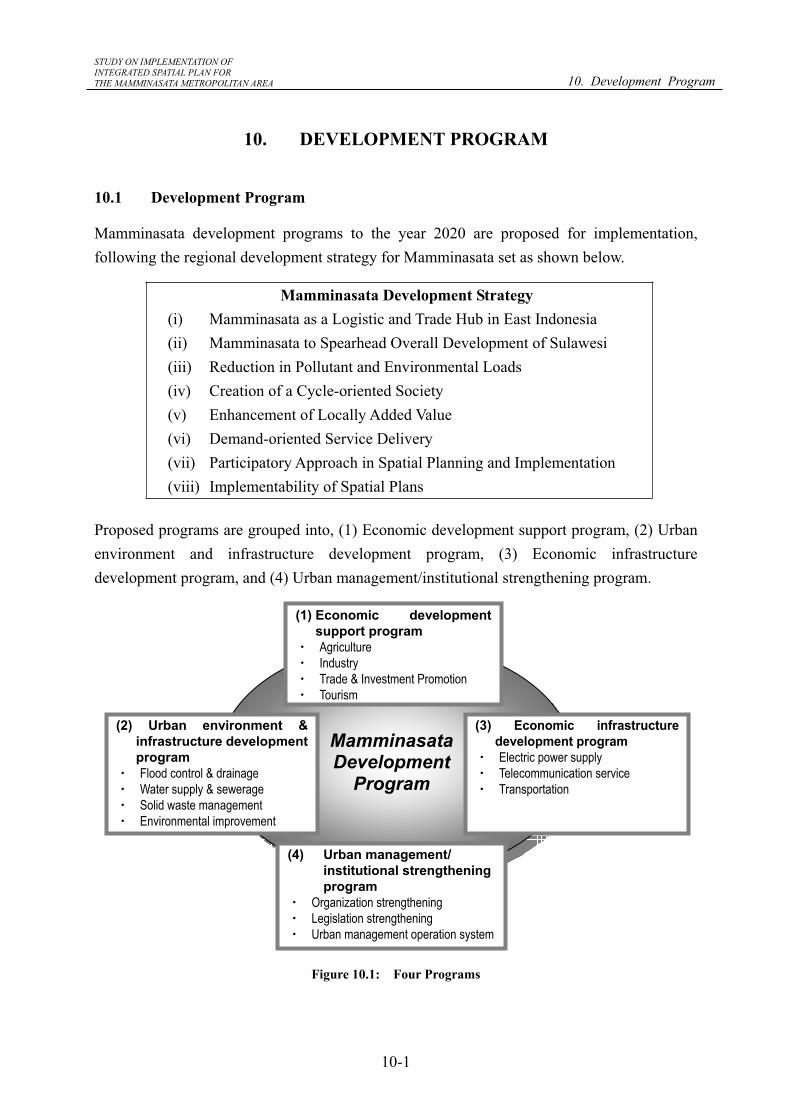
Proposed programs are grouped into, (1) Economic development support program, (2) Urban environment and infrastructure development program, (3) Economic infrastructure development program, and (4) Urban management/institutional strengthening program.
Figure 10.1: Four Programs
(2) Urban environment & infrastructure development programFlood control & drainage Water supply & sewerage Solid waste management Environmental improvement
(4) Urban management/ institutional strengthening program
Organization strengthening Legislation strengthening Urban management operation system
(1) Economic development support program AgricultureIndustryTrade & Investment Promotion Tourism
Mamminasata Development
Program
(3) Economic infrastructure development programElectric power supply Telecommunication service Transportation
STUDY ON IMPLEMENTATION OF INTEGRATED SPATIAL PLAN FOR THE MAMMINASATA METROPOLITAN AREA 10. Development Program
10-2
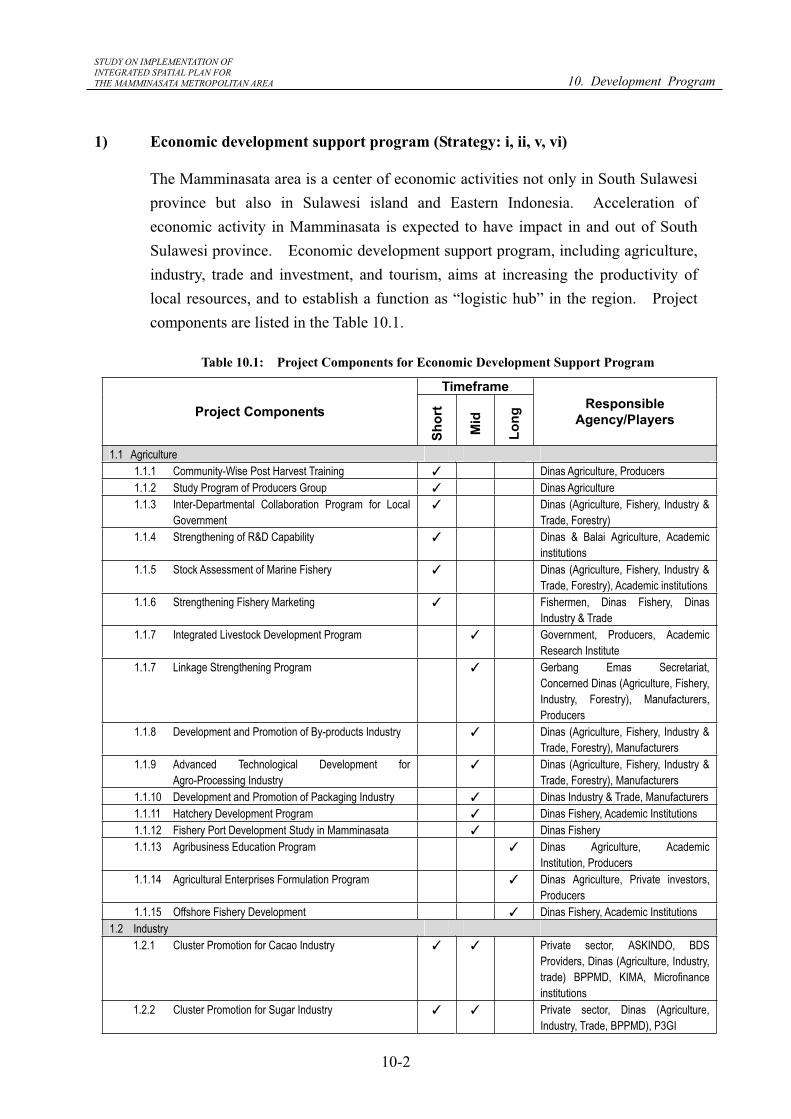
1) Economic development support program (Strategy: i, ii, v, vi)
The Mamminasata area is a center of economic activities not only in South Sulawesi province but also in Sulawesi island and Eastern Indonesia. Acceleration of economic activity in Mamminasata is expected to have impact in and out of South Sulawesi province. Economic development support program, including agriculture, industry, trade and investment, and tourism, aims at increasing the productivity of local resources, and to establish a function as “logistic hub” in the region. Project components are listed in the Table 10.1.
Table 10.1: Project Components for Economic Development Support Program
Timeframe
Project Components
Shor
t
Mid
Long
ResponsibleAgency/Players
1.1 Agriculture 1.1.1 Community-Wise Post Harvest Training Dinas Agriculture, Producers 1.1.2 Study Program of Producers Group Dinas Agriculture 1.1.3 Inter-Departmental Collaboration Program for Local
Government Dinas (Agriculture, Fishery, Industry &
Trade, Forestry) 1.1.4 Strengthening of R&D Capability Dinas & Balai Agriculture, Academic
institutions 1.1.5 Stock Assessment of Marine Fishery Dinas (Agriculture, Fishery, Industry &
Trade, Forestry), Academic institutions 1.1.6 Strengthening Fishery Marketing Fishermen, Dinas Fishery, Dinas
Industry & Trade 1.1.7 Integrated Livestock Development Program Government, Producers, Academic
Research Institute 1.1.7 Linkage Strengthening Program Gerbang Emas Secretariat,
Concerned Dinas (Agriculture, Fishery, Industry, Forestry), Manufacturers, Producers
1.1.8 Development and Promotion of By-products Industry Dinas (Agriculture, Fishery, Industry & Trade, Forestry), Manufacturers
1.1.9 Advanced Technological Development for Agro-Processing Industry
Dinas (Agriculture, Fishery, Industry & Trade, Forestry), Manufacturers
1.1.10 Development and Promotion of Packaging Industry Dinas Industry & Trade, Manufacturers 1.1.11 Hatchery Development Program Dinas Fishery, Academic Institutions 1.1.12 Fishery Port Development Study in Mamminasata Dinas Fishery 1.1.13 Agribusiness Education Program Dinas Agriculture, Academic
Institution, Producers 1.1.14 Agricultural Enterprises Formulation Program Dinas Agriculture, Private investors,
Producers 1.1.15 Offshore Fishery Development Dinas Fishery, Academic Institutions
1.2 Industry 1.2.1 Cluster Promotion for Cacao Industry Private sector, ASKINDO, BDS
Providers, Dinas (Agriculture, Industry, trade) BPPMD, KIMA, Microfinance institutions
1.2.2 Cluster Promotion for Sugar Industry Private sector, Dinas (Agriculture, Industry, Trade, BPPMD), P3GI
STUDY ON IMPLEMENTATION OF INTEGRATED SPATIAL PLAN FOR THE MAMMINASATA METROPOLITAN AREA 10. Development Program
10-3
Timeframe
Project Components
Shor
t
Mid
Long
ResponsibleAgency/Players
1.2.3 Strengthening Capacity of BDS Provider BDS providers, Supporting institutions (BDI, RETPC), Dinas Industry & Trade
1.2.4 Strengthening Capacity of UPT BPTTL/UPT, Dinas Industry & Trade 1.2.5 Strengthening Capacity of BDI PUSDIKLAT-INDAK/BDI, Dinas
Industry & Trade 1.2.6 Strengthening Capacity of RETPC NAFED/RETPC, Dinas Industry &
Trade, BDS providers 1.2.7 Strengthening Capacity of BLKI BLKI, Dinas Labor & Transmigration 1.2.8 Compiling Industrial Statistics BPS, Dinas (Disperindag) 1.2.9 Development of Industrial Area KIMA, BPPMD, BKSPMM 1.2.10 Strengthening Capacity of Technical Universities Faculty of Techniques, UNHAS, LPM
UNHAS, LPT-metalwork, Makassar 1.3 Trade and Investment
1.3.1 Investment Incentives Ministry of Finance, Investment Coordinating Agency
1.3.2 Establishment of Processing Industrial Park KIMA, Regional governments 1.3.3 Designation of Bonded Zones Ministry of Finance 1.3.4 Effective exhibitions Dinas Industry & Trade, RETPC,
NAFED1.3.5 Offering of “Award for Excellent Mamminasata Export RETPC, Ministry of Finance 1.3.6 “Target China”: Intensive Marketing in Chinese Market Dinas Industry & Trade, RETPC
1.4 Tourism 1.4.1 Improvement of Fort Rotterdam Dinas Culture & Tourism, Makassar
city, Ministry of Culture & Tourism 1.4.2 Somba Opu Traditional Culture Park Project Dinas Culture & Tourism, Makassar
city, Indonesia Hotel and Restaurant Association, Private sector
1.4.3 Improvement of Beach Area in front of Fort Rotterdam Makassar city, Indonesia Hotel and Restaurant Association, Private sector
1.4.4 Improvement of Tourism Information Service Tourism Office (South Sulawesi, Makassar, Gowa, Maros, Takalar)
1.4.5 Improvement of Existing Tourism Facility Provincial government, Makassar city, regencies in Mamminasata
1.4.6 Promotion of Marine Tourism Tourism Office (South Sulawesi, Makassar, Gowa, Maros, Takalar), Hotel and Restaurant Association, Travel Agent Association
1.4.7 Development of Nature and Community-based Tourism
Tourism office, NGO, Indonesian Tours and Travel Agent Association
2) Urban environment and infrastructure development program (Strategy: iii, vii, viii)
Urban environment and infrastructure development program aims at providing utility and services for the people, creating a clean urban environment, and reducing risks of floods and other hazard. Flood control and drainage improvement, water supply and sewerage improvement, solid waste management are included in the program.
STUDY ON IMPLEMENTATION OF INTEGRATED SPATIAL PLAN FOR THE MAMMINASATA METROPOLITAN AREA 10. Development Program
10-4
Land re-adjustment projects will be implemented together with infrastructure development. Environmental strengthening will promote environmental awareness along with environmental improvement measures. Project components are listed in Table 10.2.
Table 10.2: Project Components for Urban/Social Infrastructure Development Program
Timeframe
Project Components
Shor
t
Mid
Long
ResponsibleAgency/Players
2.1 Flood Control and Drainage Improvement 2.1.1 Maros River Flood Control Project Dinas PSDA, Maros District
Government2.1.2 Tallo River Flood Control Project Dinas PSDA, Makassar City
Government2.1.3 Gamanti/Pappa River Flood Control Project Dinas PSDA, Gowa and Takalar
District Government 2.1.4 North Jeneberang Area Urban Drainage Improvement
Project Dinas PSDA, Gowa District
Government2.2 Water Supply and Sewerage Improvement
2.2.1 Maros Water Supply Project (water loss overcoming, PSP, new WTPs)
PDAM Maros, Maros District Government
2.2.2 Makassar Water Supply Project (water loss overcoming, PSP, expansion of Somba Opu WTP, new WTPs)
PDAM Makassar, Makassar City Government
2.2.3 Gowa Water Supply Project (water loss overcoming, PSP, new WTPs)
PDAM Gowa, Gowa District Government
2.2.4 Takalar Water Supply Project (water loss overcoming, PSP new WTPs)
PDAM Takalar, Takalar District Government
2.2.5 Maros Wastewater Management Project (community based activity, law enforcement)
Dinas Spatial Plan (Province, Maros)
2.2.6 Makassar Wastewater Management Project (community based activities, law enforcement, off-site system installation)
Dinas Spatial Plan (Province, Makassar)
2.2.7 Gowa Wastewater Management Project (community based activity, law enforcement)
Dinas Spatial Plan (Province, Gowa)
2.2.8 Takalar Wastewater Management Project (community based activity, law enforcement)
Dinas Spatial Plan (Province, Takalar)
2.3 Solid Waste Management 2.3.1 Community Base Activity (public awareness of
recycling) Dinas Beautification and Environment (Makassar), Dinas Spatial Plan Province, Dinas Cleansing (Maros, Gowa, Takalar), Community
2.3.2 Improvement of Institution Dinas Beautification and Environment (Makassar), Dinas Spatial Plan Province, Dinas Cleansing (Maros, Gowa, Takalar), Community
2.3.3 Improvement of Collection and Transportation Dinas Beautification and Environment (Makassar), Dinas Spatial Plan Province, Dinas Cleansing (Maros, Gowa, Takalar), Community
2.3.4 Improvement and Expansion of Existing Landfill Sites Dinas Beautification and Environment (Makassar), Dinas Spatial Plan
STUDY ON IMPLEMENTATION OF INTEGRATED SPATIAL PLAN FOR THE MAMMINASATA METROPOLITAN AREA 10. Development Program
10-5
Timeframe
Project Components
Shor
t
Mid
Long
ResponsibleAgency/Players
Province, Dinas Cleansing (Maros, Gowa, Takalar), Community
2.3.5 Construction of New Landfill Site Dinas Beautification and Environment (Makassar), Dinas Spatial Plan Province, Dinas Cleansing (Maros, Gowa, Takalar), Community
2.3.6 Construction of Waste Separate Facility Dinas Beautification and Environment (Makassar), Dinas Spatial Plan Province, Dinas Cleansing (Maros, Gowa, Takalar), Community
2.4 Urban greenery 2.4.1 Park development City/district government 2.4.2 Reforestation City/district government 2.4.3 Street greenery City/district government
2.5 Environmental improvement 2.5.1 Promotion of Environmental Awareness Dinas Education, BAPEDALDA 2.5.2 Waste and Garbage Collection and Recycling Dinas Spatial Planning, Academic,
NGOs2.5.3 Protection of Biodiversity and Natural Resources Dinas Spatial Planning, BAPEDALDA,
City & District government 2.5.4 Air Pollution Control Dinas Spatial Planning, BAPEDALDA,
City & District government 2.5.5 Water Contamination Control Dinas Spatial Planning, BAPEDALDA,
City & District government
3) Economic infrastructure development program (Strategy: i, viii)
Economic infrastructure development program aims at providing infrastructure necessary for economic activities. Electric power supply, telecommunications service improvement, and transportation are to be improved to support the Mamminasata economy. Project components are listed in the Table 10.3.
Table 10.3: Project Components for Economic Infrastructure Development Program
Timeframe
Project Components
Shor
t
Mid
Long
ResponsibleAgency/Players
3.1 Electric Power Supply 3.1.1 Earliest Implementation of the Sengkang and Takalar
Power Plants PLN
3.1.2 Energy Conservation Campaign PLN 3.1.3 Urgent Expansion of Transformer Capacity in the
Mamminasata Area PLN
3.1.4 Construction of the Ring Transmission Networks Public & PLN
3.1.5 Rehabilitation and Upgrading of Existing Distribution Lines
PLN
STUDY ON IMPLEMENTATION OF INTEGRATED SPATIAL PLAN FOR THE MAMMINASATA METROPOLITAN AREA 10. Development Program
10-6
Timeframe
Project Components
Shor
t
Mid
Long
ResponsibleAgency/Players
3.1.6 Departure from Dependency on Oil Public & PLN, other Private sector
3.1.7 Earlier Construction of Hydropower Stations using PPP and CDM
Private or PPP
3.2 Telecommunications Service Improvement 3.2.1 Introduction of e-Government for Gowa and Maros Gowa district government, Maros
district government 3.2.2 Expansion of CDMA-Based Fixed Phone Service Area TELKOM, City/District government
(Makassar, Maros, Gowa, Takalar) 3.2.3 Reduced Tariff in High Speed Internet Service Private (telecommunication company) 3.2.4 Rehabilitation and Modernization of Existing
3.3 Transportation Development 3.3.1 Jl. Sutami toll road between Makassar port and
Hassanuddin Airport Dinas Regional Infrastructure, Private
3.3.2 Jl. Perintis together with Jl. Sumoharjo Dinas Regional Infrastructure 3.3.3 Alauddin road from Pettarani to Sungguminasa Dinas Regional Infrastructure 3.3.4 Hertasning road extension Dinas Regional Infrastructure 3.3.5 Malino road from Sungguminasa to Malino direction Dinas Regional Infrastructure 3.3.6 Takalar access road from Sungguminasa to Takalar
direction Dinas Regional Infrastructure
3.3.6 Middle Ring Road Dinas Regional Infrastructure 3.3.7 KIMA (Jl Kapasa Raya) Dinas Regional Infrastructure 3.3.8 Tanjung Bunga Access Dinas Regional Infrastructure 3.3.9 Mamminasa Bypass Dinas Regional Infrastructure 3.3.10 Mamminasa Bypass Bridge Dinas Regional Infrastructure 3.3.11 Abudullah Daeng Sirua Dinas Regional Infrastructure 3.3.12 Around AirPort Dinas Regional Infrastructure 3.3.13 AirPort Access Dinas Regional Infrastructure 3.3.14 Trans Sulawesi Dinas Regional Infrastructure 3.3.15 KIWA Access Dinas Regional Infrastructure 3.3.16 Around Sunggminasa Dinas Regional Infrastructure 3.3.17 Road Facility Improvement Dinas Regional Infrastructure 3.3.18 Public Transportation Service Dinas Regional Infrastructure 3.3.19 Introduction of Traffic Demand Management in
Makassar Dinas Regional Infrastructure
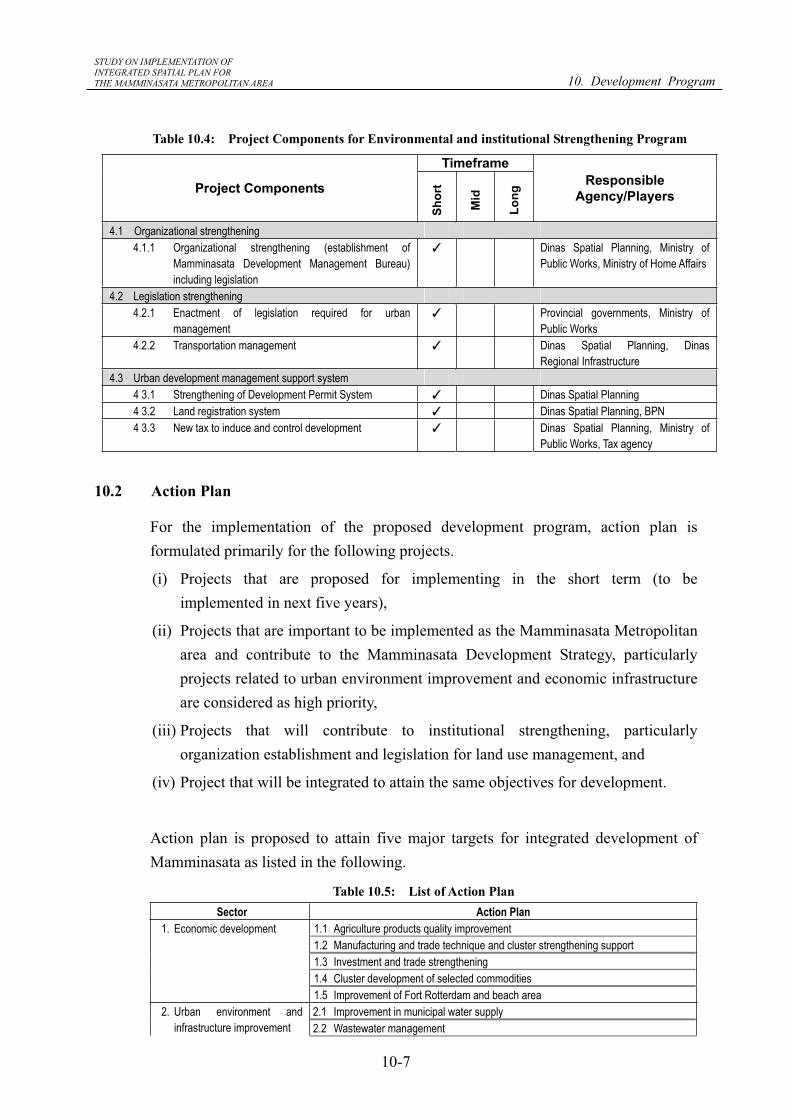
4) Urban management and institutional strengthening program (Strategy; iii, vi, viii)
Urban management and institutions are formulated for Mamminasata development. Institutional strengthening program aims at strengthening capability of Mamminasata development implementation including organization strengthening, legislation strengthening for urban development control, and urban management operation system development. Project components are listed in Table 10.4.
STUDY ON IMPLEMENTATION OF INTEGRATED SPATIAL PLAN FOR THE MAMMINASATA METROPOLITAN AREA 10. Development Program
10-7
Table 10.4: Project Components for Environmental and institutional Strengthening Program
Timeframe
Project Components
Shor
t
Mid
Long
ResponsibleAgency/Players
4.1 Organizational strengthening 4.1.1 Organizational strengthening (establishment of
Mamminasata Development Management Bureau) including legislation
Dinas Spatial Planning, Ministry of Public Works, Ministry of Home Affairs
4.2 Legislation strengthening 4.2.1 Enactment of legislation required for urban
management Provincial governments, Ministry of
Public Works 4.2.2 Transportation management Dinas Spatial Planning, Dinas
Regional Infrastructure 4.3 Urban development management support system
4 3.1 Strengthening of Development Permit System Dinas Spatial Planning 4 3.2 Land registration system Dinas Spatial Planning, BPN 4 3.3 New tax to induce and control development Dinas Spatial Planning, Ministry of
Public Works, Tax agency
10.2 Action Plan
For the implementation of the proposed development program, action plan is formulated primarily for the following projects.
(i) Projects that are proposed for implementing in the short term (to be implemented in next five years),
(ii) Projects that are important to be implemented as the Mamminasata Metropolitan area and contribute to the Mamminasata Development Strategy, particularly projects related to urban environment improvement and economic infrastructure are considered as high priority,
(iii) Projects that will contribute to institutional strengthening, particularly organization establishment and legislation for land use management, and
(iv) Project that will be integrated to attain the same objectives for development.
Action plan is proposed to attain five major targets for integrated development of Mamminasata as listed in the following.
Table 10.5: List of Action Plan Sector Action Plan
1. Economic development 1.1 Agriculture products quality improvement 1.2 Manufacturing and trade technique and cluster strengthening support 1.3 Investment and trade strengthening 1.4 Cluster development of selected commodities 1.5 Improvement of Fort Rotterdam and beach area
2.1 Improvement in municipal water supply 2. Urban environment and infrastructure improvement 2.2 Wastewater management
STUDY ON IMPLEMENTATION OF INTEGRATED SPATIAL PLAN FOR THE MAMMINASATA METROPOLITAN AREA 10. Development Program
10-8
Sector Action Plan 2.3 Solid waste management 2.4 Greenery and riparian environment improvement
3.3 Power transmission and distribution improvement 4. Institutional strengthening 4.1 Organizational strengthening 4.2 Legislation strengthening 4.3 Information management strengthening
Overall implementation management of the action plans shall be responsibility of “Mamminasata Development Management Agency (BPPM)” (detail is described in Chapter 11), and implementation of each action plan shall be managed by concerned organization, particularly provincial government which functions as “facilitator” and coordinates among stakeholders involved in implementation.
Figure 10.2: Implementation Arrangement
1) Action Plan for Economic Development
Based on the function of the Mamminasata area, action plan for economic development is designed to strengthen support system for quality improvement, marketing and trade strengthening, and institutional strengthening as listed below.
(i) Agriculture products quality improvement
(ii) Manufacturing and trade technique and cluster strengthening support
(iii) Investment and trade strengthening
(iv) Cluster development of selected commodities
(v) Improvement of Fort Rotterdam and beach area
Implementing Agency
BPPMOverall management of action plan implementation (sectors, district/city government, central government Monitoring and evaluation
Provincial Government
District/CityGovernment
Academic & Institution
PrivateSector
CentralGovernment
BKSPMM
Coordination Management
STUDY ON IMPLEMENTATION OF INTEGRATED SPATIAL PLAN FOR THE MAMMINASATA METROPOLITAN AREA 10. Development Program
10-9
Action Plan 1.1 Agricultural products quality improvement Objective To increase farmers’ income by increasing agricultural productivity through (i) improve
crop yield, (ii) applying intensive land use (iii) introducing mixed and integrated farming with fish pond culture, and iv) developing and introducing improved varieties for major crops. To supply sufficient quantity and quality of raw materials to agro-/fishery-based processing industry, whereby strengthening linkage with those industry To strengthen commodity marketing system, including dissemination of market information to producers and empowerment of producers’ associations/organizations
Importance in Mamminasata Development
Even though Mamminasata is metropolitan area, agriculture activities are the base of the economy particularly in Maros, Gowa, and Takalar. It is also a base for the manufacturing sector because most manufacturing activities are agriculture related. In order to improve manufacturing products and to improve income from the agriculture, quality of agricultural products need to be improved.
Output (i) Increase in quality and introduction of new crops (ii) Increase production efficiency (iii) Introduction of new products from by-products (iv) Strengthening of associations/organizations
Action to be taken Community-Wise Post Harvest Training: Producers should become fully aware of product quality and market signal. For quality control at production level, commodity-wise training programs on post harvest treatment should be formulated and implemented for producers Study Program of Producers Group: In order to have better understandings on agro-processing industry for selected crop producers, periodic study tours are arranged. Participants are expected to learn how their harvest products are processed into commercial goods. It will be a trial to raise producers’ awareness of product quality. Strengthening of R&D Capability: Research and development (R&D) capability for region-specific seed / seedling varieties for agriculture and forestry are enhanced to accelerate potential unit yields and qualities. Stock Assessment of Marine Fishery: Marine fish stock assessment are conducted in order to create clear guideline and regulation, which stipulates a marine preserve area and closed seasons by species, in guidance with National Fishery Stock Committee. This assessment is carried out in scientific manner presumably by an academic institute in collaboration with state research institute so that assessment results could be given a strong scientific ground.
Implementation Arrangement Provincial government (Dinas Agriculture, Dinas Fishery, Dinas Plantation) should take initiative as “facilitator” and coordinate academic institution and producer in quality improvement. In order to select producers who are serious about the quality improvement, any training has to be charged to participants.
Stakeholders Dinas Agriculture, Dinas Fishery, Dinas Plantation, Association/institutions by commodity, academic institution
Expected Benefit Increase in agricultural product volume and value Increase in farmers income Synergy effect to manufacturing sector
Cost and Financial Source Rp. 5 billion (public investment)
Action Plan 1.2 Manufacturing and trade technique and cluster strengthening support Objective To strengthen capacity of industrial support institution and to strengthen linkage among
stakeholders so that support function to manufacturers are efficiently conducted Importance in Mamminasata Development
Economic activity involves raw material production, processing, and marketing & trade and these activities have to be coordinated well to maximize the increase in value added. The Mamminasata area plays a role in strengthening urban and rural linkage, providing support for activities, and strengthen coordination among institutions
STUDY ON IMPLEMENTATION OF INTEGRATED SPATIAL PLAN FOR THE MAMMINASATA METROPOLITAN AREA 10. Development Program
10-10
Output (i) Linkage among institutions are strengthened (ii) There is enough manpower and know-how to support manufacturing activity (iii) Existing institutions are fully utilized and O&M is properly conducted
Action to be taken Inter-Departmental Collaboration Program for Local Government: In order to strengthen linkage between production and processing sides, the cooperative activities between department of agriculture, plantation, fishery and industry, or the program such as Gerbang Emas should be consistently carried out. The aim of the program is to enhance the initiatives of each department as Governor’s Office does for Gerbang Emas. Strengthening Capacity of BDS Provider: To expand outreach to SMEs and to provide practical and customized services to SMEs by creating list of BDS providers, training of BDS (providers, and strengthen linkage between BDS providers and BDI / RETPCStrengthening Capacity of BDI (Balai Diklat Industri, Institution for Industrial Training and Education): To increase contribution of manufacturing sector by providing training courses to SMEs and BDS providers Strengthening Capacity of RETPC (Regional Export Trade Promotion Center):To increase the contribution to manufacturing sector by supporting packaging industry, providing international and domestic market information, compile industrial data, and strengthening linkage with BDS providers and other supporting institutions Strengthening Capacity of BLKI (Balai Latihan Kerja Industri, Vocational Training Center for Industry and Service): To increase contribution to manufacturing sector by strengthening training program (5S, quality control, packaging)
Implementation Arrangement Provincial government shall coordinate the actions among the stakeholders. RETPC shall be the facilitator for manufacturing trade strengthening including training with close coordination Dinas Industry & Trade. Other training institutions shall also coordinate with RETPC and Gerbang Emas. In order to select producers who are serious about the quality improvement, any training has to be charged to participants.
Stakeholders Dinas Industry & Trade, BDI, BLKI, RETPC, Academic institution, Gerbang Emas secretariat
Expected Benefit Products match the market needs Market opportunity will increase Demand will increase Value added will increase and income will increase
Cost and Financial Source Rp. 20 billion (public investment, province)
Action Plan 1.3 Investment and trade strengthening Objective To increase attractiveness of Mamminasata as investment site by providing investment
incentives and also to strengthen the linkage between producers and market (consumers) Importance in Mamminasata Development
The Mamminasata area is considered as a center of trade and distribution in South Sulawesi province and also in Eastern Indonesia. This function has to be further strengthened to accelerate economic activities in and out of South Sulawesi province.
Output (i) Investment incentives are available (tax, award) (ii) Linkage between producers and market is strengthened
Action to be taken Investment Incentives: To promote investment and to develop supporting industry to upgrade agro-/fishery industry by increasing attractiveness of investment condition such as tax privileges Designation of Bonded Zones: To promote investment by designate newly industrial zone as bonded zone in which companies can receive tax exemption (excise tax, value added tax, luxurious tax and income tax) Effective exhibitions: To promote exports by holding a variety of exhibits Offering of “Award for Excellent Mamminasata Export: To promote exports by establishing “Mamminasata Export Excellent Award” for exporters, and select certain companies for the award (possible criteria: export value, number of employments, local contents and ISO certificate) and give incentives for winners (tax exemptions
STUDY ON IMPLEMENTATION OF INTEGRATED SPATIAL PLAN FOR THE MAMMINASATA METROPOLITAN AREA 10. Development Program
10-11
proportionally to export value, eligibility to use the award logo, exemption from participation fees for exhibitions and trade missions, and features in media)
Implementation Arrangement Investment Coordination Agency shall facilitate the investment strengthening with Dinas Industry & Trade in the province. Ministry of Finance shall be involved because change in tax condition requires approval from the Ministry. RETPC shall facilitate trade promotion and exhibit.
Stakeholders Ministry of Finance, Investment Coordination Agency, KIMA, Dinas Industry & Trade, RETPC
Expected Benefit Investment will increase Trade volume will increase
Cost and Financial Source Rp. 5 billion (public investment, national and provincial)
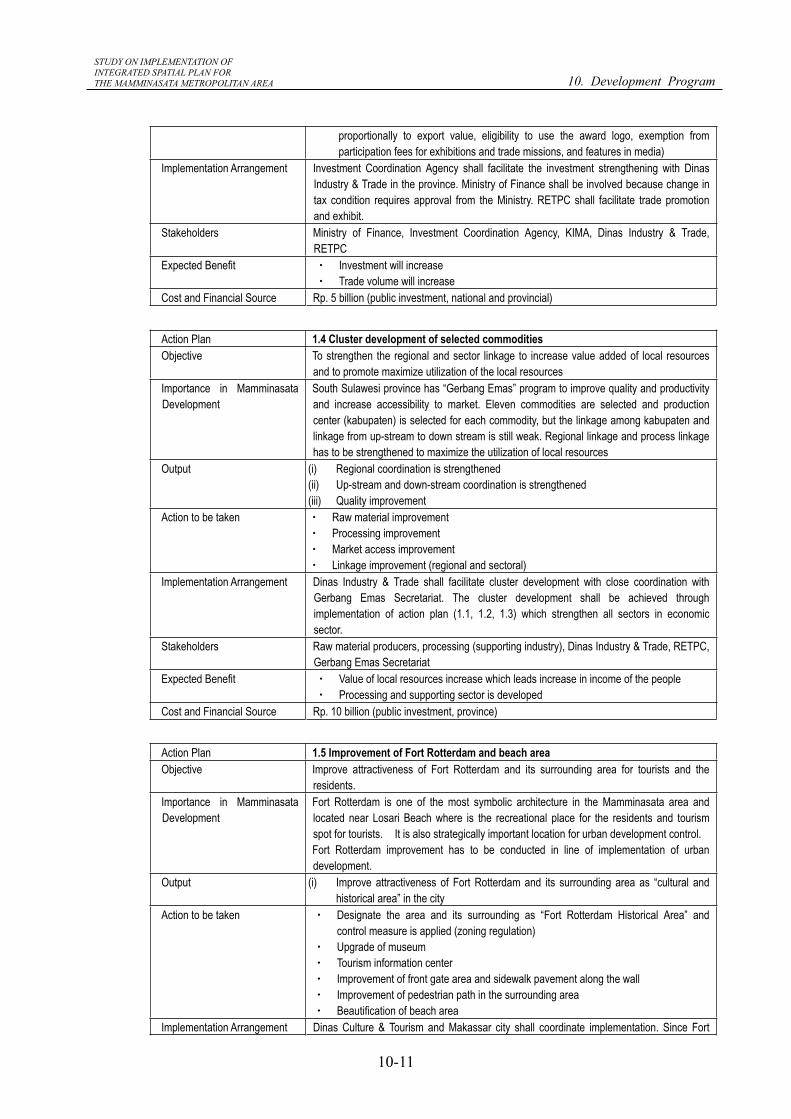
Action Plan 1.4 Cluster development of selected commodities Objective To strengthen the regional and sector linkage to increase value added of local resources
and to promote maximize utilization of the local resources Importance in Mamminasata Development
South Sulawesi province has “Gerbang Emas” program to improve quality and productivity and increase accessibility to market. Eleven commodities are selected and production center (kabupaten) is selected for each commodity, but the linkage among kabupaten and linkage from up-stream to down stream is still weak. Regional linkage and process linkage has to be strengthened to maximize the utilization of local resources
Output (i) Regional coordination is strengthened (ii) Up-stream and down-stream coordination is strengthened (iii) Quality improvement
Action to be taken Raw material improvement Processing improvement Market access improvement Linkage improvement (regional and sectoral)
Implementation Arrangement Dinas Industry & Trade shall facilitate cluster development with close coordination with Gerbang Emas Secretariat. The cluster development shall be achieved through implementation of action plan (1.1, 1.2, 1.3) which strengthen all sectors in economic sector.
Stakeholders Raw material producers, processing (supporting industry), Dinas Industry & Trade, RETPC, Gerbang Emas Secretariat
Expected Benefit Value of local resources increase which leads increase in income of the people Processing and supporting sector is developed
Cost and Financial Source Rp. 10 billion (public investment, province)
Action Plan 1.5 Improvement of Fort Rotterdam and beach area Objective Improve attractiveness of Fort Rotterdam and its surrounding area for tourists and the
residents. Importance in Mamminasata Development
Fort Rotterdam is one of the most symbolic architecture in the Mamminasata area and located near Losari Beach where is the recreational place for the residents and tourism spot for tourists. It is also strategically important location for urban development control. Fort Rotterdam improvement has to be conducted in line of implementation of urban development.
Output (i) Improve attractiveness of Fort Rotterdam and its surrounding area as “cultural and historical area” in the city
Action to be taken Designate the area and its surrounding as “Fort Rotterdam Historical Area” and control measure is applied (zoning regulation) Upgrade of museum Tourism information center Improvement of front gate area and sidewalk pavement along the wall Improvement of pedestrian path in the surrounding area Beautification of beach area
Implementation Arrangement Dinas Culture & Tourism and Makassar city shall coordinate implementation. Since Fort
STUDY ON IMPLEMENTATION OF INTEGRATED SPATIAL PLAN FOR THE MAMMINASATA METROPOLITAN AREA 10. Development Program
10-12
Rotterdam is jurisdiction of Ministry of Culture & Tourism, development requires approval of the Ministry. Project implementation shall involve the Ministry of Culture & Tourism
Stakeholders Ministry of Culture and Tourism, Dinas Culture & Tourism, Makassar city government Expected Benefit Attract more tourists in the area and increase tourism spending
Urban amenity will improve Cost and Financial Source Rp. 10 billion (public investment, province)
2) Action Plan for Urban Environmental and Infrastructure Improvement
The environmental conditions in Mamminasata have been deteriorating, and improvement in the urban environment should be implemented urgently under the total management of water supply, wastewater and solid waste management in a package in order to attain sustainable development and MDG goals. Action plan for urban environment and infrastructure improvement will include the following.
(i) Improvement in municipal water supply service
(ii) Wastewater management
(iii) Solid waste management
(iv) Greenery and riparian environment improvement
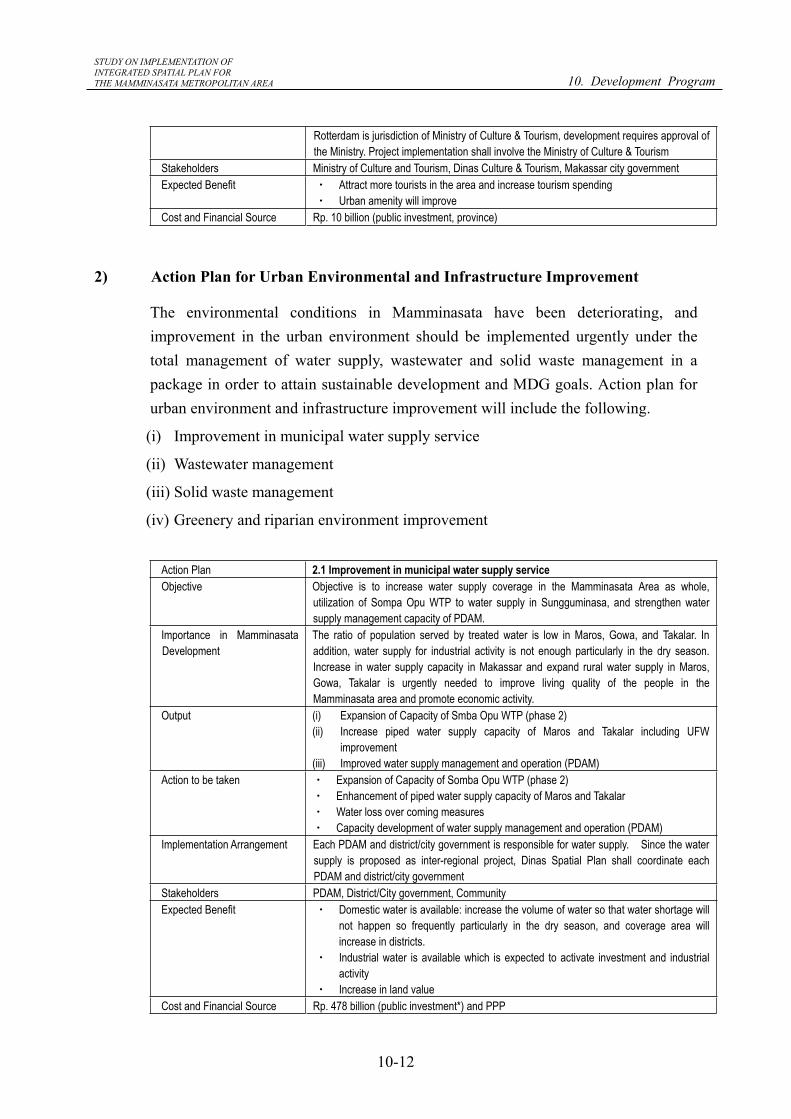
Action Plan 2.1 Improvement in municipal water supply service Objective Objective is to increase water supply coverage in the Mamminasata Area as whole,
utilization of Sompa Opu WTP to water supply in Sungguminasa, and strengthen water supply management capacity of PDAM.
Importance in Mamminasata Development
The ratio of population served by treated water is low in Maros, Gowa, and Takalar. In addition, water supply for industrial activity is not enough particularly in the dry season. Increase in water supply capacity in Makassar and expand rural water supply in Maros, Gowa, Takalar is urgently needed to improve living quality of the people in the Mamminasata area and promote economic activity.
Output (i) Expansion of Capacity of Smba Opu WTP (phase 2) (ii) Increase piped water supply capacity of Maros and Takalar including UFW
improvement (iii) Improved water supply management and operation (PDAM)
Action to be taken Expansion of Capacity of Somba Opu WTP (phase 2) Enhancement of piped water supply capacity of Maros and Takalar Water loss over coming measures Capacity development of water supply management and operation (PDAM)
Implementation Arrangement Each PDAM and district/city government is responsible for water supply. Since the water supply is proposed as inter-regional project, Dinas Spatial Plan shall coordinate each PDAM and district/city government
Stakeholders PDAM, District/City government, Community Expected Benefit Domestic water is available: increase the volume of water so that water shortage will
not happen so frequently particularly in the dry season, and coverage area will increase in districts. Industrial water is available which is expected to activate investment and industrial activityIncrease in land value
Cost and Financial Source Rp. 478 billion (public investment*) and PPP
STUDY ON IMPLEMENTATION OF INTEGRATED SPATIAL PLAN FOR THE MAMMINASATA METROPOLITAN AREA 10. Development Program
10-13
Action Plan 2.2 Wastewater management Objective Objective of the wastewater treatment management is to improve water quality in canals
and ocean and also to increase community awareness on cleaning canals. Importance in Mamminasata Development
People in the Mamminasata area consider ocean and beach are one of the important assets to be preserved for the next generations. Without sewerage system, water quality of the ocean and canal will be worsen which reduces the attractiveness of the ocean and the Mamminasata area
Output (i) Off-site sewerage system (ii) Urban amenity (green space, park) (iii) Redevelopment of the urban area
Action to be taken Implementation of short term plan in Makassar (off site system) Development of environmental structure in the project surrounding area Redevelopment project Cleaning of ditch Law enforcement
Implementation Arrangement Each district/city government is responsible for wastewater management, but since there is no wastewater system is installed in Mamminasata, Dinas Spatial Planning shall consider implementation agency.
Stakeholders Makassar city government, community, Dinas Spatial Planning Expected Benefit Improvement of hygiene condition
Improve water quality of canals and ocean which will increase tourists Improve attractiveness of urban environment Increase in land value
Cost and Financial Source Rp. 250 billion (public investment*)
Action Plan 2.3 Solid waste management Objective Objective of the solid waste management is to create clean urban environment by
constructing and managing landfill site, and at the same time, reduce the garbage volume through community empowerment
Importance in Mamminasata Development
Solid waste management has to be considered in inter-region (district/city) scale due to garbage increase caused by population increase, expansion of urban area to neighboring local government, and availability of landfill site.
Output (i) Development of final disposal site (TPA) for Makassar and Gowa (ii) Reduction of final disposal (iii) Increase in community awareness on solid waste management (iv) Urban amenity (green space, park)
Action to be taken Improvement of collection service Construction of landfill site with sanitary disposal method Implementation of environmental education Promotion of 3R (Reduce, Reuse and Recycle) Introduction of cycle-oriented society
Implementation Arrangement Dinas Spatial Planning of province is responsible for implementation because solid waste management has to be implemented as inter-regional project. Each district/Makassar is responsible for land provision and support of socialization.
Stakeholders Dinas Spatial Plan, Dinas Beautification and Environment (Makassar), Dinas Cleaning (Maros, Gowa, Takalar), Community, Schools
Expected Benefit The urban area will be clean Improve attractiveness of urban environment Increase in land value
Cost and Financial Source Pp. 355 billion (public investment*) and management concession
Action Plan 2.4 Greening and riparian environment improvement Objective Objective is create green area in the urban area and to conserve green area in semi-urban
area, which is expected to increase urban amenity Importance in Mamminasata “Create Beautiful Urban Area” is considered as high priority in Mamminasata spatial plan
STUDY ON IMPLEMENTATION OF INTEGRATED SPATIAL PLAN FOR THE MAMMINASATA METROPOLITAN AREA 10. Development Program
10-14
Development (questionnaire to students). However, open space that people can gather is limited, particularly in the urban area. It is necessary to create green open space to improve urban amenity
Output (i) Increase in green area in urban area (Urban Planning Zone) (parks, trees along road and canals/rivers)
(ii) Increase in green area outside urban area (Semi-Urban Planning Zone & Conservation Zone)
Action to be taken Conserving green area by creating parks Creating parks in the urban area through urban re-development projects Planting trees along roads, rivers and canals Community empowerment
Implementation Arrangement Dinas Spatial Plan and BAPEDALDA shall coordinate the green promotion. Green area is located in urban area and non-urban area. For non-urban area, Dinas Forestry and Dinas PSDA are responsible for greenery in forest and river respectively. For urban area, district/city government and Dinas Regional Infrastructure are responsible for parks and road, respectively.
Stakeholders Dinas Forestry, BAPEDALDA, Dinas Regional Infrastructure, Dinas PSDA, Community, Schools
Expected Benefit Increase in attractiveness of urban environment CDM
Cost and Financial Source Rp. 50 billion (Public investment)
3) Action Plan for Economic Infrastructure Improvement
The Mamminasata area has acute shortage in urban infrastructure. Frequent electricity failures interrupt factory operations, causing a great loss to enterprises and the regional economy. The road network in Mamminasata remains at sub-standard level and cannot cope with the growing traffic demand. These constraints are hindering the regional dynamism and sustainable development. Action plan for economic infrastructure improvement will include the following.
(i) Mamminasata artery road improvement
(ii) Traffic management improvement
(iii) Power transmission and distribution improvement
Action Plan 3.1 Mamminasata artery road improvement Objective Objective is to improve artery road in Mamminasata to mitigate traffic congestion and to
accelerate economic activity Importance in Mamminasata Development
Three principles of the road network planning is: (i) priority is given to mitigate traffic congestion, (ii) road network plan more practical to implement, and (iii) human friendly and eco friendly road design
Output Improvement of selected road in the Mamminasata area Action to be taken Jl. Perintis (F/S, construction) (national road)
Stakeholders Dinas Regional Infrastructure, Makassar city government, Maros district government, Gowa district government, Takalar district government
STUDY ON IMPLEMENTATION OF INTEGRATED SPATIAL PLAN FOR THE MAMMINASATA METROPOLITAN AREA 10. Development Program
10-15
Expected Benefit Traffic congestion are mitigated which will reduce the time loss Economic activity will accelerate Increase in pedestrian (increase in urban amenity)
Cost and Financial Source Rp. 6,880 billion (public investment*) and BOT
Action Plan 3.2 Traffic management improvement Objective Objective is to improve traffic management and improve public transportation system Importance in Mamminasata Development
One of the reasons for traffic congestion is poor traffic management and lack of public transportation system. Road are filled with pete pete and becak, and there is no rule in road use so that pete pete, becak, cars are mixed and causing congestions. Road use has to be controlled and public transportation system has to be improved.
Output (i) Bus transportation service (ii) Introduction of traffic management (pete pete, becak, cars, street vendors)
Action to be taken Public transportation service Designation of lane use by vehicle (pete pete, becak, cars, bus Prohibition of becak and pete pete on selected roads
Implementation Arrangement Public transportation service, including pete pete, has to be managed by province because public transportation system covers all Mamminasata area. Traffic control such as road use control, on the other hand, has to be managed by each district/city.
Stakeholders Dinas Regional Infrastructure, District/City in Mamminasata Expected Benefit Economic activity will accelerate
Traffic congestion are mitigated which will reduce the time loss Economic activity will accelerate
Cost and Financial Source Rp. 97 billion (public investment)
Action Plan 3.3 Power transmission and distribution improvement Objective Objective is to increase power transmission capability Importance in Mamminasata Development
Frequent electricity failure disturbs not only the daily lives, but also disturbs economic activities which results in less attractive investment location. Stable power supply is necessary for improvement of quality of life and also promotion of economic activities.
Output (i) Expansion of transformer capacity of sub-station (Daya, Tello, Panakkukang, Sungguminasa)
(ii) Upgrading of existing distribution lines (rehabilitation / upgrading of distribution facilities as capacity building on maintenance)
Action to be taken Transformer capacity increase activity (construction work) Upgrading of existing distribution lines activity (construction work) Energy conservation campaign
Implementation Arrangement Power supply is provided by PLN so public sector involvement in power supply is limited, but the public sector can coordinate with PLN in terms of priority area and monitoring of PLN activity.
Accelerate economic activity (investment, manufacturing) Cost and Financial Source Rp. 108 billion (Sub-loan to PLN)
4) Action Plan for Institutional Strengthening
In order to strengthen the authority of urban management and improve urban control measures, institutional aspect has to be strengthened immediately. Action plan for institutional strengthening will include the following.
(i) Organization strengthening
STUDY ON IMPLEMENTATION OF INTEGRATED SPATIAL PLAN FOR THE MAMMINASATA METROPOLITAN AREA 10. Development Program
10-16
(ii) Legislation strengthening
(iii) Information management strengthening
Action Plan 4.1 Organization strengthening Objective Establish a permanent organization with full time qualified staff for Mamminasata
development implementation Importance in Mamminasata Development
BKSPMM is formed as a coordination body for Mamminasata Spatial Plan, but coordination function is weak due to not clear authority and large members. In order to execute proper urban management, permanent organization with full time staff have to be established.
Output (i) New organization (Mamminasata Development Management Agency: BPPM) are established
(ii) BKSP is re-organized (iii) Advisory committee is formed (private and academic)
Action to be taken Integrate authority and job description of BPPM in Presidential Decree Preparation of job description of BPPM Preparation of personnel rule (staff qualification, tasks) Preparation and stipulation of Provincial Regulation for establishment of BPPM Preparation and stipulation of Provincial Governor’s Decree on BKSPMM
Implementation Arrangement Dinas Spatial Planning assigns a special team for establishment of BPPM and BKSPMM reform by coordinating with BKSPMM.
Stakeholders BKSPMM, Dinas Spatial Planning, BAPPEDA, Ministry of Public Works Expected Benefit Mamminasata development is well coordinated
Action Plan 4.2 Legislation strengthening Objective To draft up and stipulate legislation (Provincial Governor’s Decree or Provincial Regulation)
for strengthen urban development management, particularly land use control, transport management, and environmental management
Importance in Mamminasata Development
For the spatial plan to be in effect, Presidential Decree is needed. In addition, provincial regulation has to be prepared to show specific standard for urban management and control. Legislation has to be strengthened for implementation of the spatial plan.
Output Presidential Decree for “Spatial Plan for Mamminasata Metropolitan Area” is stipulated “Zoning Regulation” (Provincial Regulation) is stipulated “Transport Management and Control” is stipulated Other legislation necessary concerning urban management is stipulated
Action to be taken Preparation, inter-department discussion, public consultation of Presidential Decree for “Spatial Plan for Mamminasata Metropolitan Area” Preparation, inter-department discussion, public consultation of “Zoning Regulation” (Provincial Regulation) Preparation, inter-department discussion, public consultation of “Transport Management and Control”
Implementation Arrangement Dinas Spatial Planning assigns a special team for decree preparation reform by coordinating provincial government. Even though Ministry of Public Works is responsible for decree preparation, provincial government shall constantly follow up on the decree preparation.
Stakeholders Dinas Spatial Planning, BAPPEDA, Ministry of Public Works Expected Benefit Urban environment improves
Development activity can be controlled Cost and Financial Source Rp. 2 billion (public investment, province)
STUDY ON IMPLEMENTATION OF INTEGRATED SPATIAL PLAN FOR THE MAMMINASATA METROPOLITAN AREA 10. Development Program
10-17
Action Plan 4.3 Information management strengthening Objective Establish maps and database that can be a base for urban management and control Importance in Mamminasata Development
Many agencies posse their own database and maps with different format, and they are not centrally managed so that the data and maps can not be utilized for urban management. It is necessary to establish centrally controlled database system which can be open to public.
Output (i) GIS database (ii) Map
Action to be taken Mapping Establish standard format Establish database
Implementation Arrangement Dinas Spatial Planning has to coordinate organizations that posse maps and data with BPN, provincial government, district/city government, BPS for organize data.
Stakeholders BPN, Dinas Spatial Planning, BAPPEDA, District/City in Mamminasata, BPS Expected Benefit Urban management efficiency will improve
Urban development is controlled through dissemination of planning map Cost and Financial Source Rp. 10 billion (public investment, province)
Note: Public investments in large infrastructure projects (marked with * in the above list) are subject to discussion on financial plan in the following Section 10.3.
10.3 Financial Plan1
For the implementation of the proposed development programs and action plans, financial issues should be addressed to evaluate if and how they are made financially implementable.
1) Public Finance
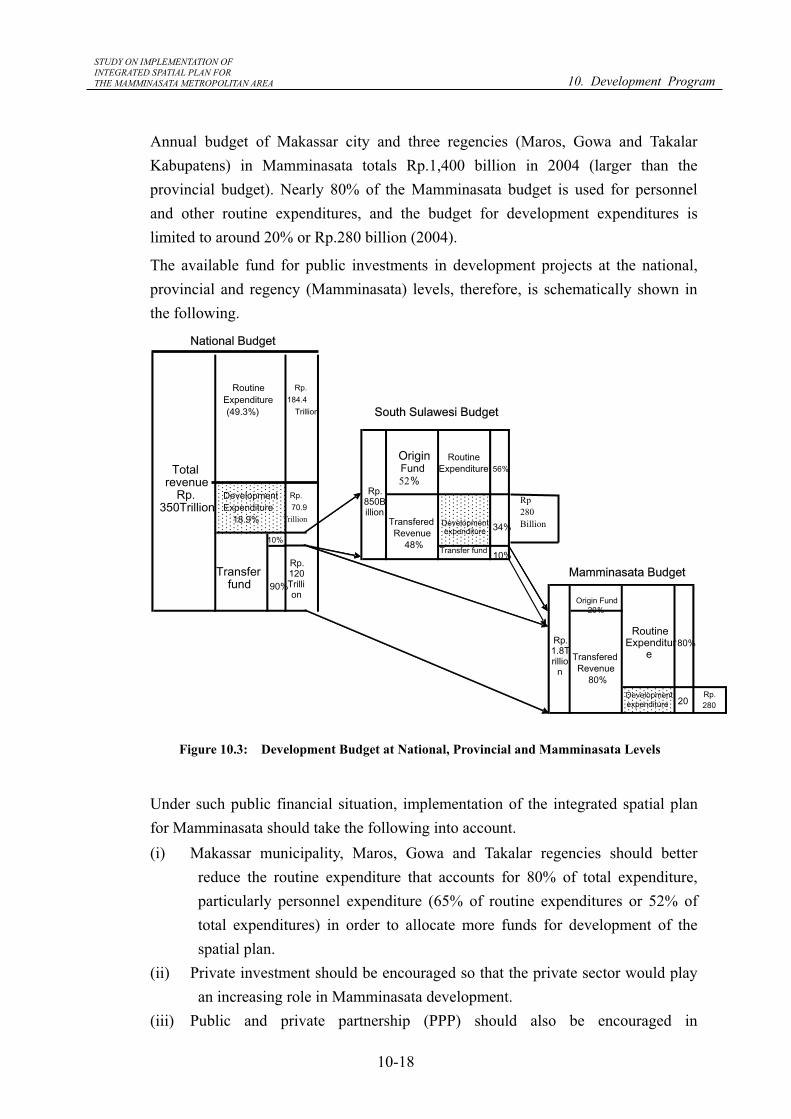
In line with the policy of regional autonomy (Law No.22, 1999), the Law of Fiscal Balance between the Central Government and the Regional Governments (Law No.25, 1999) stipulated that at least 25% of national budget is transferred to regional/local governments. Such a transfer fund (Rp.120 trillion in 2004) is distributed 10% to provincial governments and 90% to regency (Kabupaten) governments. The national budget allocates nearly 20% to development expenditures for implementation of projects at the national level (Rp.70.9 trillion in 2004). Since the national budget is in deficit, further increase in development expenditures will not be expectable.
The budgetary scale of South Sulawesi province is relatively small, totaling about Rp.850 billion in 2004. About 56% of the provincial budget is allocated to personnel and other routine expenditures, and the budget for development expenditures is limited to around 34% or Rp.290 billion (2004). About 10% of the provincial budget is transferred to Kabupaten governments.
1 Refer to Sector Study Report (15) for detail.
STUDY ON IMPLEMENTATION OF INTEGRATED SPATIAL PLAN FOR THE MAMMINASATA METROPOLITAN AREA 10. Development Program
10-18
Annual budget of Makassar city and three regencies (Maros, Gowa and Takalar Kabupatens) in Mamminasata totals Rp.1,400 billion in 2004 (larger than the provincial budget). Nearly 80% of the Mamminasata budget is used for personnel and other routine expenditures, and the budget for development expenditures is limited to around 20% or Rp.280 billion (2004).
The available fund for public investments in development projects at the national, provincial and regency (Mamminasata) levels, therefore, is schematically shown in the following.
Figure 10.3: Development Budget at National, Provincial and Mamminasata Levels
Under such public financial situation, implementation of the integrated spatial plan for Mamminasata should take the following into account. (i) Makassar municipality, Maros, Gowa and Takalar regencies should better
reduce the routine expenditure that accounts for 80% of total expenditure, particularly personnel expenditure (65% of routine expenditures or 52% of total expenditures) in order to allocate more funds for development of the spatial plan.
(ii) Private investment should be encouraged so that the private sector would play an increasing role in Mamminasata development.
(iii) Public and private partnership (PPP) should also be encouraged in
52
Trillion
Rp280Billion
STUDY ON IMPLEMENTATION OF INTEGRATED SPATIAL PLAN FOR THE MAMMINASATA METROPOLITAN AREA 10. Development Program
10-19
development finance, demarcating the roles and responsibility of respective partners.
(iv) Semi-public corporation and special company (e.g., PELINDO for seaport and PT.AP-I for airport) should implement the expansion projects by their own finance or by PPP.
(v) Public investment should be minimized, phasing out the implementation of projects in accordance with the demand for such services.
(vi) Loans on concessional terms (soft loans) should be secured in order to lessen annual financial burden at the regional and national levels.
2) Basic Principle for Finance
For the implementation of infrastructure development in Mamminasata, financial arrangements would be made in line with the following principles. (i) Profitable Sector: Business can be financially profitable and it should be
operated by the private finance initiative (PFI) (ii) Semi-profitable: Management will require public financial support now,
but it could be reformed to be profitable and manageable by the private sector in future.
(iii) Non-profitable: Business can’t be financially viable and it should be operated in principle by the public sector.
The following tables present basic principle for financing the infrastructure development projects proposed under the Mamminasata spatial plan.
Table 10.6: Financing for Profitable Sector
STUDY ON IMPLEMENTATION OF INTEGRATED SPATIAL PLAN FOR THE MAMMINASATA METROPOLITAN AREA 10. Development Program
10-20
Table 10.7: Financing for Semi- and Non-Profitable Sector
Source: JICA Study Team
Further, as discussed in Section 4.5, a macroeconomic framework for public investment should be observed to the maximum extent. A target for the public investment (PIP) in Mamminasata has been set at 3~4% of GRDP, or around Rp.1,300~1,400 billion per annum.
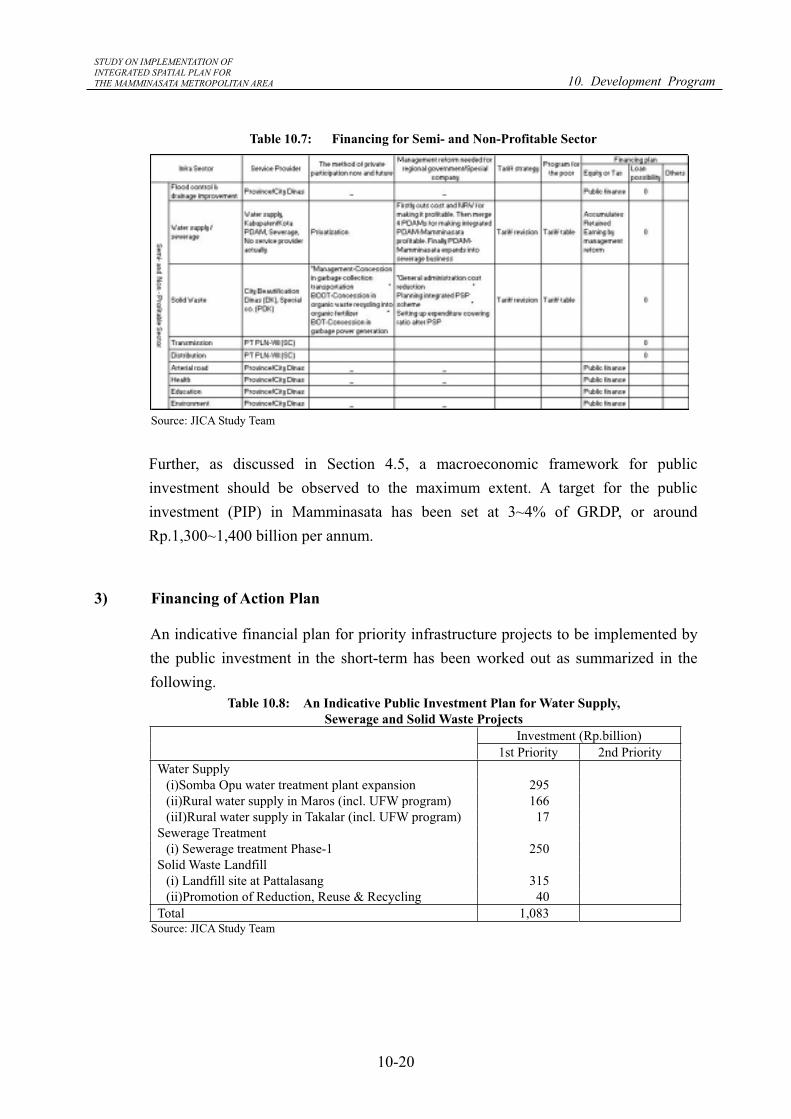
3) Financing of Action Plan
An indicative financial plan for priority infrastructure projects to be implemented by the public investment in the short-term has been worked out as summarized in the following.
Table 10.8: An Indicative Public Investment Plan for Water Supply, Sewerage and Solid Waste Projects
Investment (Rp.billion)1st Priority 2nd Priority
Water Supply (i)Somba Opu water treatment plant expansion 295 (ii)Rural water supply in Maros (incl. UFW program) 166 (iiI)Rural water supply in Takalar (incl. UFW program) 17
10. Abdulla Dg. Sirua P(P) 530 530 11. Around Airport P(P) 100 100 12. Airport access P(N) 960 960 13. Trans-Sulawesi / Bridge BOT 4,280 - - 14. Hertasning P(P) 260 260 15. KIWA Access P(P) 260 260 16. Around Sungguminasa P(P) 110 110 Total BOT 5,060 Total Public 6,880 4,700 2,180 Total P(National) 4,870 3,910 960 P(Province/
Regency) 2,010 790 1,220
* Land acquisition and re-allocation cost is not included. Source: JICA Study Team
STUDY ON IMPLEMENTATION OF INTEGRATED SPATIAL PLAN FOR THE MAMMINASATA METROPOLITAN AREA 10. Development Program
10-22
Summing up the above indicative investment plan, the required public investments for Mamminasata are estimated as follows.
Table 10.11: An Indicative Public Investment Plan for Mamminasata Infrastructure Total Public
InvestmentPriority
InvestmentAnnual Budget
Water supply, sewerage, solid waste 1,083 1,083 36
Electric power sector 1,208 108 4
Road transport sector 6,880 4,700 157
Total 9,171 5,891 196 Note: Annual budget is estimated at 1/30 of investment on the assumption that loans on
concessional terms are made available with a repayment period of 30 years. Source: JICA Study Team
The above estimated annual fund requirements of Rp.196 billions will be equivalent of around 35% of the current development expenditures in Mamminasata (Rp.280 billion) and South Sulawesi province (Rp.280 billion), totaling Rp.560 billion. If the two large investments in national roads (Perintis of 360 billion and Mamminasata bypass/bridge of 3,550 billion) are executed by the national budget and excluded from regional funding, the annual budget requirement would be Rp.66 billion or 12% of the regional budget.
Likewise, the total investment amount in large infrastructure projects (Rp.9,171 billion), as well as other public investments listed in the action plan proposed in Section 10.2 (totaling Rp. 210 billion), would be within the macroeconomic framework of PIP (Rp.20 trillion in 2005-2020).
Consequently, it is assessed preliminarily that the indicative financial plan for infrastructure development as note above would be rational and justifiable. The total investment would also be within the macroeconomic framework set for the Mamminasata spatial plan.
In order to attain a balanced financial arrangement for Mamminasata, it is suggested that a soft loan be secured in packages for the stage-wise implementation of the prioritized infrastructure development projects.
STUDY ON IMPLEMENTATION OF INTEGRATED SPATIAL PLAN FOR THE MAMMINASATA METROPOLITAN AREA 11. Pre-feasibility Study on Selected Projects
11-1
11. PRE-FEASIBILITY STUDY ON SELECTED PROJECTS
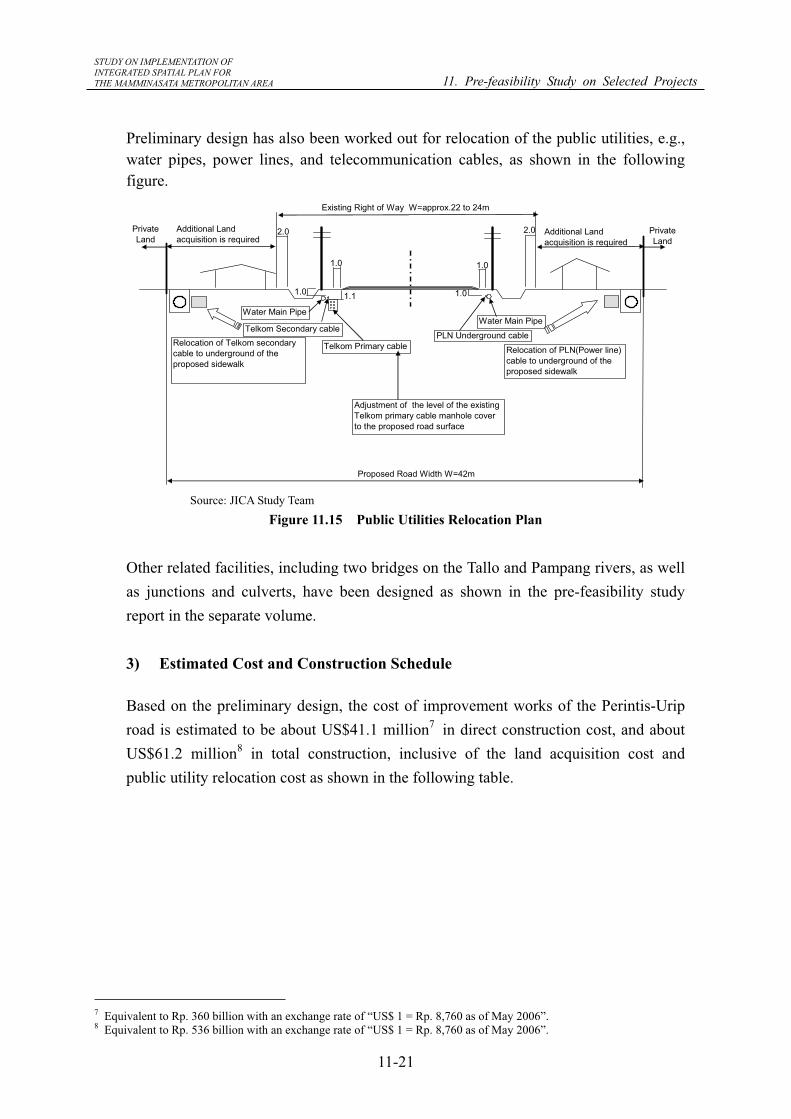
The Scope of Work for this Master Plan Study specifies that a pre-feasibility level study is conducted on some selected priority projects for the implementation of the spatial development plan in Mamminasata. Through discussions with the Indonesian counterparts, it was agreed that the pre-feasibility study was to be conducted on the following four priority projects.
(1) Improvement of Water Supply Systems of Maros and Takalar, (2) Improvement of Landfill Site for Solid Waste Management, (3) Substation Expansion and Distribution System Rehabilitation, and (4) Improvement of Perintis-Urip Road.
An outline of the study results is presented in the following sections, and details are compiled in a separate volume in a report on the Pre-feasibility Study.
11.1 Improvement of Water Supply Systems of Maros and Takalar
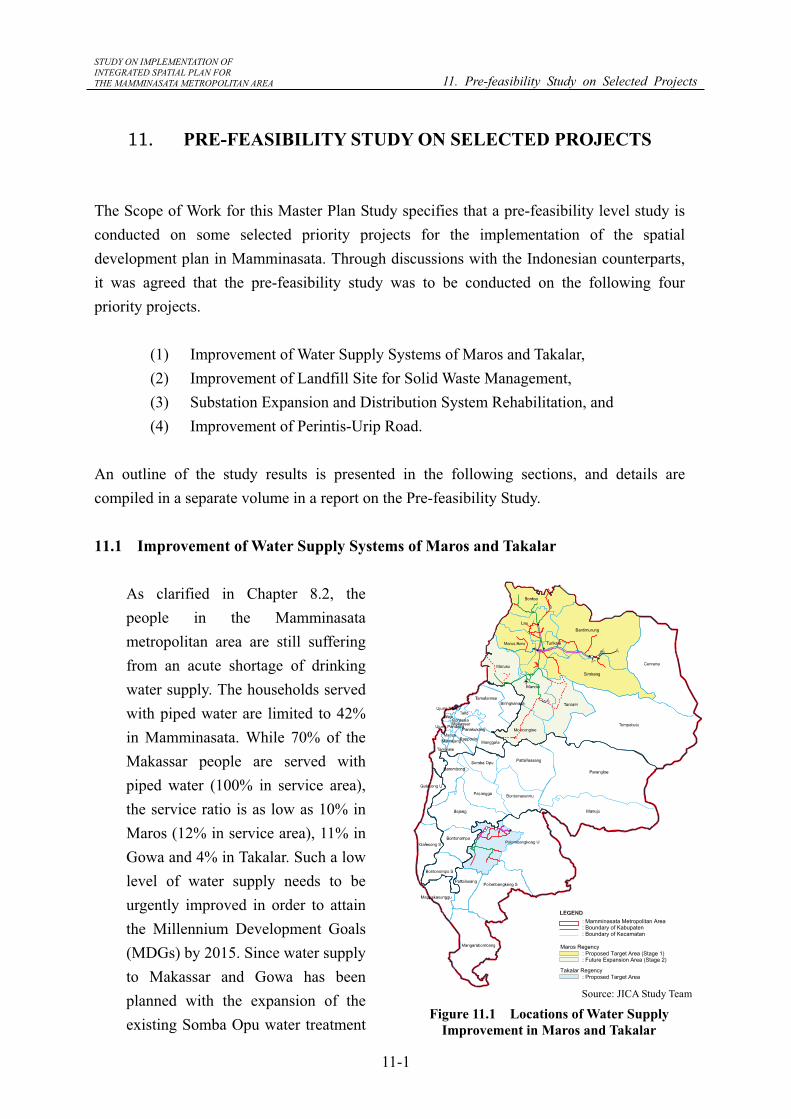
As clarified in Chapter 8.2, the people in the Mamminasata metropolitan area are still suffering from an acute shortage of drinking water supply. The households served with piped water are limited to 42% in Mamminasata. While 70% of the Makassar people are served with piped water (100% in service area), the service ratio is as low as 10% in Maros (12% in service area), 11% in Gowa and 4% in Takalar. Such a low level of water supply needs to be urgently improved in order to attain the Millennium Development Goals (MDGs) by 2015. Since water supply to Makassar and Gowa has been planned with the expansion of the existing Somba Opu water treatment
Figure 11.1 Locations of Water Supply Improvement in Maros and Takalar
: Mamminasata Metropolitan Area: Boundary of Kabupaten: Boundary of Kecamatan
: Proposed Target Area (Stage 1): Future Expansion Area (Stage 2)
Maros Regency
Takalar Regency: Proposed Target Area
Source: JICA Study Team
STUDY ON IMPLEMENTATION OF INTEGRATED SPATIAL PLAN FOR THE MAMMINASATA METROPOLITAN AREA 11. Pre-feasibility Study on Selected Projects
11-2
plant (from the existing capacity of 1,000 lit/sec to 3,000 lit/sec), the pre-feasibility study on the urgent improvement of the overall water supply system has been made on the systems serving Maros and Takalar regencies.
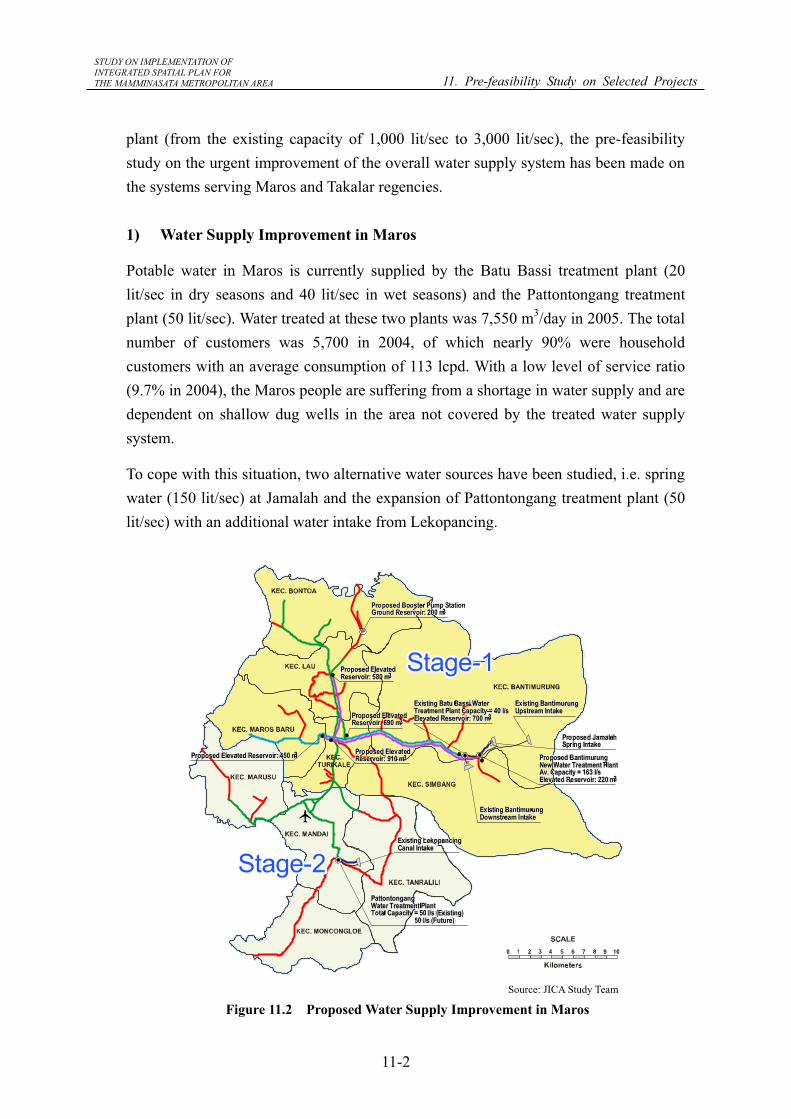
1) Water Supply Improvement in Maros
Potable water in Maros is currently supplied by the Batu Bassi treatment plant (20 lit/sec in dry seasons and 40 lit/sec in wet seasons) and the Pattontongang treatment plant (50 lit/sec). Water treated at these two plants was 7,550 m3/day in 2005. The total number of customers was 5,700 in 2004, of which nearly 90% were household customers with an average consumption of 113 lcpd. With a low level of service ratio (9.7% in 2004), the Maros people are suffering from a shortage in water supply and are dependent on shallow dug wells in the area not covered by the treated water supply system.
To cope with this situation, two alternative water sources have been studied, i.e. spring water (150 lit/sec) at Jamalah and the expansion of Pattontongang treatment plant (50 lit/sec) with an additional water intake from Lekopancing.
Figure 11.2 Proposed Water Supply Improvement in Maros Source: JICA Study Team
STUDY ON IMPLEMENTATION OF INTEGRATED SPATIAL PLAN FOR THE MAMMINASATA METROPOLITAN AREA 11. Pre-feasibility Study on Selected Projects
11-3
For staged improvement, it is proposed that Jamalah spring water would be treated at the new Bantimurung treatment plant and serve the northern part of Maros as the first stage (water demand of about 14,000 m3/day in 2015), and that the Pattontongang plant would be expanded as the second stage (water demand of about 6,700 m3/day in 2015) as shown in the Figure 11.2.
The first stage improvement with the Bantimurung water treatment with Jamalah spring water will require the following facilities.
Intake facilities : Intake weir, diversion, gate, baffle wall, screen and raw water intake gate
Intake pump station : 180 lit/sec (max.) in discharge; 8 m in head Treatment facilities : Slow sand filtration Transmission pipelines : 200~500 mm in diameter and 21.7 km in total length Reservoir : Clean water tanks of 4,000 m3 in total capacity Distribution pipelines : 100~300 mm in diameter and 71.9 km in total length Rehab. of existing pipeline : 150~300 mm in diameter and 37.6 km in total length O&M equipment : Service meters, leakage control equipment, etc.
Together with the installation of facilities for additional water supply, measures are to be taken to lower the ratio of unaccounted-for-water (UFW). Although the Master Plan envisages the UFW ratio lowered to a level of 25% in Mamminasata, the Bantimurung water supply system should lower its UFW ratio from the current 50% down to 20% in 2015, with the appropriate provision of metering devices, leakage control equipment and an increased number of UFW staff.
After completion of the first stage improvement, the serviced population in Maros regency would increase from the current 30,000 (about 6,000 households) to 185,000 (about 37,000 households) in 2010, while the service coverage ratio of the target area would improve from 11.7% in 2004 to 61.0% in 2010. This will largely contribute to the improvement of the service coverage ratio of the entire regency area from 9.7% (2004) to 54.0% (2010). Since the target level under the Master Plan is 70% (the same as the MDG goal) in 2015, it is expected that the remaining percentage would be attained by the second stage project, which is to be formulated during the implementation of the first stage improvement.
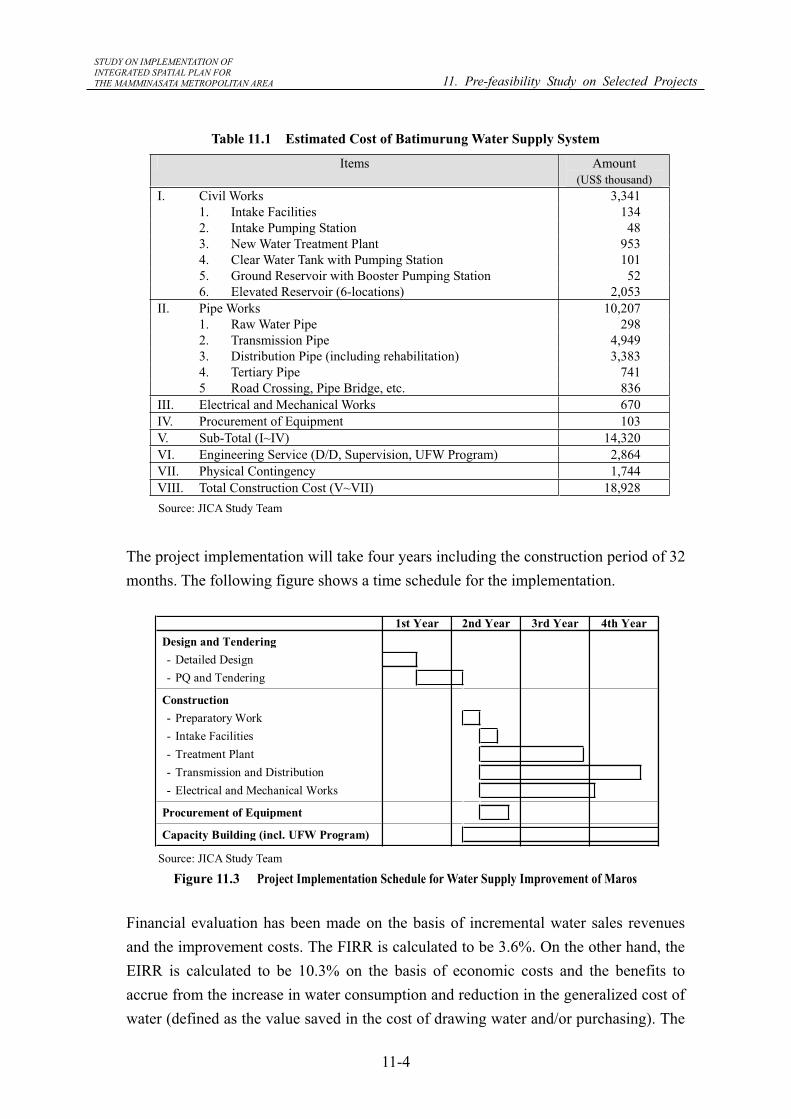
The construction cost of the Batimurung water supply system is preliminarily estimated to be US$18.9 million1 as summarized in the following table.
1 Equivalent to Rp. 166 billion with an exchange rate of “US$ 1 = Rp. 8,760 as of May 2006”.
STUDY ON IMPLEMENTATION OF INTEGRATED SPATIAL PLAN FOR THE MAMMINASATA METROPOLITAN AREA 11. Pre-feasibility Study on Selected Projects
11-4
Table 11.1 Estimated Cost of Batimurung Water Supply System
Items Amount (US$ thousand)
I. Civil Works 3,341 1. Intake Facilities 134 2. Intake Pumping Station 48 3. New Water Treatment Plant 953 4. Clear Water Tank with Pumping Station 101 5. Ground Reservoir with Booster Pumping Station 52 6. Elevated Reservoir (6-locations) 2,053 II. Pipe Works 10,207 1. Raw Water Pipe 298 2. Transmission Pipe 4,949 3. Distribution Pipe (including rehabilitation) 3,383 4. Tertiary Pipe 741 5 Road Crossing, Pipe Bridge, etc. 836 III. Electrical and Mechanical Works 670 IV. Procurement of Equipment 103 V. Sub-Total (I~IV) 14,320 VI. Engineering Service (D/D, Supervision, UFW Program) 2,864 VII. Physical Contingency 1,744 VIII. Total Construction Cost (V~VII) 18,928 Source: JICA Study Team
The project implementation will take four years including the construction period of 32 months. The following figure shows a time schedule for the implementation.
Design and Tendering- Detailed Design- PQ and Tendering
Construction- Preparatory Work- Intake Facilities- Treatment Plant- Transmission and Distribution- Electrical and Mechanical Works
Procurement of Equipment
Capacity Building (incl. UFW Program)
1st Year 2nd Year 3rd Year 4th Year
Source: JICA Study Team
Figure 11.3 Project Implementation Schedule for Water Supply Improvement of Maros
Financial evaluation has been made on the basis of incremental water sales revenues and the improvement costs. The FIRR is calculated to be 3.6%. On the other hand, the EIRR is calculated to be 10.3% on the basis of economic costs and the benefits to accrue from the increase in water consumption and reduction in the generalized cost of water (defined as the value saved in the cost of drawing water and/or purchasing). The
STUDY ON IMPLEMENTATION OF INTEGRATED SPATIAL PLAN FOR THE MAMMINASATA METROPOLITAN AREA 11. Pre-feasibility Study on Selected Projects
11-5
proposed water supply improvement of Maros, therefore, has been assessed to be marginally feasible in economic terms. Better management of PDAM Maros is required to improve the financial performance.
The low EIRR and FIRR are partly attributable to the higher costs in installation and rehabilitation of transmission and distribution pipelines extended to rural areas where alternative safe water sources are unavailable (due to saline groundwater in the coastal land) for a large number of households. Financial arrangements should pay due attention to such situations and to the cost of securing a safe water supply for the Maros people.
2) Water Supply Improvement in Takalar
In Takalar, piped water is currently supplied to the central area by the Takalar Central Water Supply System (10 lit/sec) and the IKK Polombankeng Utara Water Supply System in part of Polombankeng Utara Sub-district (3 lit/sec in dry seasons). The total number of customers was about 2,100 as of December 2005 with a low service ratio of 4% in coverage. The Takalar people are thus suffering from an acute shortage in safe water supply. They mostly depend on shallow dug wells that are affected by flood water intrusion and other unhealthy contamination.
To cope with these conditions, it is proposed to increase the capacity of the IKK Polombankeng Utara Water Supply System by 22 lit/sec through rehabilitation and expansion of the existing system. The designed production capacity of the IKK Polombankeng system should therefore reach 25 lit/sec or 2,160 m3/day.
The improvement work for the IKK Polombankeng Utara Water Supply System will include the following.
Figure 11.4 Proposed Water Supply System Improvement in Takalar
Source: JICA Study Team
STUDY ON IMPLEMENTATION OF INTEGRATED SPATIAL PLAN FOR THE MAMMINASATA METROPOLITAN AREA 11. Pre-feasibility Study on Selected Projects
11-6
Deep well facilities : Three additional deep wells with diameter of 250 mm, depth of 110~130 m and yield of 2.5~12.5 lit/sec. One existing shallow well with diameter of 2,000 mm, depth of 8 m and yield of 3 lit/sec.
Pumping stations : Installations for three new deep wells. Disinfection : Introduction of chlorination system Transmission pipeline : 100~200 m in diameter, 5.8 km in total length. Distribution pipeline : 90~250 m in diameter, 32.4 km in total length. Reservoirs : Two locations. 250 m3 each. Service pipeline : 50~75 mm in diameter, 21.6 km in total length. O&M equipment : Service meters, leakage control equipment, laboratory equipment, etc.
Through the completion of the water supply system improvement, the serviced population in Polombankeng Utara sub-district would increase from the present 1,800 (about 350 households) to 21,500 (about 4,300 households) in 2010, while the service coverage ratio of the target area would improve from 4.2% in 2005 to 50.0% in 2010. This will significantly contribute to the improvement of the service coverage ratio in the regency from 4.0% (2005) to 11.7% (2010).
Since PDAM Takalar also has the problem of a high UFW ratio, capacity development in terms of management capacity, staff training and a UFW program will be included in the implementation program.
The total construction cost of the IKK Polombankeng Utara water supply system improvement in Takalar is preliminarily estimated to be US$1.9 million2 as tabulated in the following table.
Table 11.2 Estimated Cost of Water Supply System Improvement in Takalar
Items Amount (US$ thousand)
I. Civil Works 396 1. Deep Well 90 2. Pump House 55 3. Reservoir Tanks 52 4. Public Hydrant 199 II. Pipe Works 907 1. Transmission Pipe 300 2. Distribution Pipe 607 III. Electrical and Mechanical Works 59 IV. Procurement of Equipment 80 V. Sub-Total (I~IV) 1,441 VI. Engineering Service (D/D, Supervision, UFW Program) 289 VII. Physical Contingency 176 VIII. Total Construction Cost (V~VII) 1,906 Source: JICA Study Team
2 Equivalent to Rp. 17 billion with an exchange rate of “US$ 1 = Rp. 8,760 as of May 2006”.
STUDY ON IMPLEMENTATION OF INTEGRATED SPATIAL PLAN FOR THE MAMMINASATA METROPOLITAN AREA 11. Pre-feasibility Study on Selected Projects
11-7
The construction work will take around 22 months, as shown in the following figure.
Design and Tendering- Detailed Design- PQ and Tendering
Construction- Preparatory Work- Intake Facilities- Treatment Plant- Transmission and Distribution- Electrical and Mechanical Works
Procurement of Equipment
Capacity Building (incl. UFW Prog.)
1st Year 2nd Year 3rd Year 4th Year
Source: JICA Study Team
Figure 11.5 Project Implementation Schedule for Water Supply Improvement of Takalar
Financial evaluation has been made on the basis of incremental sales revenues and estimated costs. The FIRR is calculated to be 5.7%, while the EIRR is 15.5%. The improvement project of Takalar is assessed to be economically feasible and financially marginal. As in the case of Maros water supply system improvement, the EIRR and FIRR are low, due partly to the higher costs in installation and rehabilitation of lengthy transmission/distribution pipelines in rural areas. Management of PDAM Takalar should be improved in line with the project implementation.
11.2 Improvement of Landfill Site for Solid Waste Management
As discussed in Chapter 8.3, the existing landfill site for solid waste disposal at Tamangapa in Makassar is nearly full and a new landfill site is required to dispose of the increasing volume of solid waste. Under the spatial plan for Mamminasata, it has been proposed that Makassar city and three regencies will cooperate in infrastructure improvement for mutual interest in the Mamminasata metropolitan area. A new landfill site for Mamminasata has been proposed, to be located at Pattallassang in Gowa regency under such a regional cooperation spirit.
1) Justification for Implementation
The volume of solid waste to be disposed of in Makassar and Maros up to 2020 would amount to about 8.4 million m3 at a bulk density of approximately 0.4 kg/lit, as discussed in Chapter 8.3. Some solid waste to be generated nearby Pattallassang in
STUDY ON IMPLEMENTATION OF INTEGRATED SPATIAL PLAN FOR THE MAMMINASATA METROPOLITAN AREA 11. Pre-feasibility Study on Selected Projects
11-8
Maros and Takalar regencies might also utilize Pattallassang if and when required. Such a volume of solid waste disposal would require a gross landfill area of nearly 90 ha.
The site at Pattallassang has a total area of about 210 ha and is currently used for a mixed plantation, rice fields and mixed forests. The land use at Pattallassang has been designated by the regency government for industrial use. Topographic and geological conditions create no specific difficulty in construction though geological layers have to be further surveyed. The Pattallassang site may be used not only for the landfill site but for location of industries, inclusive of recycling industries.
The initial environmental examination, as indicated in the following table, indicates that an EIA is required, particularly for offensive odor and water pollution by leachate.
Table 11.3 Summary of Initial Environmental Examination at Pattallassang Landfill Site
Note: : significant negative impact : Less negative impact
blank : no effect + : positive impact is expected Source: JICA Study Team
Some proper mitigation measures should be taken in designing the sanitary landfill site. For the prevention of offensive odor, daily cover soil is to be applied, together with a gas venting system. A leachate collection system should be adopted to prevent contamination of surface and groundwater. Green spaces will also be designed to mitigate adverse impact and enhance the landscape around the site.
STUDY ON IMPLEMENTATION OF INTEGRATED SPATIAL PLAN FOR THE MAMMINASATA METROPOLITAN AREA 11. Pre-feasibility Study on Selected Projects
11-9
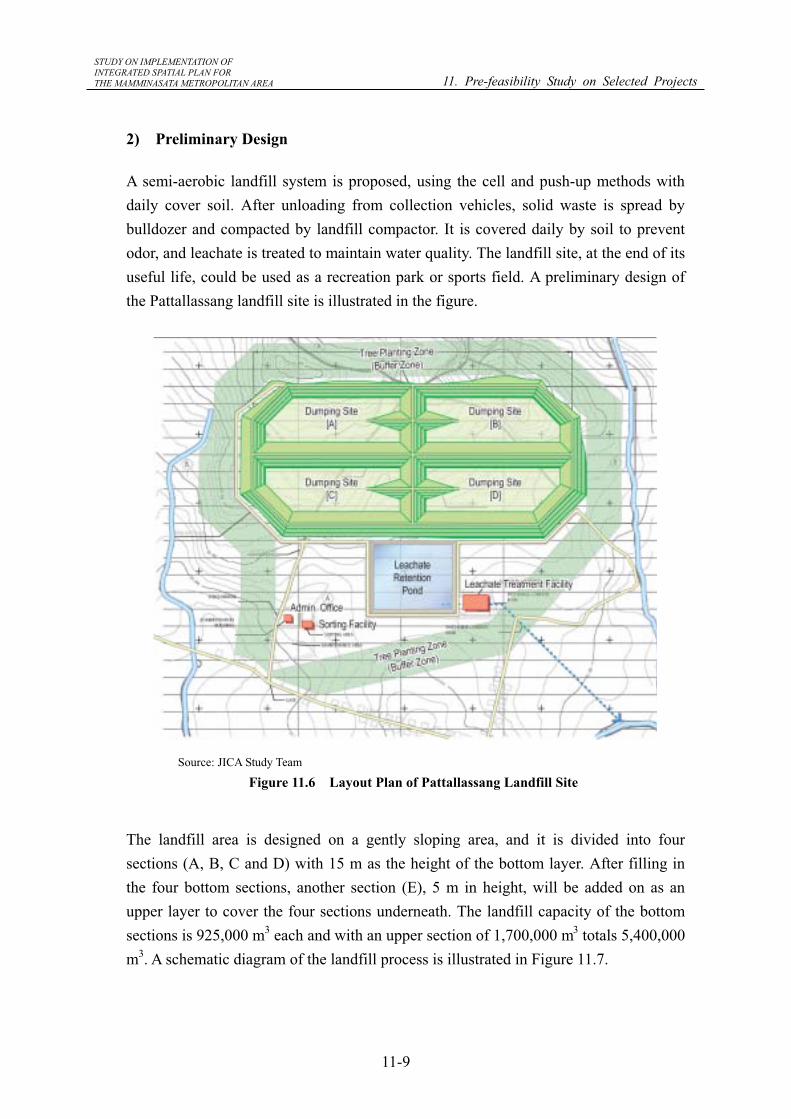
2) Preliminary Design
A semi-aerobic landfill system is proposed, using the cell and push-up methods with daily cover soil. After unloading from collection vehicles, solid waste is spread by bulldozer and compacted by landfill compactor. It is covered daily by soil to prevent odor, and leachate is treated to maintain water quality. The landfill site, at the end of its useful life, could be used as a recreation park or sports field. A preliminary design of the Pattallassang landfill site is illustrated in the figure.
The landfill area is designed on a gently sloping area, and it is divided into four sections (A, B, C and D) with 15 m as the height of the bottom layer. After filling in the four bottom sections, another section (E), 5 m in height, will be added on as an upper layer to cover the four sections underneath. The landfill capacity of the bottom sections is 925,000 m3 each and with an upper section of 1,700,000 m3 totals 5,400,000 m3. A schematic diagram of the landfill process is illustrated in Figure 11.7.
Figure 11.6 Layout Plan of Pattallassang Landfill SiteSource: JICA Study Team
STUDY ON IMPLEMENTATION OF INTEGRATED SPATIAL PLAN FOR THE MAMMINASATA METROPOLITAN AREA 11. Pre-feasibility Study on Selected Projects
11-10
The total leachate volume has been estimated for each landfill section. The diameters of the main and branch collection pipes are calculated to be 600 mm and 300 mm, respectively. Main leachate collection pipes should be installed over the protection soil and top layer of the artificial liner along the gutter of the base layer, which is made of gravel or permeable material. The pipes should be perforated in the upper half to collect leachate effectively, while the bottom half should not be perforated to let the collected leachate flow smoothly without leakage. The leachate pipes should be covered with well-arranged filter soil. The proposed width and thickness of the packed filter material will not only facilitate the filtration of leachate entering into the perforation of the pipes, but also increase the bearing capability of the pipes under static and dynamic loading during operation.
Figure 11.7 Schematic Diagram of Landfill Process Source: JICA Study Team
STUDY ON IMPLEMENTATION OF INTEGRATED SPATIAL PLAN FOR THE MAMMINASATA METROPOLITAN AREA 11. Pre-feasibility Study on Selected Projects
11-11
Figure 11.8 Schematic Diagram of Leachate System
Landfill gas is generated by decomposition of organic waste dumped in the landfill site, which may cause fires or affect the surrounding environment and, in the worst case, human health. Therefore, a gas venting system is proposed to appropriately remove the generated gas, as well as to promote the decomposition process of organic waste. Technically, vertical gas venting pipes should be installed at intervals of 30 to 50 m, connecting with leachate collection pipes at the bottom.
A transportation route to the landfill site should be established for smooth logistics of waste collection. Improvement of the existing road, including some bridge construction, is proposed for an effective transportation access, as shown in the following figure (the blue line).
Source: JICA Study Team
Figure 11.9 Transporation Route for Landfill Site in Pattallassang
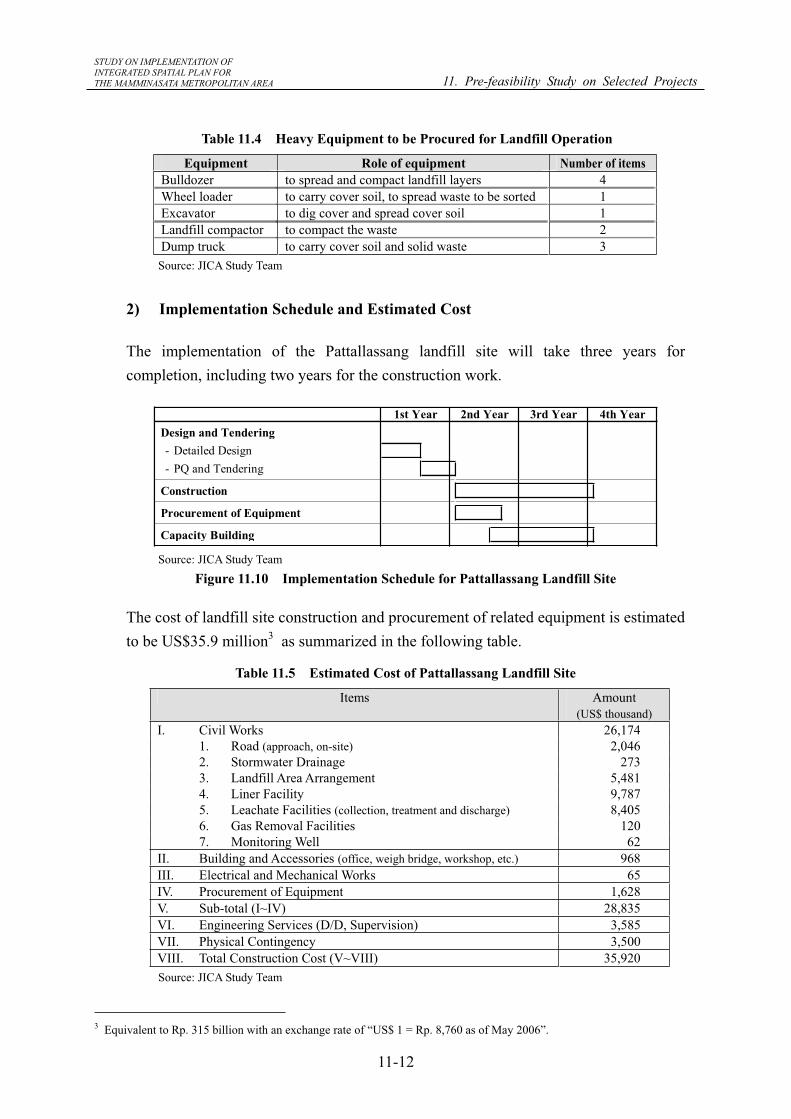
Heavy equipment for the landfill operation has been selected on the basis of the land structure, size, landfill method, and collected solid waste type. The following heavy equipment is to be procured.
Source: JICA Study Team
STUDY ON IMPLEMENTATION OF INTEGRATED SPATIAL PLAN FOR THE MAMMINASATA METROPOLITAN AREA 11. Pre-feasibility Study on Selected Projects
11-12
Table 11.4 Heavy Equipment to be Procured for Landfill Operation
Equipment Role of equipment Number of items Bulldozer to spread and compact landfill layers 4 Wheel loader to carry cover soil, to spread waste to be sorted 1 Excavator to dig cover and spread cover soil 1 Landfill compactor to compact the waste 2 Dump truck to carry cover soil and solid waste 3 Source: JICA Study Team
2) Implementation Schedule and Estimated Cost
The implementation of the Pattallassang landfill site will take three years for completion, including two years for the construction work.
Design and Tendering- Detailed Design- PQ and Tendering
Construction
Procurement of Equipment
Capacity Building
1st Year 2nd Year 3rd Year 4th Year
Source: JICA Study Team
Figure 11.10 Implementation Schedule for Pattallassang Landfill Site
The cost of landfill site construction and procurement of related equipment is estimated to be US$35.9 million3 as summarized in the following table.
Table 11.5 Estimated Cost of Pattallassang Landfill Site
Items Amount (US$ thousand)
I. Civil Works 26,174 1. Road (approach, on-site) 2,046 2. Stormwater Drainage 273 3. Landfill Area Arrangement 5,481 4. Liner Facility 9,787 5. Leachate Facilities (collection, treatment and discharge) 8,405 6. Gas Removal Facilities 120 7. Monitoring Well 62 II. Building and Accessories (office, weigh bridge, workshop, etc.) 968 III. Electrical and Mechanical Works 65 IV. Procurement of Equipment 1,628 V. Sub-total (I~IV) 28,835 VI. Engineering Services (D/D, Supervision) 3,585 VII. Physical Contingency 3,500 VIII. Total Construction Cost (V~VIII) 35,920 Source: JICA Study Team
3 Equivalent to Rp. 315 billion with an exchange rate of “US$ 1 = Rp. 8,760 as of May 2006”.
STUDY ON IMPLEMENTATION OF INTEGRATED SPATIAL PLAN FOR THE MAMMINASATA METROPOLITAN AREA 11. Pre-feasibility Study on Selected Projects
11-13
With the estimated operation and maintenance cost, the landfill cost per cubic meter of solid waste is estimated to be about US$ 2.50 which is 2.5 times as much as the current actual unit cost of US$ 1.0. Since the present collected retribution fee per cubic meter is calculated to be US$ 0.14 (32% of the collectible fee of US$ 0.44), the improvement of the waste management system, inclusive of the landfill construction, might cause a larger deficit if the retribution fee collection system is not improved along with the landfill construction. The responsible agency should therefore make as much effort as possible to recover the management cost through a revision of the retribution fee level as well as to enhance the collection efficiency.
On the basis that 0.05 m3 of domestic waste4 is generated per person per month, one household would dispose of about 0.25 m3 of waste per month. Assuming that US$ 2.5 per cubic meter would apply to the domestic waste collection service to fully recover the required cost, a household would have to pay US$ 0.63 (around Rp. 6,000) per month. People would not be willing to pay that much, judging from the fact that the present retribution fee, collected for the domestic waste collection, is Rp. 600~2,200 per month. However, it is worth referring to the World Bank’s study on the affordability to pay (ATP) for waste management, where it is stated that people can afford to pay up to 2% per month from the disposable per capita income for a municipal waste collection service. ATP for waste management should be further studied, seeking for a more effective and efficient way of providing waste collection and disposal service along with the introduction of a new sanitary landfill system.
An economic evaluation was made on the basis of the estimated economic cost and the benefit assumed to be 2% per month of disposable per capita income, in accordance with the aforementioned World Bank’s statement on the affordability to pay (ATP) for waste management. The EIRR has been calculated to be 18.8%, and the investment in the improvement works is assessed as being economically justifiable.
4 Per capita waste generated in the Mamminasata area was estimated to be about 0.001 m3 (1 liter) per day according to the Waste Quantity and Quality Survey conducted in the course of this Master Plan Study. In this case, about 0.03 m3 (30 liters) of waste is generated per capita per month, but 0.05 m3 (50 liters) has been used for simplification.
STUDY ON IMPLEMENTATION OF INTEGRATED SPATIAL PLAN FOR THE MAMMINASATA METROPOLITAN AREA 11. Pre-feasibility Study on Selected Projects
11-14
11.3 Substation Expansion and Distribution System Rehabilitation
As pointed out in Chapter 9.1, the Mamminasata metropolitan area experienced serious load shedding (rolling blackouts and/or scheduled blackouts) from July to October 2005. Mamminasata again suffered from extensive load shedding in April 2006. Such load shedding is due partly to a lack of power generation capacity in South Sulawesi. New power stations should be developed as recommended in Chapter 9.1 without further delay.
Frequent power interruption is another issue to be solved urgently. In Mamminasata, there were nearly 5,700 forced outages in 2005, of which 98% resulted from troubles in the distribution system. Overloading of transformers at substations was a principal reason for such forced outages and blackouts. Distribution facilities are generally old, poorly maintained, overloaded and weak with respect to capacity to accommodate increasing demand or even maintain acceptable supply quality to meet the existing demand. With these situations in view, it is proposed that the substation expansion and distribution system rehabilitation project be taken up as a priority project for implementation.
1) Justification for Implementation
In August 2005 when the power sector study was conducted for the Mamminasata spatial plan, several substations had shortages in transformer capacity. Thereafter, PLN has reinforced transformers at Daya (20 MVA), Panakkukang (60 MVA), Takalar (30 MVA), Borongole (10 MVA) and Mandai (20 MVA). However, as of April 2006, the maximum load on the transformer in Panakkukang substation exceeded the allowable limit of 80% and even 100% for some times as shown in the following figure.
Figure 11.11 Hourly Load on the Transformer in Panakkukang Substation
STUDY ON IMPLEMENTATION OF INTEGRATED SPATIAL PLAN FOR THE MAMMINASATA METROPOLITAN AREA 11. Pre-feasibility Study on Selected Projects
11-15
Further, the newly constructed Tanjung Bunga substation was designed several years ago to have a capacity of 30 MVA and it is predicted that the transformer load will soon exceed 90%. This substation has to expand its transformer capacity as quickly as possible. Transformer capacity at Maros and Sungguminasa substations should also be increased to meet the increasing demand towards 2008 - 2009.
As noted above, troubles have been frequently occurring on distribution lines. The incidence of forced outages is 2.5 times larger than the Indonesian average. In order to stabilize the electricity supply in Mamminasata, rehabilitation and upgrading of the distribution facilities by PLN is urgently required.
2) Facilities to be Improved and Estimated Cost
To improve the capacity of substations, installation of additional transformers is required. As shown in the following table, four 150/20 kV step-down transformers, with a total capacity of 180 MVA, need to be installed with associated equipment. The total procurement cost of these facilities will amount to US$5.8 million5.
Table 11.6 Estimated Cost of Transformer Capacity Augmentation
Items Amount (US$ thousand)
A. Panakkukang 1,694 - 1 x 150 kVA Transformer Bay - 1 x 60 kVA Power Transformer 150/20 kV - 10 x 20 kV Switchgear
B. Tanjung Bunga 1,694 - 1 x 150 kVA Transformer Bay - 1 x 60 kVA Power Transformer 150/20 kV - 10 x 20 kV Switchgear
C. Maros 1,196 - 1 x 150 kVA Transformer Bay - 1 x 30 kVA Power Transformer 150/20 kV - 9 x 20 kV Switchgear
D. Sungguminasa 1,196 - 1 x 150 kVA Transformer Bay - 1 x 30 kVA Power Transformer 150/20 kV - 9 x 20 kV Switchgear
Total Cost (A~D) 5,779 Source: JICA Study Team
On the other hand, medium and low voltage line replacement and extension is also
5 Equivalent to 51 billion Rupiahs with an exchange rate of “1 US$ = 8,760 Rupiahs as of May 2006”.
STUDY ON IMPLEMENTATION OF INTEGRATED SPATIAL PLAN FOR THE MAMMINASATA METROPOLITAN AREA 11. Pre-feasibility Study on Selected Projects
11-16
required to upgrade the distribution systems. Distribution transformers should also be upgraded in view of the growing load. The required facilities, and the associated estimated costs totaling US$6.5 million6, for the rehabilitation of distribution systems are listed in the following table.
Table 11.7 Estimated Cost of Distribution System Rehabilitation Items Amount
(US$ thousand) 1. Service Transformer (130 units) 859 2. Terminal Connector (2 units) 206 3. Medium Voltage Line 3 x 240 mm2 (4.1 km) 369 4. Terminal Connector Panel (34 sets) 1,173 5. Low Voltage Distribution Panel (360 sets) 651 6. Distribution Transformer (138 sets) 749 7. Low Voltage Twisted Connector (70.0 km) 444 8. Low Voltage Conductor 3 x 150 mm2 (44.0 km) 393 9. 150 kV Transmission Line (15.8 km) 1,695 Total Cost (1~9) 6,538
Source: JICA Study Team
With the two sub-projects combined, the total estimated cost for the substation expansion and distribution rehabilitation project will be about US$12.3 million.
3) Evaluation
The substation expansion will be able to cover the demand until 2011 (Maros), 2012 (Tanjung Bunga) and 2013 (Panakkukang and Sungguminasa) and ensure stable power supply to industries and households. Moreover, they will reduce the cost and time for repair and maintenance, as well as the environmental risk, such as soil contamination by leakage of insulation oil.
Table 11.8 Effects of Transformer Capacity Augmentation
Substation Name With ProjectWithout Project
Note
Capacity 60 MVA 120 MVA Panakkukang Load Factor 87% in 2007 44% in 2007
Additional transformer capacity is enough to cover the demand until 2013
Capacity 30 MVA 90 MVA Tanjung Bunga Load Factor 102% in 2007 34% in 2007
Additional transformer capacity is enough to cover the demand until 2012
Capacity 20 MVA 30 MVA Maros Load Factor 84% in 2008 56% in 2008
Additional transformer capacity is enough to cover the demand until 2011
Capacity 30 MVA 60 MVA Sungguminasa
Load Factor 100% in 2009 50% in 2009
Additional capacity is enough to cover the demand until 2013. Existing 20 MVA (10 x 2 units) will be relocated to other substations.
Total Capacity 140 MVA 300 MVA Source: JICA Study Team
6 Equivalent to Rp. 57 billion with an exchange rate of “US$ 1 = Rp. 8,760 as of May 2006”.
STUDY ON IMPLEMENTATION OF INTEGRATED SPATIAL PLAN FOR THE MAMMINASATA METROPOLITAN AREA 11. Pre-feasibility Study on Selected Projects
11-17
Benefits of the distribution network rehabilitation will accrue from (i) fewer unplanned outages and an improved quality of electricity supply (e.g., less voltage fluctuation), (ii) lower distribution losses with improved power sector financial performance, and (iii) reduced load shedding resulting from insufficient distribution transformer capacity. The reduction in distribution loss will also bring about fiscal benefits and allow these budgetary resources to be used for other critical needs.
11.4 Improvement of Perintis-Urip Road
Through the study of road transportation in Mamminasata, as discussed in Chapter 9.3, it has been clarified that priority is to be accorded to the improvement of Ir. Sutami toll road and Perintis-Urip road. Since the expansion and improvement of Ir. Sutami toll road (from 2 lanes to 6 lanes) is about to start on a BOT basis, a pre-feasibility study has been made on the improvement of the Perintis-Urip road that forms a trunk road in Mamminasata running from Maros to the center of Makassar. This road is a national road of 15.5 km in total length (Perintis Kemerdekaan of 11.8 km and Urip Sumoharjo of 3.7 km). The existing road alignment ranges from 22 m to 24 m with four lanes. With an estimated traffic volume of 682,000~733,000 pcu/day, the Perintis-Urip road is heavily congested at present.
1) Justification for Improvement
Although the traffic demand forecast for the integrated spatial plan in Mamminasata has justified a priority for the improvement of the Perintis-Urip road, the pre-feasibility study first reviewed the anticipated traffic demand on this road after the completion of the Ir. Sutami toll road expansion. The simulation analysis indicates that the traffic demand on Ir. Sutami toll road will steadily increase towards 2020 while the traffic along Perintis-Urip road will reach its maximum around 2010 (1,114,000~1,219,000 pcu/day with a volume-capacity ratio over 2.0) and then gradually decrease towards 2020 in the event that the road network improvement is not realized in Mamminasata, as shown in the following table.
STUDY ON IMPLEMENTATION OF INTEGRATED SPATIAL PLAN FOR THE MAMMINASATA METROPOLITAN AREA 11. Pre-feasibility Study on Selected Projects
11-18
Table 11.9 Traffic Volume without Urip-Perintis Road Improvement Without Perintis Widening Project
In the case that the Perintis-Urip road is not improved, the traffic demand on the Ir. Sutami toll road will exceed 2.0 in VCR resulting in heavy congestion. On the contrary, if the Perintis-Urip is improved, the traffic congestion ratio (VCR) will be kept between 1.0 and 1.5, and the traffic volume will constantly increase and contribute to the profitability of the Ir. Sutami toll road. In this way, the improvement of the Perintis-Urip road is required even after the expansion of Ir. Sutami toll road.
44173773563612241322 1422
1426
1029
980
822
539411
296
296
232
351270
227
288
87
537
473
201
100
100
14862
81
57
151
2993
32
966
66166166
1
101
167
81
82
1
93970
903
820
488
90
428
387
268
384 332 265
201
201
178
93
54479
395389
2906991180 1939
405510 73
7
249
95 287
301
58
58
119
263
144
405
178
1570
301164
286
220
273
228
93
135
137
461396
667
77
176
156
138
96
207
149
64
64
162
162
158
158
94
98
30
209
162
108
54
193
85
133
133
52
51
254
440
243
122
340
186
461
47247659
4922
733429498119573653
571
1416
17471
807
399
129
94
85 17987
230597278
966
473
363
573
1811
647
330535
329
459
LEGEND :
Traffic Flow( Mode: + 1 + 2 + 3 + 4 + 5 + 6 )
VCR<1.00VCR<1.50VCR<2.002.00<VCR
scale: 1mm =40000(pcu)
44372170068212531362 1430
1427
1025
976
820
538415
295
295
232
351270
227
1
285
87
535
474
202
100
100
15156
82
57
152
2453
05
734
475475 47
5
102
171
78
79
1
931066
948
826
488
90
428
387
268
384 332 265
201
201
178
93
54
470
342384
3387061098 2244
389437 10
07
246
96 241
228
58
58
109
267158
389
178
1853
228143
263
212
273
228
93
135
107
465403
676
75
181
149
135
93
207
149
63
63
168
168
156
156
87
94
28
209
162
108
54
196
86
135
135
52
51
251
359
200
120
315
196
465
48345457
2902
645354410118510652
575
1441
1776
1821
426
135
95
76 170106
175557252
734
474
437
564
2021
639
263507
336
468
LEGEND :
Traffic Flow( Mode: + 1 + 2 + 3 + 4 + 5 + 6 )
VCR<1.00VCR<1.50VCR<2.002.00<VCR
scale: 1mm =50000(pcu)
Without Improvement of Perintis-Urip Road With Improvement of Perintis-Urip Road Source: JICA Study Team
Figure 11.12 Comparison of Future Traffic Volumes in 2020
STUDY ON IMPLEMENTATION OF INTEGRATED SPATIAL PLAN FOR THE MAMMINASATA METROPOLITAN AREA 11. Pre-feasibility Study on Selected Projects
11-19
Another important role of the improvement of Perintis-Urip road is its contribution to the higher land use along this road as envisaged under the spatial plan for Mamminasata. The land use along this road is planned for improvement from the current random use to well induced high and medium density land use, as illustrated in the following figure.
Source: JICA Study Team
Figure 11.13 Image of Present and Future Land Use along Perintis-Urip Road
It is therefore planned that land use management would be promoted in parallel with the improvement of Perintis-Urip road.
2) Preliminary Design
In accordance with the MoPW design standard, the Type-II, Class-1 road classification will be applied, with the following geometric design conditions.
Table 11.10 Geometric Design Conditions Item Design Standard Value Applied Value
(except intersections) Min. Curve Length 100m 100m
HorizontalAlignment
Omission of Transition >600m >600m Min. Curve Length 25m 25m Vertical
Alignment Cross-fall 2.0% 2.0% Source: Ministry of Public Works
STUDY ON IMPLEMENTATION OF INTEGRATED SPATIAL PLAN FOR THE MAMMINASATA METROPOLITAN AREA 11. Pre-feasibility Study on Selected Projects
11-20
The MoPW has already staked the right-of-way with a total width of 42 m. A typical cross-section is proposed in due consideration of both traffic and urban development functions. The spatial plan proposes 8 lanes, and it will be further studied in due consideration of the land use and comprehensive transportation network at the subsequent stage of engineering study.
Source: JICA Study Team
Figure 11.13 Typical Cross Section (Flat Section)
The road facilities have been designed as shown in the following figure, including the bus lay-by, pedestrian bridge, underground drainage and green planting zones.
Figure 11.14 Preliminary Design of Road Facilities
STUDY ON IMPLEMENTATION OF INTEGRATED SPATIAL PLAN FOR THE MAMMINASATA METROPOLITAN AREA 11. Pre-feasibility Study on Selected Projects
11-21
Preliminary design has also been worked out for relocation of the public utilities, e.g., water pipes, power lines, and telecommunication cables, as shown in the following figure.
2.0 2.0 PrivateLand
PrivateLand
Existing Right of Way W=approx.22 to 24m
Proposed Road Width W=42m
Additional Landacquisition is required
Additional Landacquisition is required
1.0
1.11.0
Telkom Secondary cable
Telkom Primary cable
1.0
1.0
PLN Underground cable
Water Main PipeWater Main Pipe
Adjustment of the level of the existingTelkom primary cable manhole coverto the proposed road surface
Relocation of PLN(Power line)cable to underground of theproposed sidewalk
Relocation of Telkom secondarycable to underground of theproposed sidewalk
Source: JICA Study Team
Figure 11.15 Public Utilities Relocation Plan
Other related facilities, including two bridges on the Tallo and Pampang rivers, as well as junctions and culverts, have been designed as shown in the pre-feasibility study report in the separate volume.
3) Estimated Cost and Construction Schedule
Based on the preliminary design, the cost of improvement works of the Perintis-Urip road is estimated to be about US$41.1 million7 in direct construction cost, and about US$61.2 million8 in total construction, inclusive of the land acquisition cost and public utility relocation cost as shown in the following table.
7 Equivalent to Rp. 360 billion with an exchange rate of “US$ 1 = Rp. 8,760 as of May 2006”. 8 Equivalent to Rp. 536 billion with an exchange rate of “US$ 1 = Rp. 8,760 as of May 2006”.
STUDY ON IMPLEMENTATION OF INTEGRATED SPATIAL PLAN FOR THE MAMMINASATA METROPOLITAN AREA 11. Pre-feasibility Study on Selected Projects
11-22
Table 11.11 Summary of Estimated Construction Cost Items Amount (US$ thousand)
Total (A)+(B)
Jl. Urip (A)
Jl. Perintis (B)
I. Civil Works 33,984 7,851 26,133 1. Site Cleaning 181 41 140 2. Demolition 350 83 267 3. Earth Work 2,360 417 1,943 4. Pavement 8,870 2,052 6,817 5. Drainage 17,419 3,961 13,458 6. Bridge 1,681 492 1,189 7. Culvert 149 -- 149 8. Safety Facility 1,179 398 782 9. Ancillary Work 1,796 407 1,389 II. Engineering Service (D/D, Supervision) 3,738 864 2,875 III. Physical Contingency 3,398 785 2,613 IV. Total Construction Cost (I~III) 41,120 9,499 31,621 V. Land Acquisition, Compensation and
Relocation 20,065 6,832 13,233
VI. Total Project Cost (IV+V) 61,185 16,331 44,854 Source: JICA Study Team
For the land acquisition, staking of right-of-way has already been completed but land acquisition has not been initiated yet.
The construction will take six years inclusive of the pre-construction works and land acquisition. The following figure shows a proposed construction time schedule.
JL. Perintis (11.6 km)Design and Supervision
Land Acquisition
PQ and Tendering
ConstructionJL. Urip Sumoharjo (3.9 km)Design and Supervision
Land Acquisition
PQ and Tendering
Construction
5th Year 6th Year1st Year 2nd Year 3rd Year 4th Year
Source: JICA Study Team
Figure 11.16 Project Implementation Schedule for Road Improvement
STUDY ON IMPLEMENTATION OF INTEGRATED SPATIAL PLAN FOR THE MAMMINASATA METROPOLITAN AREA 11. Pre-feasibility Study on Selected Projects
11-23
4) Evaluation
Some basic data and information on noise and water along the existing road, as well as the land tenure, have been collected in the course of this Study. An initial environmental examination, as summarized below, indicates the predictable extent of impacts.
Table 11.12 Environmental Impacts and Effective Factors
Note: : significant negative impact : Less negative impact
blank : no effect + : positive impact is expected Source: JICA Study Team
In accordance with the provincial regulations, the environmental impact assessment (EIA) is to be conducted before the final decision on the construction work. The EIA should pay specific attention to the impacts of air pollution, noise, resettlements and land acquisition, as well as a split of communities along the improved road.
Economic evaluation has been made on the basis of the estimated economic cost and the benefits to accrue from the saving in vehicle operating cost (VOC) and saving in travel time. The EIRR is calculated to be 30.6%, and the investment in the improvement work is economically feasible and justifiable.
The most important issue in executing the improvement work is the land acquisition. It is desirable that the land acquisition be processed in conjunction with the land re-adjustment to make the land use more effective along the improved road.
STUDY ON IMPLEMENTATION OF INTEGRATED SPATIAL PLAN FOR THE MAMMINASATA METROPOLITAN AREA 11. Pre-feasibility Study on Selected Projects
11-24
11.5 Implementation of Priority Projects in Package
For the implementation of the above priority projects, two alternative approaches might be considered. One is to implement them project by project, and the other is to execute them in packages for a staged implementation. From the viewpoint of spatial development in Mamminasata, it is desirable that these projects be realized in packages, as illustrated in the following figure.
I II III IV I II III IV I II III IV I II III IV I II III IV I II III IV I II III IV I II III IV I II III IV I II III IV
Proj. Formulation
Appraisal
Implementation
Improvement of Water Supply Systems Inter-regional Trunk RoadImprovement of Landfill Site Sewerage Treatment ImprovementSubstation Expansion & Distribution System Rehab.Improvement of Perintis-Urip Road
2006 2007 2008 2009 2014 20152010 2011 2012 2013
Package IPackage II
Pack I Pack II Pack III
Package I Package II Package III
Package III
Source: JICA Study Team
Figure 11.17 Staged Implementation of Projects in Packages
External financial assistance might be sought in financing the implementation of priority projects in packages. For reference, the priority projects proposed above for the betterment of infrastructure and urban infrastructure will add up to the total investment amount summarized in the following table.
Table 11.13 Total Amount to be Invested in Priority Projects Project Name Construction Cost
US$ million ( Rp. billion )1. Improvement of water supply systems in Maros
and Takalar 20.8 (183)
- Water Supply System Improvement of Maros 18.9 (166) - Water Supply System Improvement of Takalar 1.9 (17) 2. Improvement of landfill site for solid waste
management 35.9 (315)
3. Expansion of substation capacity and rehabilitation of electricity distribution system
12.3 (108)
4. Improvement of Perintis-Urip road 41.1 (360)Total 110.1 (965)
Note: US$ 1.00 = Rp. 8,760 (as of May 2006) The costs in the above table don’t include the costs related to land acquisition and relocation. Source: JICA Study Team
STUDY ON IMPLEMENTATION OF INTEGRATED SPATIAL PLAN FOR THE MAMMINASATA METROPOLITAN AREA 12. Institutional Strengthening
12-1
12. INSTITUTIONAL STRENGTHENING
12.1 Legislations1
Clear and effective legislation has to be prepared and stipulated for urban management. A Presidential Decree for Mamminasata Metropolitan Spatial Plan is to be prepared as a base of successful implementation. It is also necessary to formulate various legislations at the provincial level, such as rules/regulations on urban management, transportation management, and proper organization.
Figure 12.1 Legislations to be Formulated
1) Stipulation of Mamminasata Spatial Plan under a Presidential Decree
In order to ensure successful implementation of the Mamminasata spatial plan, a Presidential Decree should better be promulgated. The Decree will specify the spatial utilization strategy, control strategy, institutional arrangement, and monitoring. In order to promote efficient implementation with appropriate authority, organizational establishment for urban management also needs to be clearly defined.
1 Refer to Sector Study Report (16) for detail.
Presidential Decree concerning Mamminasata Spatial Plan
Spatial Planning Law (Law No. 24/1992) (Under Revision)
Regional Autonomy (Law No. 32/2004)
Spatial Planning Guideline (Ministry of Public Works)
Provincial Regulation concerning Urban
Management
Legislations to be newly prepared for the Mamminasata Spatial Plan
Provincial Regulation concerning Transportation
Management
Provincial Regulation concerning Organization
STUDY ON IMPLEMENTATION OF INTEGRATED SPATIAL PLAN FOR THE MAMMINASATA METROPOLITAN AREA 12. Institutional Strengthening
12-2
Table 12.1: Draft Contents of a Presidential Decree Chapter I General Provision Chapter II Policy and Strategy Chapter III The Integrated Spatial Plan of Mamminasata Metropolitan Area Chapter IV Area Spatial Utilization Strategy Chapter V Institution and Inter Regional Coordination Chapter VI Area Spatial Utilization Control Strategy Chapter VII Society Involvement and Improvement Chapter VIII Other Provisions Chapter IX Crime Provision Chapter X Investigation
Draft Decree is under preparation by Dinas Spatial Planning (province) based on the “Integrated Spatial Plan (Draft)”. Since the preparation of the Presidential Decree is under the responsibility of the Ministry of Public Works, the Decree will be prepared finally by the Ministry.
Provincial regulation concerning urban management is to be formulated to show development guidance based on the Presidential Decree. The objective of the legislation is to appropriately regulate development activities respective zone and area designated under land use zoning. General direction for land use regulation is proposed as shown in the following.
Table 12.2: General Direction for Urban Planning Zone Zone Area Definition
Urban Planning Zone
Promotion Area [Cat. 1]
Area of high urbanization (Makassar and Sungguminasa) Urban development has to be well controlled to avoid further deterioration of urban environment. Improvement of urban amenity (parks and green area) and efficient land utilization is the priority concern for the land use control
Promotion Area [Cat. 2]
Area where urbanization has begun recently (Maros & Takalar) Since urbanization level is still low, proper control shall be applied for urbanization
Control Area Areas of low utilization such as swamp, inundation/flood prone area, green open space Development activities are strictly regulated
Semi-Urban PlanningZone
Agricultural Priority Area
The area where development activities are strictly regulated for the purpose to protect agricultural production.
Agricultural andSettlement Area
The area where urbanization has not begun and utilized either as agriculture or no utilization. Urbanization with control measure is directed in this area New town, industrial zone, education/R&D development area planned in this area The area where development activities are allowed with a certain condition (type, scale, infrastructure) This area will become “urban planning zone” in the future
STUDY ON IMPLEMENTATION OF INTEGRATED SPATIAL PLAN FOR THE MAMMINASATA METROPOLITAN AREA 12. Institutional Strengthening
12-3
Zone Area Definition Control Area Areas of low utilization such as swamp, inundation/flood
prone area, green open space Development activities are strictly regulated
ProductionForest Zone
Afforestation Area The hilly area surrounded by forest area and presently grass landCreate production forest with intensive afforestation
Protection Zone Protected Forest Area (Existing)
Existing forest area where should be protected. Development activities are strictly regulated
Water-front Reserves
River, lakes, ocean area Development activities are strictly regulated
(1) Regulations for Urban Planning Zone
Makassar is designated as Urban Planning zone Promotion Area (Cat. 1) and Control Area. In principle, any development is prohibited in the Control Area. Promotion Area (Cat. 1) is designated to promote efficient and effective land use. Urban Planning Zone, Promotion Area (Cat. 2) is applied to the existing urban center in each district, except for Makassar, to establish urban area with excellent urban amenity. Guidance for the land use control in this zone is summarized in the following table.
Table 12.3: Land Use Control in Urban Planning Zone
Area Definition
Residential Area (Losari Beach area)
The residential and commercial mix use with low height. Only small scale shops are allowed. Building Coverage Ratio (%) : 30, 40, 50, 60 depending on
location Building Volume (%): 50, 60, 80, 100, 150, 200
depending on location Residential Area (Panakkukang Area)
The residential area with low and middle height. Mainly residential use only. Building Coverage Ratio (%) : 30, 40, 50, 60 depending on
location Building Volume (%): 50, 60, 80, 100, 150, 200
depending on location Commercial Area (along large road, Jl Petterani)
The commercial and business use. Building Coverage Ratio (%) : 60, 80 depending on location Building Volume (%): 400
Promotion Area [Cat. 1]
Industrial Area Only allows industry that is not harmful to environment Building Coverage Ratio (%) : 50, 60, 80 depending on location Building Volume (%): 80, 100, 150, 200 depending on
location Residential Area The residential and commercial mix use with low height. Only small
scale shops are allowed. Building Coverage Ratio (%) : 30, 40, 50, 60 depending on
location Building Volume (%): 50, 60, 80, 100, 150, 200
depending on location
Promotion Area [Cat. 2]
Commercial Area The commercial and business use. Building Coverage Ratio (%) : 60, 80 depending on location Building Volume (%): 400
STUDY ON IMPLEMENTATION OF INTEGRATED SPATIAL PLAN FOR THE MAMMINASATA METROPOLITAN AREA 12. Institutional Strengthening
12-4
Area Definition
Industrial Area Only allows industry that is not harmful to environment Building Coverage Ratio (%) : 50, 60, 80 depending on location Building Volume (%): 80, 100, 150, 200 depending on
location
It is also important to provide regulations on parks and green area. Following table shows the idea of the size of parks by the number of residents.
Table 12.4: Regulations on Urban Amenity
Land Use Facility/Items Development Target Open space Urban park: General park Size: 10 ha
Population: 100,000 persons Urban park: Athletic park Size: 15 ha
Population: 100,000 persons Residential park: medium scale Size: 4 ha
Population: 40,000 persons Residential park: small scale Size: 1 ha
Population: 10,000 persons Water front (river, lakes) Utilization of exiting water area as a park
or increase access. Green area Road, Parks, Open space More than 20% of the new development
area (including parks, street trees)
(2) Regulations for Semi-urban Planning Zone (Agricultural and Settlement Area)
In the agricultural and settlement area, urban development can be allowed in the area only with development permits. In order to avoid uncontrolled urban development by small scale development, only large scale planned development is allowed in the area. The minimum development area will be 20 ha. New township will be developed under this control.
Table 12.5: Land Use Control in Agricultural and Settlement Area (Semi Urban Planning Zone)
Area Definition
ResidentialArea
The residential and commercial mix use with low height. Only small scale shops are allowed. Building Coverage Ratio (%) : 30, 40, 50, 60 depending on
location Building Volume (%): 50, 60, 80, 100, 150, 200
depending on location Commercial Area
The commercial and business use. Building Coverage Ratio (%) : 60, 80 depending on location Building Volume (%): 400
Agricultural and Settlement Area
Industrial Area Only allows industry that is not harmful to environment Building Coverage Ratio (%) : 50, 60, 80 depending on location Building Volume (%): 80, 100, 150, 200 depending on
location
STUDY ON IMPLEMENTATION OF INTEGRATED SPATIAL PLAN FOR THE MAMMINASATA METROPOLITAN AREA 12. Institutional Strengthening
12-5
3) Transportation Management
Transportation management is indispensable for urban development. Legislation for transportation management should also be strengthened as part of urban management.
Table 12.6: Legislation for Transportation Management Items Description
Road Structure Promote user friendly road structure. Efficient road structure for automobiles and pedestrians. Landscape (trees, design) has to be defined.
Traffic management Promote efficient road management by vehicle control and road utilization (separate lane for types of vehicle). Control route of pete-pete, becak, motor cycle, private vehicle, large vehicle. Some roads shall be prohibited from enter for a certain type of vehicle. Control by the function of the roads and the zoning in the urban area. Establishment of pedestrian only period (e.g. weekend) in designated area Control of street vendors. Proper management of traffic lights.
Parking Control the parking along the streets which disturb traffic flow. Road signs Clear road sign not only for the local people, but also for tourists.
Design and location have to be appealing. Barrier free Structure of road and traffic management that concerns socially
handicapped people. Exhaust control Control exhaust from vehicle.
In addition, it is important to adopt a new method of road construction, particularly regulation on land usage, because once the road plan is announced, people buy land to make profits which makes land acquisition and road construction difficult.
Table 12.7: Usage of Land along New Trunk Road Items Description
General The purpose of this regulation is to protect the land speculation and to share the benefit from the increasing in value of the land along the new trunk road due to the new development, between government, as developer and the payer of the new road construction, and the land owner as the beneficiaries
Area to be applied Both sides of 100 m width from the edge of the new trunk road Type of usage It will be categorized and for agriculture/forest, housing commercial/offices,
industry and others Right to use land The proprietary rights of the land owner shall be kept while the rights of
usage of the land shall be handed over to the government after the development of the new trunk road. However, the right usage will remain with the present owner if there is no alternation in his usage of the land. In case of the succession to the legitimacy, the right of usage shall be allowed to succeed.
Transfer of the land When the land owner at present hand over the land to the third person (s) after the x months prior to the announcement of the development plan (herein after is called as “x day”), the right of the usage of the land shall belong to the government automatically.
STUDY ON IMPLEMENTATION OF INTEGRATED SPATIAL PLAN FOR THE MAMMINASATA METROPOLITAN AREA 12. Institutional Strengthening
12-6
Items Description Benefit from the transferring of the land
When the owner transfer the land after “x day”, the business tax shall be charged to the owner at present against 50% of the balance between the sale price and the public assessment value before “x day”, and against the balance between the sale price and the purchased price for the new purchaser of the land
Provincial regulation concerning organization is discussed in the following Section 12.2
4) Urban Management Operation System
Improvement of development permit system
Development permit is an important system for urban management, which controls unwanted development and promotes sound development in accordance with the characteristics of designated zones and areas. Development application has to be screened by the regulation/guidelines provided for designated urban area. Transparent permitting system together with staff training has to be established.Permitting authority, whether province or district/municipality, has to be clarified for each urban management legislation.
Strengthening of land registration system
A proper land registration system is a mandate for urban development, which requires an accurate base map and database on land registration including land titling, size, and location. Since this type of land information is indispensable for urban development projects, a database system has to be established at the earliest. Establishment of database shall start with preparation of the base map, survey of land titling, then integrate other urban information such as public facilities and utility lines, which shall be managed by GIS (Geographic Information System).
Introduction of taxes to induce and control development
A way to control and mange urban development is to impose taxes depending on the land condition, which can also be used as an incentive to develop in accordance with the spatial plan. Conversion of agricultural area to settlement area, settlement area along urban roads, and redevelopment of urban area need to have different tariff rates. Tax exemption can also be applied for urban management. Since land transaction related tax for urban development is only BPHTB (land transaction tax), which is imposed when the land tile is transferred (usually 5% of land price), exemption on land transaction tax will not be effective. Tax exemption shall be considered for income tax and construction permit.
Strengthening of urban development mechanism
In order to promote urban development that will satisfy all stakeholders including residents, developer, and government, new urban management mechanism shall be
STUDY ON IMPLEMENTATION OF INTEGRATED SPATIAL PLAN FOR THE MAMMINASATA METROPOLITAN AREA 12. Institutional Strengthening
12-7
applied. Such a mechanism includes “redevelopment method” and “land re-adjustment method”. Application of these methods for Mamminasata development shall be considered further with provincial government.
12.2 Organizational Strengthening
1) Organizational Strengthening
In 2003, the Mamminasata Metropolitan Development Coordination Board (BKSPMM) was organized under the Governor’s Decree (No.860-XII-2003). BKSPMM is headed by Vice-Governor, South Sulawesi province and 4 major/district governors. Dinas Spatial Planning is functioning as secretariat to BKSPMM.
BKSPMM is in low profile having some constraints, including (i) unclear legal status, (ii) inefficient organizational structure having more than 80 officers from regencies, and (iii) unclear responsibility and less talented staff in management of urban development planning and implementation. BKSPMM is organized as shown in the following diagram. Although it has coordinated for planning of the Mamminasata spatial plan, it is would not be capable of managing the implementation of the spatial plan.
Figure 12.2: Organization of Existing BKSPMM
Advisor (Governor of South Sulawesi)
Coordination Body Head: Vice Governor of South Sulawesi Deputy: Head of BAPPEDA of South Sulawesi Members: All Mayors & Governors within Mamminasata
Secretariat Head: Head of Dinas Spatial Plan of South Sulawesi Deputy: Head of Sub-Dinas of Spatial Plan & Program of
Dinas Spatial Plan Secretary: Head of Section of Regional & Provincial Spatial Plan
Dinas Spatial Plan Members: Related Dinas in Province (11)
Makassar (13) Maros (10) Gowa (14) Takalar (11)
( ) No. of Dinas
STUDY ON IMPLEMENTATION OF INTEGRATED SPATIAL PLAN FOR THE MAMMINASATA METROPOLITAN AREA 12. Institutional Strengthening
12-8
Four alternative measures have been discussed for strengthening the existing BKSPMM for the successful implementation of the Mamminasata spatial plan under the strong leadership and management. The first alternative is to strengthen the management capability of BKSPMM for the implementation of the spatial plan through the following measures.
(i) Members of the Coordination Body should periodically meet and take strong leadership in the coordinated execution of the spatial plans.
(ii) The function and staff of the secretariat should be reinforced by highly qualified and full-time experts specialized in management of spatial plans.
(iii) Members of BKSPMM at the municipal/district level should streamline and they should be reinforced with qualified management officers.
The second alternative is to set up a management office of BKSPMM under the provincial secretariat or BAPPEDA with newly recruited qualified full-time staff and to make it function as a secretariat to the Coordination Body, as shown in the following.
Figure 12.3: Improved Organization of BKSPMM (Alternative 2)
The third alternative is to organize and structure a new office called the “Mamminasata Development Management Bureau” (BPPM) in the functional section of the provincial government so that authority of the Agency is strong enough to manage stakeholders. BPPM will be newly staffed with several qualified experts in project/program management, programming and budgeting, financing, and engineering. BPPM will coordinate closely with the Coordination Body of BKSPMM.
Local government representative
Governor of South Sulawesi
Coordination Body Head: Vice Governor of South Sulawesi Deputy: Walikota Makassar, Bupati Maros Bupati Gowa, Bupati Takalar
MakassarRepresentative
MarosRepresentative
Gowa Representative
Takalar Representative
Secretariat (under Provincial Secretariat or BAPPEDA))
STUDY ON IMPLEMENTATION OF INTEGRATED SPATIAL PLAN FOR THE MAMMINASATA METROPOLITAN AREA 12. Institutional Strengthening
12-9
Figure 12.4: Mamminasata Development Management Agency as Functional Organization (Alternative 3)
BPPM is composed of three division, (i) infrastructure & environment, (ii) legal & finance division, (iii) database/monitoring division with total of 10~15 staff. The head of the Agency shall be Echelon II, which is equivalent to Dinas Head and BAPPEDA head.
BKSPMM shall be reformed so that it will be composed of one chairman and four vice chairmen. Provincial Vice Governor continues to be a Chairman, and heads of district/city from the Mamminasata Metropolitan Area (Makassar, Maros, Gowa, Takalar) will be Vice Chairmen.
It is important that BPPM activities be monitored by the third parties (residents,, academic, private sector and others) for the purpose of securing transparency of the operation. Existing monitoring or supervision function of government activities shall include monitoring of BPPM activities.
In addition, “Advisory Committee” or “Advisory Board” will be newly established. The committee members are composed of private and academic sector and functions as consultation to Governor.
The forth alternative is to establish independent organization (e.g. Mamminasata Urban Development Corporation) as the government organization starts to function as required and the development demand accelerates in the future. The main function of the corporation is implementation of urban development projects to provide comfortable living environments by providing basic infrastructure, particularly in the new town development areas.
The Corporation should be independent from the government organization, and the financial status in particular has to be secured for sustainable organizational operation and sustainable urban development. The organizational structure, job
Provincial Secretariat
Governor
Vice Governor
Secretariat Element Implementation Element Supporting Element
Provincial Agency (Dinas)
Provincial Technical Institution (Badan)
Functional Organization
BPPM
STUDY ON IMPLEMENTATION OF INTEGRATED SPATIAL PLAN FOR THE MAMMINASATA METROPOLITAN AREA 12. Institutional Strengthening
12-10
description and financial structure shall be determined by BPPM and BKSPMM when the Corporation is organized.
Figure 12.5: Organization Structure of BPPM (Badan) (Alternative 4)
2) Function of BPPM
The main function of BPPM is control and monitoring of Mamminasata development including implementation management, environmental management, project finance, legal enforcement, and database management. Management of action plans is also the task of BPPM.
Table 12.8: Task of Mamminasata Development Management Agency (Proposed) Position Established as functional organization of South Sulawesi Government Coverage Management and control of urban development projects in the
Mamminasata area and district/city projects that have impact on Mamminasata particularly infrastructure and environment
Job description Management of Mamminasata development implementation listed in Presidential Decree Coordination of BKSPMM and other stakeholders (government, private, PMU)infrastructure and environmental management, legal and financial management, and information system management and monitoring and control
Staff Full time competent staff (Total number of staff 10~15) Specialist; Urban management, finance (project finance), environment, infrastructure, supporting staff government or private staff
STUDY ON IMPLEMENTATION OF INTEGRATED SPATIAL PLAN FOR THE MAMMINASATA METROPOLITAN AREA 12. Institutional Strengthening
12-11
Table 12.9: Job Description of BPPM Function Description
(i) Overall management of action plan implementation
Implementation management Coordination with concerned organizations Financial and physical management
(ii) Infrastructure and environmental management
Plan and implementation management Physical management Environmental management
(iii) Legal and financial management
Legislation preparation and enforcement Public finance management (PPP, PFI, Concession, public investment)
(iv) Information system management/ Monitoring and control
Information system management (monitoring and dissemination) Mapping Monitoring and evaluation of project implementation
3) Organizational Development Scenario
The Alternative 3 above is most desirable in view of the efficient and functional coordination/management as well as strong leadership that would be indispensable for the implementation of the Mamminasata spatial plan and the attainment of the “creative, clean and coordinated metropolitan area”.
In order to assign proper authority and function of BPPM, the organizational establishment should be included in the institutional section of the Presidential Decree for the Spatial Plan for the Mamminasata Metropolitan Area. Since stipulation of the Presidential Decree is expected to take some time, BKSPMM with permanent staff should be formed in an appropriate provincial government position. In long term Alternative 4; Establishment of Mamminasata Development Corporation is to be considered. Organizational strengthening scenario is summarized in table below.
Short Term (2006~2010) Mid to Long Term (2010~) Organization strengthening scenario
Strengthen BKSPMM function Establishment of BPPM as functional organization in South Sulawesi Provincial government. Establishment of Advisory Committee to promote Public Private Partnership
Establishment of “Mamminasata Urban Development Corporation”, independent from government organization. Public-private financed organization.
Description Main function of BPPM at this stage is to formulate necessary legislation, GIS database establishment, promotion of PPP and urban management capacity development. Also close coordination with Project Management Unit (PMU) to be established for “Urban Environmental Improvement Project”Provide capacity building for BKSPMM and BPPM
Enhance public and private coordination in urban development such as joint investment. Public-private financed organization.
STUDY ON IMPLEMENTATION OF INTEGRATED SPATIAL PLAN FOR THE MAMMINASATA METROPOLITAN AREA 12. Institutional Strengthening
12-12
Organizational setting for Mamminasata development to be established by 2010 is illustrated in the following figure.
Figure 12.6: Organizational Setting for Mamminasata Development
12.3 Capacity Development
1) Capacity Development Strategy
In order to realize the spatial plan, the empowerment and capacity building of local administrations are vitally important. Deregulation and decentralization of central government is in progress over the world country. Local governments are expected to receive full benefit of decentralization so that the regional matter could be managed by its own staff. For effective capacity building, specific attention will be paid in the following.
(1) Importance of OJT
Several methods of training are available: lecture, OJT at site, OJT abroad, attending seminar, training at other agencies. The training method should be selected in due
BKSPMM (Mamminasata) (Coordination Body)
Established in 2003 as coordinating body of Mamminasata development (Strengthening of BKSPMM, 2006~) Chairman: Vice Governor Vice Chairman: Walikota Makassar Bupati Maros Bupati Gowa Bupati Takalar Secretariat Province (Secretariat
or BAPPEDA Members: Province, District, City
Mamminasata Development Management Agency
Provincial Government (Management & Controlling Body)
Overall management of Mamminasata Development (2006~ )
To be established in the long run as urban development progress (2010~ ).
Urban development (construction) Infrastructure development (construction)
Coordination
Control & Monitoring
Mamminasata Environment Improvement Project
(as public works, PMU)
To be established upon implementation of the project (2007~ )
Ministry of Public Works Provincial BAPPEDA Provincial Dinas
Control & Monitoring
Urban Development Projects (private)
Private sector urban development Investor Developer Financial institution
Ad Hoc or project base organization
Organizations with permanent status to be established
Existing Organization
Advisory Committee (2006~ )
Academic Private Finance
Provincial Governor
STUDY ON IMPLEMENTATION OF INTEGRATED SPATIAL PLAN FOR THE MAMMINASATA METROPOLITAN AREA 12. Institutional Strengthening
12-13
consideration of the character of the training. A lecture will be suitable for training for teaching basic knowledge. OJT will be suitable for training operational activities, particularly in urban management.
For capacity development in urban management, OJT shall be a key method. Even governmental officials could get enough information from their jobs, the final result will depend on the circumstance of economic, natural and human conditions. These conditions are different from place to place, time to time, and we never face the same conditions as ever before. The only way to learn the situation would be the on-the-job training or experiences in other worlds.
There may be three ways to make it possible. One is to make them participate in suitable training courses offered by donors. Second is an exchange of human resources between the private and public sectors. Private fields usually have better system for management. Third is an exchange officials among municipalities, as well as between local government and central government.
(2) Sustainable Capacity Development
Capacity development is usually conducted in a form of lectures and workshops in a relatively short period, and monitoring and feedback is rarely conducted. In order to maximize the outcomes, capacity development should be conducted together with continuous feedback by trainees, by which sustainability could be secured. Following figure shows an example of sustainable capacity development.
Figure 12.7: An Effective Capacity Development Scheme
Stage 1: Practical Training Provide theory and knowledge Formulation of action plan to be executed by trainees 2~4 weeks
Stage 2: Practice at Daily Works (OJT) Application of theory learned in the lecture/discussion 3 months ~6 months
Stage 3: Follow Up Review of the practice/OJT Lessons learned from practice/OJT Improve the program and practice/OJT 1~2 weeks
Execute the action plan prepared bythe trainees for practical training or OJT.
Review the action plan execution and conduct monitoring and evaluation of the performance and outcome of training.
Provide practical knowledge necessary for urban management. At the same time, trainees are asked to prepare their own action plan to be executed for their works (as OJT).
Feed
back
STUDY ON IMPLEMENTATION OF INTEGRATED SPATIAL PLAN FOR THE MAMMINASATA METROPOLITAN AREA 12. Institutional Strengthening
12-14
2) Human Resource Development
Objective of human resource development is to develop urban management skills and create personnel who can be leaders in Mamminasata. Human resources development focuses on strengthening of implementation capability which covers (i) legal strengthening, (ii) coordination strengthening, (iii) land database strengthening, (iv) project finance strengthening, (v) environment management strengthening, (vi) transport management strengthening, and (vii) general administrative skills.
Target of human resource development is BPPM candidate staff, related field from BKSPMM and other technical organizations such as BAPPEDALDA and BPN.
No. 1 Legal strengthening Objective: Clear legislation and strong enforcement is mandate for land use control.
Legislation necessary for land use control has to be available and enforcement has to be strengthened
Justification: There is no zoning regulation that shows clear guidance on land use control and existing legislation (law and regulation both at central government and regional government level) is not obeyed. In order to create urban environment unique to the Mamminasata Metropolitan area and strengthen land use control, legislation has to be prepared and enforcement activity has to be strengthened
Activities: (i) Drafting of legislation (ii) Clarifying enforcement measure (iii) Dissemination of legislation to stakeholder (BKSPMM, developer, private
STUDY ON IMPLEMENTATION OF INTEGRATED SPATIAL PLAN FOR THE MAMMINASATA METROPOLITAN AREA 12. Institutional Strengthening
12-15
No. 3 Land database management Objective: Objective of the database management is to establish land data base with standard
format, strengthen database management including update, sharing, utilized for urban development.
Justification: Database on land has to be available and has to be shared among stakeholders for urban management. Also database is scattered through a variety of organizations for different purpose, format is different, and data is not shared. It is necessary to prepare database with same format so that whoever needs data can have access to the data.
Activities: (i) Preparation of maps covering Mamminasata Area (ii) Establishment of land use database (GIS, CAD, and other forms) with same
format by combing the data from related agencies such as BPN, central and local government
No. 4 Project finance strengthening Objective: Objective of the project finance is to strengthen financial capability for the
Mamminasata urban development by introducing PPP and other project finance scheme.
Justification: Mamminasata urban development requires a large amount of fund. Since government fund is limited, it is necessary to seek for the funds from private sectors or international donors. It is also necessary to consider self-finance urban development scheme.
Activities: (i) Introduction of project finance scheme (ii) Public Private Partnership (PPP) (iii) Search for investment opportunity
Target group: BPPM BAPPEDA
No. 5 Environment management Objective: Objective of environment management is to improve natural environment such as
air and water and also to improve urban amenity such as green space and parks. Justification: Urban environment is one of the most important issues in the Mamminasata urban
development. Activities: (i) Environmental monitoring (air, water, solid waste) in urban area, coastal area
STUDY ON IMPLEMENTATION OF INTEGRATED SPATIAL PLAN FOR THE MAMMINASATA METROPOLITAN AREA 12. Institutional Strengthening
12-16
No. 6 Transport management Objective: Objective of transport management is to strengthen transport management and
improve road development system Justification: Transport condition can not be solved simply by increase road network and
capacity. Transport management including vehicle management, lane management, road development system shall be strengthen to reduce traffic congestion
Activities: (i) Vehicle management (becak, petepete, automobile) (ii) Separate lane for different transport mode (iii) Traffic light management (iv) Road development system (land acquisition, tax)
Target group: BPPM Dinas Spatial Planning (Province & District/City) Dinas Transport (Province & District/City)
No. 7 General administrative skills Objective: Objective of administrative skills to improve computer, writing, and mathematics
skills necessary for daily works Justification: Urban management requires data collection and most of which is available
through internet. Mathematics skill is weak for many government officials. Basic mathematics needed for development management has to be provided.
Activities: (i) Computer (word, excel, mapping, internet) (ii) Mathematics
Target group: BPPM Dinas Spatial Planning
STUDY ON IMPLEMENTATION OF INTEGRATED SPATIAL PLAN FOR THE MAMMINASATA METROPOLITAN AREA 13. Conclusion and Recommendation
13-1
13. CONCLUSION AND RECOMMENDATION
13.1 Conclusion
The Study on Implementation of the Integrated Spatial Plan for the Mamminasata Metropolitan area, as presented in this report, will lead to the following conclusions.
1) This Study has put emphasis on the protection of the environment and the betterment of the amenity in the Mamminasata area, modifying the direction of the existing plans. Through discussions at Workshops and Working Group meetings, this modification has been supported by stakeholders in the region. Stakeholders are willing to hand over a better environment and amenity to the generations to come.
2) With the increased population and advanced urbanization in Makassar, land use patterns would inevitably be changed not only in Makassar but also in other regencies in Mamminasata. Such a change should not be left as it is made indipendently, but it should be well coordinated, guided and regulated under the spatial plan not only at the regency level but at the regional level in Mamminasata.
3) The economic development target set as one of frameworks for the integrated spatial plan in Mamminasata, particularly for agriculture and manufacturing sectors, will be attainable if development efforts are made to the direction as indicated in this Study. Such a target, however, will not be attainable without strenuous efforts of the public and private sectors, as well as support of the academic sector.
4) In the event that the economic development targets are attained as programmed, employment opportunities will be substantially increased and the unemployment rate could be lowered to the level of around 5%. With more employment opportunities, the poverty rate will no doubt be lowered though it has not been quantified. The standard of living of the people in Mamminasata will be enhanced as a whole.
5) With a common target set under the integrated spatial plan, dynamism would be created and expanded in every part of the development activities in
STUDY ON IMPLEMENTATION OF INTEGRATED SPATIAL PLAN FOR THE MAMMINASATA METROPOLITAN AREA 13. Conclusion and Recommendation
13-2
Mamminasata. The integrated spatial plan for Mamminasata would serve as a model for future development of regional Metropolis in Indonesia.
6) A large investment will be required to improve economic infrastructure as well as to improve urban infrastructure as proposed in this Study. Most of such infrastructure will be required for integrated regional development and not for specific regency where it is located. Consequently, cooperation among regencies in Mamminasata is indispensable to attain the common objectives for development.
7) Funds available for public investment in infrastructure projects are limited, and financially profitable projects should be implemented by the private sector as far as possible. Since urban and economic infrastructure that are non-profitable and/or semi-profitable are managed and implemented by the public budgets at the national, provincial and regency levels, additional public investment funds would be required for Mamminasata. In this context, the regency governments should earmark more development expenditures (currently around 20% of municipality and regency expenditures in Mamminasata), saving the routine expenditures (currently about 80%).
8) The proposed programs will not be successfully implemented only with the financial arrangements. Their sustainability will more depend on a strong commitment and initiative of all stakeholders, particularly in the public administration. Such a commitment will be led by the institutional arrangement for implementation. At the same time, every stakeholder should observe the rules and regulations to be set out for spatial development and management in Mamminasata. Without such a firm commitment and observation, the spatial plan for Mamminasata will not be sustainable.
STUDY ON IMPLEMENTATION OF INTEGRATED SPATIAL PLAN FOR THE MAMMINASATA METROPOLITAN AREA 13. Conclusion and Recommendation
13-3
13.2 Recommendation
Various recommendations have been presented for implementation of the regional and sectoral development plans. For successful implementation as an integrated spatial plan, overall recommendations are presented in a summarized form, as follows.
1) District spatial plans for Makassar, Maros, Gowa and Takalar regencies should be elaborated by referring to the Mamminasata spatial plan, and they should be well coordinated among them. Unless otherwise, both district spatial plan and Mamminasata spatial plan will turn out to be useless. It is therefore recommended that the district spatial plans be formulated and implemented in conformity with the principles and recommendations presented in this Study.
2) In formulating the district spatial plans, it is desirable that the database be commonly used for easy reference among districts, as well as for easy coordination if and when required. Since the database used for this Study is made available, including GIS database, it is recommended that the database be utilized to the utmost extent by the district offices in charge.
3) District spatial plans should also be formulated in due consideration of the budget for development expenditures in each regency. Since the regency’s budget for development is currently limited to an average of 20% of total budget and the remaining 80% is earmarked for personnel and other routine expenditures, it is recommended that the routiene expenditures be reduced to secure more budget for development expenditures.
4) For better coordination in implementation, the provincial government should take initiative in setting up a management office for the Mamminasata spatial plan. Such a management office should be staffed with highly capable experts and granted with proper authorities for management. It should better be supported by a board or committee composed of representatives from the public, private and academic sectors. It is recommended that the management office and board/committee be organized by the provincial government at the earliest for the realization of “coordinated” Mamminasata metropolitan area.
STUDY ON IMPLEMENTATION OF INTEGRATED SPATIAL PLAN FOR THE MAMMINASATA METROPOLITAN AREA 13. Conclusion and Recommendation
13-4
5) Collaboration and partnership with the private sector is of vital importance for the successful implementation of the Mamminasata spatial plan. Likewise, partnership with the academic sector should also be promoted further and the wisdom of the public, private and academic sectors are collectively mobilized to realize “creative” metropolitan Mamminasata. At the same time, cooperation and collaboration with local NGOs is to be promoted, particularly for the creation of “clean” Mamminasata.
6) For coordinated management of the implementation of the Mamminasata spatial plan, as well as for the implementation of the district spatial plans, it is desirable that a Presidential Decree be set forth to regulate the manners for planning and implementation. It is recommended that the initiative be taken by the Ministry of Public Works for the promulgation of the Presidential Decree for the Mamminasata spatial plan.
7) Irrespective of whether the Presidential Decree is promulgated or not, adequate codes, rules and regulations are to be set forth for land use, urban development, traffic management, environmental management and other management for the implementation of the spatial plans, as discussed preliminarily in this Study. It is recommended that adequate measures be taken for the establishment of such codes, rules and regulations for the implementation of the Mamminasata spatial plan.
8) In view of the fact that the public awareness is weak, particularly in the protection of the environment and amenity, various initiatives should be taken to motivate the people in protecting the environment and respecting the public interest. Several pilot operations in the course of this Study (e.g.., a painting contest, green campaign, tree planting, a health exchange program for garbage collection, a trial in environmental education) have demonstrated that the public awareness can be enhanced through a participatory approach. It is therefore recommended that the participatory approach be applied in motivating the people to create a clean, creative and coordinatedmetropolitan area of Mamminasata.
9) Measures should be immediately taken to implement the short-term action programs proposed under this Study. Such programs would require budgetary arrangements for implementation at the national, provincial and regency levels. Since the available financial resources are limited at each
STUDY ON IMPLEMENTATION OF INTEGRATED SPATIAL PLAN FOR THE MAMMINASATA METROPOLITAN AREA 13. Conclusion and Recommendation
13-5
level, loans on concessional terms should be secured so that the annual fund requirements for infrastructure development and other large investments would be minimized. It is recommended that such loans be requested to the international financial institutions, preferably in packages to facilitate the coordinated implementation.
10) The implementation of the Mamminasata spatial plan should be monitored periodically and lessons should be learned by all stakeholders. Since the social and economic situations are changing year by year, it is recommended that the proposed Mamminasata spatial plan be reviewed and updated after five years, in or around 2010.