UNRESTRICTED STUDY ON IMPROVING THE ENERGY EFFICIENCY OF PUMPS Contractor: ETSU, AEAT PLC, (United Kingdom) Participants: CETIM (France), David T. Reeves (United Kingdom), NESA (Denmark), Technical University Darmstadt (Germany) European Commission February 2001
Transcript
UNRESTRICTED
STUDY ON IMPROVING THE ENERGY EFFICIENCY OF
PUMPS
Contractor: ETSU, AEAT PLC, (United Kingdom)
Participants: CETIM (France), David T. Reeves (United Kingdom), NESA (Denmark), Technical University Darmstadt (Germany)
European Commission February 2001
AEAT-6559/ v 5.1 UNRESTRICTED
ii
ETSU ETSU is a large UK-based Energy and Environmental consultancy organisation working in diverse environmental activities including renewable energy, energy efficiency and sustainable development. ETSU is now part of AEA Technology PLC, and undertakes a broad range of work both in the UK and Overseas for a variety of private and public sector clients.
The main task of CETIM is to provide mechanical engineering companies with the necessary technological support to increase its competitiveness. To do this, it is active in the dissemination of relevant information, undertakes collective research, works for individual companies, and undertakes work to defend the interests and influence of the French mechanical engineering industry.
TFA Darmstadt University of Technology The chair of Turbomachinery and Fluid Power (TFA) is an educational institution within the faculty of mechanical engineering of Darmstadt University of Technology (Germany). The main research activities are aimed at experimental and theoretical investigations on turbomachinery and fluid powered systems, wehereas the topic „efficiency potential of centrifugal pumps“ is a major key aspect and the matter of permanent investigations within the frame of various research projects. David T. Reeves Pump Engineering Consultant David Reeves has been a full time independent consultant in pumps and pumping for fifteen years, advising makers, users, contractors and consultants on problems, procedures, performance and design. Previously, he was Director - Fluid Machinery Design for Worthington/Dresser USA, Chief Hydraulic Engineer for Weir Pumps and worked with three other major pump companies. He is immediate past Chairman of the Fluid Machinery Committee of the IMechE.
AEAT-6559/ v 5.1 UNRESTRICTED
iii
NESA is the largest Danish electricity company active in the complex new electricity market, and is the first Danish electricity distribution company to be a direct participant in the Nordic electricity exchange, Nord Pool. As a leading electricity company, NESA offers customer driven products as energy savings pro-ducts and procurement of energy efficient equipment, and offers energy management to customers.
Acknowledgements
The study group would like to thank the many individuals and organisations who helped with this study, in particular Guy van Doorslaer, Erich Holzhuter, Steven Schofield of Europump, and the many other pump manufacturers who took an active interest in the work or who attended progress meetings. In addition we would like to thank Bob Went of Thames Water (chairman of UK Pump Centre), Anibal de Almeida of University of Coimbra (Portugal), Paolo Bertoldi of DG TREN, and the EU/US Enersave Life Cycle Costs project team, all of whom made particularly valuable contributions to the project.
AEAT-6559/ v 5.1 UNRESTRICTED
iv
Executive Summary Energy consumption of Pumps Pumps are the single largest user of electricity in Industry in the European Union, consuming 160 TWhpa of electricity, accounting for 79 Mton CO2. This report recommends policy options to improve the selection and maintenance of pumps to reduce these emissions. It is estimated that the better selection of pumps could give cost effective energy savings of 3% or 1.1TWHpa in 2015. This give cumulative saving of 8.5TWhpa by 2015. The group estimates that further reductions in emissions could be made through improved system design, and so also supports actions to reduce these system losses. In particular, the Enersave Life Cycle Costing Guide is commended. A Procurement scheme for pumps It is recommended that a User-driven Procurement level scheme is piloted for the ranges of pumps concentrated on in this study. This will allow users to quickly see the spread of available efficiencies of pumps to meet their specified duty. It will therefore give a clear basis on which to assess different pumps offered. In addition, it is recommended that a “Mean Line” is drawn through this data. This would at last give specifiers and manufacturers alike a practical guide for assessing the efficiency of procured pumps. To make this study in to something achievable with the effort and time available, it concentrates on single stage centrifugal pumps for clean, cold water pumping duty only, but the methodology is applicable to other types of pumps as well. ` Other Key Points and Recommendations: 1.) Efforts should continue to be made by manufacturers, Government Agencies and others to
raise the general level of knowledge about pumps and pumping systems. This is important whichever other policy options are implemented.
2.) It it is recognised that the largest energy savings are to be made through the better design and
control of pump systems. But unfortunately the lack of expertise and available time to identify best solutions means that promoting the use of more efficient pumps is very valuable in itself.
It is however also recognised that giving simple guidance on the selection of pumps by efficiency, does present particular challenges, in particular that:
• Efficiency may fall off fast as operation moves from the Best Efficiency Point • Pump Efficiency will deteriorate over time
AEAT-6559/ v 5.1 UNRESTRICTED
v
• Pump operation and hence efficiency is determined by principally two parameters (head and flow), in addition to other factors such as properties of the fluid, impeller design, and motor speed selected. This compares unfavourably with labelling schemes for products such as lights, white goods or electric motors where definition of typical operation and hence rated efficiency is much simpler.
• Above all, it is crucial that any scheme to aid in the selection of better efficiency pumps ensures that users are always comparing “like with like.” It is recognised that simple methods of identifying efficiency are not needed by the informed buyer, (usually those from larger companies in for example the Water and Chemicals sectors), where there is anyway a greater awareness of efficiency and Lifecycle costing.
3.) There is a concern over the effect of tolerances on the published efficiencies of mass-
produced pumps allowed under existing ISO test codes. It is hoped that this will be remedied. Such changes should not though be allowed to slow down the implementation of any of the suggested policy options.
4.) Full data on pump characteristics is essential for the informed selection and use of pumps. It
can be difficult to obtain the detailed information required, and so a database of pumps from different manufacturers would be attractive. However, such a database would be very large, and so demand large amounts of time and effort to design and maintain. To check on how useful such a database would really be, it is suggested that a pilot version with data on a limited range of pumps is included within EURODEEM and sent out for comment. Also, a close watching brief should be maintained on the commercially–funded BigMachines.com on-line pump selection and purchase web-site.
5.) It was clear from discussions with manufacturers that there is not a direct relationship
between price and efficiency. Users will therefore often be in a position to buy a more efficient pump at little or no price premium.
6.) The energy savings identified are based on manufacturers producing pumps with efficiency
ratings among the current “best in class”. Energy savings beyond these values are possible using new manufacturing and design techniques. But for the fastest impact on energy use, the emphasis should be on existing technologies rather than the possible distraction and longer time to market of newer technologies.
7.) Europump has throughout made constructive comment on the work of the study group, and
given support in many other ways. It is important that this relationship is developed to future mutual benefit.
8. Support should be given for a proposed simple labelling system for smaller water circulation
pumps. Such types have very similar general characteristics and similar duties, and a labelling scheme is appropriate.
AEAT-6559/ v 5.1 UNRESTRICTED
vi
Contents
1. Policy Options For Improving The Efficiency Of Pumps 9
1.1 SUMMARY 9 1.2 CONSIDERATIONS I N RANKING PUMPS BY EFFICIENCY 9 1.3 DEVISING A CLASSIFICATION SCHEME 12 1.4 THE RECOMMENDED PROCUREMENT LEVEL APPROACH 13
2. Efficiency Levels Of Pumps 15
2.1 OBJECTIVES 15 2.2 PUMP TYPES AND DESIGN DUTIES 15 2.3 DATA COLLECTION AND ANALYSIS 17 2.4 PROCEDURE FOR ANALYSIS 18 2.5 EFFECT OF SPECIFIC SPEED 19 2.6 EFFICIENCY REFERENCE LEVELS 23 2.7 EFFICIENCY DETERIORATION IN USE 24 2.8 REFERENCES 25
3. Characterisation of Pump Use in the EC 26
3.1 INTRODUCTION 26 3.2 CENTRIFUGAL PUMP USE 26 3.3 METHOD 1 - EU PUMP STOCK BASED ON MOTOR ENERGY CONSUMPTION 26 3.4 METHOD 2 – ENERGY CONSUMPTION BASED ON ANNUAL SALES FIGURES 27 3.5 FUTURE PUMPSET USE WITH POTENTIAL SAVINGS 29 3.6 SUMMARY 30
4. User Attitudes to Pump Selection and Ways in Which They Can Be Changed 31
4.1 ENERGY EFFICIENCY IS NOT A PRIORITY 31 4.2 BARRIERS TO IMPROVING THE EFFICIENCY OF PUMPS 32 4.3 EDUCATIONAL NEEDS 33 4.4 WHAT USERS WANT TO HELP THEM IMPROVE THEIR SELECTION OF PUMPS 34
AEAT-6559/ v 5.1 UNRESTRICTED
vii
5. Design Factors Affecting Pump Efficiency 36
5.1 INTRODUCTION 36 5.2 RESULTS OF THE T HEORETICAL INVESTIGATIONS 37 5.3 INFLUENCE OF DIFFERENT VALUES OF SURFACE ROUGHNESS 39 5.4 THE INFLUENCE OF SMOOTHING SEVERAL PARTS OF PUMPS 40 5.5 INFLUENCE OF DIFFERENT GAP CLEARANCES ON THE INTERNAL LEAKAGE FLOW RATE 42 5.6 CONCLUSIONS 43
6. Pump Efficiency deterioration 44
6.1 INTRODUCTION 44 6.2 THE COST OF EFFICIENCY DETERIORATION 44 6.3 FACTORS EFFECTING PUMP DETERIORATION 45 6.4 APPROACHES TO MAINTENANCE 46 6.5 MONITORING OF PUMP PERFORMANCE 46 6.6 REPAIR AND RE-CONDITIONING OF PUMPS 47
7. References 48
Appendix 1: EC Guide to Pump Efficiency 51
Appendix 2: Pump energy consumption calculated from sales data (1998) 60
Appendix 3: Efficiency Characteristics of Centrifugal Pumps 63
AEAT-6559/ v 5.1 UNRESTRICTED
9
1. Policy Options For Improving The Efficiency Of Pumps
1.1 SUMMARY
To improve the efficiency of the installed base of pumps, it is important that the decision maker(s) are given accurate information to assist in choosing the most efficient pump for their application. While such information and guidance should be simple, it is crucial that it is not over-simplified. In particular it is important that products are only compared on a “like for like” basis. Through careful consideration of technical and practical commercial issues, it is recommended that a “procurement level” approach is used in preference to attaching labels to pumps. A draft brochure for the end user showing the practical implementation of the procurement level approach is included as Appendix I. As described in chapter 4, better general education about pumps and pumping systems is important whichever policy options are selected. All personnel involved in the pump market would benefit, but in particular users, specifiers and system designers. 1.2 CONSIDERATIONS IN RANKING PUMPS BY EFFICIENCY
The following key points were the basis on which a procurement level approach was seen as being preferable to an efficiency labelling scheme: 1.2.1 Definition of pump types The wide range of pumping applications means that there is a very wide range of pump types manufactured. The BPMA lists 68 distinct types of pumps, although just a small number of styles account for the bulk of sales and energy use. Within these ranges there will also be different sub-styles and materials used to take account of the requirements of different users. Even within the well defined range of pumps considered in this study, there are no standard pump outputs:dimensions. (There is an ISO code of dimensions and approximate duties for some types of end-suction pumps (ISO2858-1975 (E), but different manufacturers will offer different head:flow characteristics within these set dimensions.) Finally, a particular centrifugal pump from a manufacturers range will be offered with a range of rotational speeds, impeller diameters, and sometimes, a range of different impellers. This variety of pump types would make any sort of labelling scheme challenging to design and apply.
AEAT-6559/ v 5.1 UNRESTRICTED
10
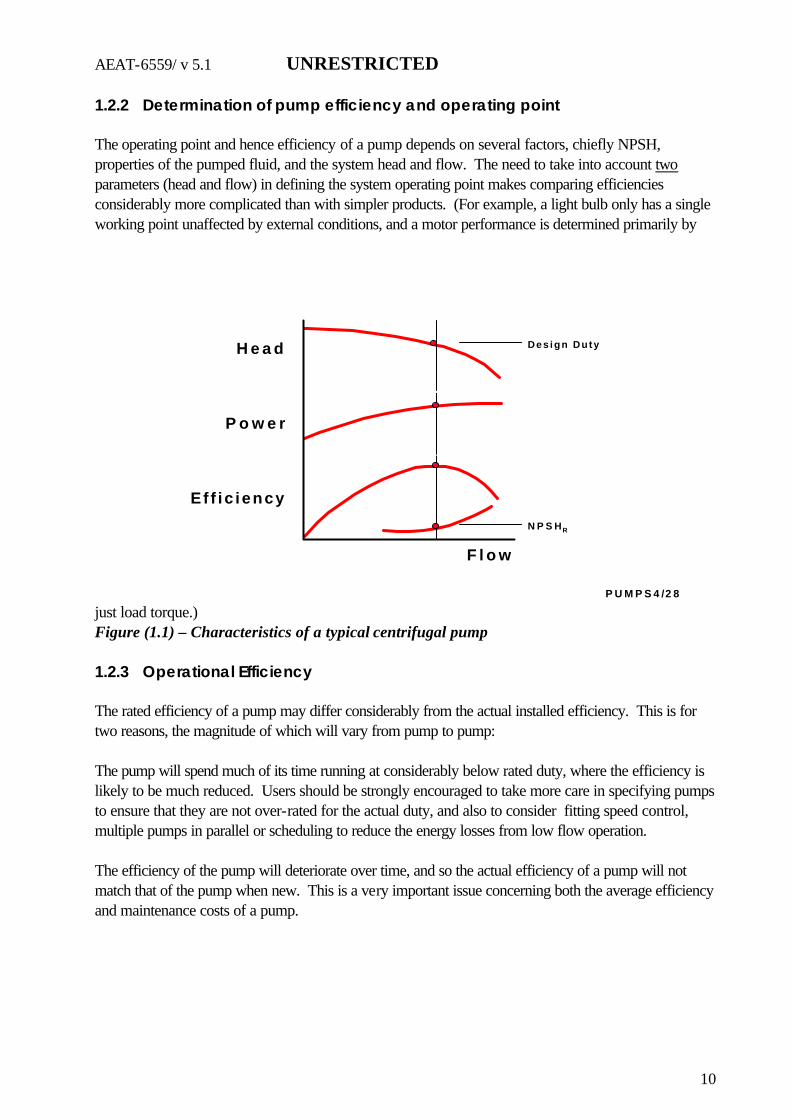
1.2.2 Determination of pump efficiency and operating point The operating point and hence efficiency of a pump depends on several factors, chiefly NPSH, properties of the pumped fluid, and the system head and flow. The need to take into account two parameters (head and flow) in defining the system operating point makes comparing efficiencies considerably more complicated than with simpler products. (For example, a light bulb only has a single working point unaffected by external conditions, and a motor performance is determined primarily by
just load torque.) Figure (1.1) – Characteristics of a typical centrifugal pump 1.2.3 Operational Efficiency The rated efficiency of a pump may differ considerably from the actual installed efficiency. This is for two reasons, the magnitude of which will vary from pump to pump: The pump will spend much of its time running at considerably below rated duty, where the efficiency is likely to be much reduced. Users should be strongly encouraged to take more care in specifying pumps to ensure that they are not over-rated for the actual duty, and also to consider fitting speed control, multiple pumps in parallel or scheduling to reduce the energy losses from low flow operation. The efficiency of the pump will deteriorate over time, and so the actual efficiency of a pump will not match that of the pump when new. This is a very important issue concerning both the average efficiency and maintenance costs of a pump.
P U M P S 4 /2 8
F l o w
Ef f ic iency
P o w e r
H e a d
N P S HR
Des ign Duty
AEAT-6559/ v 5.1 UNRESTRICTED
11
1.2.4 The effect of Accuracy and tolerances of published pump data Whatever schemes to promote the specification of more efficient pumps are implemented, manufacturers will still have to be trusted to publish data that is truthful. This is though no different to the current situation regarding the accuracy of published data. The wide tolerances allowed under current pump test standards severely limits the number of potential product efficiency bands which it is feasible to have to just two. 1.2.5 Definition of efficiency It is the view of the study group that existing pump declared efficiencies are misleading, and accordingly it is hoped that action can be taken to amend ways in which test standards are used when quoting efficiencies. However, this is not a reason to delay implementation of any suggested policy actions. There are several important concerns over quoted efficiencies: The allowed tolerance on mass-produced pumps by ISO test codes is wide. Therefore it is strictly hard to advise procurement behaviour on the basis of this standard. To get a much more useful efficiency figure the purchaser would have to go back to the manufacturer and ask for an efficiency quote based on the pump being tested to class B. It is however recognised that this will usually be unrealistically expensive. Unlike motors, where it is the losses rather than the efficiency that is measured, pump test efficiencies have a tolerance on the efficiency rather than the losses. The tolerance is based on the accuracy of the equipment used for the measurement of power, head and flow. This means that while the tolerance as a percentage of the pump efficiency remains the same across the whole efficiency range of pumps, the allowed tolerance expressed as a percentage of the losses on more efficient pumps is wider than on less efficient pumps. Furthermore, it is precisely this higher efficiency part of the market where efficiency is considered an important purchasing parameter. Similarly, less efficient pumps have a tighter tolerance. This results from the relative accuracy which is constant for the measurement of power, head and flow. It is not unusual to prepare special samples (eg special polishing) for efficiency testing. EUROPUMP has suggested that quoted catalogue efficiencies of some manufacturers may be different from actual shipped product.
AEAT-6559/ v 5.1 UNRESTRICTED
12
1.3 DEVISING A CLASSIFICATION SCHEME
1.3.1 Key considerations Despite the very real issues summarised above which relate to the need for careful interpretation of a simple pump efficiency value, there is clear user demand for some simple way of indicating in a fairly simple way which pump would use the least energy in a particular application. This is particularly the case for the smaller commodity type pumps considered in this study. But for specialist and engineered pumps where more effort is anyway spent in the selection of pumps, such simple indicative guidance on efficiency is not so important. Similarly, well-educated users are anyway proficient in the proper selection of pumps, and so further information is not so important for such people. However, the complexities of the decision making routes when purchasing pumps means that a clear indicator of pump efficiency would be of great benefit. Considerations made clear that it is only practical to have a single efficiency dividing line. Two options for the use of this line have been considered: Labelling of pumps Publishing a “procurement level” allowing buyers to compare the efficiency of a pump they are considering with others available. In considering which option to recommend, the group also took account of the additional considerations relating to attaching a label to a particular pump. Pump efficiency varies with speed (eg a pump optimised for a 2-pole motor may operate less efficiently when connected to a 4-pole motor). Pump efficiency varies with impeller diameter, with it being the norm for pumps to be offered with a variety of diameters. (Efficiency will also vary with impeller fitted, since a number of impellers may be fitted within the same casing). Pump efficiency can vary with different materials and when offered to different specifications, (eg API specifies large wear-ring clearances). There would be confusion on pumpsets if both the motor and pump had labels with different efficiency ratings. A database of pumps would be useful to help users to select the most efficient pump for their particular application. As with all databases of equipment, care would need to be taken that users were always looking at pumps appropriate for their particular application, and that the information was correct and up to date. The pumps extension to the Eurodeem database of motors will include several tools to assist users in pump selection: A simple guide for users on selecting the right type of pump for different applications.
AEAT-6559/ v 5.1 UNRESTRICTED
13
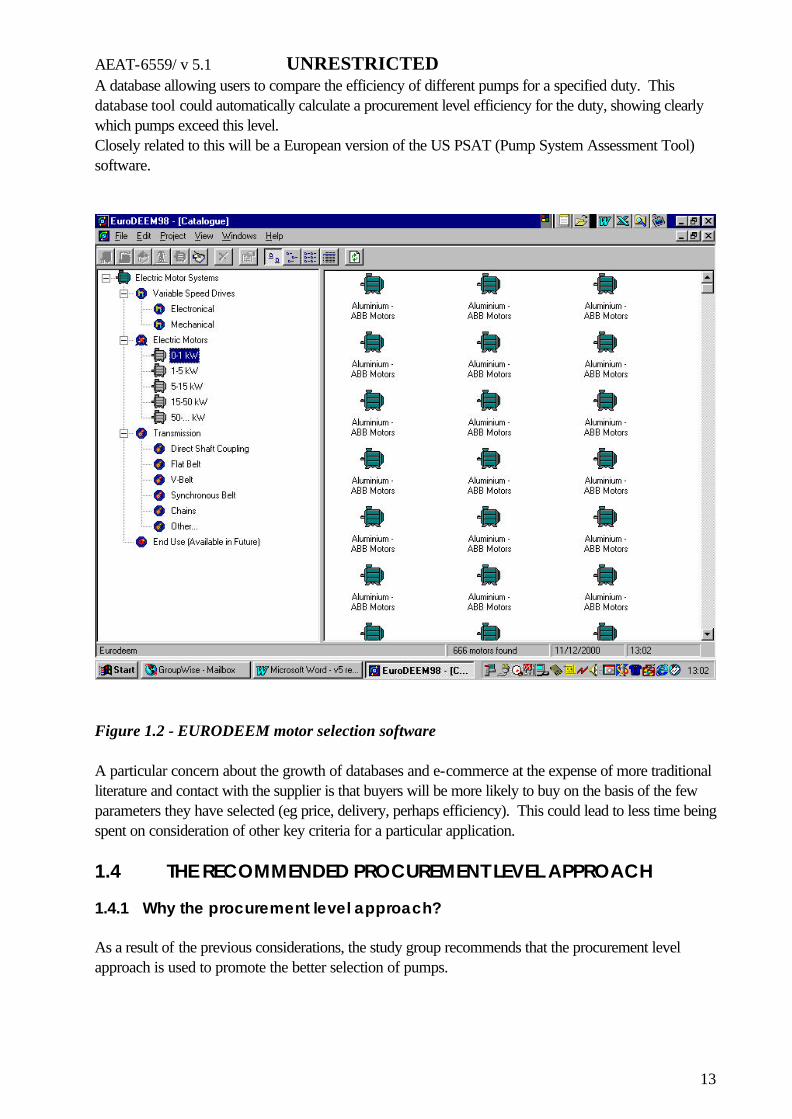
A database allowing users to compare the efficiency of different pumps for a specified duty. This database tool could automatically calculate a procurement level efficiency for the duty, showing clearly which pumps exceed this level. Closely related to this will be a European version of the US PSAT (Pump System Assessment Tool) software.
Figure 1.2 - EURODEEM motor selection software A particular concern about the growth of databases and e-commerce at the expense of more traditional literature and contact with the supplier is that buyers will be more likely to buy on the basis of the few parameters they have selected (eg price, delivery, perhaps efficiency). This could lead to less time being spent on consideration of other key criteria for a particular application.
1.4 THE RECOMMENDED PROCUREMENT LEVEL APPROACH
1.4.1 Why the procurement level approach? As a result of the previous considerations, the study group recommends that the procurement level approach is used to promote the better selection of pumps.
AEAT-6559/ v 5.1 UNRESTRICTED
14
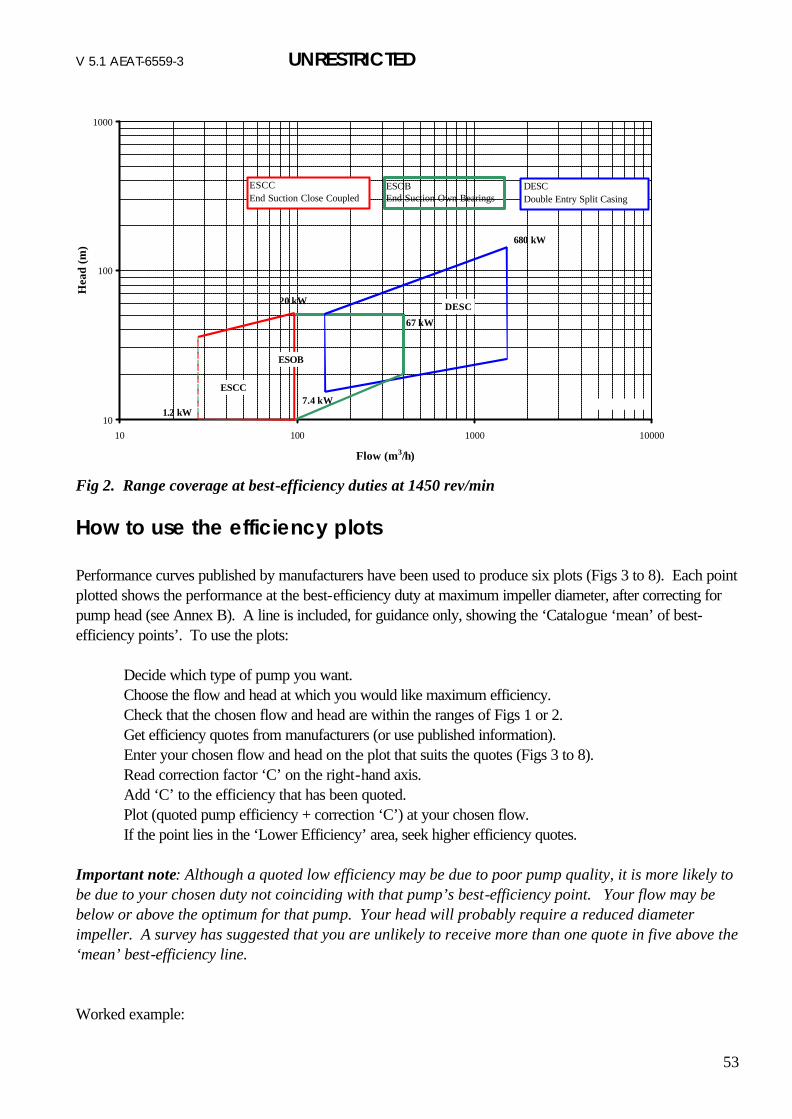
This would in practice be plots of pump best-efficiencies and a “mean-line”. This approach differs essentially from that of labeling by assessing the pump efficiency based on its actual application and duty. This is important because since pumps are not made in standard ratings, in practice a purchaser will be comparing pumps operating at different load points. It also overcomes the issues of different impeller diameters and types, and of different motor speeds. A procurement level scheme also has the benefit of being completely separate from manufacturers, since no actual pump listing is needed. The published “procurement level” would therefore give the user a clear guide as to how the efficiency of the pump they are considering compares with the best-efficiencies of others of the same type. This can help them in choosing a pump, and be the basis of a minimum efficiency procurement specification. Manufacturers might also wish to claim that some of their pumps, subject to certain product options and operating criteria, can achieve the level of the published ‘mean line’. Manufacturers will also be given the opportunity of comparing the best-efficiencies of their pumps with other makes and may decide to make design improvements. 1.4.2 Might pump labelling still be valid? The study group recommends that in some commodity type markets, in particular the smaller domestic/light commercial water circulation pump market, where the in-line pump and motor are always sold as a standardised integrated unit, some form of labelling might be possible. 1.4.3 Where to draw the efficiency line? A ‘mean line’ of best-efficiencies based on data collected from many different manufacturers will be plotted, for guidance only. The rated duty will rarely coincide with the pump best-efficiency point. The rated flow will usually be below or above the best-efficiency flow. The rated head will usually require a reduced diameter impeller. A survey has suggested that less than one in five quotes will fall above the ‘mean line’ of best-efficiency points.
AEAT-6559/ v 5.1 UNRESTRICTED
15
2. Efficiency Levels Of Pumps
2.1 OBJECTIVES
To obtain and analyse data on the performance of pumps currently in manufacture, in a form which can be used as a basis for formulating proposals for rating pumps by efficiency level. Also to consider why pump efficiency deteriorates in use. 2.2 PUMP TYPES AND DESIGN DUTIES
An examination of the market shows that about 26% of purchases by value are single stage pumps. These are mainly of the end suction type, which are either close coupled with the impeller mounted on an extension of the motor shaft or long coupled with their own bearings, and the double entry axially split case type. Regarding the operating ranges, we have looked at the areas of maximum purchase value. This is the basis for the chosen sizes, flows, heads and powers. The 50 Hz speeds of two pole and four pole motors only are selected. The resulting data is shown in Table 2.1. The corresponding shaft power range is quite wide, from 1.2 to 680 kW. 2-pole 4-pole Pump Type
Size Limit
Approx. Outlet Size (mm)
Flow (m3/h)
Head (m)
Approx. Outlet Size (mm)
Flow (m3/h)
Head (m)
Max
150
400
150
300
1500
140
Double Entry Split Case
Min
80
130
50
100
150
15
Max
100
200
130
150
400
50
End Suction own bearings
Min
50
30
20
50
30
10
End
Max
100
200
130
100
100
50
AEAT-6559/ v 5.1 UNRESTRICTED
16
Suction close coupled
Min
32
15
20
50
30
10
Table 2.1. Pump flow and head limits selected
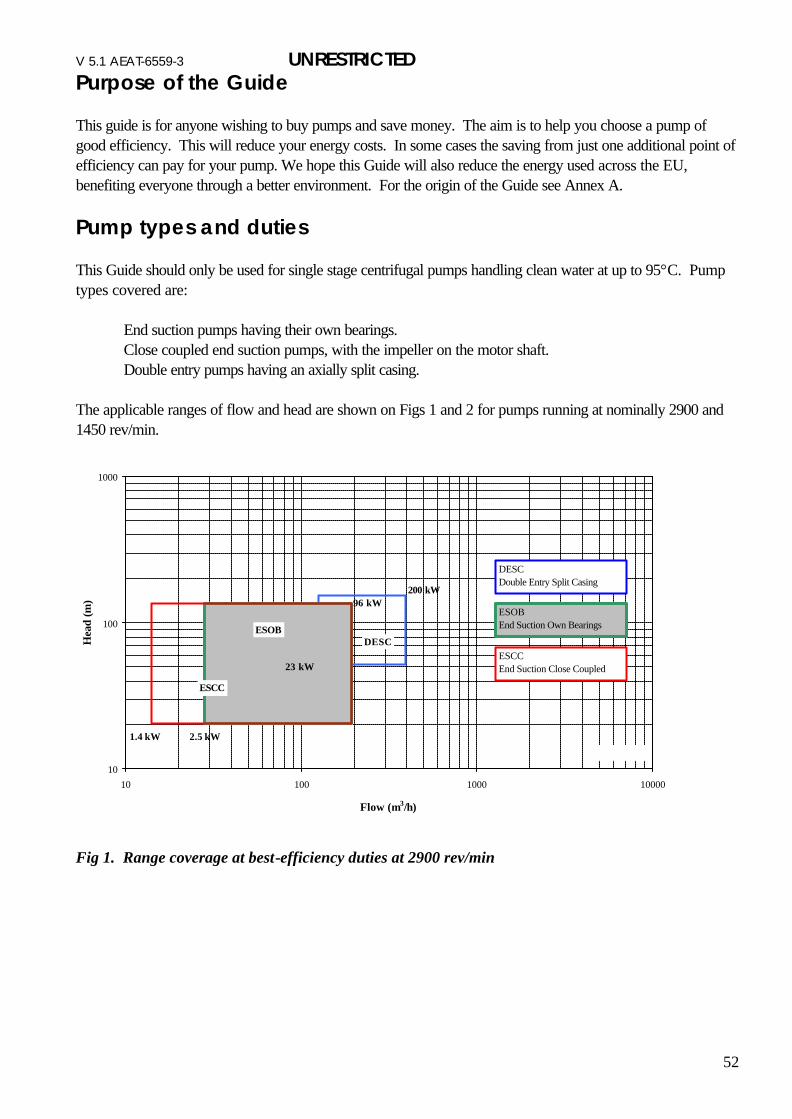
Fig 2.1. Range coverage at best-efficiency duties (2 pole)
10
100
1000
10 100 1000 10000
Flow (m3/h)
Hea
d (m
)
DESCDouble Entry Split Case
ESCCEnd Suction Close Coupled
ESOBEnd Suction Own Bearings
DESC
ESOB
ESCC
680 kW
67 kW
20 kW
1.2 kW7.4 kW
Duty Coverage - 4 pole
10
100
1000
10 100 1000 10000
Flow (m3/h)
Hea
d (m
)
DESCDouble Entry Split Case
ESCCEnd Suction Close Coupled
ESOBEnd Suction Own Bearings
DESCESOB
ESCC
200 kW96 kW
23 kW
2.5 kW1.4 kW
Duty Coverage - 2 pole
AEAT-6559/ v 5.1 UNRESTRICTED
17
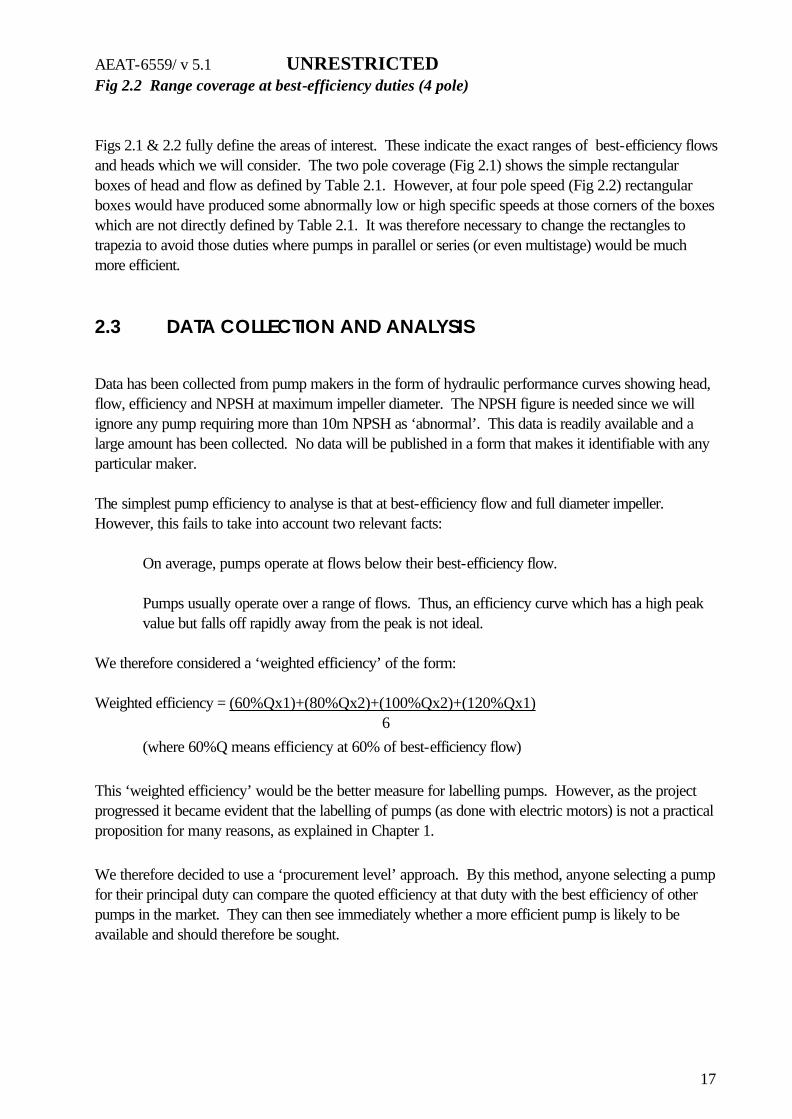
Fig 2.2 Range coverage at best-efficiency duties (4 pole) Figs 2.1 & 2.2 fully define the areas of interest. These indicate the exact ranges of best-efficiency flows and heads which we will consider. The two pole coverage (Fig 2.1) shows the simple rectangular boxes of head and flow as defined by Table 2.1. However, at four pole speed (Fig 2.2) rectangular boxes would have produced some abnormally low or high specific speeds at those corners of the boxes which are not directly defined by Table 2.1. It was therefore necessary to change the rectangles to trapezia to avoid those duties where pumps in parallel or series (or even multistage) would be much more efficient. 2.3 DATA COLLECTION AND ANALYSIS
Data has been collected from pump makers in the form of hydraulic performance curves showing head, flow, efficiency and NPSH at maximum impeller diameter. The NPSH figure is needed since we will ignore any pump requiring more than 10m NPSH as ‘abnormal’. This data is readily available and a large amount has been collected. No data will be published in a form that makes it identifiable with any particular maker. The simplest pump efficiency to analyse is that at best-efficiency flow and full diameter impeller. However, this fails to take into account two relevant facts:
On average, pumps operate at flows below their best-efficiency flow.
Pumps usually operate over a range of flows. Thus, an efficiency curve which has a high peak value but falls off rapidly away from the peak is not ideal.
We therefore considered a ‘weighted efficiency’ of the form: Weighted efficiency = (60%Qx1)+(80%Qx2)+(100%Qx2)+(120%Qx1) 6 (where 60%Q means efficiency at 60% of best-efficiency flow) This ‘weighted efficiency’ would be the better measure for labelling pumps. However, as the project progressed it became evident that the labelling of pumps (as done with electric motors) is not a practical proposition for many reasons, as explained in Chapter 1. We therefore decided to use a ‘procurement level’ approach. By this method, anyone selecting a pump for their principal duty can compare the quoted efficiency at that duty with the best efficiency of other pumps in the market. They can then see immediately whether a more efficient pump is likely to be available and should therefore be sought.
AEAT-6559/ v 5.1 UNRESTRICTED
18
It is clear that the ‘procurement level’ scheme cannot use a weighted efficiency and must show best efficiencies only. This is simply because the person selecting the pump will normally be concentrating on their primary duty point and will not be interested in calculating a weighted efficiency from the above formula. This is particularly the case since, in most instances, the formula is unlikely to match their specific application. In other words, it would not be possible to compare like with like. 2.4 PROCEDURE FOR ANALYSIS
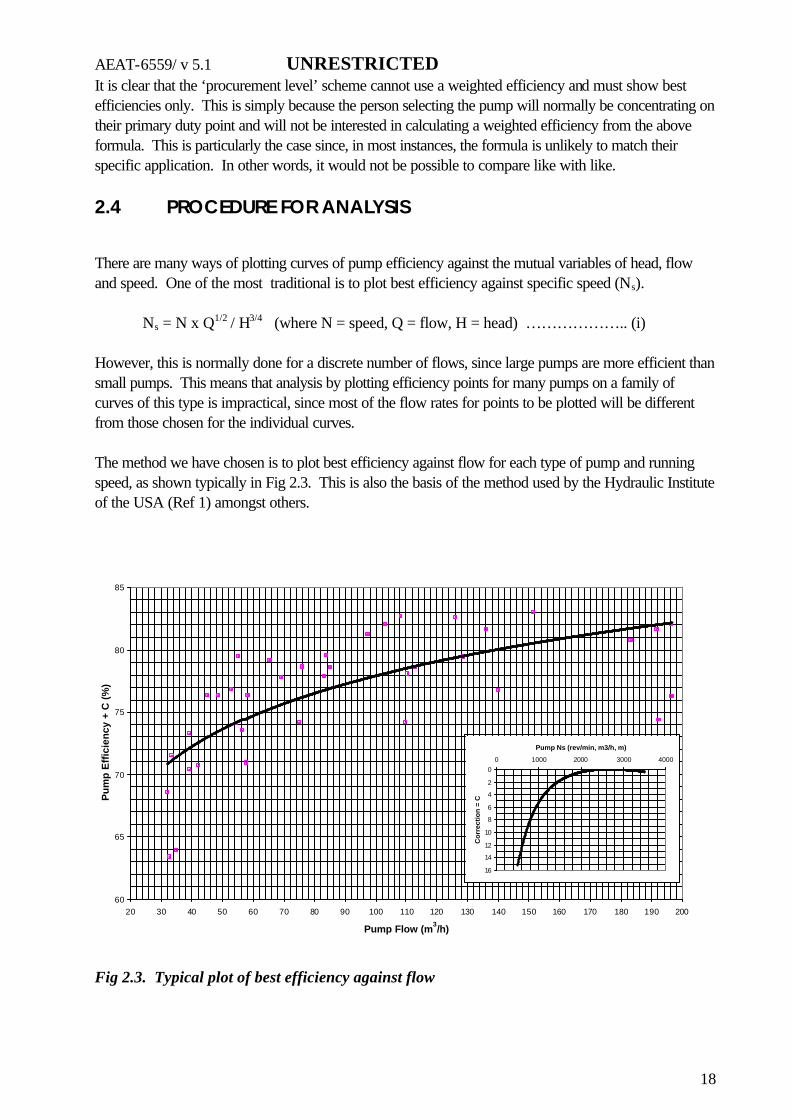
There are many ways of plotting curves of pump efficiency against the mutual variables of head, flow and speed. One of the most traditional is to plot best efficiency against specific speed (Ns).
Ns = N x Q1/2 / H3/4 (where N = speed, Q = flow, H = head) ……………….. (i) However, this is normally done for a discrete number of flows, since large pumps are more efficient than small pumps. This means that analysis by plotting efficiency points for many pumps on a family of curves of this type is impractical, since most of the flow rates for points to be plotted will be different from those chosen for the individual curves. The method we have chosen is to plot best efficiency against flow for each type of pump and running speed, as shown typically in Fig 2.3. This is also the basis of the method used by the Hydraulic Institute of the USA (Ref 1) amongst others.
Fig 2.3. Typical plot of best efficiency against flow
(For illustration only, not to be used for selection) Note that in this chapter, specific speed is calculated using the following units:
Speed - rev/min
Flow - m3/h Head – m 2.5 EFFECT OF SPECIFIC SPEED
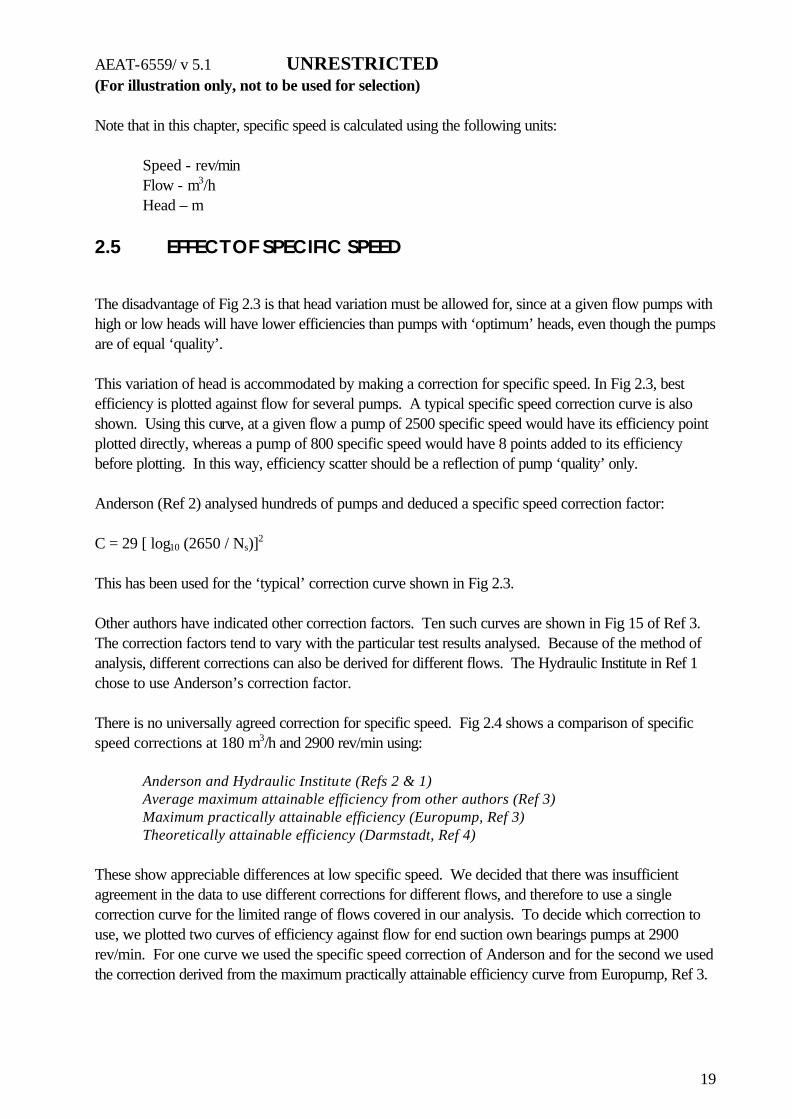
The disadvantage of Fig 2.3 is that head variation must be allowed for, since at a given flow pumps with high or low heads will have lower efficiencies than pumps with ‘optimum’ heads, even though the pumps are of equal ‘quality’. This variation of head is accommodated by making a correction for specific speed. In Fig 2.3, best efficiency is plotted against flow for several pumps. A typical specific speed correction curve is also shown. Using this curve, at a given flow a pump of 2500 specific speed would have its efficiency point plotted directly, whereas a pump of 800 specific speed would have 8 points added to its efficiency before plotting. In this way, efficiency scatter should be a reflection of pump ‘quality’ only. Anderson (Ref 2) analysed hundreds of pumps and deduced a specific speed correction factor: C = 29 [ log10 (2650 / Ns)]2 This has been used for the ‘typical’ correction curve shown in Fig 2.3. Other authors have indicated other correction factors. Ten such curves are shown in Fig 15 of Ref 3. The correction factors tend to vary with the particular test results analysed. Because of the method of analysis, different corrections can also be derived for different flows. The Hydraulic Institute in Ref 1 chose to use Anderson’s correction factor. There is no universally agreed correction for specific speed. Fig 2.4 shows a comparison of specific speed corrections at 180 m3/h and 2900 rev/min using: Anderson and Hydraulic Institute (Refs 2 & 1) Average maximum attainable efficiency from other authors (Ref 3) Maximum practically attainable efficiency (Europump, Ref 3) Theoretically attainable efficiency (Darmstadt, Ref 4) These show appreciable differences at low specific speed. We decided that there was insufficient agreement in the data to use different corrections for different flows, and therefore to use a single correction curve for the limited range of flows covered in our analysis. To decide which correction to use, we plotted two curves of efficiency against flow for end suction own bearings pumps at 2900 rev/min. For one curve we used the specific speed correction of Anderson and for the second we used the correction derived from the maximum practically attainable efficiency curve from Europump, Ref 3.
AEAT-6559/ v 5.1 UNRESTRICTED
20
By identifying the points of low specific speed (high correction factor) it was evident that the correction curve giving the minimum scatter of pump efficiency would be an intermediate curve. By trial and error we arrived at this ‘optimum’ correction curve, which has also been plotted on Fig 2.4, designated ‘Chosen for SAVE’. The formula for this ‘optimum’ correction factor is:
C = 48 [ log10 (2650 / Ns)]2 ………………………………… (ii) There is no strict theoretical justification for this approach but we believe that it serves our purposes satisfactorily. It is possible that more detailed research may suggest varying correction factors for different types of pumps.
Fig 2.4. Specific speed corrections at 180 m3/h and 2900 rev/min
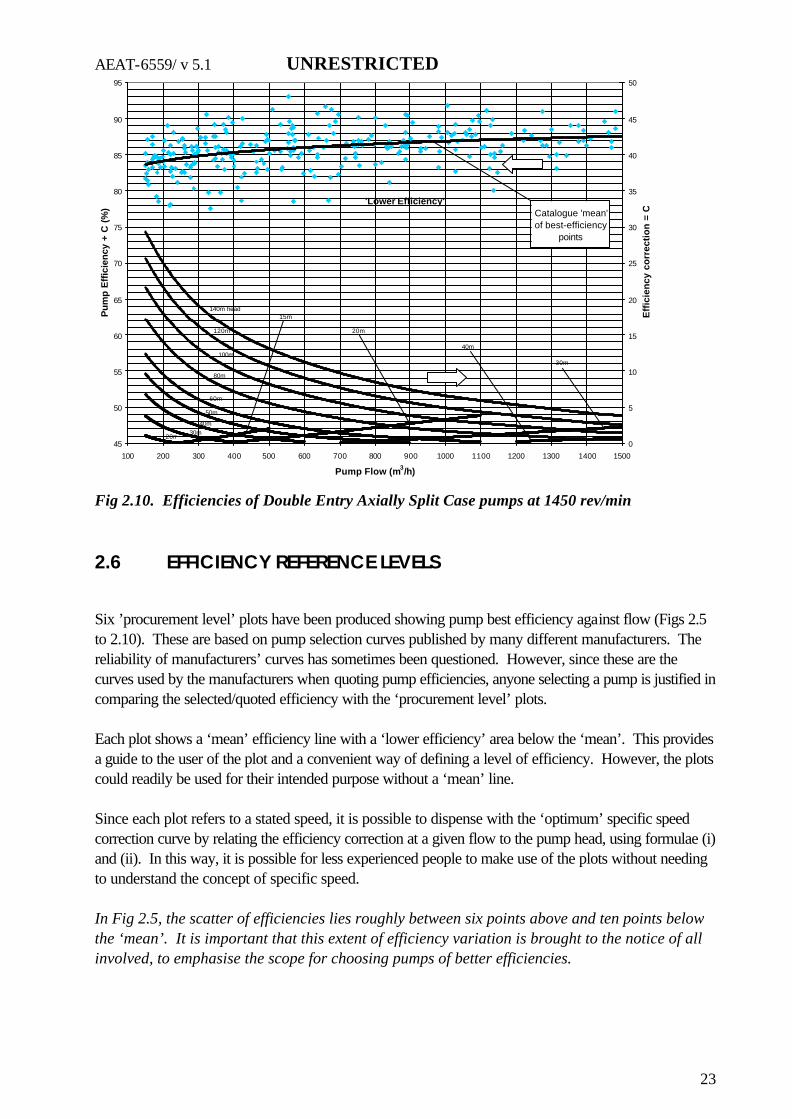
Fig 2.10. Efficiencies of Double Entry Axially Split Case pumps at 1450 rev/min 2.6 EFFICIENCY REFERENCE LEVELS
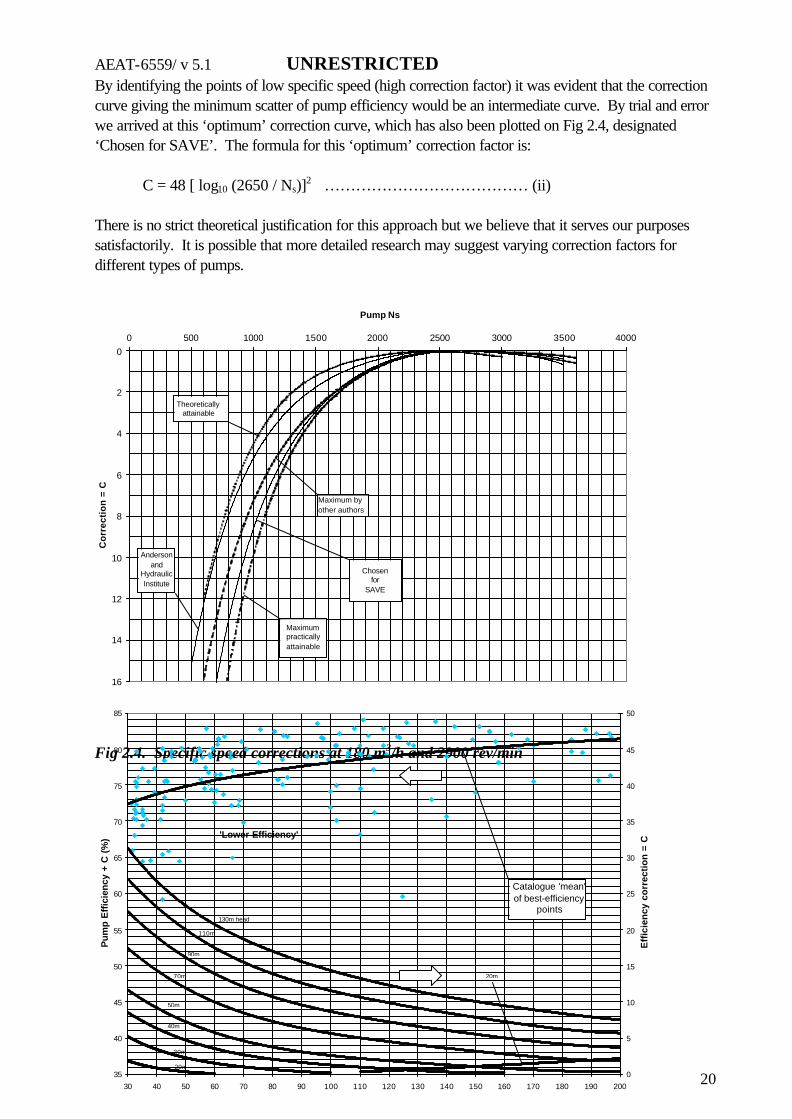
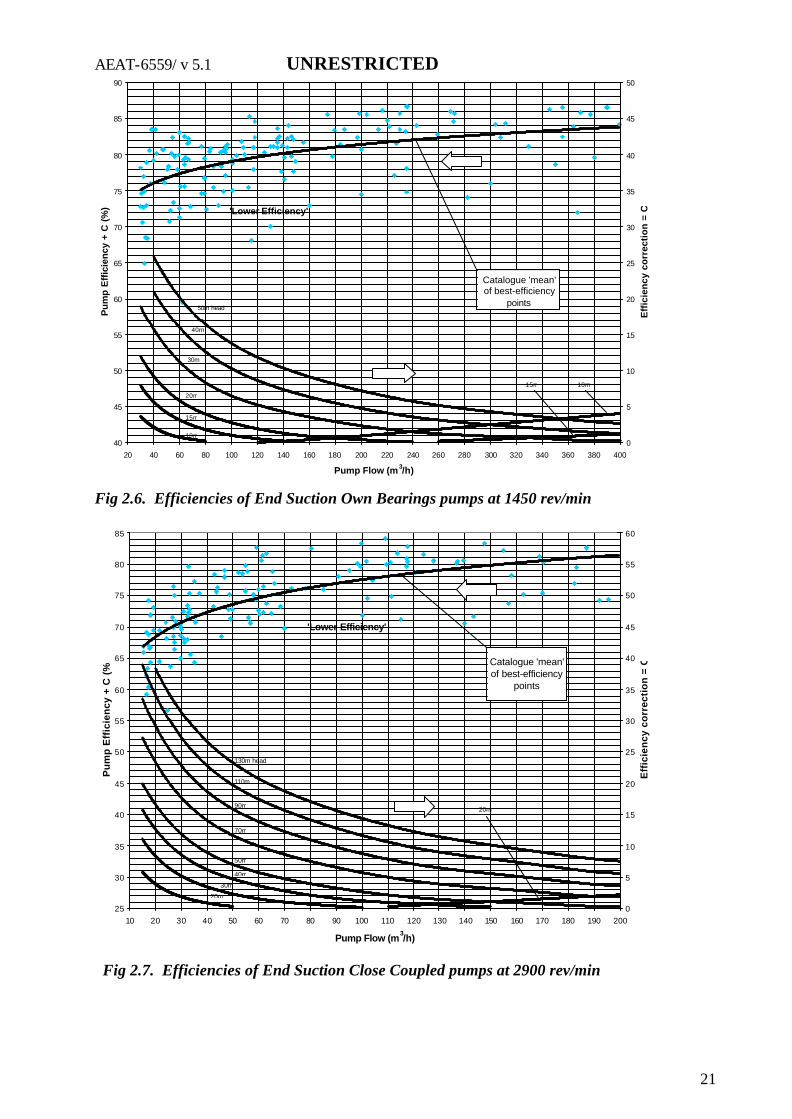
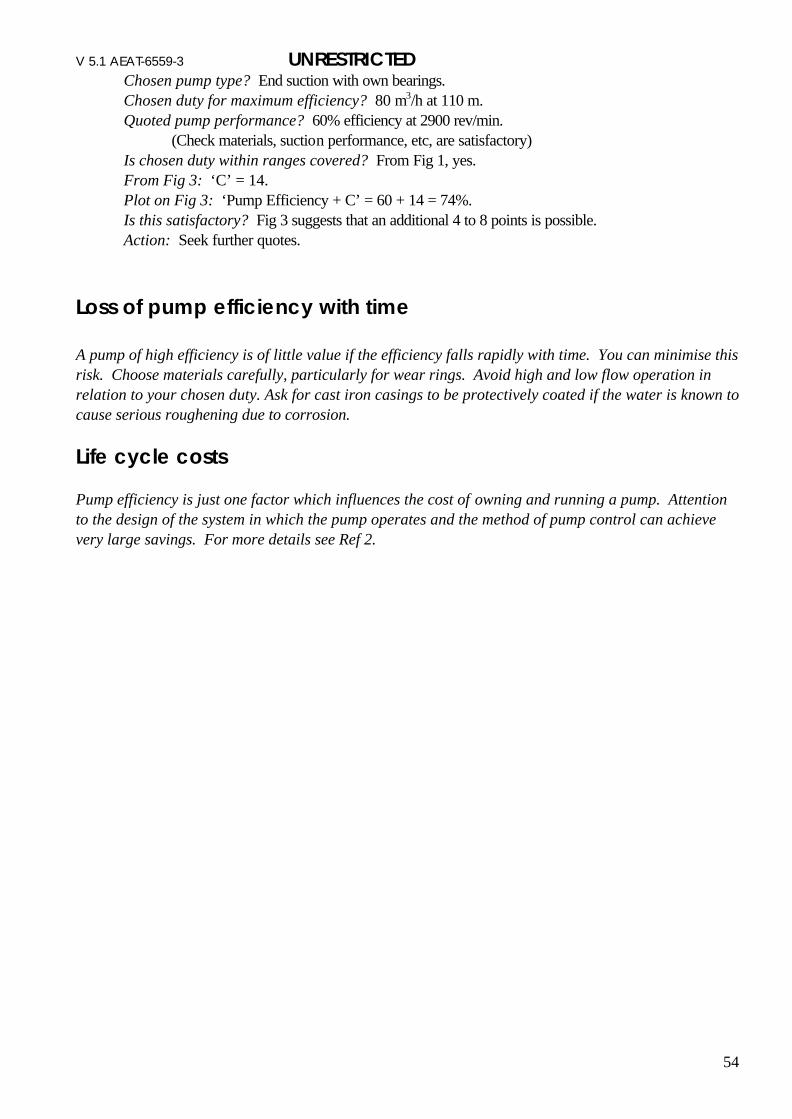
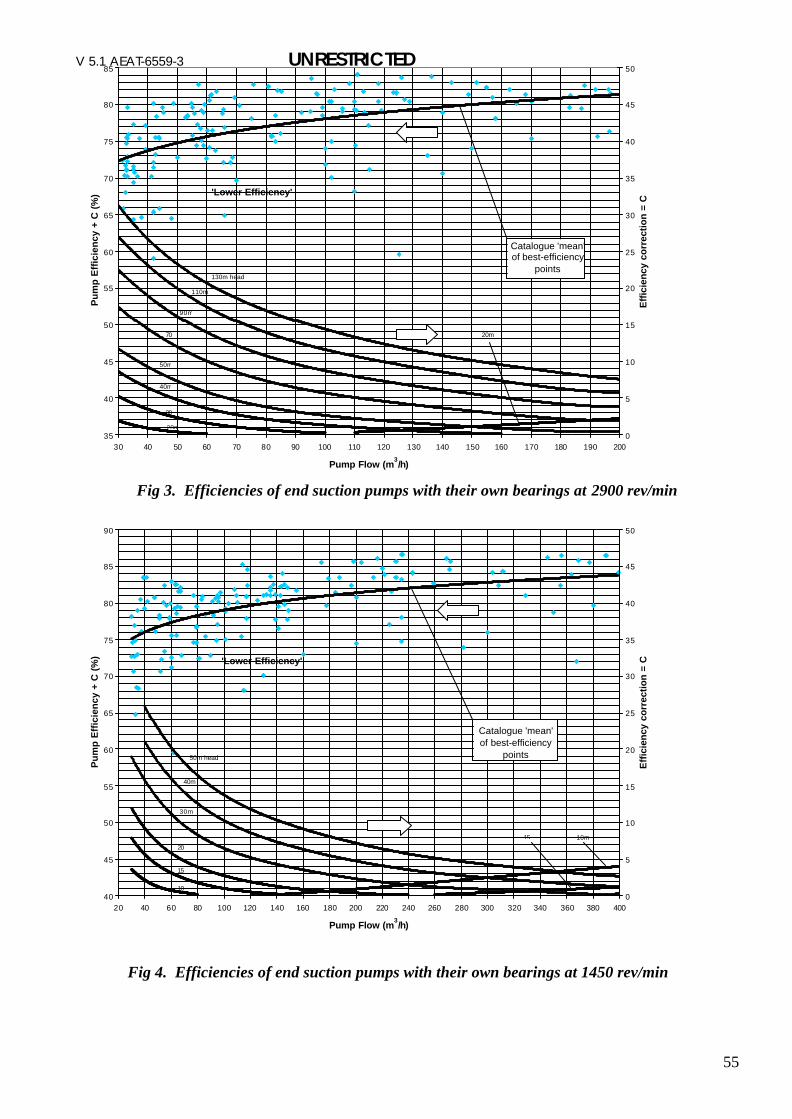
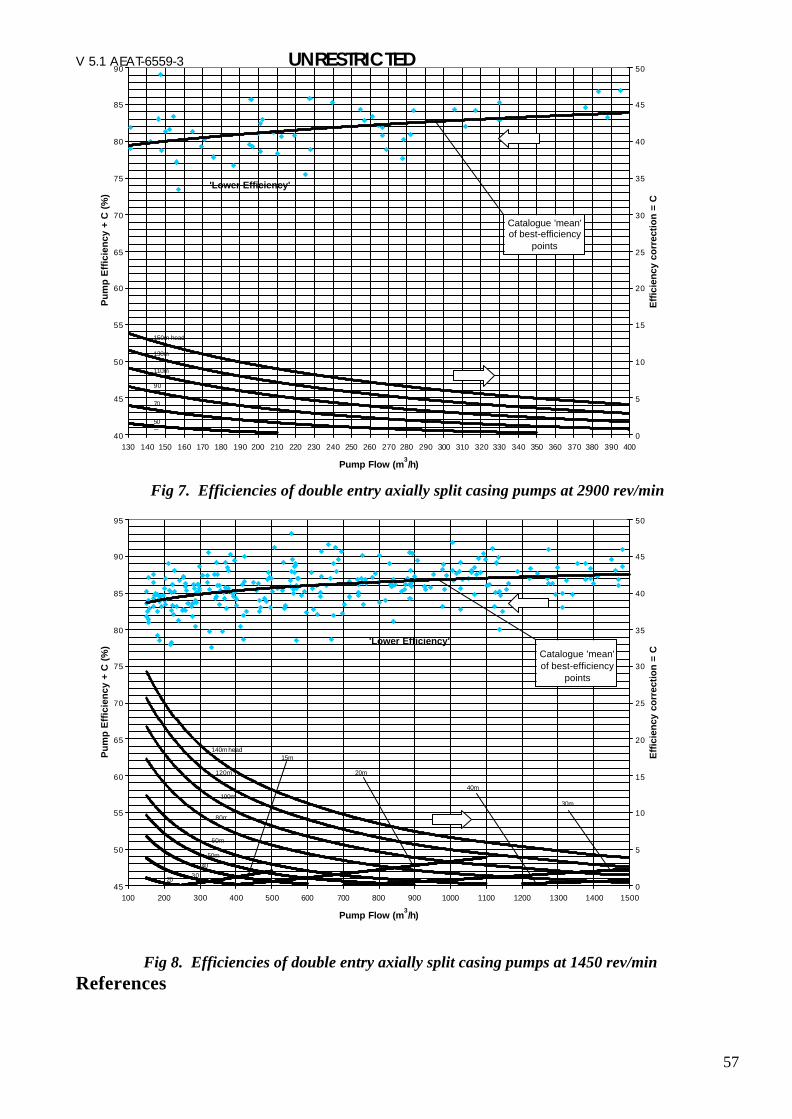
Six ’procurement level’ plots have been produced showing pump best efficiency against flow (Figs 2.5 to 2.10). These are based on pump selection curves published by many different manufacturers. The reliability of manufacturers’ curves has sometimes been questioned. However, since these are the curves used by the manufacturers when quoting pump efficiencies, anyone selecting a pump is justified in comparing the selected/quoted efficiency with the ‘procurement level’ plots. Each plot shows a ‘mean’ efficiency line with a ‘lower efficiency’ area below the ‘mean’. This provides a guide to the user of the plot and a convenient way of defining a level of efficiency. However, the plots could readily be used for their intended purpose without a ‘mean’ line. Since each plot refers to a stated speed, it is possible to dispense with the ‘optimum’ specific speed correction curve by relating the efficiency correction at a given flow to the pump head, using formulae (i) and (ii). In this way, it is possible for less experienced people to make use of the plots without needing to understand the concept of specific speed. In Fig 2.5, the scatter of efficiencies lies roughly between six points above and ten points below the ‘mean’. It is important that this extent of efficiency variation is brought to the notice of all involved, to emphasise the scope for choosing pumps of better efficiencies.
'Lower Efficiency'Catalogue 'mean' of best-efficiency
points
AEAT-6559/ v 5.1 UNRESTRICTED
24
For guidance on using Figs 2.5 to 2.10 see Appendix 1.
Fig 2.11. Comparison of best-efficiency levels from different sources Fig 2.11 provides best-efficiency comparisons between the ‘Catalogue ‘mean’’ from Fig 2.5, ‘Maximum practically attainable’ (Ref 3), ‘Theoretically attainable’ (Ref 4), ‘Hydraulic Institute’ (Ref 1) and ‘Anderson’ (Ref 2). All the curves relate to optimum specific speed. They show reasonable agreement in curve shape except that the ‘Theoretically attainable’ curve shows a relatively high efficiency at low flows. This relative increase in efficiency would clearly involve a high additional cost which may be hard to justify in a small pump. 2.7 EFFICIENCY DETERIORATION IN USE
There is little point in encouraging the use of higher efficiency pumps if their efficiencies fall off rapidly in service. A small pump on clean water supply duty has been known to lose over 20% of its new efficiency in less than two years of operation (Ref 5). Although this is an extreme case, it has been shown that larger clean water pumps can lose, on average, around 5% of their new efficiency in the first five years of operation (Ref 6).
Part of this loss in efficiency is due to wear at the impeller/casing wear rings (see section 5.5 for more details on this). The rate of wear will tend to be much greater in pumps which operate at flows away from the best-efficiency flow due to increased shaft deflection. Most of the loss in efficiency will normally be due to a build-up of corrosion products in cast iron casings. This occurs with practically all pumps working with clean cool water. The rate of corrosion is affected by the catalytic effects of bacteria which are usually present even in treated drinking water. Methods of maintaining pump efficiencies at high levels are covered in Chapter 6. 2.8 REFERENCES
1. ‘Efficiency prediction method for centrifugal pumps’, Hydraulic Institute, 1994. 2. Anderson, H.H., ‘Centrifugal pumps and allied machinery’, Elsevier Advanced Technology,
1994. 3. ‘Attainable efficiencies of volute casing pumps’, Europump Guide No. 2, 1999. 4. Stoffel, B. and Lauer, J., Summary of the final report on the research project for VDMA
‘Theoretically attainable efficiency of centrifugal pumps’, Technical University of Darmstadt, 1994.
5. Reeves, D.T., ‘Deterioration of a centrifugal pump in service’, Allen Engineering Review,
November 1960. 6. Fleming, J., ‘Identification and implementation of effective pumping system energy cost savings’,
Pumping Cost Savings in the Water Supply Industry Seminar, IMechE, May 1989.
AEAT-6559/ v 5.1 UNRESTRICTED
26
3. Characterisation of Pump Use in the EC
3.1 INTRODUCTION
This chapter considers current and future pump use within the EU. The purpose is to give agreed “best estimates” of current energy consumption and potential for energy savings. Against this the cost-effectiveness of future energy saving policy options can be measured. There are four main sub-sections in this section, including: • Centrifugal pump use • EU pump stock based on motor energy consumption • Energy consumption based on annual sales figures • Potential savings in future pump energy use 3.2 CENTRIFUGAL PUMP USE
The centrifugal pumps considered in this section of the report constitute just part of the total centrifugal pump market, and include; • End suction close coupled centrifugal pumps • End suction own bearing centrifugal pumps • Double entry split case centrifugal pumps Two main sources of data were used to characterise the EU energy consumption of pumps; • Pump stock based on motor energy consumption, using data from SAVE II study1 on EU motor
energy consumption. This study is based on a comprehensive study of motor energy use in European industry, and so gives a very good estimate of overall pump energy consumption.
• Annual Sales Figures, using EU pump production/sales data1. This data gives a much more detailed breakdown of pump use , by type, by county.
3.3 METHOD 1 - EU PUMP STOCK BASED ON MOTOR ENERGY
CONSUMPTION
The total electricity consumption for motors is estimated to be 797 TWh (SAVE II)1 in the whole of the EU. This is based on the assumption that motors account for 69% of the total electricity consumption of Industry and 38% of total electricity consumption in the tertiary sector. Figure (3.1) shows the split of total motor energy consumption, showing that pumps consume approximately 20% of total motor energy consumption2, equivalent to 160 TWh pa. 1 SAVE II, Improving the penetration of energy-efficient motors and drives, 2000. 1 Data presented by national associations, public statistical offices and supplied to the study group by europump. 2 This is based on 1996 data presented in the SAVE II1 report.
AEAT-6559/ v 5.1 UNRESTRICTED
27
Pumps20%
Fans18%
Air compressors17%
Cool Compressors11%
Conveyors4%
Other30%
Figure (3.1) – Split of motor energy consumption, by application. 3.4 METHOD 2 – ENERGY CONSUMPTION BASED ON ANNUAL
SALES FIGURES
This data was supplied to the study group by Europump and was derived from data presented by the national associations, public statistical offices and EUROSTAT. It includes 1998 figures for EU pump production, imports and exports, allowing the total purchase value by country to be calculated. This data was then used to derive an approximate annual energy use of these pumps, using the following methodology. (The table detailing these calculations is included as Appendix 2.)
-5,000
-
5,000
10,000
15,000
20,000
25,000
30,000
35,000
40,000
45,000
Country
Ave
rag
e A
nn
ual
En
erg
y U
sag
e (G
Wh
pa)
End Suction CloseCoupled (GWhpa)
End Suction OwnBearing (GWhpa)
Double Entry SplitCase (GWhpa)*
End Suction Close Coupled (GWhpa) 6,000 15,700 16,100 7,200 700 500 14,000 4,000 1,600 7,000
End Suction Own Bearing (GWhpa) 38,200 7,600 23,100 2,800 7,600 2,400 27,500 2,500 3,600 10,900
Figure (3.2)*–Average annual energy usage of the three centrifugal pump types considered, by country
* The negative values shown in this figure are as shown in the statistics, although it is unclear what this indicates.
AEAT-6559/ v 5.1 UNRESTRICTED
28
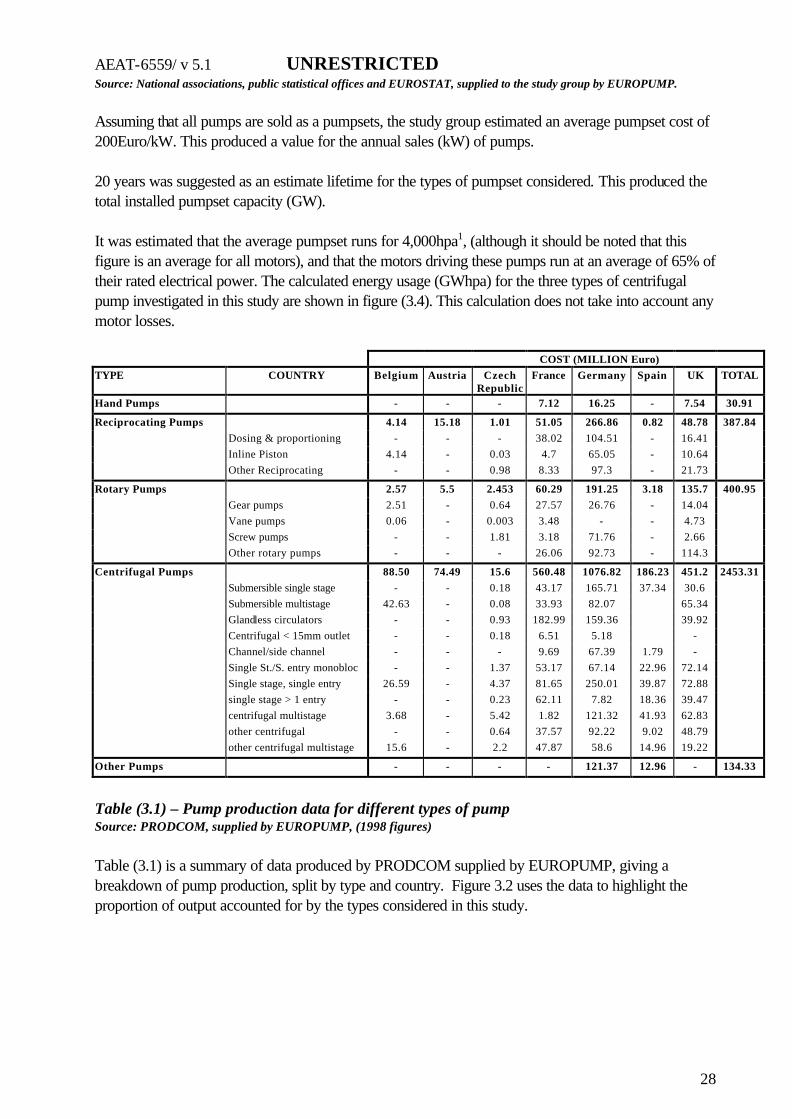
Source: National associations, public statistical offices and EUROSTAT, supplied to the study group by EUROPUMP. Assuming that all pumps are sold as a pumpsets, the study group estimated an average pumpset cost of 200Euro/kW. This produced a value for the annual sales (kW) of pumps. 20 years was suggested as an estimate lifetime for the types of pumpset considered. This produced the total installed pumpset capacity (GW). It was estimated that the average pumpset runs for 4,000hpa1, (although it should be noted that this figure is an average for all motors), and that the motors driving these pumps run at an average of 65% of their rated electrical power. The calculated energy usage (GWhpa) for the three types of centrifugal pump investigated in this study are shown in figure (3.4). This calculation does not take into account any motor losses.
COST (MILLION Euro) TYPE COUNTRY Belgium Austria Czech
Table (3.1) – Pump production data for different types of pump Source: PRODCOM, supplied by EUROPUMP, (1998 figures)
Table (3.1) is a summary of data produced by PRODCOM supplied by EUROPUMP, giving a breakdown of pump production, split by type and country. Figure 3.2 uses the data to highlight the proportion of output accounted for by the types considered in this study.
AEAT-6559/ v 5.1 UNRESTRICTED
29
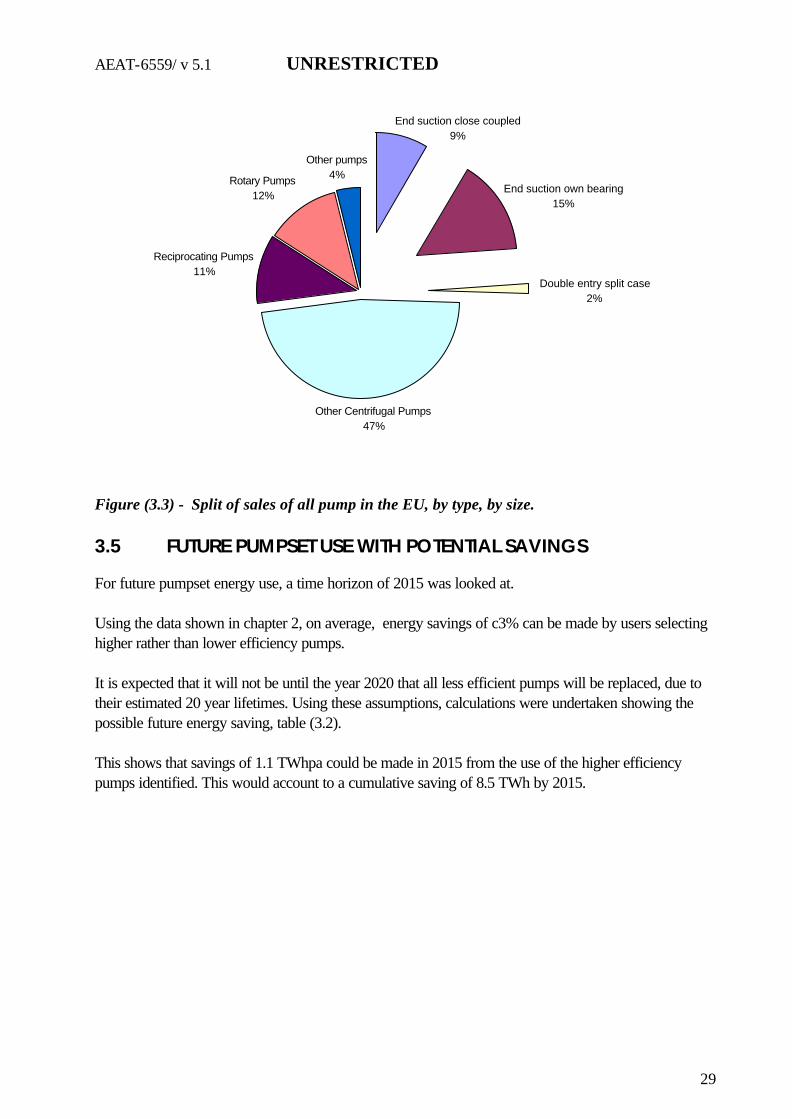
Figure (3.3) - Split of sales of all pump in the EU, by type, by size. 3.5 FUTURE PUMPSET USE WITH POTENTIAL SAVINGS
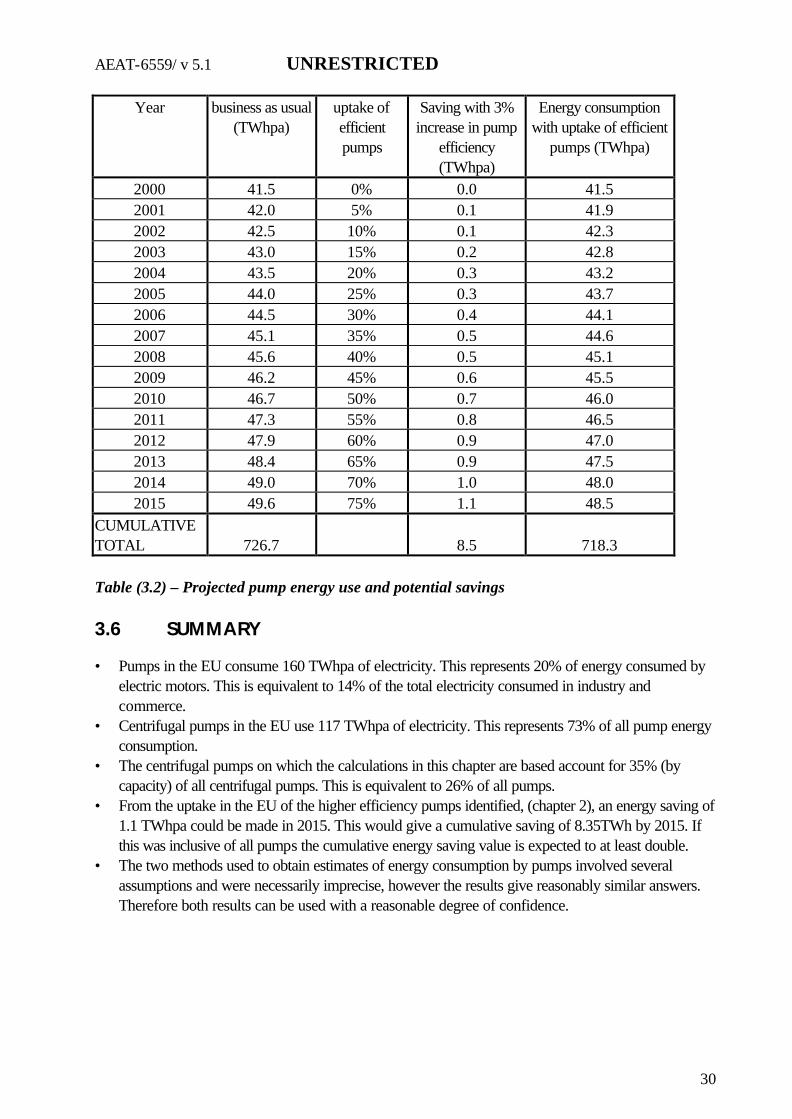
For future pumpset energy use, a time horizon of 2015 was looked at. Using the data shown in chapter 2, on average, energy savings of c3% can be made by users selecting higher rather than lower efficiency pumps. It is expected that it will not be until the year 2020 that all less efficient pumps will be replaced, due to their estimated 20 year lifetimes. Using these assumptions, calculations were undertaken showing the possible future energy saving, table (3.2). This shows that savings of 1.1 TWhpa could be made in 2015 from the use of the higher efficiency pumps identified. This would account to a cumulative saving of 8.5 TWh by 2015.
Table (3.2) – Projected pump energy use and potential savings 3.6 SUMMARY
• Pumps in the EU consume 160 TWhpa of electricity. This represents 20% of energy consumed by electric motors. This is equivalent to 14% of the total electricity consumed in industry and commerce.
• Centrifugal pumps in the EU use 117 TWhpa of electricity. This represents 73% of all pump energy consumption.
• The centrifugal pumps on which the calculations in this chapter are based account for 35% (by capacity) of all centrifugal pumps. This is equivalent to 26% of all pumps.
• From the uptake in the EU of the higher efficiency pumps identified, (chapter 2), an energy saving of 1.1 TWhpa could be made in 2015. This would give a cumulative saving of 8.35TWh by 2015. If this was inclusive of all pumps the cumulative energy saving value is expected to at least double.
• The two methods used to obtain estimates of energy consumption by pumps involved several assumptions and were necessarily imprecise, however the results give reasonably similar answers. Therefore both results can be used with a reasonable degree of confidence.
AEAT-6559/ v 5.1 UNRESTRICTED
31
4. User Attitudes to Pump Selection and Ways in Which They Can Be Changed
4.1 ENERGY EFFICIENCY IS NOT A PRIORITY
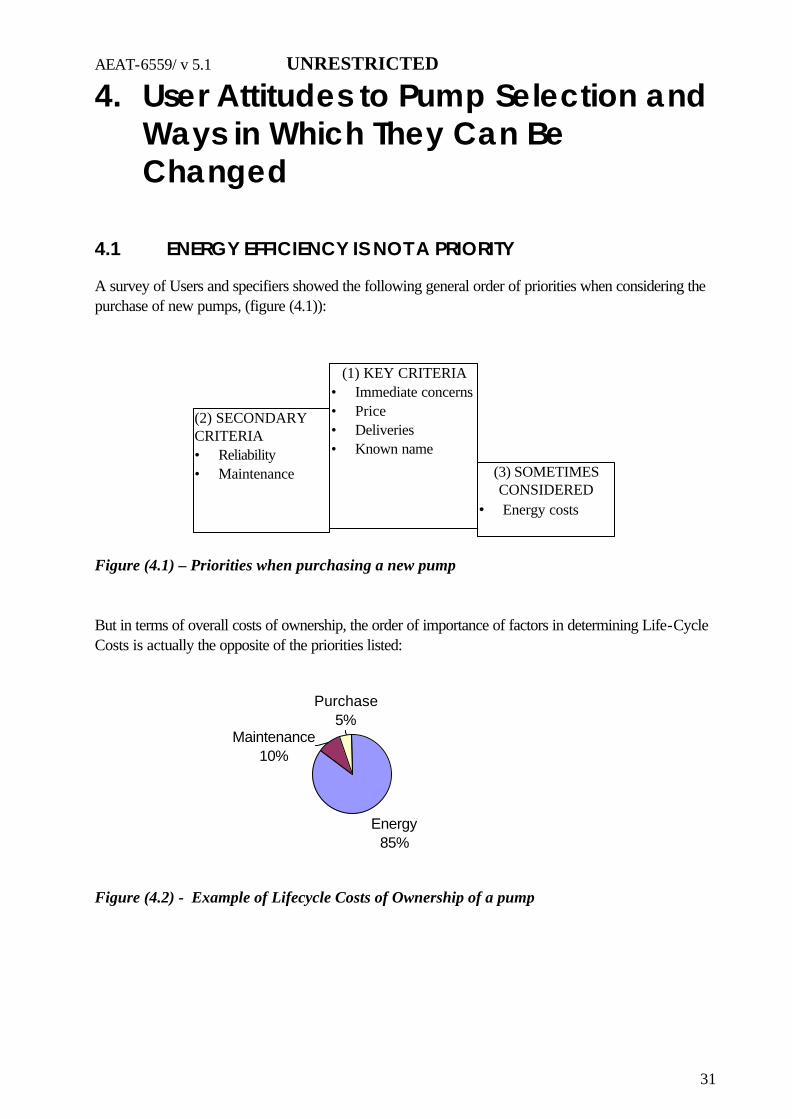
A survey of Users and specifiers showed the following general order of priorities when considering the purchase of new pumps, (figure (4.1)): Figure (4.1) – Priorities when purchasing a new pump But in terms of overall costs of ownership, the order of importance of factors in determining Life-Cycle Costs is actually the opposite of the priorities listed:
Figure (4.2) - Example of Lifecycle Costs of Ownership of a pump
(1) KEY CRITERIA • Immediate concerns • Price • Deliveries • Known name
(3) SOMETIMES CONSIDERED
• Energy costs
Energy85%
Purchase5%
Maintenance10%
AEAT-6559/ v 5.1 UNRESTRICTED
32
4.2 BARRIERS TO IMPROVING THE EFFICIENCY OF PUMPS
There are lots of barriers to the reduction in energy consumption of pumps, here divided loosely into three categories. Contrary to initial impressions, often it is the organisational and educational factors that are the main barrier to improved efficiency, rather than technical or economic factors. 4.2.1 Organisational Behaviour • Many pumps are sold to intermediaries such as Distributors and OEM suppliers, who are
driven by customers to supply at lowest cost. • Within pump users’ organisations, the department responsible for buying the pump is
different from that paying the running costs. • De-manning means that there is less effort available for energy saving considerations. This is
compounded on many sites by a low level of skills. • There is often little visibility of the costs of pumping. • Fast turnaround on the repair of pumps means that often non-specialists undertake repairs in a poor
way. 4.2.2 Technical/Educational • There are trade-offs between efficiency and maintenance effort /safety requirements. • Uncertainty over system characteristics, and allowances for future plant expansion,
frequently mean that pumps are considerably over-sized for the duty. • Promoting improved efficiency of pumps should not be divorced from system efficiency
considerations. • Pumps are often poorly maintained, and are not given attention until they start to cause
problems or stop working altogether. • There is considerable difficulty in measuring even the most basic of parameters, for instance flow. • Inability to correctly choose pumps. • Scepticism over manufacturers efficiency data. • Pumps with low duty (ie low running hours and/or low load) are unlikely to justify the greater costs
of being more efficient. • It is easier to replace a pump with the same type as before rather than re-assessing the requirement. • Misapplication can quickly de-grade the efficiency of a “good” pump. 4.2.3 Economic • For most users, energy saving is treated as if it is less important than either first cost, ease of
maintenance or reliability. • Payback on a more energy efficient solution is not adequate.
AEAT-6559/ v 5.1 UNRESTRICTED
33
• Large sites may either buy or generate low cost electricity which makes payback times unattractive. • Total energy costs as a proportion of total costs may be too low to warrant any significant effort. • Any energy savings made can be difficult to assess. • Acceptance tests to verify performance are only economic on larger pumps. • Lack of capital for purchasing new or more expensive pumps. 4.3 EDUCATIONAL NEEDS
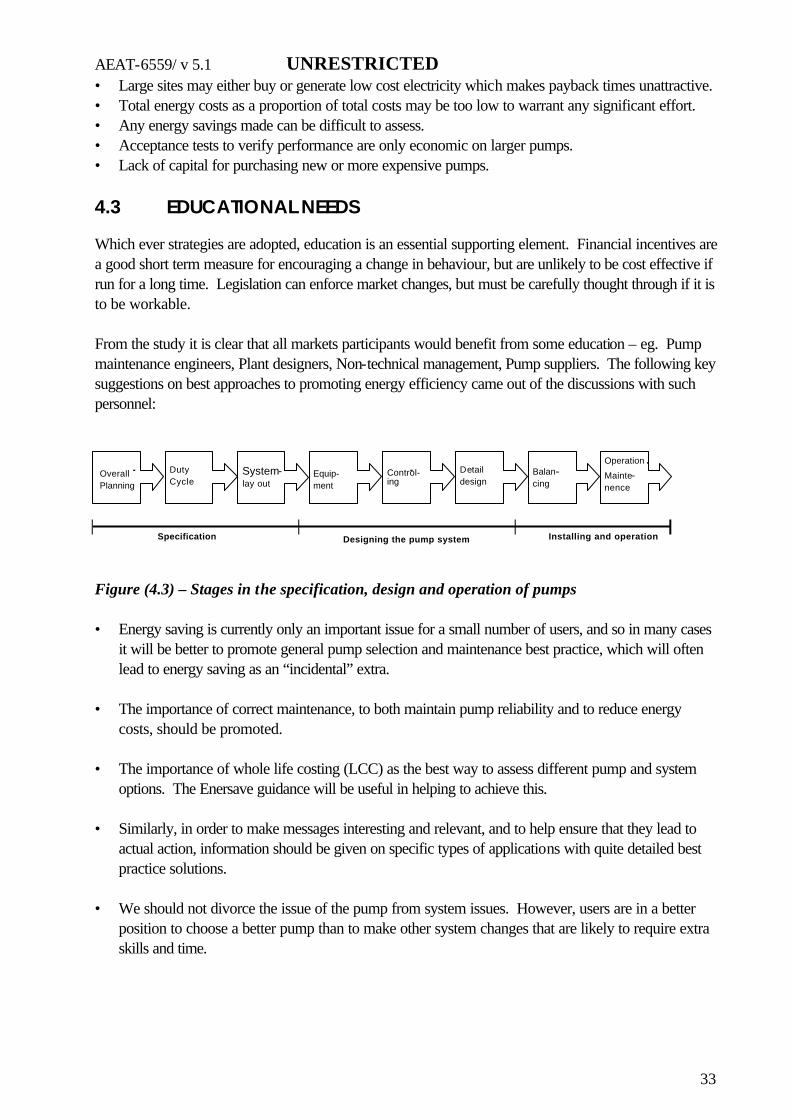
Which ever strategies are adopted, education is an essential supporting element. Financial incentives are a good short term measure for encouraging a change in behaviour, but are unlikely to be cost effective if run for a long time. Legislation can enforce market changes, but must be carefully thought through if it is to be workable. From the study it is clear that all markets participants would benefit from some education – eg. Pump maintenance engineers, Plant designers, Non-technical management, Pump suppliers. The following key suggestions on best approaches to promoting energy efficiency came out of the discussions with such personnel:
Figure (4.3) – Stages in the specification, design and operation of pumps • Energy saving is currently only an important issue for a small number of users, and so in many cases
it will be better to promote general pump selection and maintenance best practice, which will often lead to energy saving as an “incidental” extra.
• The importance of correct maintenance, to both maintain pump reliability and to reduce energy
costs, should be promoted. • The importance of whole life costing (LCC) as the best way to assess different pump and system
options. The Enersave guidance will be useful in helping to achieve this. • Similarly, in order to make messages interesting and relevant, and to help ensure that they lead to
actual action, information should be given on specific types of applications with quite detailed best practice solutions.
• We should not divorce the issue of the pump from system issues. However, users are in a better
position to choose a better pump than to make other system changes that are likely to require extra skills and time.
Mainte- nence
- Overall Planning
Duty Cycle
System- lay out
Equip- ment
Control- - ing
Detail design
Balan- cing
Operation .
Specification Installing and operation Designing the pump system
AEAT-6559/ v 5.1 UNRESTRICTED
34
During the study the group reviewed many examples from the wide range of materials available, including the following: • Literature – Guides, case studies. • Training courses • Videos • Software Tools Ø pump system modelling software (eg Pump-Flo), Ø pump selection software (eg EURODEEM), Ø pump system efficiency tools (ie US P-SAT).
It was observed that there are actually many useful pump related materials around in existence that deserve a much wider audience, but that attention to selecting the best routes for dissemination is now the “weak link” for ensuring wide readership and hence changes in behaviour. Main dissemination routes include Seminars, energy agency databases, equipment suppliers databases, Articles / Press releases. To further encourage the wider use of these materials, the study group suggests a web-based resource book listing all useful materials available within the EU. 4.3.1 On site advice Free or subsidised on site advice would give sites a quick idea of which pumps, if any, should be looked at in more detail to make energy savings. More detailed advice could also be offered on selected pumping systems with high energy savings potential. 4.3.2 Encouraging third party involvement “Contracting out” part or all of the purchase, installation and maintenance of pumps to a qualified third party can be an excellent way of ensuring better practice in companies without the time or expertise to devote to pumps. This sort of approach naturally encourages a longer time frame when considering different options. Sharing energy and/or cost savings with third parties can really help encourage longer term and more imaginative measures. 4.3.3 Research and Development Several manufacturers commented that there is a need for more funding for R&D into the design of more efficient pumps. However, the study group considers that the potential from encouraging the use of the best pumps already available is much greater than that from designing even more efficient pumps. Accordingly, it is recommended that funds are first devoted to the promotion of best practice in the selection and use of pumps, with further funds for R&D following later. 4.4 WHAT USERS WANT TO HELP THEM IMPROVE THEIR SELECTION
OF PUMPS
AEAT-6559/ v 5.1 UNRESTRICTED
35
Pump users/specifiers were also asked for their thoughts on the usefulness of other possible tools to help their decision making process. Overall, the less well informed the respondent, the simpler the information that they want. Simulation software. Mainly used by specialist consultants. Other respondents thought that they would find it hard to know enough about their system to be able to make good use of this software. Pump selection Database. It was thought that specialists would find this useful, but that less informed users weren’t sure how useful they would find it. A demonstration programme would be useful in order to get better feedback on this. Procurement Level. All users thought that this could be useful, but in particular the less informed users. Again, a short leaflet to better explain this scheme is necessary to get better feedback. Since the better informed users are already aware of the importance of energy efficiency, and will usually take account of it during pump selection, it is the view of the study group that these Users need little further support. Indeed, there is already a well-established commercial market in simulation software, and internet pump procurement organisations, and so there much less need for further Governmental effort in these areas. Instead, effort should be better focussed on supplying tools to improve the behaviour of the less informed users, where there is much more scope for improvement. 4.5 SUMMARY
Despite energy costs in most cases dominating the overall life cycle costs of ownership of a pump, there are a wide range of barriers to energy efficiency being given greater importance when making purchasing decisions. There are accordingly a range of measures that can be applied to help overcome these barriers. Of particular importance is the need for better education on pumping issues, without which any other initiatives will struggle to make a significant and ongoing impact. Simple tools to aid in the selection of pumps, such as the procurement level scheme illustrated in the brochure in Appendix1, will greatly assist the often relatively uneducated user in making a much better decision.
AEAT-6559/ v 5.1 UNRESTRICTED
36
5. Design Factors Affecting Pump Efficiency
5.1 INTRODUCTION
Due to the fact that the majority of the pump manufacturers within the EU have reached a level of know how which enables them to carry out hydraulically correct designed centrifugal pumps, the value of the practically attainable overall pump efficiency η of these machines is mainly influenced by factors such as surface roughness of parts which are in contact with the flow as well as the internal leakage flows through the sealing gaps. Especially the surface roughness of hydraulic parts strongly depends on the manufacturing techniques used. Further on the surface quality is a property which can get worse during life time of a pump and thereby causes energy losses during pump operation. To quantify the effects of these above mentioned factors the following investigations on single-stage centrifugal pumps were carried out at the chair for Turbomachinery and Fluid Power at Darmstadt University of Technology: • The influence of different values of surface roughness • The influence of smoothing several parts of pumps • The influence of different gap clearances on the internal leakage flow rate The specific speeds (as defined in figure 5.2) of the considered pumps covered the range from ns = 10 min-1 up to ns = 100 min-1 (corresponding to values from 520 min-1 up to 5200 min-1 in US-units) and represents the typical field of application of standard centrifugal pumps. By the aid of the similarity laws it is possible to transfer the results obtained for one pump size to another (respectively from one speed of rotation to another). To carry out the investigations a special software tool was used, which was developed within the scope of a former research project named “Attainable Efficiencies of Volute Casing Pumps” sponsored by the Research Fund of the German Pump Manufacturer Association. The main capability of this program is to estimate the maximum theoretically attainable efficiency ηmax,th of volute casing pumps. We explicitly want to point out that this software tool is no CFD code. To determine the friction losses for the parts shown in fig. 1 respectively the leakage flow rates through the sealing gaps the program uses differential equations as well as simplified mathematically loss approaches. All calculations are carried out on the base of a hydraulic design process considering common industrial design standards in respect to the geometrical settings.
AEAT-6559/ v 5.1 UNRESTRICTED
37
- hydraulic losses:
friction losses deceleration losses wake losses mixing losses (Volute)
- volumetric losses (gap flow)
Considered Losses
- mechanical losses
Volute
Diffusor
Inner surfacesof impeller
Outer surfacesof impeller
Bearings & sealing
Sealing gaps
Inlet
Fig. 5.1 Loss-causing components of a centrifugal pump In order to evaluate the efficiency values estimated by the computer program additional experimental investigations were carried out at a centrifugal pump with a specific speed of ns = 12 min-1. This special test pump, designed according to usual industrial standards was equipped with very narrow sealing gaps (radial gap clearance equal to 0.1 mm) as well as hydraulic smooth surfaces. For this optimized pump the value of the inner efficiency ηi was measured at a special high precision test rig and compared to the theoretical value obtained by the computer program. The comparison of both values (for pump operation at the point of best efficiency) results in a very good agreement. 5.2 RESULTS OF THE THEORETICAL INVESTIGATIONS
For the purpose within this SAVE study the above mentioned software tool was partly modified respectively extended in its capabilities. All the following figures which demonstrate the influence of the parameters surface roughness as well as gap clearance show efficiency values η respectively differences of efficiency values ∆η in per cent points that were plotted versus the value of specific speed ns as defined in fig. 5.2 (where n is the speed of rotation, Q the rate of flow and H the pump head).
AEAT-6559/ v 5.1 UNRESTRICTED
38
Specific speed:
In the following:
43
21
Qnns ⋅=
]m[],m
[],[min],[min3
11 Hs
Qnns−−
sunitsUSs nn − 64.51,
50
55
60
65
70
75
80
85
90
10 100 n S
[min -1]
η[%]
Q = 18Q = 36Q = 72Q = 180Q = 360QQ
== 7180020
Flow [m/h]3
Rate of Flow
hmQ
n3
1
180
min1450
=
= −
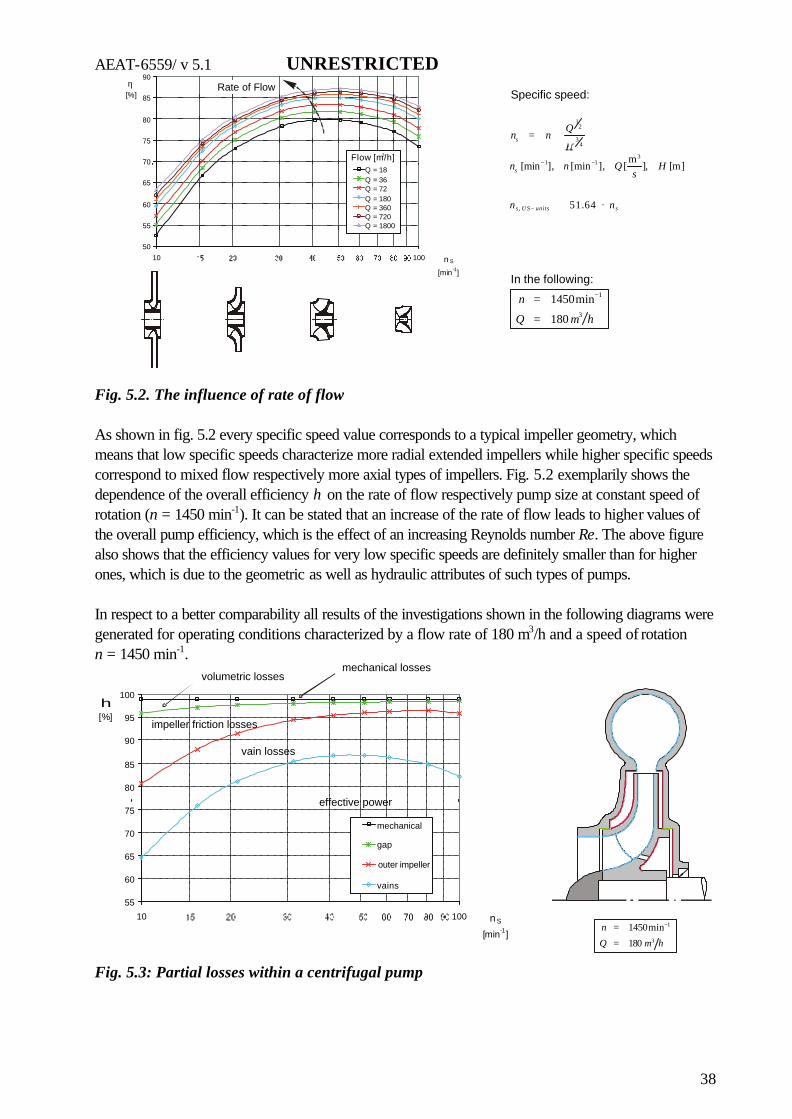
Fig. 5.2. The influence of rate of flow As shown in fig. 5.2 every specific speed value corresponds to a typical impeller geometry, which means that low specific speeds characterize more radial extended impellers while higher specific speeds correspond to mixed flow respectively more axial types of impellers. Fig. 5.2 exemplarily shows the dependence of the overall efficiency η on the rate of flow respectively pump size at constant speed of rotation (n = 1450 min-1). It can be stated that an increase of the rate of flow leads to higher values of the overall pump efficiency, which is the effect of an increasing Reynolds number Re. The above figure also shows that the efficiency values for very low specific speeds are definitely smaller than for higher ones, which is due to the geometric as well as hydraulic attributes of such types of pumps. In respect to a better comparability all results of the investigations shown in the following diagrams were generated for operating conditions characterized by a flow rate of 180 m3/h and a speed of rotation n = 1450 min-1.
55
60
65
70
75
80
85
90
95
100
10 100 n S
[min-1]
h[%]
mechanical
gap
outer impeller
vains
impeller friction losses
effective power
vain losses
volumetric lossesmechanical losses
hmQ
n3
1
180
min1450
=
= −
Fig. 5.3: Partial losses within a centrifugal pump
AEAT-6559/ v 5.1 UNRESTRICTED
39
Depending on the value of specific speed which directly corresponds to the shape of the impeller different influences on the losses caused by several pump components can be mentioned. For pumps with lower specific speeds volumetric losses as well as losses due to disk friction at the back and front shroud of the impeller are very significant. This also applies to the losses within in the volute casing. For higher specific speeds the influence of blade friction losses within the impeller dominates and mainly determines the level of the overall efficiency η. According to former investigations based on statistically evaluated data it is known, that the largest potential regarding an improvement of efficiency does exist at low specific speeds. 5.3 INFLUENCE OF DIFFERENT VALUES OF SURFACE ROUGHNESS
50
55
60
65
70
75
80
85
90
95
10 100 n S
[min-1]
η[%]
all smooth
0.024
0.1
0.2
0.4
mm
mm
mm
mm
Surface roughness kS
Fig. 5.4: The influence of surface roughness Fig. 5.4. demonstrates the general influence of different values of surface roughness whereas all inner surfaces of the pump show identical conditions. It is remarkable that the gain of efficiency due to smoothing the inner surfaces of a centrifugal pump is estimated more than 5 per cent points compared to pumps showing top quality sand-cast-rough surfaces (surface roughness ks ≈ 0.024 mm). Compared to pumps showing a very low surface quality (e.g. due to low quality of manufacturing, corrosion or incrustation which can result in a value for the surface roughness up to ks = 0.4 mm) a theoretical efficiency improvement of even more than 20 per cent points could be estimated for pumps of very low specific speed (ns = 10 min-1).
AEAT-6559/ v 5.1 UNRESTRICTED
40
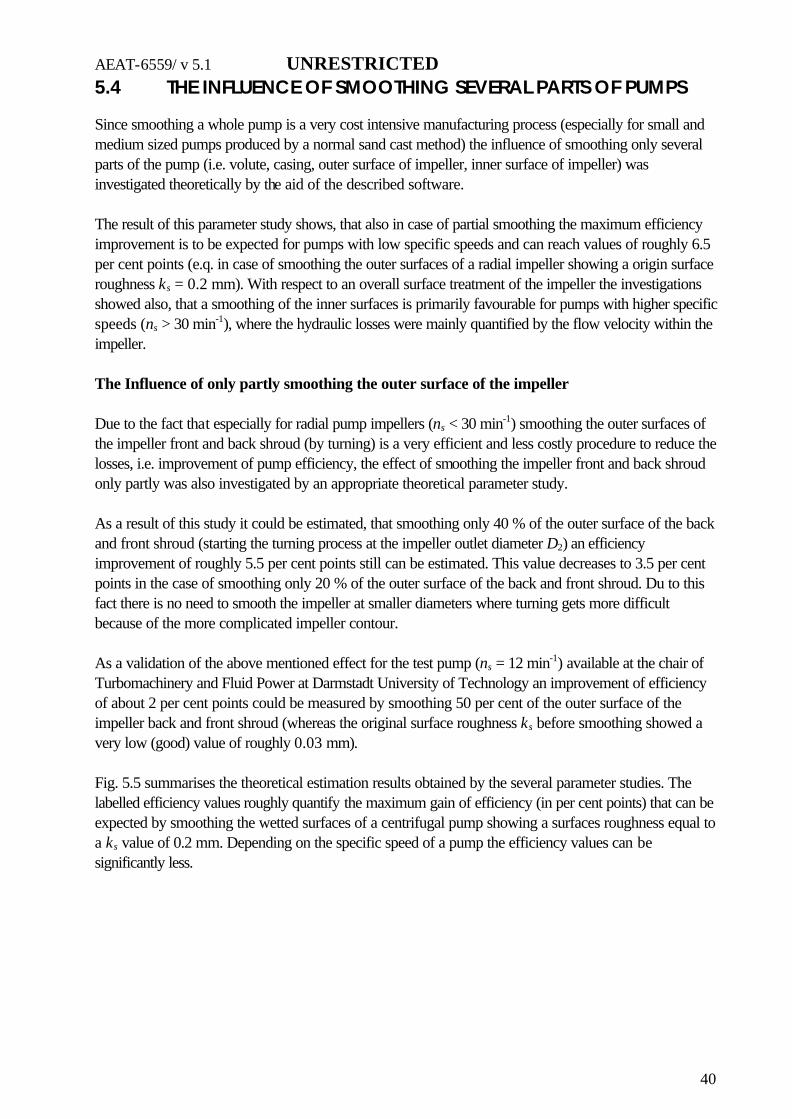
5.4 THE INFLUENCE OF SMOOTHING SEVERAL PARTS OF PUMPS
Since smoothing a whole pump is a very cost intensive manufacturing process (especially for small and medium sized pumps produced by a normal sand cast method) the influence of smoothing only several parts of the pump (i.e. volute, casing, outer surface of impeller, inner surface of impeller) was investigated theoretically by the aid of the described software. The result of this parameter study shows, that also in case of partial smoothing the maximum efficiency improvement is to be expected for pumps with low specific speeds and can reach values of roughly 6.5 per cent points (e.q. in case of smoothing the outer surfaces of a radial impeller showing a origin surface roughness ks = 0.2 mm). With respect to an overall surface treatment of the impeller the investigations showed also, that a smoothing of the inner surfaces is primarily favourable for pumps with higher specific speeds (ns > 30 min-1), where the hydraulic losses were mainly quantified by the flow velocity within the impeller. The Influence of only partly smoothing the outer surface of the impeller Due to the fact that especially for radial pump impellers (ns < 30 min-1) smoothing the outer surfaces of the impeller front and back shroud (by turning) is a very efficient and less costly procedure to reduce the losses, i.e. improvement of pump efficiency, the effect of smoothing the impeller front and back shroud only partly was also investigated by an appropriate theoretical parameter study. As a result of this study it could be estimated, that smoothing only 40 % of the outer surface of the back and front shroud (starting the turning process at the impeller outlet diameter D2) an efficiency improvement of roughly 5.5 per cent points still can be estimated. This value decreases to 3.5 per cent points in the case of smoothing only 20 % of the outer surface of the back and front shroud. Du to this fact there is no need to smooth the impeller at smaller diameters where turning gets more difficult because of the more complicated impeller contour. As a validation of the above mentioned effect for the test pump (ns = 12 min-1) available at the chair of Turbomachinery and Fluid Power at Darmstadt University of Technology an improvement of efficiency of about 2 per cent points could be measured by smoothing 50 per cent of the outer surface of the impeller back and front shroud (whereas the original surface roughness ks before smoothing showed a very low (good) value of roughly 0.03 mm). Fig. 5.5 summarises the theoretical estimation results obtained by the several parameter studies. The labelled efficiency values roughly quantify the maximum gain of efficiency (in per cent points) that can be expected by smoothing the wetted surfaces of a centrifugal pump showing a surfaces roughness equal to a ks value of 0.2 mm. Depending on the specific speed of a pump the efficiency values can be significantly less.
AEAT-6559/ v 5.1 UNRESTRICTED
41
who
le p
ump:
...
< 18
.5%
volu
te:
... <
5%
casi
ng:
... <
4.5
%
inne
r sur
face
: ...
< 5
%ou
ter s
urfa
ce
who
le im
pelle
r
40%
of o
uter
sur
face
: ...
< 5
.5%
100%
of o
uter
sur
face
: ...
< 6
.5%
20%
of o
uter
sur
face
: ...
< 3
.5%
Fig
. 5.5
: M
axim
um im
prov
emen
t of e
ffic
ienc
y fo
r se
vera
l sm
ooth
ing
step
s (e
stim
ated
by
theo
retic
al c
alcu
latio
ns fo
r m
ediu
m s
ize
pum
p of
180
m3 /h
))
AEAT-6559/ v 5.1 UNRESTRICTED
42
5.5 INFLUENCE OF DIFFERENT GAP CLEARANCES ON THE
INTERNAL LEAKAGE FLOW RATE
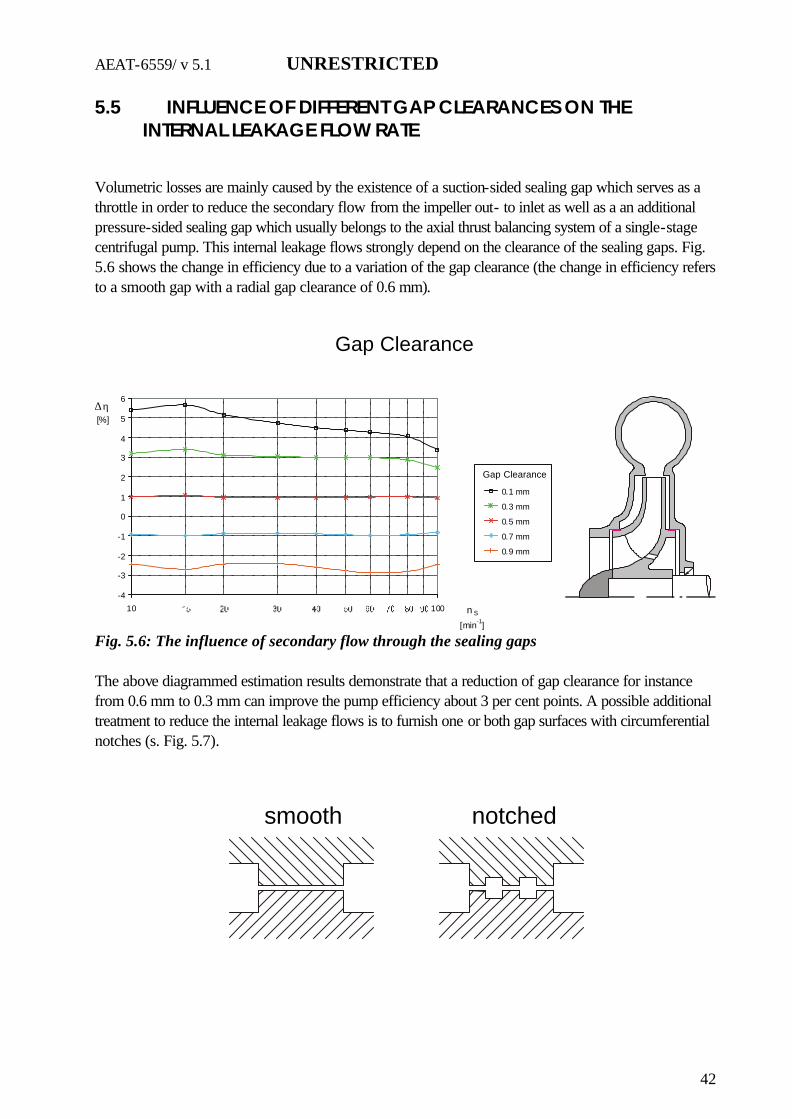
Volumetric losses are mainly caused by the existence of a suction-sided sealing gap which serves as a throttle in order to reduce the secondary flow from the impeller out- to inlet as well as a an additional pressure-sided sealing gap which usually belongs to the axial thrust balancing system of a single-stage centrifugal pump. This internal leakage flows strongly depend on the clearance of the sealing gaps. Fig. 5.6 shows the change in efficiency due to a variation of the gap clearance (the change in efficiency refers to a smooth gap with a radial gap clearance of 0.6 mm).
Gap Clearance
-4
-3
-2
-1
0
1
2
3
4
5
6
10 100 n S
[min-1]
∆η[%]
0.1 mm
0.3 mm
0.5 mm
0.7 mm
0.9 mm
Gap Clearance
Fig. 5.6: The influence of secondary flow through the sealing gaps The above diagrammed estimation results demonstrate that a reduction of gap clearance for instance from 0.6 mm to 0.3 mm can improve the pump efficiency about 3 per cent points. A possible additional treatment to reduce the internal leakage flows is to furnish one or both gap surfaces with circumferential notches (s. Fig. 5.7).
smooth notched
AEAT-6559/ v 5.1 UNRESTRICTED
43
Fig. 5.7: Different types of sealing gaps The theoretically carried out parameter study showed, that notching gaps of the type usually used in standard centrifugal pumps (cylindrical gaps with a relatively short gap length), only leads to a slight improvement of the pump efficiency. 5.6 CONCLUSIONS
The presented results show, that for single-stage standard centrifugal pumps within a range of specific speed ns = 10 min-1 up to ns = 100 min-1 (corresponding to values from 520 min-1 up to 5200 min-1 in US-Units), the highest potential for an efficiency improvement can generally be found in the region of low specific speeds. All efforts aimed at an improvement of the surface quality of several parts of the pump which are in contact with the flow cause a gain of efficiency. With regard to the manufacturing costs which result from such additional surface treatments the smoothing of the outer front and back shroud of the impeller can be proposed as a cost-efficient procedure to improve the efficiency. Furthermore it could be shown that it is recommendable to reduce the clearance of the sealing gaps to the smallest possible value in order to increase the volumetric efficiency. It should also to be mentioned, that the conditions of the surfaces as well as the sealing gaps within a centrifugal pump normally depend on the time of operation, which means that there is a strong necessity to check these parameters at reasonable intervals during the life time of a pump.
AEAT-6559/ v 5.1 UNRESTRICTED
44
6. Pump Efficiency deterioration
6.1 INTRODUCTION
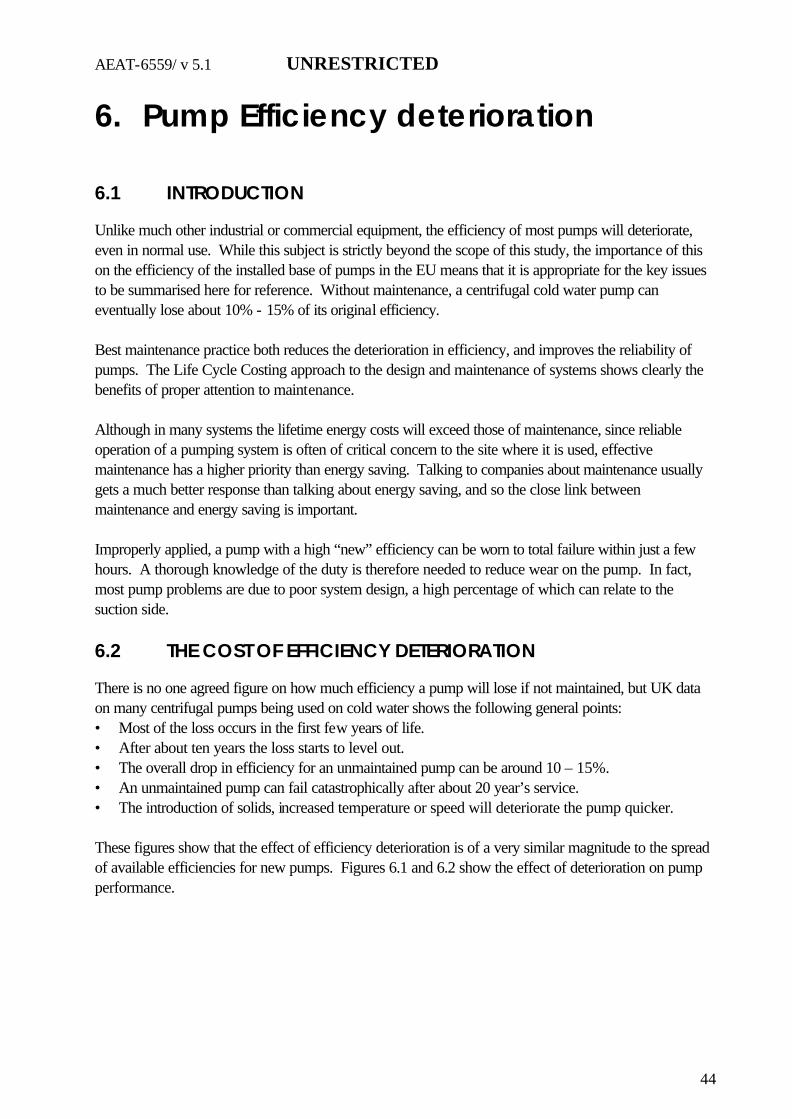
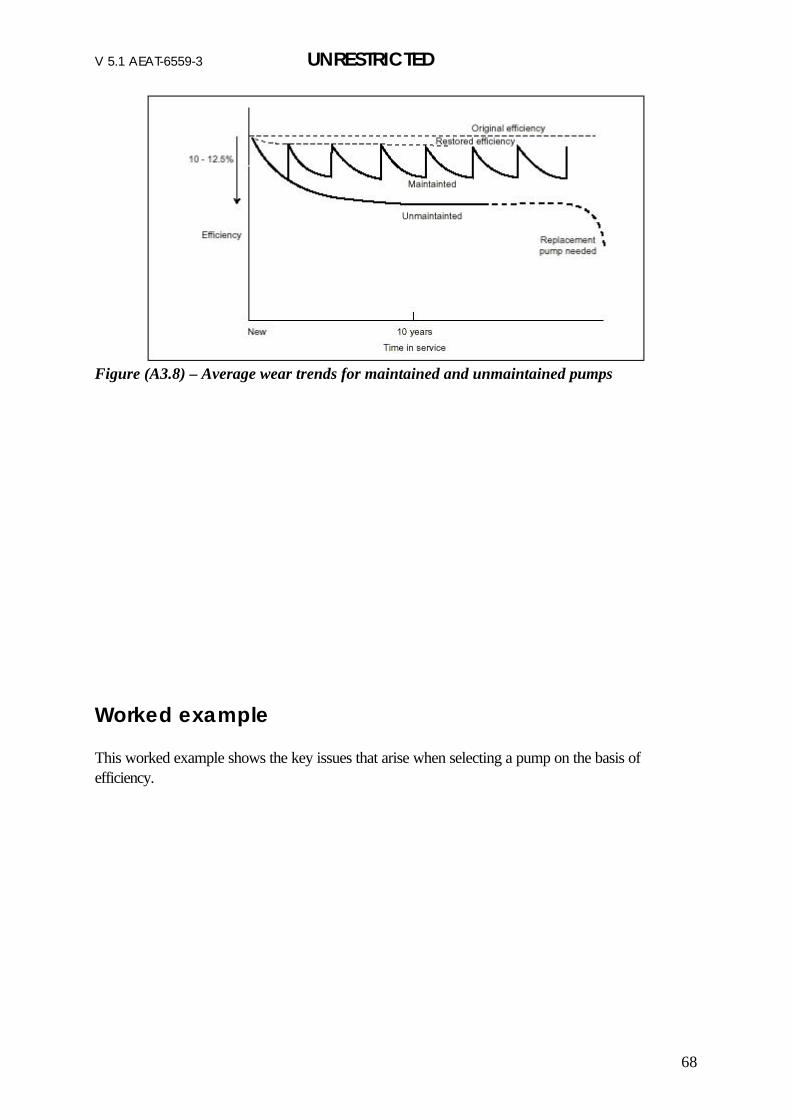
Unlike much other industrial or commercial equipment, the efficiency of most pumps will deteriorate, even in normal use. While this subject is strictly beyond the scope of this study, the importance of this on the efficiency of the installed base of pumps in the EU means that it is appropriate for the key issues to be summarised here for reference. Without maintenance, a centrifugal cold water pump can eventually lose about 10% - 15% of its original efficiency. Best maintenance practice both reduces the deterioration in efficiency, and improves the reliability of pumps. The Life Cycle Costing approach to the design and maintenance of systems shows clearly the benefits of proper attention to maintenance. Although in many systems the lifetime energy costs will exceed those of maintenance, since reliable operation of a pumping system is often of critical concern to the site where it is used, effective maintenance has a higher priority than energy saving. Talking to companies about maintenance usually gets a much better response than talking about energy saving, and so the close link between maintenance and energy saving is important. Improperly applied, a pump with a high “new” efficiency can be worn to total failure within just a few hours. A thorough knowledge of the duty is therefore needed to reduce wear on the pump. In fact, most pump problems are due to poor system design, a high percentage of which can relate to the suction side. 6.2 THE COST OF EFFICIENCY DETERIORATION
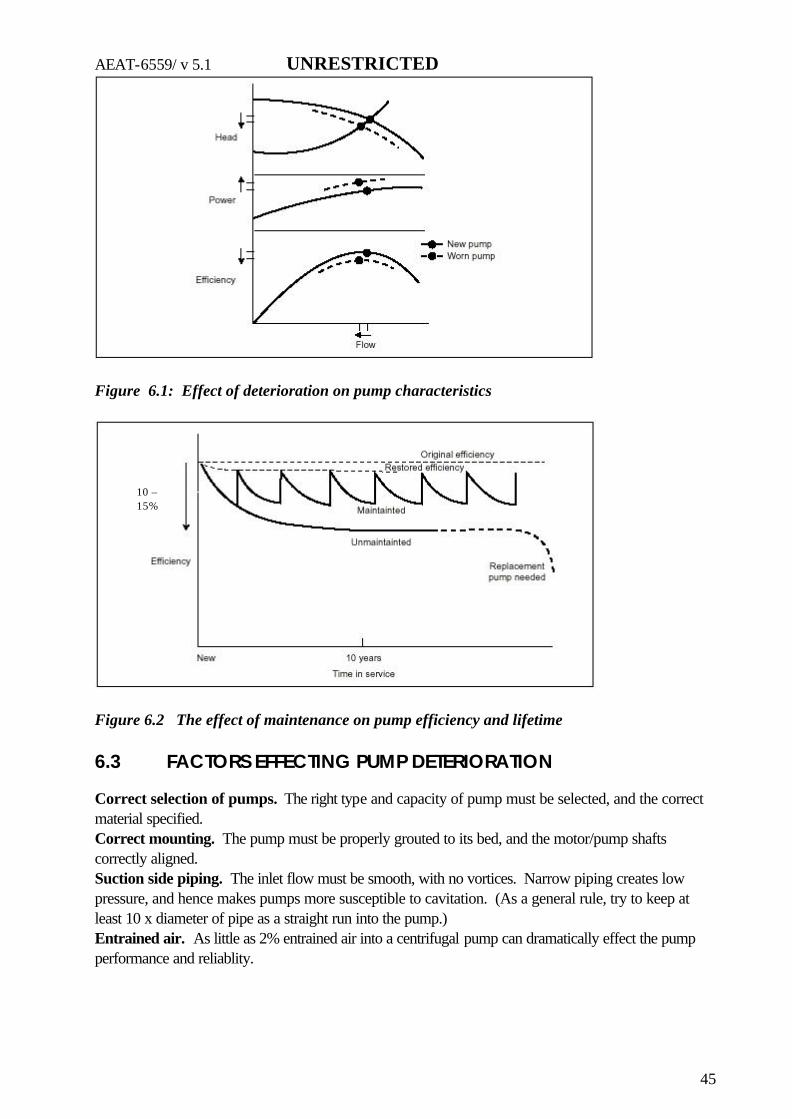
There is no one agreed figure on how much efficiency a pump will lose if not maintained, but UK data on many centrifugal pumps being used on cold water shows the following general points: • Most of the loss occurs in the first few years of life. • After about ten years the loss starts to level out. • The overall drop in efficiency for an unmaintained pump can be around 10 – 15%. • An unmaintained pump can fail catastrophically after about 20 year’s service. • The introduction of solids, increased temperature or speed will deteriorate the pump quicker. These figures show that the effect of efficiency deterioration is of a very similar magnitude to the spread of available efficiencies for new pumps. Figures 6.1 and 6.2 show the effect of deterioration on pump performance.
AEAT-6559/ v 5.1 UNRESTRICTED
45
Figure 6.1: Effect of deterioration on pump characteristics
Figure 6.2 The effect of maintenance on pump efficiency and lifetime 6.3 FACTORS EFFECTING PUMP DETERIORATION
Correct selection of pumps. The right type and capacity of pump must be selected, and the correct material specified. Correct mounting. The pump must be properly grouted to its bed, and the motor/pump shafts correctly aligned. Suction side piping. The inlet flow must be smooth, with no vortices. Narrow piping creates low pressure, and hence makes pumps more susceptible to cavitation. (As a general rule, try to keep at least 10 x diameter of pipe as a straight run into the pump.) Entrained air. As little as 2% entrained air into a centrifugal pump can dramatically effect the pump performance and reliablity.
10 –15%
AEAT-6559/ v 5.1 UNRESTRICTED
46
Dry running. This causes heat build up and eventually seizure. Operation away from BEP. At the pumps best efficiency point the fluid enters and then exits the pump efficiently. As operation moves further from BEP, the fluid recirculates within the pump, causing out of balance forces, which will increase wear on seals, wear rings and bearings through greater shaft deflection. Contaminated bearing grease. Contaminated grease will cause faster bearing erosion. Contaminated oil bath bearings. For these bearings, oil should be replaced at regular intervals. (Tests have shown that 20ppm of water in oil can reduce bearing life from 24,000 hours to 2,200 hours.) While failure of seals or bearings may be immediately apparent, the deterioration in pump hydraulics is unlikely to be obvious. This can have many sources; chemical erosion, physical abrasion, deposition. The use of glass or resin coatings can help to increase and maintain a good hydraulic efficiency over a long period of time, and for larger pumps many users specify these coatings as standard. Improvements in efficiency of 2-3% are typical. This is a practice that should be encouraged. 6.4 APPROACHES TO MAINTENANCE
Maintenance is a time consuming and costly activity, but is essential to minimise Life Cycle Costs and to minimise unplanned downtime. The approach to maintenance will be determined by several key considerations: • Criticality of the process • Consequences of failure • Severity of service • Sensitivity of pump design to operating conditions Deciding when to do maintenance on a pump is a balance between cost and system performance. There are essentially three options: • Do nothing until something goes wrong. Not generally recommended, and the maintenance cost
“savings” from this approach may not be as large as sites might hope. However, in some less critical applications this might be appropriate.
• Periodic strip-down. This is good, but relies on a good knowledge of a particular pump and its applications to know what time between maintenance is appropriate.
• Condition-based maintenance. Regular or on-line monitoring of the pump condition can give accurate indication of when attention is needed. This is arguably the best method, but demands investment in time/monitoring equipment to give the data needed.
6.5 MONITORING OF PUMP PERFORMANCE
At the very simplest, a periodic walk around a site, listening to and feeling for unusual vibration from pumps, will give a clue as to which are starting to wear. At a more advanced level, vibration can be monitored and recorded using standard vibration sensors, and alignment either with conventional techniques or newer laser alignment.
AEAT-6559/ v 5.1 UNRESTRICTED
47
On-line pump monitors are available with varying degrees of complexity, including measurement of temperature, pressure, motor current etc, which can sound alarms to show abnormal operation. Alternatively, and at lower cost, critical parameters can me measured with hand instruments, and performance over time recorded. If a pump operates at a steady duty, then simply measuring and noting increases in current can indicate how efficiency is deteriorating. In situ measurement of pump efficiency is costly, but where it is economic it is often done using the thermodynamic method of pump efficiency determination. This method is already used in the UK and elsewhere by pump users with large energy bills, in particular water companies. For best accuracy, this technique does need to be done by trained personnel, and so it is usually done by consultants rather than company personnel. Regular maintenance should include adjustment of seals and lubrication of bearings as a minimum, and adjustment of wearing ring positions where this is possible. 6.6 REPAIR AND RE-CONDITIONING OF PUMPS
Pump manufacturers prefer pumps to be returned to either them or an accredited agent for repair or re-conditioning. This helps them control the quality of repair and hence customer satisfaction. But particularly with smaller lower cost pumps, for speed of repair they will usually be repaired by a local repairer, who may only have a very limited knowledge of proper pump repair. Training of these organisations represents an important way to improve the efficiency of the installed base of pumps. Training courses on this subject already exist, (Hydraulic Institute in the US, and Association of Electrical and Mechanical Trades in the UK). Whoever does the actual pump repair, it is important that they create the original clearances used in a new pump, and only use correct parts, as pirate parts may not be exact replacements and so can give poor service.
AEAT-6559/ v 5.1 UNRESTRICTED
48
7. References
A Guide to LCC Analysis for Pumping Systems. 2001 Hydraulic Institute & Europump Energy Efficient Actions for Electric Motors, 1996. SAVE, for EC DGXVII. Study of the technical and cost/benefit analysis of energy efficient improvements in industrial three-phase induction motors, November 1999. SAVE, for EC DGXVII. Proceedings EEMODs ’99 Energy Efficiency in Motors and Driven Systems, January 2000. SAVE, for EC DGXVII. Published by Springer. Improving the penetration of energy efficient motors & drives, 1999. SAVE, for EC DGXVII. Proceedings International Workshop Accelerate innovation and market transformation of energy efficient products, February 1999. EC/IEA/DETR. United States Industrial Electric motor Systems Market Opportunities Assessment, December 1998. US Motor Challenge / Office of Industrial Technology. Efficient Electric motor systems for industry - Report on Roundtable Discussions of Market Problems and Ways to Overcome them, November 1993. US DOE Office of Energy Demand Policy and Office of Industrial Technologies Energy-Efficient Motor Systems, 1991. Nadel, Shepard, Greenburg, Katz, de Almeida. ACEEE, Sulzer Centrifugal Pump Handbook, Sulzer Pumps, 2nd Edition,1998. Elsevier, Oxford, UK. ISBN 1 85617 346 1. Centrifugal Pumps, Karassik & McGuire, 2nd Edition, 1998. Chapman & Hall, New York. ISBN 0-412-06391-3. Pump Users Handbook, R.Rayner, 4th Edition, 1995. Elsevier, Oxford, UK. ISBN 1 85617 216 3. Centrifugal Pumps and Allied Machinery, H.Anderson, 4th Edition, 1994. Elsevier, Oxford, UK. ISBN 1 85617 231 7. European Pumps and Pumping, 1994. CHW Roles & Associates Ltd, Sunbury on Thames, UK. ISBN 0 907485 07 3. Attainable Efficiencies of volute casing pumps, Europump, 1999. Elsevier, Oxford, UK. ISBN 1 85617 357 7.
AEAT-6559/ v 5.1 UNRESTRICTED
49
Centrifugal Pumps – The state of the art and new opportunities, IMechE, 2000.Professional Engineering Publishing Ltd, London, UK. ISBN 1 86058 283 4. Energy saving in the design and operation of pumps, IMechE,1996. Profesional Engineering Publishing Ltd, London, UK. ISBN 1 86958 015 7.
AEAT-6559/ v 5.1 UNRESTRICTED
50
Appendices
CONTENTS
Appendix 1 EC guide to pump efficiency Appendix 2 Pump energy consumption calculated from
Eurostat data (1998) Appendix 3 Efficiency characteristics of centrifugal pumps
V 5.1 AEAT-6559-3 UNRESTRICTED
51
8. Appendix 1: EC Guide to Pump
Efficiency
NB. There have been further consultations with EUROPUMP since this Guide was produced. This has resulted in a booklet entitled ‘European Guide to Pump Efficiency for Single Stage Centrifugal Pumps’. This builds on the ‘EC Guide to Pump Efficiency’ by providing additional information relating to average selections for efficiency, enabling the plots to show areas of ‘Optimum Efficiency Selections’, ‘Efficiency Selections’ and ‘Lower Efficiency Selections’. This booklet is available from: http://energyefficiency.jrc.cec.eu.int or hard copy from: Mike Birks Future Energy Solutions (FES) B154 Harwell Didcot Oxfordshire OX11 OQJ United Kingdom Tel: +44 1235 433468 Fax: +44 1235 433990 Email: [email protected]
V 5.1 AEAT-6559-3 UNRESTRICTED
52
Purpose of the Guide This guide is for anyone wishing to buy pumps and save money. The aim is to help you choose a pump of good efficiency. This will reduce your energy costs. In some cases the saving from just one additional point of efficiency can pay for your pump. We hope this Guide will also reduce the energy used across the EU, benefiting everyone through a better environment. For the origin of the Guide see Annex A. Pump types and duties This Guide should only be used for single stage centrifugal pumps handling clean water at up to 95°C. Pump types covered are: End suction pumps having their own bearings.
Close coupled end suction pumps, with the impeller on the motor shaft. Double entry pumps having an axially split casing.
The applicable ranges of flow and head are shown on Figs 1 and 2 for pumps running at nominally 2900 and 1450 rev/min.
Fig 1. Range coverage at best-efficiency duties at 2900 rev/min
10
100
1000
10 100 1000 10000
Flow (m3/h)
Hea
d (m
)
DESCDouble Entry Split Casing
ESCCEnd Suction Close Coupled
ESOBEnd Suction Own Bearings
DESCESOB
ESCC
200 kW96 kW
23 kW
2.5 kW1.4 kW
V 5.1 AEAT-6559-3 UNRESTRICTED
53
Fig 2. Range coverage at best-efficiency duties at 1450 rev/min
How to use the efficiency plots Performance curves published by manufacturers have been used to produce six plots (Figs 3 to 8). Each point plotted shows the performance at the best-efficiency duty at maximum impeller diameter, after correcting for pump head (see Annex B). A line is included, for guidance only, showing the ‘Catalogue ‘mean’ of best-efficiency points’. To use the plots:
Decide which type of pump you want. Choose the flow and head at which you would like maximum efficiency. Check that the chosen flow and head are within the ranges of Figs 1 or 2. Get efficiency quotes from manufacturers (or use published information). Enter your chosen flow and head on the plot that suits the quotes (Figs 3 to 8). Read correction factor ‘C’ on the right-hand axis. Add ‘C’ to the efficiency that has been quoted. Plot (quoted pump efficiency + correction ‘C’) at your chosen flow. If the point lies in the ‘Lower Efficiency’ area, seek higher efficiency quotes.
Important note: Although a quoted low efficiency may be due to poor pump quality, it is more likely to be due to your chosen duty not coinciding with that pump’s best-efficiency point. Your flow may be below or above the optimum for that pump. Your head will probably require a reduced diameter impeller. A survey has suggested that you are unlikely to receive more than one quote in five above the ‘mean’ best-efficiency line. Worked example:
10
100
1000
10 100 1000 10000
Flow (m3/h)
Hea
d (m
)
DESCDouble Entry Split Casing
ESCCEnd Suction Close Coupled
ESOBEnd Suction Own Bearings
DESC
ESOB
ESCC
680 kW
67 kW
20 kW
1.2 kW7.4 kW
V 5.1 AEAT-6559-3 UNRESTRICTED
54
Chosen pump type? End suction with own bearings. Chosen duty for maximum efficiency? 80 m3/h at 110 m. Quoted pump performance? 60% efficiency at 2900 rev/min. (Check materials, suction performance, etc, are satisfactory) Is chosen duty within ranges covered? From Fig 1, yes. From Fig 3: ‘C’ = 14. Plot on Fig 3: ‘Pump Efficiency + C’ = 60 + 14 = 74%. Is this satisfactory? Fig 3 suggests that an additional 4 to 8 points is possible. Action: Seek further quotes.
Loss of pump efficiency with time A pump of high efficiency is of little value if the efficiency falls rapidly with time. You can minimise this risk. Choose materials carefully, particularly for wear rings. Avoid high and low flow operation in relation to your chosen duty. Ask for cast iron casings to be protectively coated if the water is known to cause serious roughening due to corrosion. Life cycle costs Pump efficiency is just one factor which influences the cost of owning and running a pump. Attention to the design of the system in which the pump operates and the method of pump control can achieve very large savings. For more details see Ref 2.
V 5.1 AEAT-6559-3 UNRESTRICTED
55
Fig 3. Efficiencies of end suction pumps with their own bearings at 2900 rev/min
Fig 4. Efficiencies of end suction pumps with their own bearings at 1450 rev/min
'Lower Efficiency'Catalogue 'mean' of best-efficiency
points
V 5.1 AEAT-6559-3 UNRESTRICTED
58
1. ‘Improving the energy efficiency of pumps’, Report produced for the European Commission (DG Energy – SAVE), 2000.
2. ‘A guide to life cycle cost analysis for pumping systems’, Europump and Hydraulic Institute, 2000. 3. ‘Efficiency prediction method for centrifugal pumps’, Hydraulic Institute, 1994. 4. Anderson, H.H., ‘Centrifugal pumps and allied machinery’, Elsevier Advanced Technology, 1994. 5. ‘Attainable efficiencies of volute casing pumps’, Europump Guide No. 2, 1999. 6. Stoffel, B. and Lauer, J., Summary of the final report on the research project for VDMA ‘Theoretically
attainable efficiency of centrifugal pumps’, Technical University of Darmstadt, 1994. ANNEX A - Origin of this Guide. This Guide and Ref 1 were produced by a Project Team comprising:
ETSU (UK) Project Leader CETIM (France) David T Reeves (UK) NESA (Denmark) University of Darmstadt (Germany)
The work was funded principally by the European Commission with additional funding provided by the Project Team. ANNEX B - Correction for pump head Correction ‘C’, as shown on Figs 3 to 8, is based on pump flow, head and speed. It is actually a correction for pump Specific Speed. Pumps of relatively low head (high Specific Speed) and high head (low Specific Speed) lose efficiency due to unavoidable secondary hydraulic losses. Ref 3 shows a curve to allow efficiency correction for Specific Speed. This is actually the correction proposed by Anderson in Ref 4. Alternative curves to correct for Specific Speed can be derived from Ref 5 and Ref 6. None of the these curves appear to provide an ‘optimum’ correction for the published manufacturers’ data analysed for this Guide. We have therefore chosen to use an intermediate Specific Speed correction curve which produces the minimum scatter of the points plotted. There is no strict theoretical justification for this approach but we believe that it serves well for the purpose for which this Guide is intended. (Further information can be found in Ref 1.) ANNEX C - Comparison with other sources
V 5.1 AEAT-6559-3 UNRESTRICTED
59
For practical reasons it has only been possible to source a limited amount of data to produce the plots in this Guide. To assess how meaningful the results are, it is useful to compare them with other sources. The best efficiencies at optimum Specific Speed for end suction pumps having their own bearings at 2900 rev/min from Fig 3 are replotted below in Fig 9 and marked ‘Catalogue ‘mean’’. Additional curves (all at optimum Specific Speed) are derived from:
From Fig 9 we deduce that the Catalogue ‘mean’ curve is suitable for the guidance purposes intended. The ‘Hydraulic Institute ‘ANSI/API’’ curve is low, particularly at low flows. This is probably mainly due to the use of relatively large wear ring clearances, as required for pumps in special materials or to meet the American Petroleum Institute (API) Standard.
Fig 9. Comparison of efficiencies of end suction pumps from various sources
9. Appendix 2: Pump energy consumption calculated from sales data (1998)
V 5.1 AEAT-6559-3 UNRESTRICTED
61
Source: National associations, public statistical offices and Eurostat, supplied to the study group by Europump Total Total Total Total Total Av. Annual Life Installed Operating Load Pump energy Total pump
Country Type Production Imports Exports Market Market Price Sales Capacity Hours consumption energy consumption* (Million DM) (Million DM) (Million DM) (Million DM) (million €) €/KW (kW) (Years) (GW) (Hrs/a) (%) (GWhpa) (GWhpa)
Germany End Suction Close Coupled 132 28 115 45 23.0 200 115,042 20 2.30 4000 65% 5,982 End Suction Own Bearing 500 23 236 287 146.7 200 733,715 20 14.67 4000 65% 38,153 Double Entry Split Case 15 4 28 -9 -4.6 200 -23,008 20 -0.46 4000 65% -1,196 42,900
UK End Suction Close Coupled 141 10 33 118 60.3 200 301,667 20 6.03 4000 65% 15,687 End Suction Own Bearing 142 15 100 57 29.1 200 145,720 20 2.91 4000 65% 7,577 Double Entry Split Case 77 2 24 55 28.1 200 140,607 20 2.81 4000 65% 7,312 30,600
France End Suction Close Coupled 104 24 7 121 61.9 200 309,336 20 6.19 4000 65% 16,085 End Suction Own Bearing 159 34 19 174 89.0 200 444,831 20 8.90 4000 65% 23,131 Double Entry Split Case 4 1 0 5 2.6 200 12,782 20 0.26 4000 65% 665 39,900
Belgium End Suction Close Coupled 52 7 5 54 27.6 200 138,051 20 2.76 4000 65% 7,179 End Suction Own Bearing 7 19 5 21 10.7 200 53,686 20 1.07 4000 65% 2,792 Double Entry Split Case 0 1 6 -5 -2.6 200 -12,782 20 -0.26 4000 65% -665 9,300
Denmark End Suction Close Coupled 1 6 2 5 2.6 200 12,782 20 0.26 4000 65% 665 End Suction Own Bearing 44 14 1 57 29.1 200 145,720 20 2.91 4000 65% 7,577 Double Entry Split Case 2.5 0 0 2.5 1.3 200 6,391 20 0.13 4000 65% 332 8,600
Finland End Suction Close Coupled 3 2 1 4 2.0 200 10,226 20 0.20 4000 65% 532 End Suction Own Bearing 13 6 1 18 9.2 200 46,017 20 0.92 4000 65% 2,393 Double Entry Split Case 0 0 0 0 0.0 200 0 20 0.00 4000 65% 0 2,900
Italy End Suction Close Coupled 124 12 31 105 53.7 200 268,432 20 5.37 4000 65% 13,958 End Suction Own Bearing 187 28 8 207 105.8 200 529,195 20 10.58 4000 65% 27,518 Double Entry Split Case 8 1 0 9 4.6 200 23,008 20 0.46 4000 65% 1,196 42,700
Netherlands End Suction Close Coupled 19 12 1 30 15.3 200 76,695 20 1.53 4000 65% 3,988 End Suction Own Bearing 10 21 12 19 9.7 200 48,573 20 0.97 4000 65% 2,526 Double Entry Split Case 7.5 0 0 7.5 3.8 200 19,174 20 0.38 4000 65% 997 7,500
Austria End Suction Close Coupled 6 8 2 12 6.1 200 30,678 20 0.61 4000 65% 1,595 End Suction Own Bearing 19 10 2 27 13.8 200 69,025 20 1.38 4000 65% 3,589 Double Entry Split Case 1 0 0 1 0.5 200 2,556 20 0.05 4000 65% 133 5,300
Spain End Suction Close Coupled 46 12 5 53 27.1 200 135,494 20 2.71 4000 65% 7,046 End Suction Own Bearing 79 10 7 82 41.9 200 209,633 20 4.19 4000 65% 10,901 Double Entry Split Case 36 0 0 36 18.4 200 92,034 20 1.84 4000 65% 4,786 22,700
TOTALS 817.1 4,085,285 81.71 212,435 212,400
V 5.1 AEAT-6559-3 UNRESTRICTED
62
* Only centrifugal pumps covered in this study
V 5.1 AEAT-6559-3 UNRESTRICTED
63
10. Appendix 3: Efficiency Characteristics of Centrifugal Pumps
This section gives a quick overview of the fundamentals of choosing and using a pump for best efficiency. This is not an exhaustive guide, but is designed to be just sufficient for non-technical personnel to get a better understanding of the technical background to this work. Other publications (such as the Enersave guide) are recommended as giving much fuller explanations. The following applies to most types of centrifugal pumps only. Part load characteristics of pumps Pumps are always defined by the basic Pump characteristics below (figure A3.1). They show the relationship between head, power and efficiency against flow. It is important to see just how "peaky" the efficiency might be, showing that running at a duty (head and/or flow) below rated duty is likely to lead to a significant reduction in pump efficiency. The Best Efficiency Point (BEP) of a pump is ideally at the rated duty point.
Figure (A3.1) – Centrifugal pump characteristics Running at reduced flow, or indeed above rated flow, will accelerate pump wear and might give operational problems, (figure A3.2).
V 5.1 AEAT-6559-3 UNRESTRICTED
64
Figure (A3.2) – Onset of adverse effects when operating a pump away from its peak efficiency flow In practice pumps are usually found to be over-rated for the duty, since either the demand varies, and/or the system designer has been prudent and over-sized the system. This problem is generally over-come by throttling the flow with a valve. But deliberately restricting the system flow is far inferior to better matching of the pump to the actual system requirements. This is because it often causes additional wear, (figure A3.2), and reduces system efficiency, (figure A3.3).
Figure (A3.3) – Illustration of the effect on efficiency of throttling a pump One pump - different duties
V 5.1 AEAT-6559-3 UNRESTRICTED
65
Reducing the diameter of the impeller will make an existing pump run more efficiently at a lower flow without throttling, (figure A3.4). Manufacturers commonly offer the same pump housing (volute) with a range of impeller diameters because of this. Manufacturers may also offer different styles of impeller to cope with different duties.
Figure (A3.4) – Pump characteristics showing various impeller diameters Often a manufacturer will offer the same pump with different motor options to allow the one pump to be used over a much wider range of duties. For instance, changing from the most common 4-pole motor to a faster 2-pole motor will enable the same pump to deliver twice as much peak flow and 4 times the head. (The effect of running a pump with 4 and 2 pole motors is the same as what happens when running at 50% and 100% speeds as shown in figure A3.5). Variable Speed Drives allow a pump to operate efficiently over a wide range of speeds and hence duties, and so are very good for saving energy, (figure A3.5). They are particularly useful in systems where there is a wide variation in demanded flow.
V 5.1 AEAT-6559-3 UNRESTRICTED
66
Figure (A3.5) – Effect of speed reduction on pump characteristics What this all means is that the same basic pump can serve different duties depending on both the diameter of impeller fitted and the speed of the motor chosen. The power consumption will vary with these parameters and with other factors such as viscosity. It is therefore not useful, and indeed would be very misleading, to characterise pumpsets by power rating. The size of motor required therefore needs to be determined for each application. Selecting a pump When selecting a pump, a manufacturer will use "tombstone" curves, which show their ranges of pumps to cover a range of duties (figure (A3.6). Ideally, the duty you want will be roughly 20% below the maximum flow shown on the tombstone, which corresponds to the BEP of the selected pump (each tombstone is built up from the individual pump curves in figure A3.4). But for economic reasons they have to restrict the number of pumps that they offer. This means that even a manufacturer of particularly efficient pumps may lose out, when quoting efficiencies in competition with less efficient pumps whose BEP just happens to be nearer the requested performance. The worked example in the box makes this clearer.
V 5.1 AEAT-6559-3 UNRESTRICTED
67
Figure (A3.6) – “Tombstone” curves for the selection of pumps by duty. In addition, pumps wear over time (figure A3.7), but their efficiency can be maintained by refurbishment figure (A3.8).
Figure (A3.7) – Effect of wear on pump characteristics
V 5.1 AEAT-6559-3 UNRESTRICTED
68
Figure (A3.8) – Average wear trends for maintained and unmaintained pumps Worked example This worked example shows the key issues that arise when selecting a pump on the basis of efficiency.
V 5.1 AEAT-6559-3 UNRESTRICTED
69
BEP (B)
= 86%
84
82
83%
Pump A
Desired (Quoted)Duty Point
80%
77%
80%
BEP (A)= 82%
Actual (Installed)Duty Point
Flow
Hea
dPump B
Pump Efficiency Pump A Pump B
Peak (BEP) 82% 86%
At desired (quoted) duty point 81.5% 80%
At actual (installed) duty point 79% <77%
A User requests quotes for a pump at a particular Desired duty. Manufacturers A and B offer the pumps shown, which are the best that they can offer from the ranges that they have. (These two pumps are excerpts from the two manufacturers’ ranges of the type shown in figure A3.6). There are two important points: While pump B has a higher BEP, at the desired duty, pump A actually has a higher efficiency than pump B. Over-specifying the duty means that at the actual installed duty, the efficiency of the pump will be considerably less than quoted. (In this particular case it would be better to use a reduced diameter impeller, or perhaps a quite different pump to either of those quoted for.) Key points • Pump efficiency can decrease significantly when the pump is operating away from the designed
Best Efficiency Point. Over-specifying the duty when specifying a pump will therefore mean much increased energy costs.
• Pumps are not made to standard duties, which makes comparing efficiencies less simple than with products that are made to standard duties, (such as motors).
• A manufacturer of pumps with a high design (BEP) efficiency may often lose out to another manufacturers of a less efficient (BEP) pump, depending on where the actual duty point requested lies within the performance curves of the pumps.
• The same pump will usually be offered with different impellers to give good performance at lower duties.
• The same pump will often be offered with different speed motors to allow it to cover a much wider range of duties.
V 5.1 AEAT-6559-3 UNRESTRICTED
70
• Pump performance and efficiency deteriorates over time. • Power consumption of a particular pump, and hence rating of motor, is determined by the