Study on the Behaviour of Dengue viruses during outbreaks with reference to Entomological and Laboratory surveillance in the Cuddalore, Nagapattinam and Thirunelveli Districts of Tamil Nadu, India. P.Basker* and K.Koldandasamy** *Presenter- Senior Entomologist, Zonal Entomological Team, Cuddalore. **Director of Public Health and Preventive Medicine, Government of Tamil Nadu, Chennai, India.
Transcript
Study on the Behaviour of Dengue viruses during outbreaks with reference to Entomological and Laboratory surveillance in the Cuddalore, Nagapattinam and Thirunelveli Districts of Tamil Nadu, India.
P.Basker* and K.Koldandasamy** *Presenter- Senior Entomologist, Zonal Entomological Team, Cuddalore. **Director of Public Health and Preventive Medicine, Government of Tamil Nadu, Chennai, India.
Flow Chart of fever convergence mechanism
FEVER CASES
PHC OP Nominal Register
SSH Daily Reports by Surveillanc
e HI
IDSP P-Form
Weekly
MF-9
Rumours in Dailies, TV
etc.,
PRIORITIZATION FOR THE ENTOMOLOGICAL SURVEILLANCE
Inter PHC
communication
STUDY AREAS
Objectives of the Study This study was carried out in order to understand the behaviour of
dengue viruses through the entomological and laboratory surveillance of outbreaks with the following objectives are
1.To provide additional research 2.To support current knowledge of epidemiological, clinical, entomological
and on laboratory diagnosis of dengue virus 3.To apply these information to forecasting dengue as well as 4.To justify intervention measures.
Materials and Methods
• To arrive House Index (HI), Container Index (CI) and Breteau Index (BI), data on the presence of Aedes Spp larvae in habitats in and around house holds in the study area had been taken. DBC, JE, SE and officials involved in it
• Standard procedures were followed for non-structural Protein 1 (NS1) and immunoglobulin M enzyme linked immuno sorbant assay for the confirmation of dengue positive cases.
• Serovar confirmation was made by the RT-PCR in the Kottayam field station of the Vector Control Research Center, Puducherry.
05
10152025
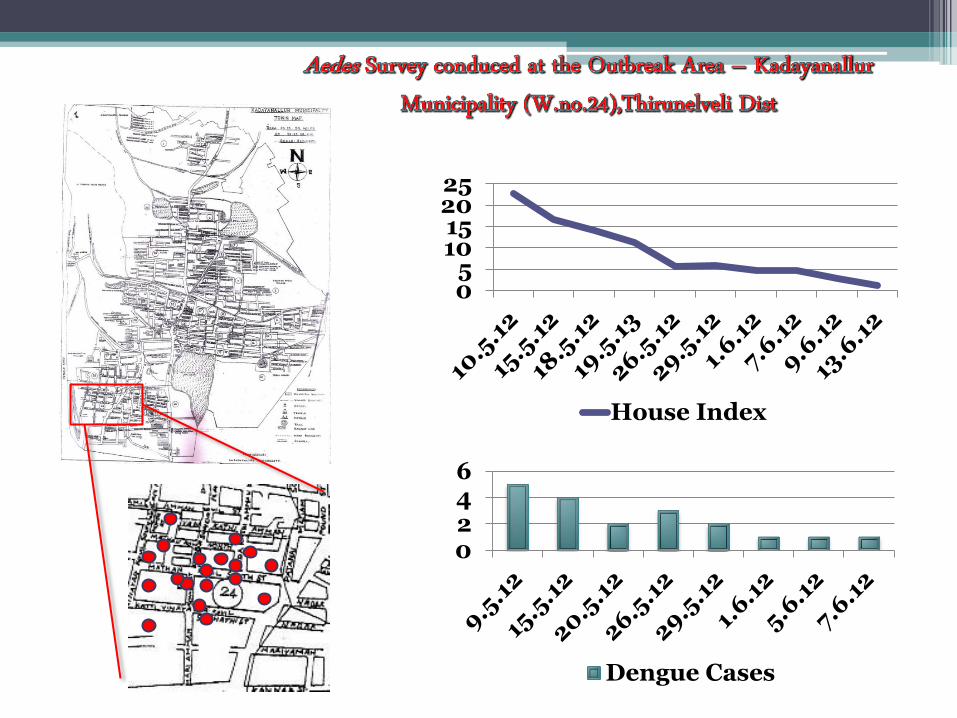
House Index
0246
Dengue Cases
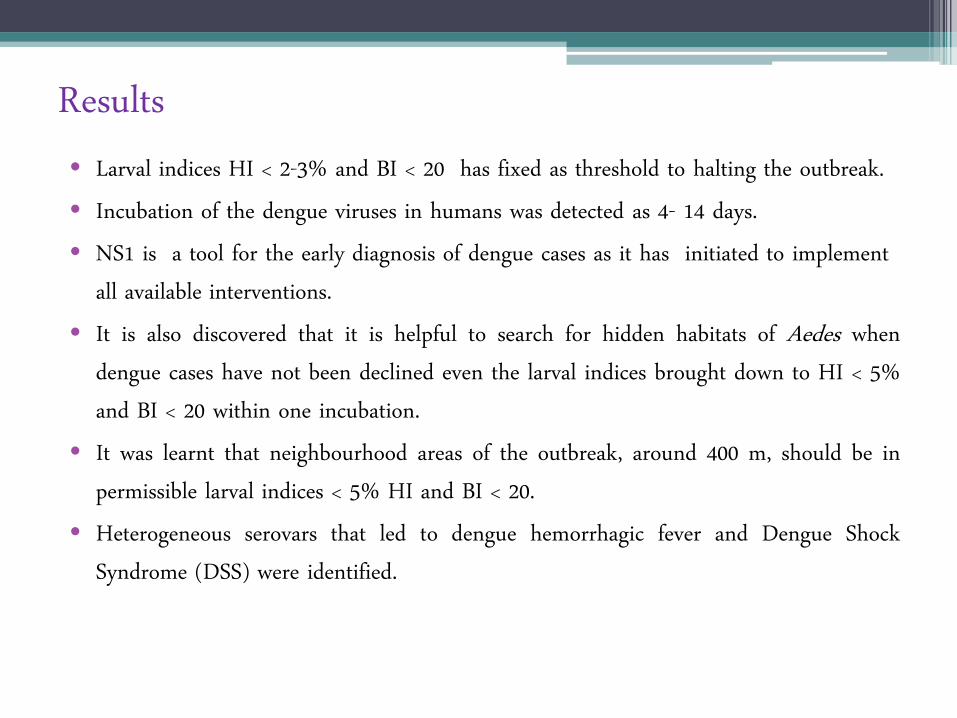
Results • Larval indices HI < 2-3% and BI < 20 has fixed as threshold to halting the outbreak. • Incubation of the dengue viruses in humans was detected as 4- 14 days. • NS1 is a tool for the early diagnosis of dengue cases as it has initiated to implement
all available interventions. • It is also discovered that it is helpful to search for hidden habitats of Aedes when
dengue cases have not been declined even the larval indices brought down to HI < 5% and BI < 20 within one incubation.
• It was learnt that neighbourhood areas of the outbreak, around 400 m, should be in permissible larval indices < 5% HI and BI < 20.
• Heterogeneous serovars that led to dengue hemorrhagic fever and Dengue Shock Syndrome (DSS) were identified.
Supportive Data (Cuddalore)
Diagnostic tools No. of cases
NS1 ELISA 1179
Ig-M ELISA 211
RDT NS1 100
RDT NS1 10
Total 1500
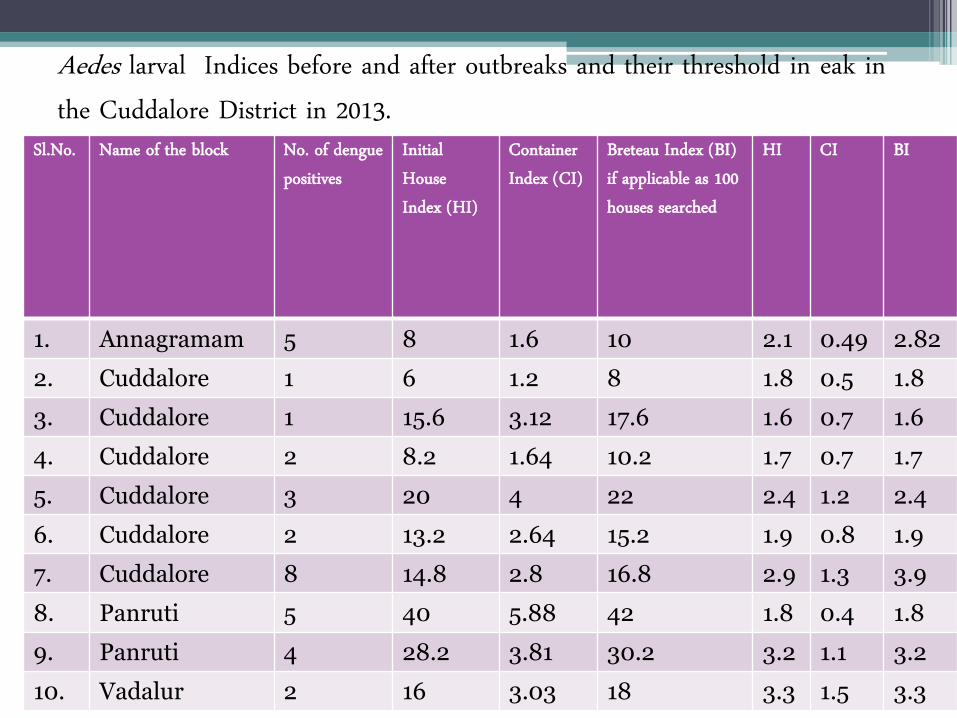
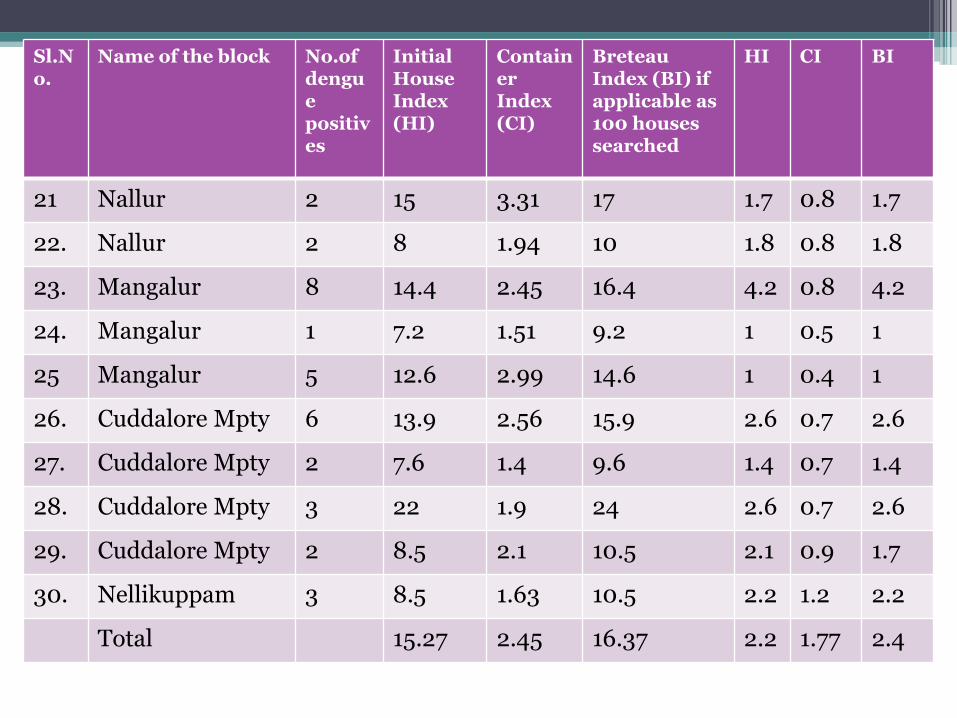
Aedes larval Indices before and after outbreaks and their threshold in eak in the Cuddalore District in 2013.
Sl.No. Name of the block No. of dengue positives
Initial House Index (HI)
Container Index (CI)
Breteau Index (BI) if applicable as 100 houses searched
HI CI BI
1. Annagramam 5 8 1.6 10 2.1 0.49 2.82
2. Cuddalore 1 6 1.2 8 1.8 0.5 1.8
3. Cuddalore 1 15.6 3.12 17.6 1.6 0.7 1.6
4. Cuddalore 2 8.2 1.64 10.2 1.7 0.7 1.7
5. Cuddalore 3 20 4 22 2.4 1.2 2.4
6. Cuddalore 2 13.2 2.64 15.2 1.9 0.8 1.9
7. Cuddalore 8 14.8 2.8 16.8 2.9 1.3 3.9
8. Panruti 5 40 5.88 42 1.8 0.4 1.8
9. Panruti 4 28.2 3.81 30.2 3.2 1.1 3.2
10. Vadalur 2 16 3.03 18 3.3 1.5 3.3
Sl.No. Name of the block No.of dengue positives
Initial House Index (HI)
Container Index (CI)
Breteau Index (BI) if applicable as 100 houses searched
HI CI BI
11. Parangipettai 5 8.8 1.62 10.8 2.5 0.7 2.3
12 Parangipettai 4 6.6 1.25 8.6 2.3 0.7 2.3
13 Parangipettai 3 10 1.8 12 3.2 1.13 3.2
14. Parangipetti 2 7.2 1.4 9.2 2.7 0.8 2.7
15. Kammapuram 3 22 3.7 24 3.8 1.1 6.4
16. Kammapuram 1 22 0.44 4.2 2 0.19 2
17. Kammapuram 2 13.2 0.54 15.2 1.5 0.8 1.5
18. Kammapuram 3 40.1 7.7 42.1 1.2 0.8 2.3
19. Mangalampettai 1 21 0.68 4.1 1.7 0.32 1.7
20. Nallur 2 13.7 3.03 15.7 1.5 0.8 1.5
Sl.No.
Name of the block No.of dengue positives
Initial House Index (HI)
Container Index (CI)
Breteau Index (BI) if applicable as 100 houses searched
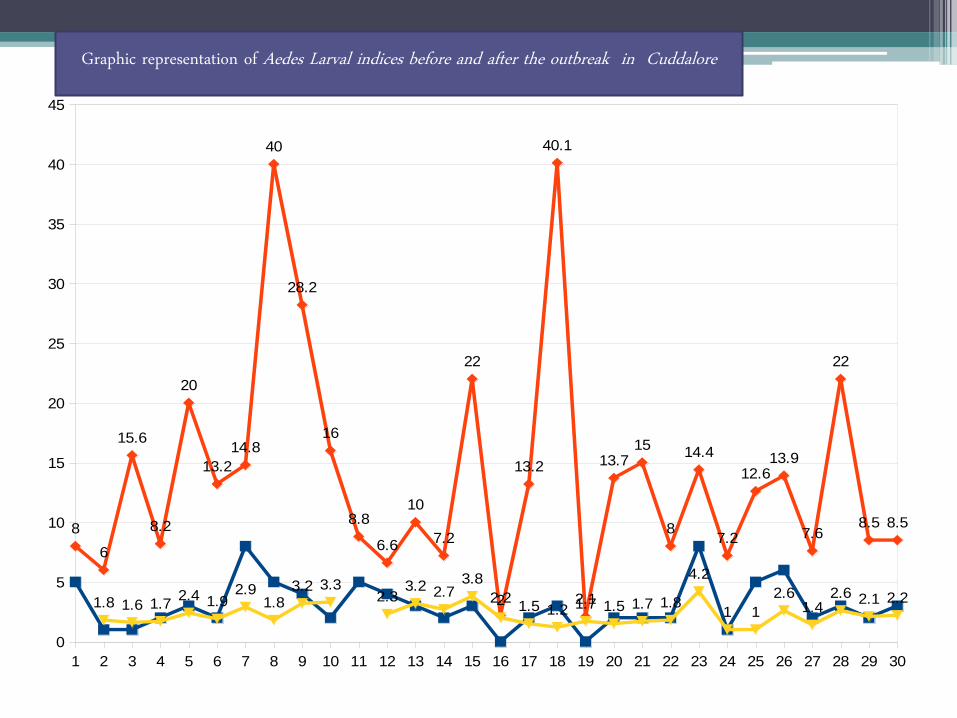
Graphic representation of Aedes Larval indices before and after the outbreak in Cuddalore
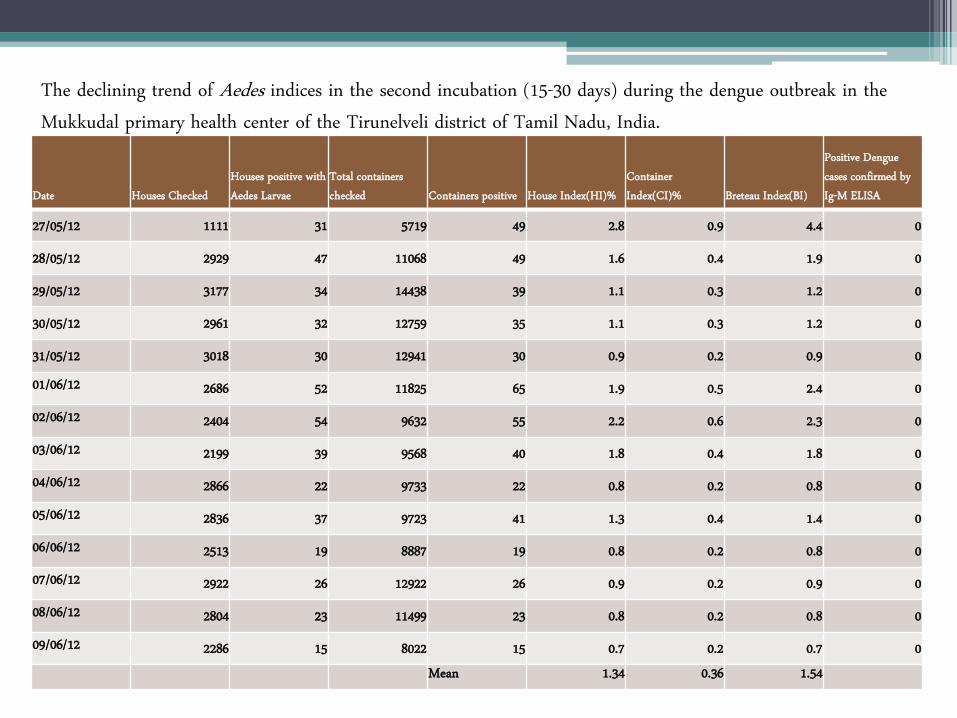
The declining trend of Aedes indices in the second incubation (15-30 days) during the dengue outbreak in the Mukkudal primary health center of the Tirunelveli district of Tamil Nadu, India.
Date Houses Checked Houses positive with Aedes Larvae
Total containers checked Containers positive House Index(HI)%
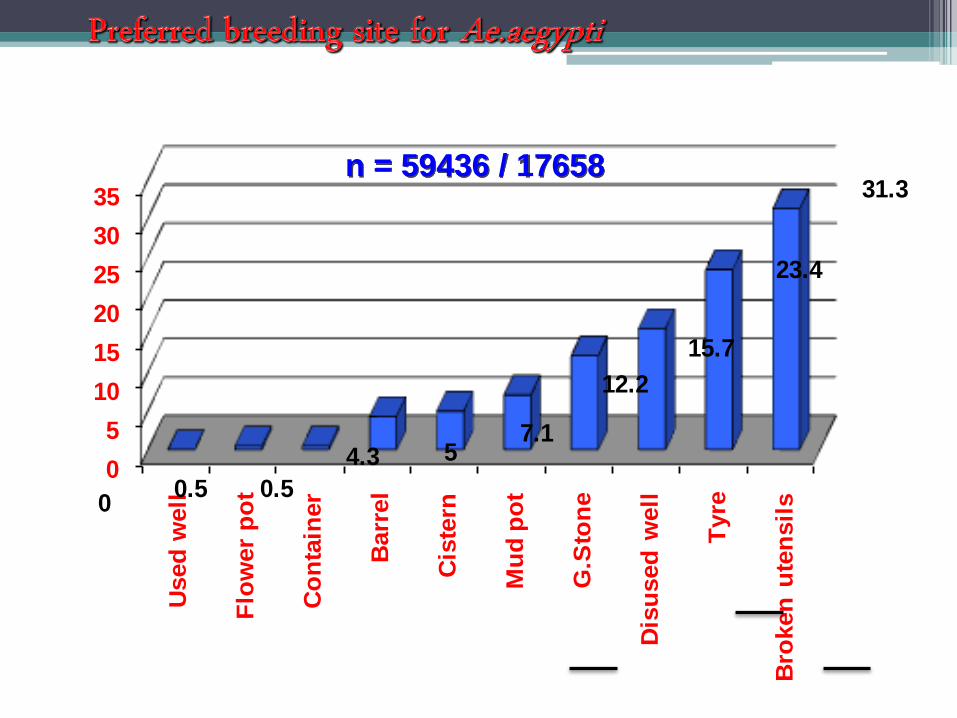
• Supportive Data for unconventional Breeding habitats
of Aedes aegypti and Aedes albopictus
0
5
10
15
20
25
30
35U
sed
well
Flo
wer
po
t
Co
nta
iner
Barr
el
Cis
tern
Mu
d p
ot
G.S
ton
e
Dis
used
well
Tyre
Bro
ken
ute
nsil
s00.5 0.5
4.3 57.1
12.2
15.7
23.4
31.3n = 59436 / 17658
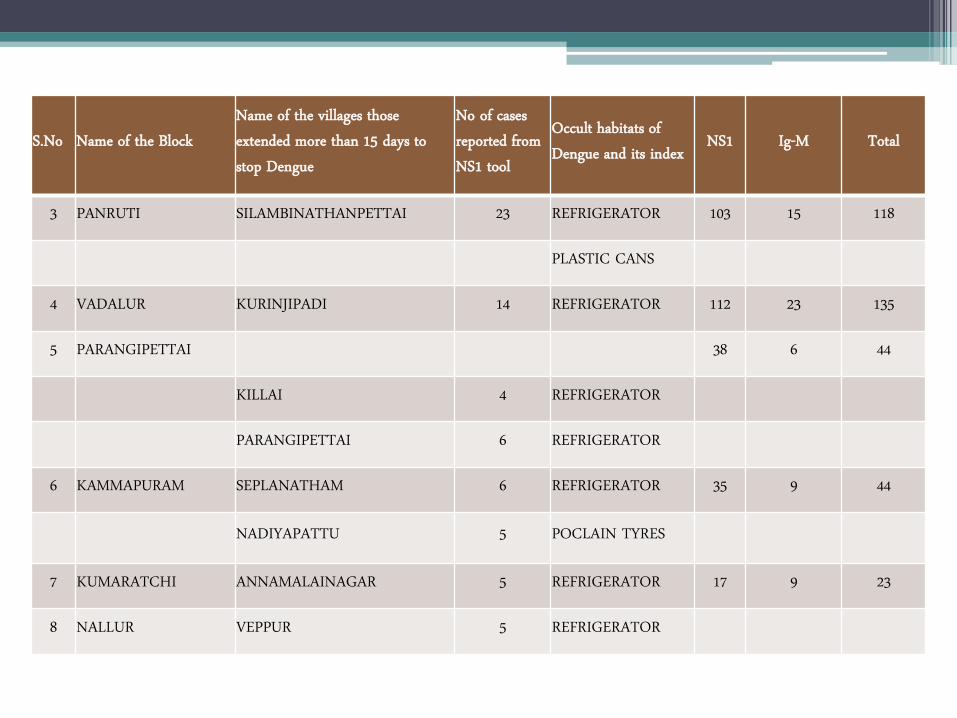
Showing the hidden habitats of Aedes species in some rural and urban of Cuddalore District those contributed dengue positives along with the permissible Aedes Indices
S.No Name of the Block Name of the villages those extended more than 15 days to stop Dengue
No of cases reported from NS1 tool
Occult habitats of Dengue and its index NS1 Ig-M Total
1 ANNAGIRAMAM 25 8 33
2 CUDDALORE KONDUR 10 REFRIGERATOR 180 19 199
KOOTHAPAKKAM 7 REFRIGERATOR
PATHIRIKUPPAM 8 REFRIGERATOR
THIRUVANDIPURAM 7 REFRIGERATOR
KNPETTAI 9 REFRIGERATOR
TAZHANGUDA 9 REFRIGERATOR
RAMAPURAM 12 REFRIGERATOR
S.No Name of the Block Name of the villages those extended more than 15 days to stop Dengue
No of cases reported from NS1 tool
Occult habitats of Dengue and its index NS1 Ig-M Total
The declining trends of the House Index (HI) and Container Index (CI) from the day of intervention to the halt of the dengue outbreaks in the urban areas of the Nagapattinam Dstrict of Tamil Nadu, India.
SevaBharathi Old Nambiyar Nagar New Nambiyar Nagar TATA Nagar
Days from the intervention HI CI HI CI HI CI HI CI
The declining trends of the House Index (HI) and Container Index (CI) from the intervention days to the halt of the dengue outbreaks in the urban areas of the Nagapattinam District of Tamil Nadu, India.
SevaBharathi Old Nambiyar Nagar New Nambiyar Nagar TATA Nagar
Days from the intervention HI CI HI CI HI CI HI CI
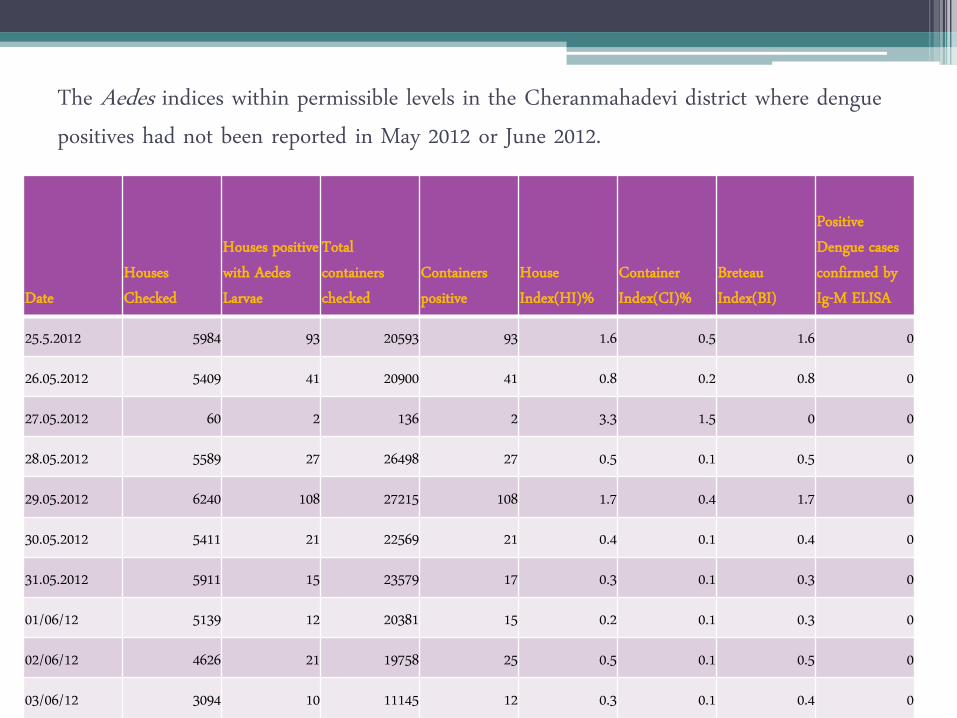
The Aedes indices within permissible levels in the Cheranmahadevi district where dengue positives had not been reported in May 2012 or June 2012.
Date Houses Checked
Houses positive with Aedes Larvae
Total containers checked
Containers positive
House Index(HI)%
Container Index(CI)%
Breteau Index(BI)
Positive Dengue cases confirmed by Ig-M ELISA
25.5.2012 5984 93 20593 93 1.6 0.5 1.6 0
26.05.2012 5409 41 20900 41 0.8 0.2 0.8 0
27.05.2012 60 2 136 2 3.3 1.5 0 0
28.05.2012 5589 27 26498 27 0.5 0.1 0.5 0
29.05.2012 6240 108 27215 108 1.7 0.4 1.7 0
30.05.2012 5411 21 22569 21 0.4 0.1 0.4 0
31.05.2012 5911 15 23579 17 0.3 0.1 0.3 0
01/06/12 5139 12 20381 15 0.2 0.1 0.3 0
02/06/12 4626 21 19758 25 0.5 0.1 0.5 0
03/06/12 3094 10 11145 12 0.3 0.1 0.4 0
The Aedes indices within permissible levels in the Cheranmahadevi district where dengue positives had not been reported in May 2012 or June 2012
Date Houses
Checked
Houses
positive
with
Aedes
Larvae
Total
containers
checked Container
s positive
House
Index(HI)
%
Container
Index(CI)
% Breteau
Index(BI)
Positive
Dengue
cases
confirmed
by Ig-M
ELISA
04/06/12 5314 13 23097 13 0.2 0.1 0.2 0
05/06/12 5312 9 22613 10 0.2 0.0 0.2 0
06/06/12 5524 3 20880 3 0.1 0.0 0.1 0
07/06/12 5569 11 17548 13 0.2 0.1 0.2 0
08/06/12 5073 12 19772 12 0.2 0.1 0.2 0
09/06/12 4310 9 15811 10 0.2 0.1 0.2 0
10/06/12 2947 2 10433 2 0.1 0.0 0.1 0
11/06/12 5577 8 20929 8 0.1 0.0 0.1 0
12/06/12 5546 8 22586 8 0.1 0.0 0.1 0
13.06.2012 5381 9 21861 9 0.2 0.0 0.2 0
14.06.2012 5233 10 21395 11 0.2 0.1 0.2 0
15.06.2012 4897 8 19089 8 0.2 0.0 0.2 0
16.06.2012 5215 7 2066 7 0.1 0.3 0.1 0
Mean 0.50 0.17 0.37
Summary of the Study • In summary, the following study findings have been ascertained: • (1) the incubation of DENV in human is 4-14 days • (2) the presence of the heterogeneous serotype DENV leads to increased case fatality
rates in an epidemic; and
• (3) cyclic larval checkups are important as they can detect permissible threshold levels of Aedes indices and in turn help to stop dengue transmission within 15 days from the day of intervention when there is a significant level of commitments in all field staff.
• Above all, the NS1 ELISA is the tool which can be used for the early implementation of entomological interventions to reduce dengue complications in the community.
Further research Avenues from this study • Other than these findings, a new area of research has to be necessitated to
study the cross reaction of dengue virus in places where other flavi viruses are co-existing. Since the Cuddalore district was previously endemic for JE, vaccination with 14-14-2 live attenuated vaccine has been administered to children aged from 9.5 months to 1.5 years since 2008 after its inclusion in the routine national immunization program. Hence efforts need to be made to resolve the cross reaction between dengue and other flavi viruses during outbreaks, it is confirmed that this may give a new dimension to dengue diagnosis.
Acknowledgements • Authors are more indebted to the following for their
suggestion,encouragements,helps and financial assistance etc., • Deputy Directors of Health Services, Cuddalore, Nagapattinam and Thirunelveli • Honble’ Health minister of tamil Nadu,The secretary to the Government,
Health and Family welfare,The Director of Public Health & Preventive Medicine, Government of Tamil Nadu.
• Mr. Shanbu Kallolikar. IAS, Dr.Ralph Selvin, Joint Director, NRHM, Govt of India and the Director General, ICMR, Government of India for the sanction of the financial assistance.
• All staff of ZET for their helps in field activities to bring out this research.


![Dengue Fever/Severe Dengue Fever/Chikungunya Fever · Dengue fever and severe dengue (dengue hemorrhagic fever [DHF] and dengue shock syndrome [DSS]) are caused by any of four closely](https://static.documents.pub/doc/80x56/5e87bf3e7a86e85d3b149cd7/dengue-feversevere-dengue-feverchikungunya-dengue-fever-and-severe-dengue-dengue.jpg)


