Study on the effectiveness of personal cooling equipment for protecting workers from heat stroke while working in a hot environment 1 st lab test 5 Dec, 2012 Del P. WONG, Guo Yueping, Jackio Yang Report 15
Transcript
Study on the effectiveness of personal cooling equipment for
protecting workers from heat stroke while working in a hot environment
1st lab test
5 Dec, 2012Del P. WONG, Guo Yueping, Jackio Yang
Report 15
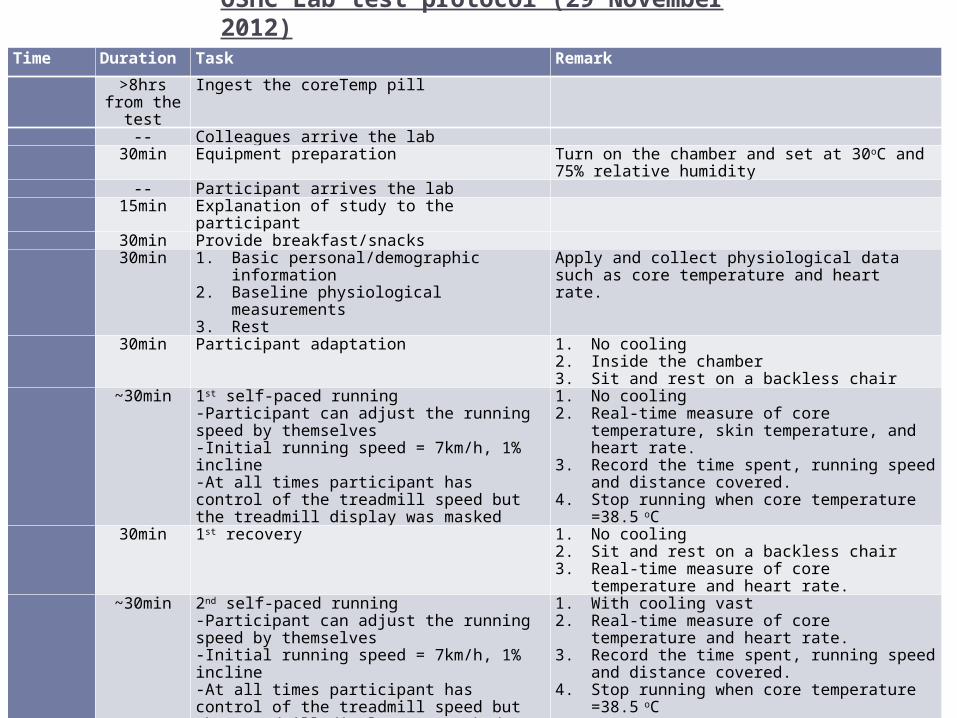
OSHC Lab test protocol (29 November 2012)
Time Duration Task Remark
>8hrs from the test
Ingest the coreTemp pill
-- Colleagues arrive the lab 30min Equipment preparation Turn on the chamber and set at 30oC and 75%
relative humidity -- Participant arrives the lab 15min Explanation of study to the participant 30min Provide breakfast/snacks 30min 1. Basic personal/demographic information
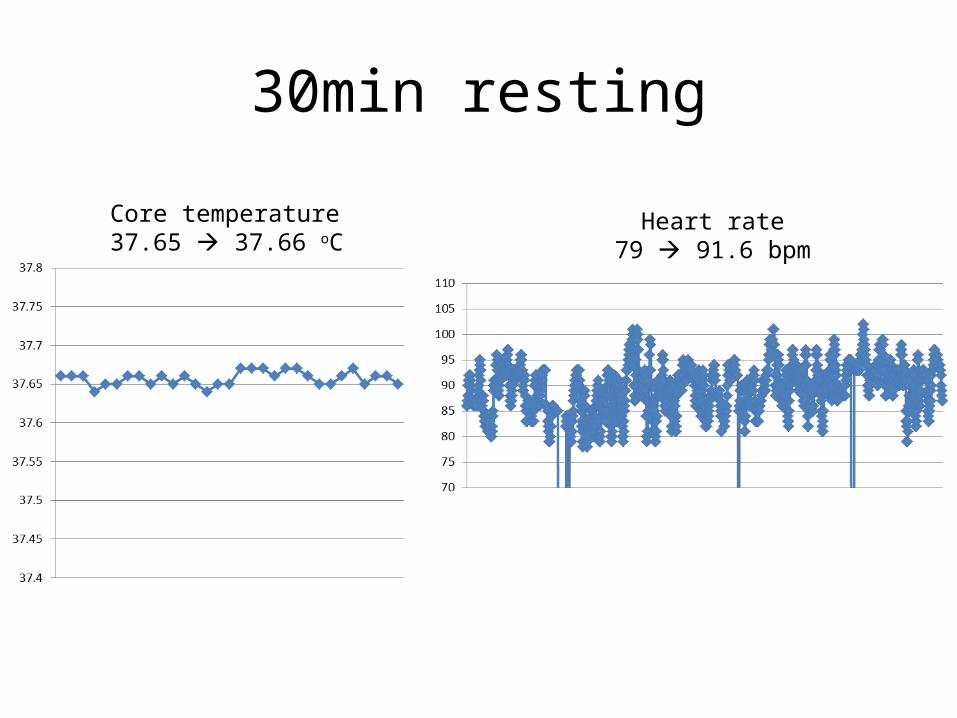
2. Baseline physiological measurements3. Rest
Apply and collect physiological data such as core temperature and heart rate.
30min Participant adaptation 1. No cooling 2. Inside the chamber3. Sit and rest on a backless chair
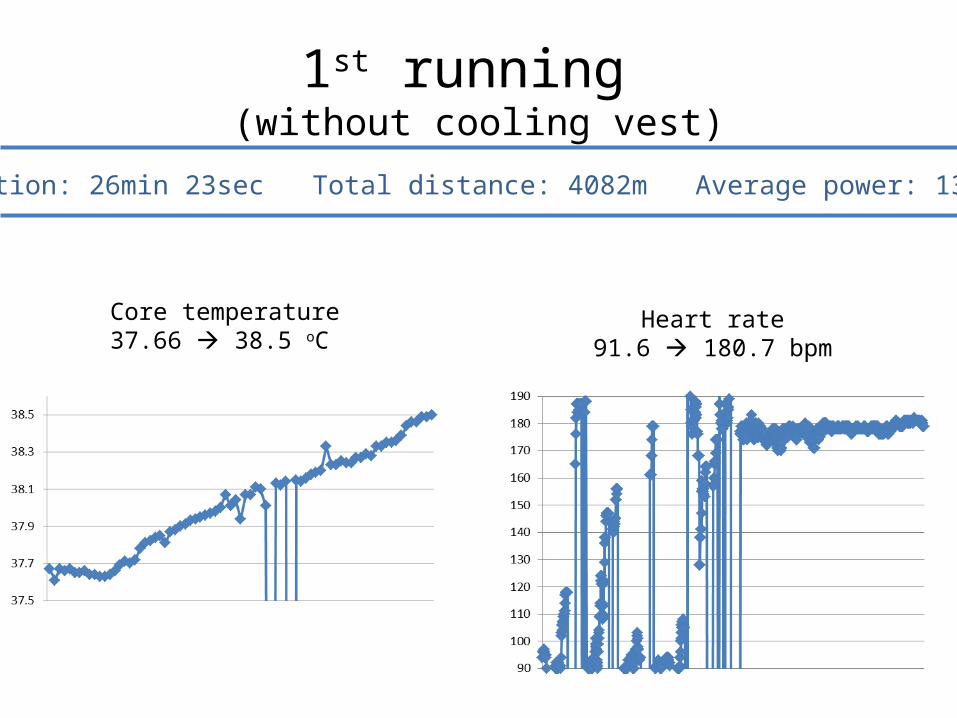
~30min 1st self-paced running-Participant can adjust the running speed by themselves-Initial running speed = 7km/h, 1% incline-At all times participant has control of the treadmill speed but the treadmill display was masked
1. No cooling 2. Real-time measure of core temperature, skin
temperature, and heart rate.3. Record the time spent, running speed and
distance covered. 4. Stop running when core temperature =38.5 oC
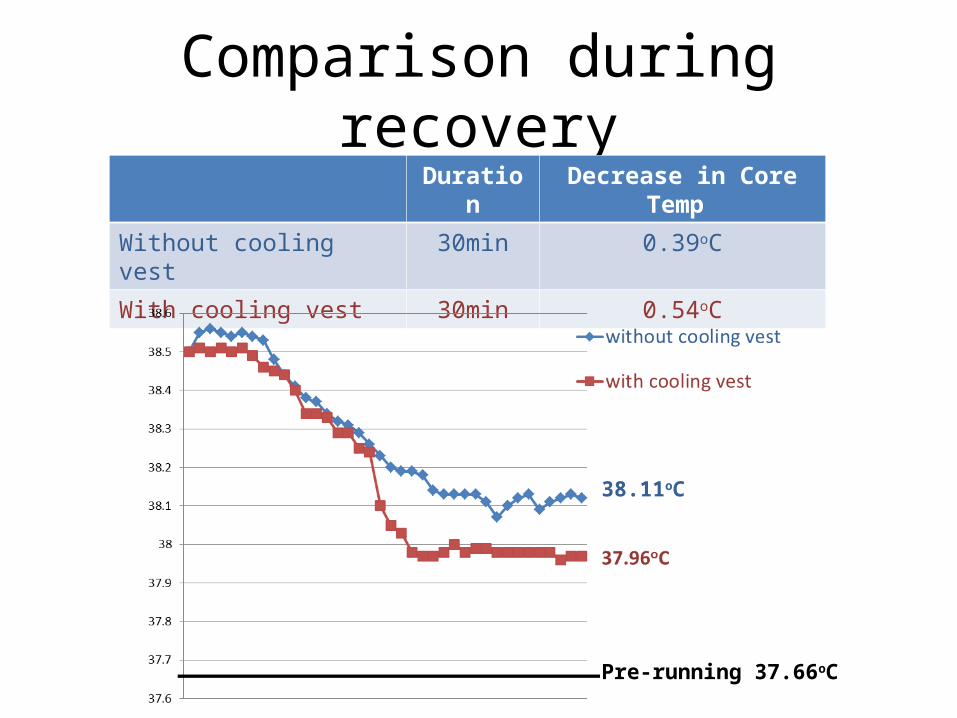
30min 1st recovery 1. No cooling2. Sit and rest on a backless chair3. Real-time measure of core temperature and
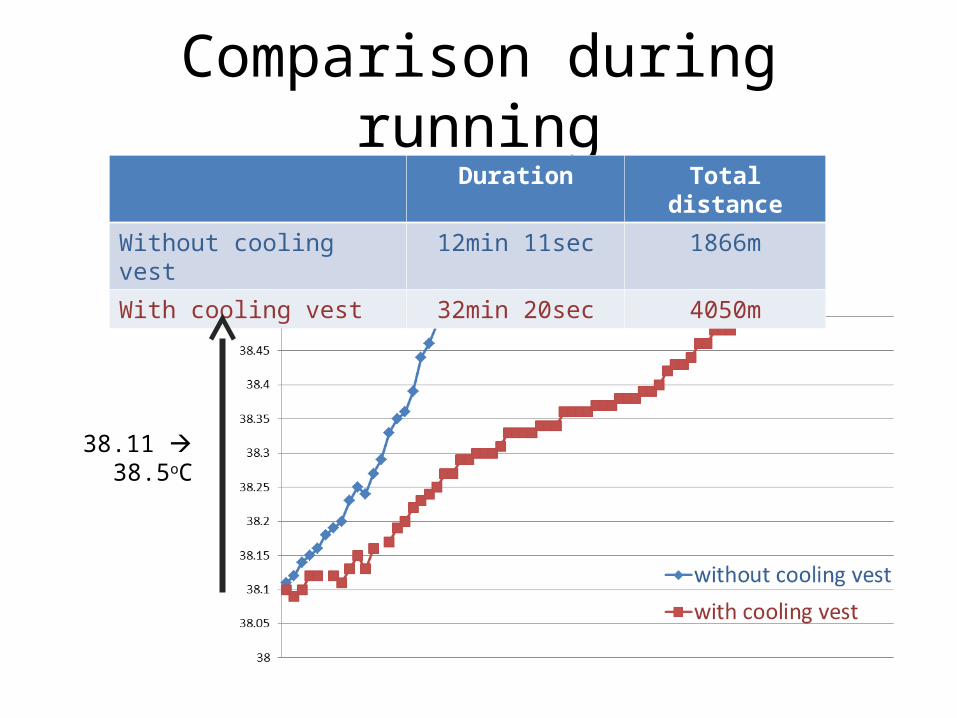
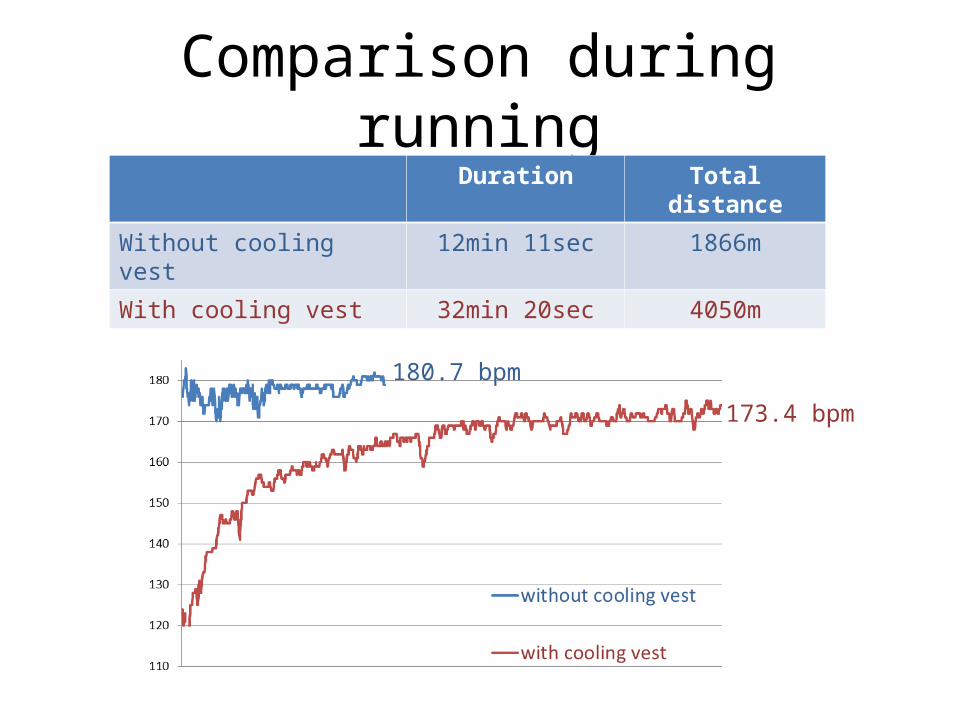
heart rate. ~30min 2nd self-paced running
-Participant can adjust the running speed by themselves-Initial running speed = 7km/h, 1% incline-At all times participant has control of the treadmill speed but the treadmill display was masked
1. With cooling vast2. Real-time measure of core temperature and
heart rate.3. Record the time spent, running speed and
distance covered. 4. Stop running when core temperature =38.5 oC
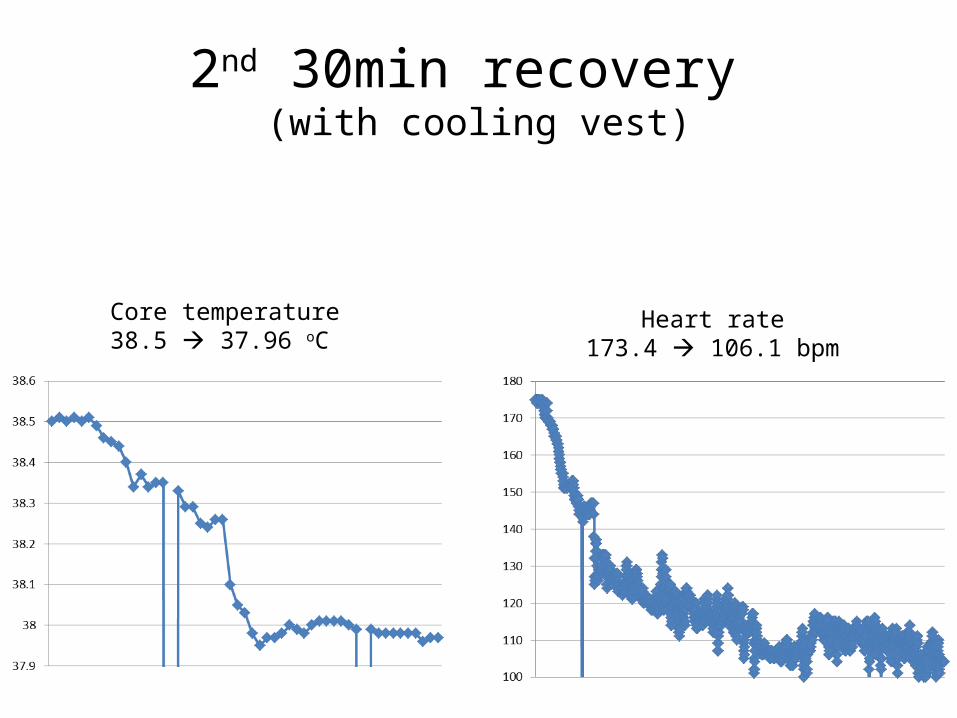
30min 2nd recovery 1. With cooling vast2. Sit and rest on a backless chair3. Real-time measure of core temperature and
heart rate. Done
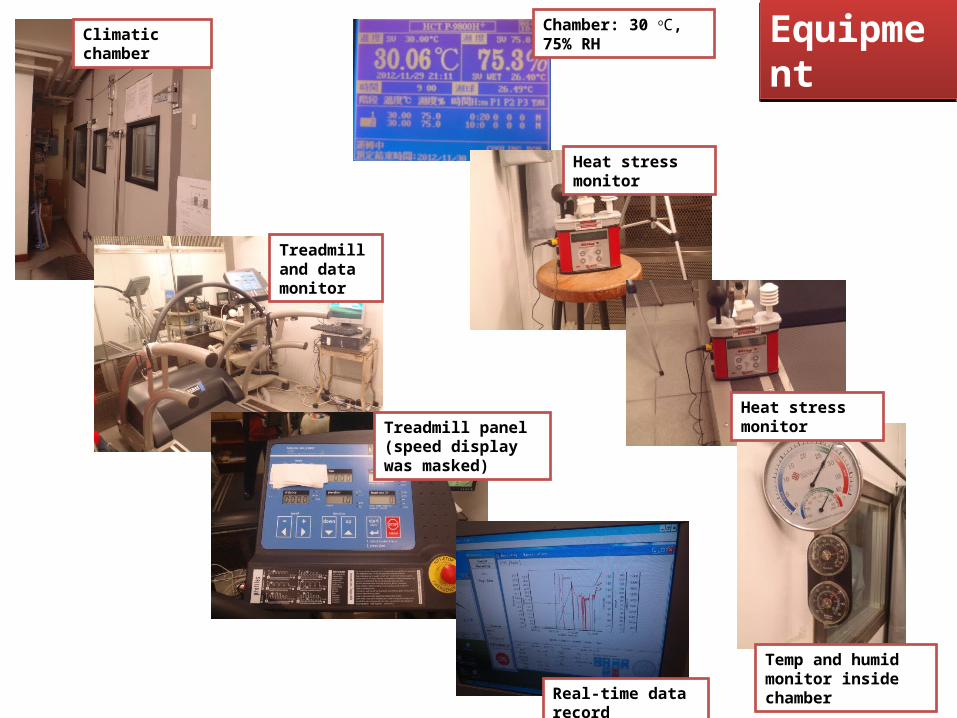
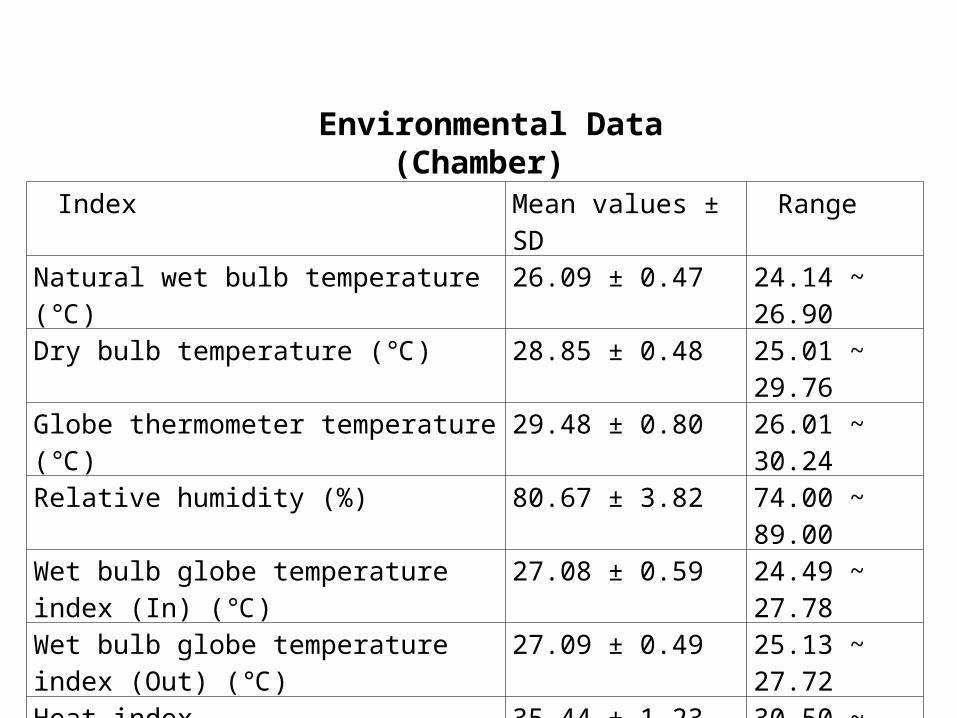
Climatic chamber
Treadmill and data monitor
Treadmill panel (speed display was masked)
Real-time data record
Chamber: 30 oC, 75% RH
Heat stress monitor
Heat stress monitor
Temp and humid monitor inside chamber
EquipmentEquipment
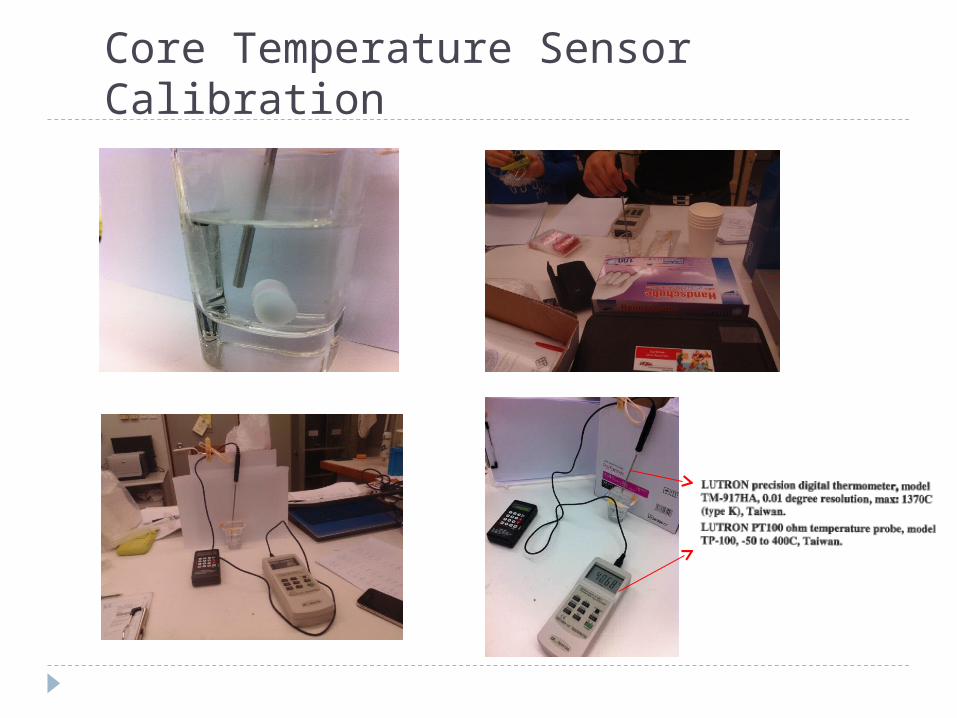
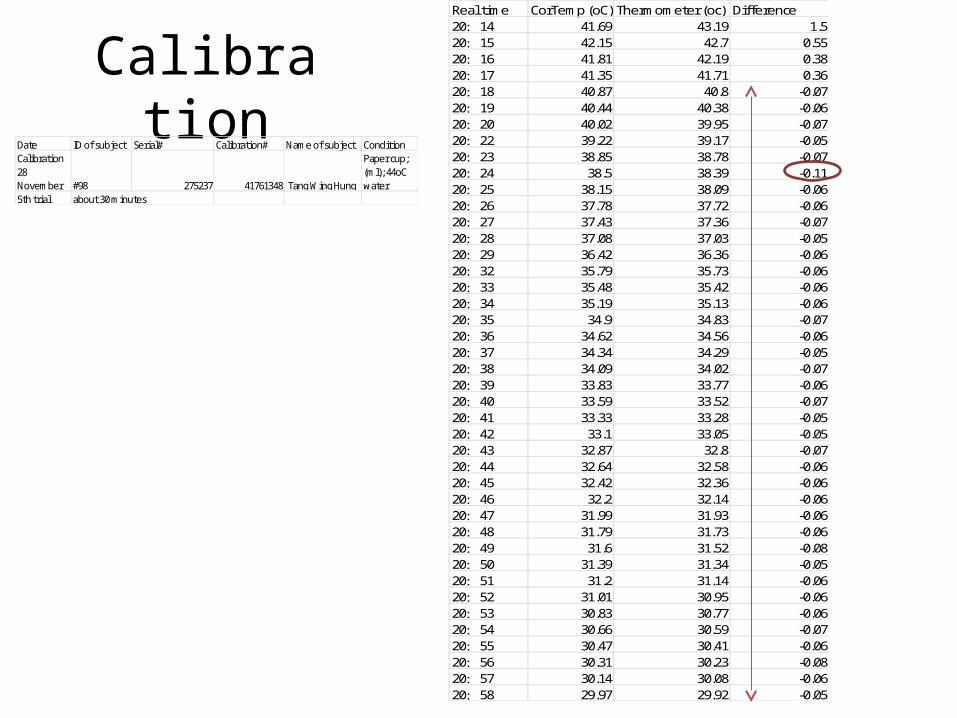
Core Temperature Sensor Calibration
CalibrationDate ID of subject Serial# Calibration# Name of subject ConditionCalibration 28 November #98 275237 41761348 Tang Wing Hung
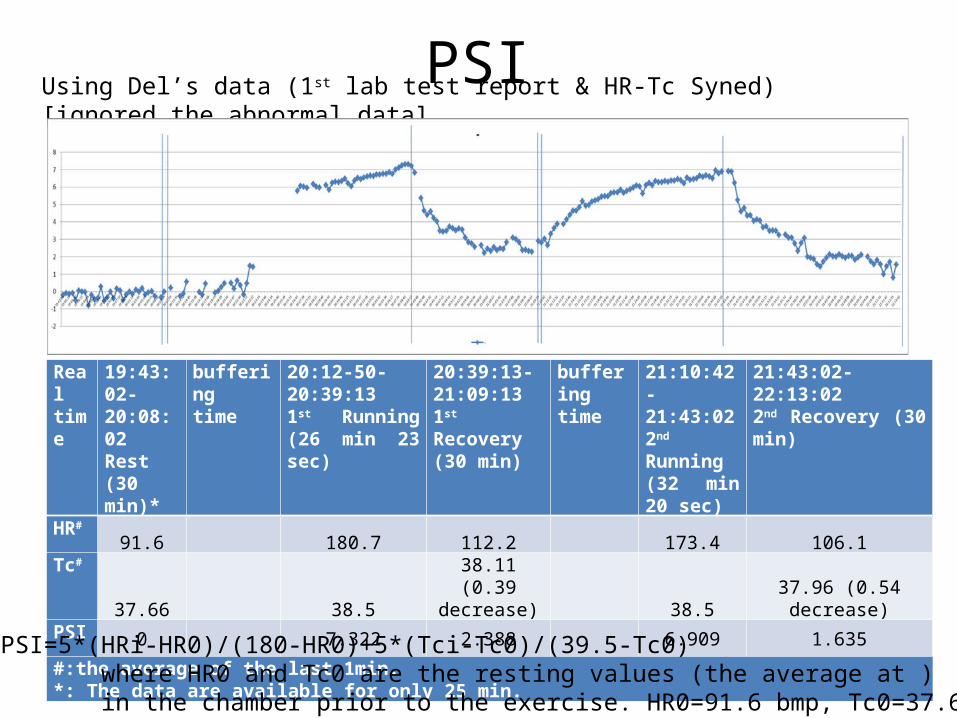
#:the average of the last 1min.*: The data are available for only 25 min.
Using Del’s data (1st lab test report & HR-Tc Syned) [ignored the abnormal data]
Formula: PSI=5*(HRi-HR0)/(180-HR0)+5*(Tci-Tc0)/(39.5-Tc0) where HR0 and Tc0 are the resting values (the average at ) in the chamber prior to the exercise. HR0=91.6 bmp, Tc0=37.66 oC
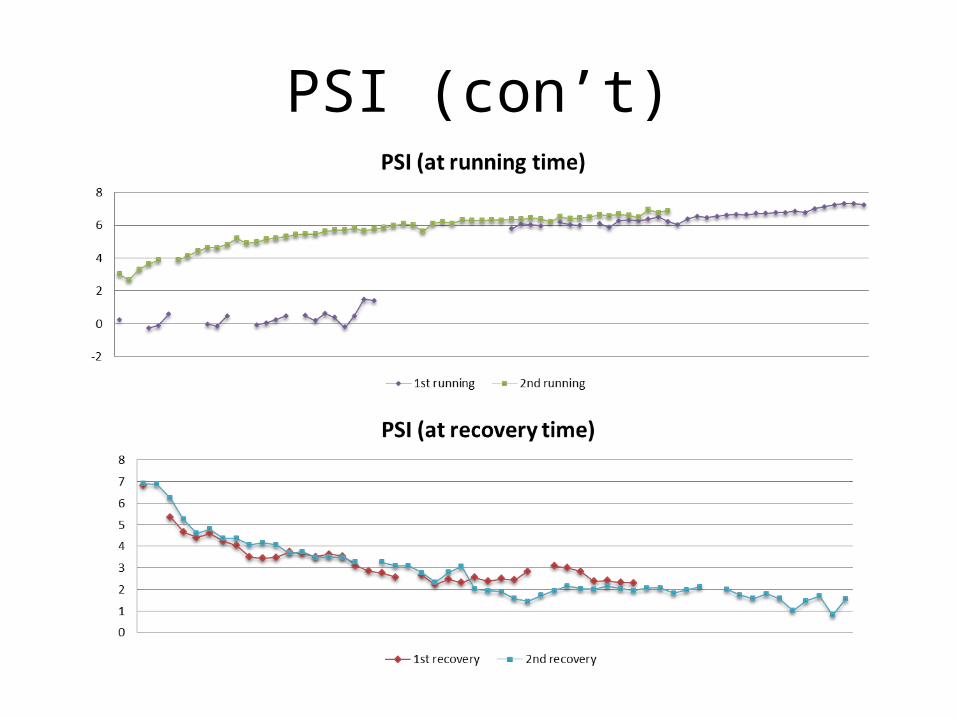
PSI (con’t)
Discussion for some issues
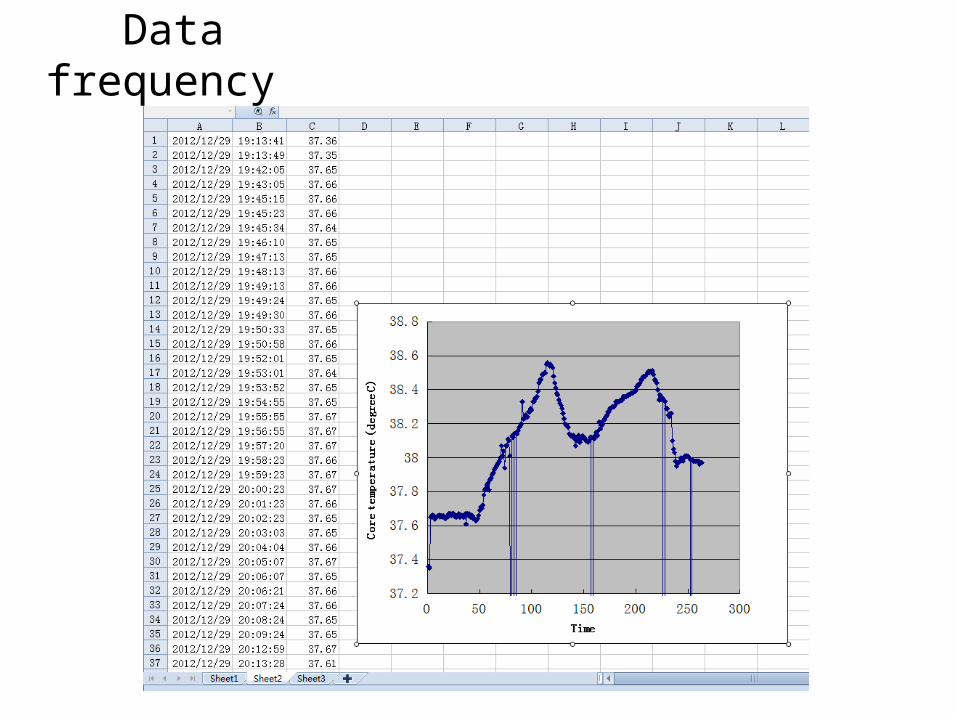
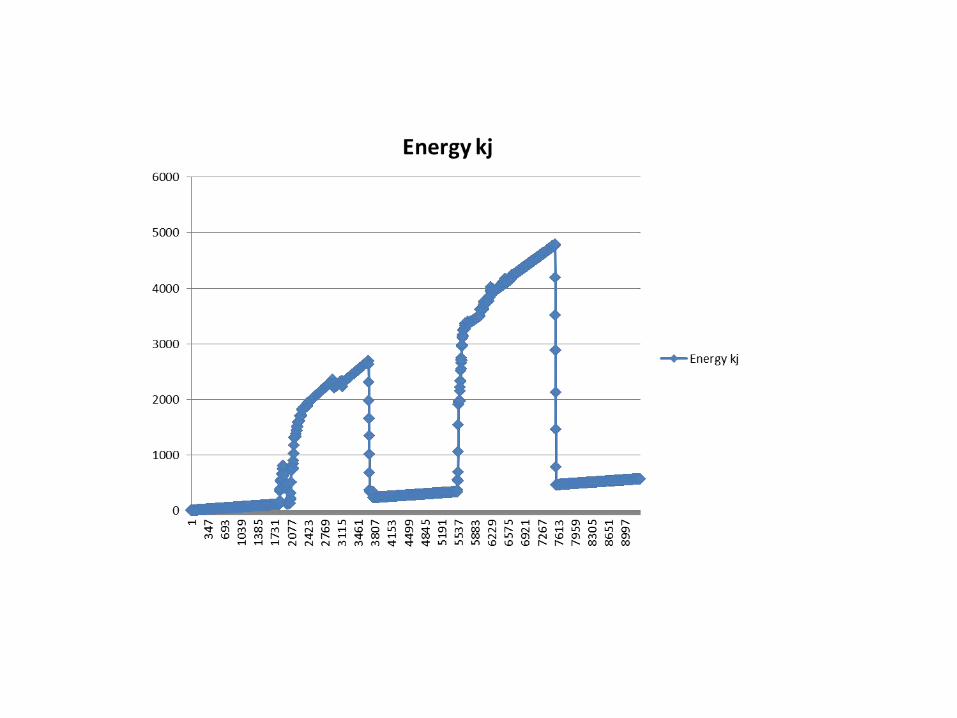
Data frequency
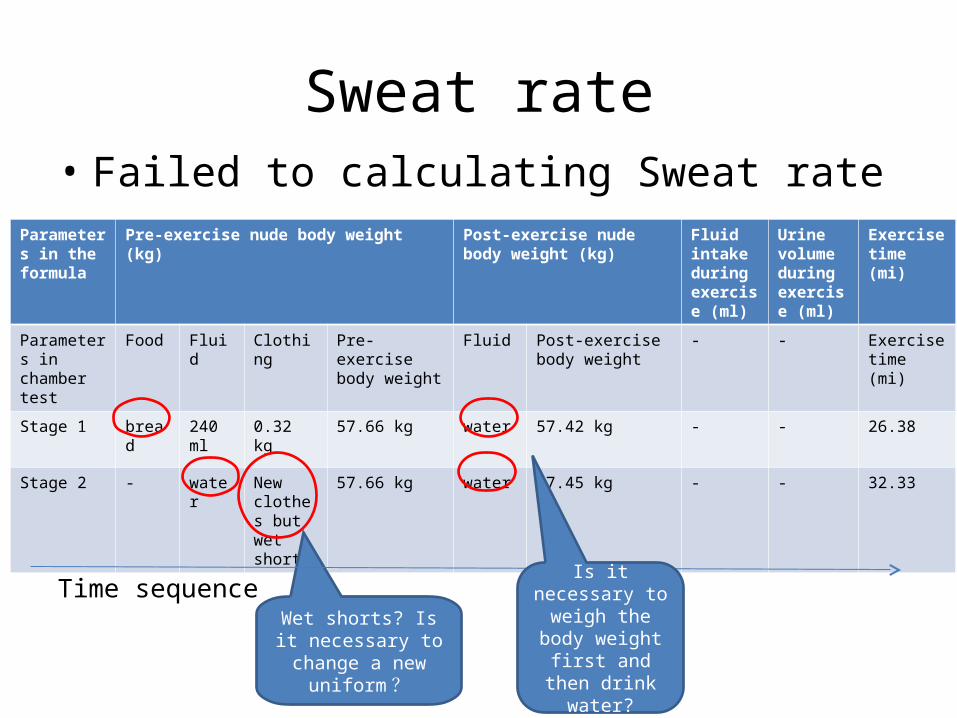
Sweat rate• Failed to calculating Sweat rate
Time sequence
Parameters in the formula
Pre-exercise nude body weight (kg) Post-exercise nude body weight (kg)
Fluid intake during exercise (ml)
Urine volume during exercise (ml)
Exercise time (mi)
Parameters in chamber test
Food Fluid Clothing Pre-exercise body weight
Fluid Post-exercise body weight
- - Exercise time (mi)
Stage 1 bread 240 ml 0.32 kg 57.66 kg water 57.42 kg - - 26.38
Stage 2 - water New clothes but wet shorts
57.66 kg water 57.45 kg - - 32.33
Wet shorts? Is it necessary to change a
new uniform?
Is it necessary to weigh the body weight first and
then drink water?
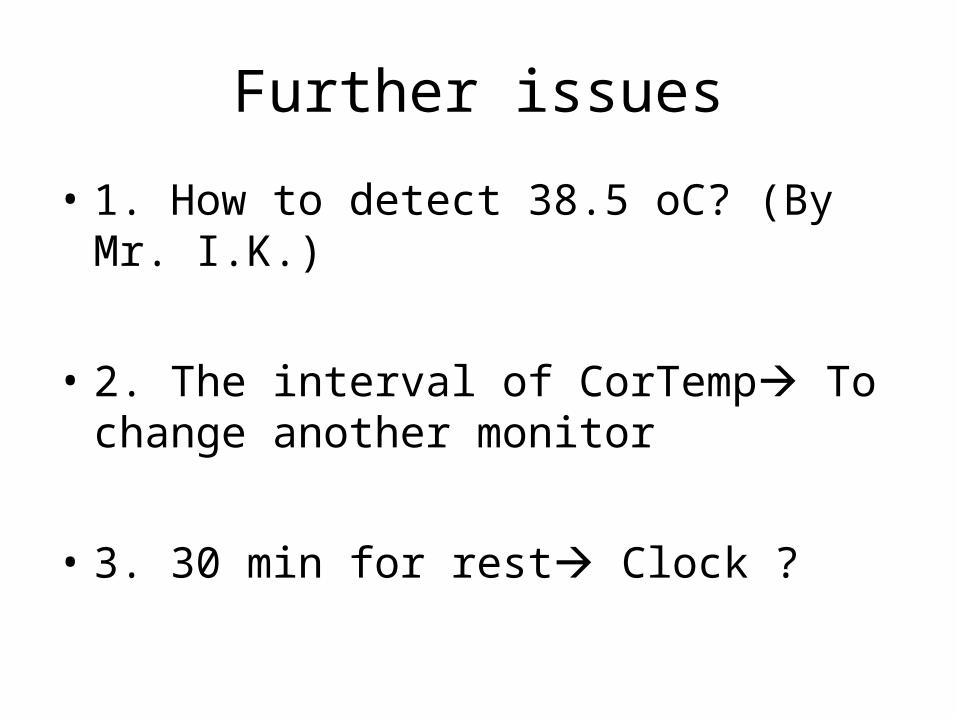
Further issues
• 1. How to detect 38.5 oC? (By Mr. I.K.)
• 2. The interval of CorTemp To change another monitor