484 STUDY ON THE INFLUENCE OF ENVIRONMENTAL CONDITIONS FROM GREENHOUSE ON THE ACCUMULATION OF VEGETATIVE MASS AND FRUCTIFICATION IN SOME VARIETIES OF CHERRY TOMATOES Ovidiu Ionuț JERCA 1 , Elena Maria DRĂGHICI 2 , Sorin Mihai CÎMPEANU 3 , Răzvan Ionuț TEODORESCU 4 , Jeni ȚIU 4 , Sorina PETRA 2 , Liliana BĂDULESCU 1, 2 1 Research Center for Studies of Food Quality and Agricultural Products, University of Agronomic Sciences and Veterinary Medicine of Bucharest, 59 Mărăști Blvd, District 1, Bucharest, România 2 University of Agronomic Sciences and Veterinary Medicine of Bucharest, Faculty of Horticulture, 59 Mărăști Blvd, District 1, Bucharest, România 3 University of Agronomic Sciences and Veterinary Medicine of Bucharest, Faculty of Agriculture, 59 Mărăști Blvd, District 1, Bucharest, România 4 University of Agronomic Sciences and Veterinary Medicine of Bucharest, Faculty of Land Reclamation and Environmental Engineering, 59 Mărăști Blvd, District 1, Bucharest, România Corresponding author email: [email protected]Abstract: The preliminary study was carried out in Hortinvest greenhouses on two varieties of cherry tomatoes, ‘Flaviola’ and ‘Cheramy’ F. The environmental factors in the greenhouse, temperature, atmospheric humidity, CO2 concentration inside the greenhouse during January-March were registered. Also, the obtained productions and the vegetative mass of the leaves were registered. We found that for the ‘Flaviola’ variety, the temperature had a greater influence on the production compared to the ‘Cheramy’ variety. We noticed that each variety reacted differently both in terms of temperature and CO2 values. The accumulated vegetative mass was higher in ‘Cheramy F1’ compared to ‘Flaviola’, this being a genetic characteristic of the variety. The percentage of fruits obtained per plant was 54.75% and only 45.25% of the vegetative mass in ‘Cheramy F1’. For the ‘Flaviola’ variety, the percentage of fruit was 60.64% and 39.36% vegetative mass. The aim of the study was to analyse the behaviour of some varieties on total production. Key words: tomatoes, cerise, cultivars, substrate. INTRODUCTION Currently, the production of tomatoes in the greenhouse is constantly growing due to the application of new high-performance technologies that ensure very high yields. At the same time, consumers are looking for quality fruits, of different sizes, shapes, colors and with specific flavors. In greenhouses, were grown mainly, varieties with large, spherical fruit, but now are increasingly appreciated tomatoes with cherry fruits (Lycopersicon esculentum var. cerasiforme), due to their aroma, content also balanced in carbohydrates and vitamin C and ornamental effects (Dinu et al., 2015). Another aspect regarding the extension of cherry tomatoes in the culture is their high price but also the ability to better adapt to variations in environmental factors. In the greenhouse, one of the important objectives is to reduce the temperatures in the growing space, especially in periods of strong sunshine and to maintain values corresponding to obtaining high and quality yields. Studies have shown that high greenhouse temperatures influence productivity but also nutritional quality (Bitaand and Gerats, 2013; Adams et al., 2001). The use of shading screens can reduce the temperature inside of greenhouses, but if they are not supported by other air conditioning systems, they reduce their efficiency, leading to the compromise of tomato cultivation. Tomatoes are very pretentious of temperature. Temperatures below 10°C block the growth of plants and the phenomenon manifests itself in the form of short knotting of the growth tips and the size of the leaf petiole decreases. Scientific Papers. Series B, Horticulture. Vol. LXV, No. 1, 2021 Print ISSN 2285-5653, CD-ROM ISSN 2285-5661, Online ISSN 2286-1580, ISSN-L 2285-5653
Transcript
484
STUDY ON THE INFLUENCE OF ENVIRONMENTAL CONDITIONS FROM GREENHOUSE ON THE ACCUMULATION OF VEGETATIVE MASS AND FRUCTIFICATION IN SOME VARIETIES OF CHERRY
TOMATOES
Ovidiu Ionuț JERCA1, Elena Maria DRĂGHICI2, Sorin Mihai CÎMPEANU3, Răzvan Ionuț TEODORESCU4, Jeni ȚIU4,
Sorina PETRA2, Liliana BĂDULESCU1, 2
1Research Center for Studies of Food Quality and Agricultural Products, University of Agronomic Sciences and Veterinary Medicine of Bucharest, 59 Mărăști Blvd, District 1, Bucharest, România
2University of Agronomic Sciences and Veterinary Medicine of Bucharest, Faculty of Horticulture, 59 Mărăști Blvd, District 1, Bucharest, România
3University of Agronomic Sciences and Veterinary Medicine of Bucharest, Faculty of Agriculture, 59 Mărăști Blvd, District 1, Bucharest, România
4University of Agronomic Sciences and Veterinary Medicine of Bucharest, Faculty of Land Reclamation and Environmental Engineering, 59 Mărăști Blvd, District 1, Bucharest, România
Abstract: The preliminary study was carried out in Hortinvest greenhouses on two varieties of cherry tomatoes, ‘Flaviola’ and ‘Cheramy’ F. The environmental factors in the greenhouse, temperature, atmospheric humidity, CO2 concentration inside the greenhouse during January-March were registered. Also, the obtained productions and the vegetative mass of the leaves were registered. We found that for the ‘Flaviola’ variety, the temperature had a greater influence on the production compared to the ‘Cheramy’ variety. We noticed that each variety reacted differently both in terms of temperature and CO2 values. The accumulated vegetative mass was higher in ‘Cheramy F1’ compared to ‘Flaviola’, this being a genetic characteristic of the variety. The percentage of fruits obtained per plant was 54.75% and only 45.25% of the vegetative mass in ‘Cheramy F1’. For the ‘Flaviola’ variety, the percentage of fruit was 60.64% and 39.36% vegetative mass. The aim of the study was to analyse the behaviour of some varieties on total production. Key words: tomatoes, cerise, cultivars, substrate. INTRODUCTION Currently, the production of tomatoes in the greenhouse is constantly growing due to the application of new high-performance technologies that ensure very high yields. At the same time, consumers are looking for quality fruits, of different sizes, shapes, colors and with specific flavors. In greenhouses, were grown mainly, varieties with large, spherical fruit, but now are increasingly appreciated tomatoes with cherry fruits (Lycopersicon esculentum var. cerasiforme), due to their aroma, content also balanced in carbohydrates and vitamin C and ornamental effects (Dinu et al., 2015). Another aspect regarding the extension of cherry tomatoes in the culture is their high price but also the ability to better adapt to variations in environmental factors.
In the greenhouse, one of the important objectives is to reduce the temperatures in the growing space, especially in periods of strong sunshine and to maintain values corresponding to obtaining high and quality yields. Studies have shown that high greenhouse temperatures influence productivity but also nutritional quality (Bitaand and Gerats, 2013; Adams et al., 2001). The use of shading screens can reduce the temperature inside of greenhouses, but if they are not supported by other air conditioning systems, they reduce their efficiency, leading to the compromise of tomato cultivation. Tomatoes are very pretentious of temperature. Temperatures below 10°C block the growth of plants and the phenomenon manifests itself in the form of short knotting of the growth tips and the size of the leaf petiole decreases.
(Gertsson, 1992; Luxhoi, et al., 2007; Grimstad, 1993; Heuvelink and Dorais, 2018). The negative effect is even more obvious in conditions of insufficient light (Pescar Svetlana, 2013). At temperatures above 40°C, plant turgidity decreases, followed by wilting and drying of growth tips. The optimum temperature range for growth and fruiting is 18-32°C but at temperatures above 35°C pollen viability decreases. Hussainet et al. (2001) cited by Abdelmageed and Gruda (2009) says that the number of fruits per plant and the percentage of fruits was lower due to the high temperature. Temperatures of 15-16°C during the formation of flowers, for long periods, determine abundant flowering, the flowers can remain open on the plant for several weeks but without forming fruit, the flowers are larger and the inflorescence branches a lot. Also, temperatures below 10 °C during flowering can affect pollination but can also cause fruit cracking and affect fruiting. Temperatures above 35 °C during the ripening period of fruits negatively influence their coloration due to the reduction of the synthesis of red pigment (lycopene) and the increase of the synthesis of yellow pigment (carotene). Zhang et al., 2012, state that exposure of tomato plants to an extremely high temperature of 35°C for eight hours reduced the rate of photosynthesis. Another phenomenon that can occur during the physiological maturation of fruits is due to the maintenance in the greenhouse of low temperatures of 15-18oC day and night, below the recommended temperature of 20-24oC during the day and 18oC at night but also of a low level of potassium in the nutritional recipe. In this situation, the fruits have an inappropriate appearance, they give the impression of fruits that have not reached physiological maturity, but if we cut a fruit, it is found that the seeds are already sprouted. Large differences between day and night temperatures can increase the period of fruit growth (Van der Ploeg and Heuvelink, 2005), however, a large difference results in a more generative increase (Heuvelink, 1989; Peet and Welles, 2005 quoted by Noemi et al., 2014). Temperatures below 10oC inhibit vegetative
growth, delay fruit ripening, and those above 35°C inhibit fruiting, fruit development and coloration. Zhang et al., 2012, state that exposure of tomato plants to an extremely high temperature of 35°C for eight hours reduced the rate of photosynthesis Temperatures above 22°C correlated with high atmospheric humidity above 80% create optimal conditions for the development of the pathogen Clodosporium fulvum, and at temperatures below 15°C and relative air humidity above 75% create optimal conditions for the attack of Phytophtora infestans. Greenhouses and hight tunnels capture solar radiation so that, especially in summer, the temperature inside the culture space increases, creating the greenhouse effect. Ventilation systems eliminate excessive heat and ensure adequate conditions for the growth and development of tomato plants. Modern greenhouses have computerized operating systems that monitor all plant growth parameters. Even in low light conditions, increasing the CO2 content during the reproduction phase induces early flowering and fruit formation (Grouda, 2005; Sima et al., 2011), increases the net assimilation rate, plants can photosynthesize more at concentrations higher levels of CO2 (Heuvelink and Dorais, 2005; Grouda, 2005; Singh, et al., 2005; Sima et al., 2011). Additional CO2 fertilizations of up to 800-100 ppm can be performed in the greenhouse. In professional greenhouses, of the latest generation, all environmental factors can be monitored, that is essential for achieving high yields. Also, the light factor can be easily controlled and we can provide the necessary in the culture space, especially in the autumn-winter or spring periods. Low light intensity, short photoperiods and high night temperatures can be important limiting factors for fruit formation (Wittwer and Honma, 1986). Supplementing light in greenhouses is nece-ssary especially in periods of strong cloudiness, but also in autumn when the number of lighting hours decreases (Panțer et al., 2016). Another factor that we must take into account and which in modern greenhouses can be well controlled is atmospheric humidity. It is known that both low and very high atmospheric humidity affect pollination. Also,
486
the very high atmospheric humidity correlated with the lack of aerations determines the appearance of adventitious roots on the stem in some varieties. The work of removing the leaves must be done with great caution (Buitelaar and Janse, 1987; Buitelaar, 1989; Xiao et al., 2004). The assortment grown in the greenhouse must be chosen according to the specific requirements of the cultivars. In terms of nutrients, they can be well monito-red, they are used effectively on phenophases. Tomatoes intensively capitalize on mineral resources (Dinu et al., 2019; Dinu et al, 2015; Kostadinov, 2020). Numerous studies on fruit yield at the end of the crop (Papadopoulos and Ormrod, 1991), De Koning, (1990b) (quoted by Heuvelink, 1996) have shown that 74.3% of the total fresh mass of the plant is the fruit and only 23.7% vegeta-tive mass (stem and leaves). Kleinhenz et al. (2006) obtained a different plant biomass depending on the plant density, this being 16-19% with 13% higher in the case of driving on two stems. The EC of the solution is well monitored as well as the amount of nutrient solution. Moreover, the nutrient solution resulting from the drain is recovered, rebalanced, disinfected and reused. The temperature of the nutrient solution reached in the culture substrate is distributed at values of 20oC, with a direct effect on tomato production. Also, the pH of the nutrient solution can be controlled and maintained constantly at values in accordance with the nutritional recipe. Regarding the culture substrates, organic sub-strates (coconut, peat, compost, etc.) or inorga-nic substrates (mineral wool, perlite, vermicu-lite, zeolite, etc.) can be used depending on the geographical area. When choosing the type of substrate, their characteristics and physical properties must be taken into account: total porosity; substrate density; water retention capacity; be able to drain the solution. From a chemical point of view, the substrate must not interact with the nutrient solution, nor must it solubilize or favor the transfer process (Jerca et al., 2015; Drăghici et al., 2019). All these aspects lead to the support of modern cultivation technologies in a soilless system. Regarding the cultivated assortment, hybrids
with both large fruit of over 120 g/fruit and a cherry-type assortment are chosen, especially very appreciated by consumers. In the present study we analysed the behaviour of some cherry tomatoes in greenhouse conditions on perlite substrate. I used these crops because they have very high plasticity although they are intended for soil crops. MATERIALS AND METHODS The study was carried out within the Hortinvest research greenhouses, which belong to the Research Center for quality control of horticultural products, Faculty of Horticulture, USAMV Bucharest. The greenhouses are modern constructions with high of 6.2 m, and which are equipped with all the facilities for monitoring and maintaining the climatic factors in the greenhouse. We used as biological material 2 cultivars of cherry ‘Cheramy F1’ (V1) type tomatoes and a Romanian variety, ‘Flaviola’ (V2), created at the Buzău Vegetable Research Station. The culture was established in a soilless system, on mattresses filled with perlite with a grain size of 4 mm from SC Perlit SA, Ilfov County. The duration of the experiment was 90 days. I watched the parameters of vegetative growth in height, number of leaves and fruiting. We determined the number of inflorescences as well as the number of fruits in the inflores-cence. Fruit production per plant was weighed. We recorded throughout the experiment the values of temperature, relative humidity through sensors located at a height of 1.5 m inside the greenhouse. ‘Cheramy F1’ is an early-maturing hybrid with undetermined growth. The fruits are of the cherry type, around 15 g/fruit ‘Flaviola’ variety presented an indeterminate vegetative growing, with fruit cherry type, recommended to crops in protected area. The temperatures from greenhouse were recorded daily during 24 hours, day and night, for 90 days also light radiation, atmospheric humidity and CO2 concentration. During the vegetation was recorded the total amount of vegetative mass (leaves and stem) as well as the amount of fruits harvested during the entire period under observation (1 January-30 March 2021).
487
The area cultivated with tomatoes in the greenhouse was 160 m2. A number of 154 plants of ‘Cheramy F1’ and 101 plants of the ‘Flaviola’ variety were analysed. The data were recorded and correlated to see the influence of environmental factors in the greenhouse on the production and accumulation of vegetative mass. RESULTS AND DISCUSSIONS The recorded data showed that in January the minimum and maximum values of light radia-tion were between 77.69 W/m2 and 649.29 W/m2. During this period, the plants were in the phenophase of vegetative growth and beginning of formation but also of fruit maturation. In February, the value of the recorded radiation showed higher values compared to January, being between 788.78 W/m2 and 864.07 W/ m2. During this period, tomato plants were found both in the phenophase of fruit growth as well as in that of intense maturation. In March, the values of solar radiation also increased with the increase of the lighting duration, reaching in some days, minimum values of 127.5 W/m2 and 162 W/m2 and maximum values of 611 W/m2 respectively 967.13 W/m2, and for short periods at 1132.75 W/m2 (Figures 1-3).
Figure 1. Solar radiation recorded in the greenhouse in
January
Figure 2. Solar radiation recorded in the greenhouse in
February
Figure 3 Solar radiation recorded in the greenhouse in
March Analysing the environmental factors in the greenhouse, between January 1 and March 30, 2021, we found that the temperature values were different both from one month to another and during one day (24 hours). The temperature values registered outside the greenhouse, throughout the study period, reached in January minimum values of -6.91oC and maximum values of 12.48oC. In February, outside the greenhouse, were recorded negative temperatures from February 10 to February 25. The lowest values were between -7.88oC and -0.3oC. In the rest of the period, only positive temperatures of over 20.47oC were recorded. In March, were recorded, only for short periods, negative outdoor temperatures of -0.5oC or -2.1oC and temperature maximums of 17.9oC (Figures 4-6).
Figure 4. The temperature recorded in the greenhouse in
January
Figure 5. The temperature recorded in the greenhouse in
February
77,69
649,29
0200400600800
Radi
atio
n (W
/m2 )
January 2021
788,78 864,07
0
500
1000
Radi
atio
n (W
/m2)
February 2021
162,87
928,13 967,07611,44127,5
1132,75
0
1000
2000
Radi
atio
n (W
/m2)
March 2021
-7,88
13,9
-10-505
101520
Tem
pera
ture
(°C
) January 2021
-7,8
20,47
-10
0
10
20
30
Tem
pera
ture
(°C
) C
488
Figure 6. The temperature recorded in the greenhouse in
March În January, the lowest minimum temperatures recorded in the greenhouse were 14.8oC and 15.3oC, respectively. During the rest of the period, the temperatures ranged between 18oC and 22.5oC, depending on the temperature accumulations during the day. The maximum of temperatures recorded in the greenhouse reached values of over 24.9oC to 33.1oC in direct correlation with solar radiation (Figure 7).
Figure 7. Minimum, maximum and average temperatures
recorded daily in the greenhouse in January In February, during a 24-hour day, average daily temperatures were recorded, between 22oC around 1 AM and 26.3oC around 6 PM. Also, during the day the temperatures reached average values of 17.02oC to 23.3oC and maximums of 32.98oC (Figure 8; Table 1).
Figure 8. Average daily temperatures recorded in
February 2021
Table 1. Average, minimum and maximum monthly temperatures recorded during 24 hours as well as the sum
We can remark that for the analysed period we found that the maximum temperatures recorded in the greenhouse reached values of 32.9oC in January, 33.5oC in February and 37.25oC in March. Very high values correlate with high values of external light intensity. Taking into account the optimal values regarding the requirements of the species, in our case tomatoes, were affected the physiological processes of the species determining to the acceleration of fruit ripening and stopping vegetative growth (Table 2). Regarding the average daily temperatures recorded during January-March, we found that, in January, the temperatures varied between 19.9oC and 27.7oC, in February between 21.88oC and 26.29oC. If we compare with the average recommended temperatures for vegetative growth of 20.5oC (23oC during the day and 18oC at night) and 21oC for fruiting (24oC during the day and 18oC at night), we noticed that very high temperatures influenced the production of fruits but also the duration up to until their ripening, shortening it (Figure 9).
17,9
-0,5 -2,1-0,1
16,68
-10
0
10
20Te
mpe
ratu
re (°
C) March 2021
24,9
33,1
14,815,3
25,5
19,9
27,7
14,0
19,0
24,0
29,0
34,0
1 3 5 7 9 11 13 15 17 19 21 23 25 27 29 31
oC
maximminimmedia
21,00
23,00
25,00
27,00
0 2 4 6 8 10 12 14 16 18 20 22
22,00
26,30
Titlu
axă
489
Table 2. Maximum temperatures recorded in January,
Figure 9. Average daily temperatures for January and
February Another factor that influences plant biology is atmospheric humidity. In the case of growing tomatoes in the greenhouse, we found that the atmospheric humidity in the growing space varied during the day, which was correlated with light intensity and temperature values. It ranged from 35% to 87% in January, from 30% to 78% in February and from 25 to 80% in March. In the first part of the day, in the morning, higher values were recorded (Figures 10-12).
Table 3. Difference between maximum and minimum temperature
Regarding CO2, its beneficial effect is known. Inside the greenhouse, in January, we found minimum values of 120.38 ppm and 1250.31 ppm in the morning, but in general the CO2 concentration was around 400 ppm (Figure 13).
Figure 13. CO2 concentration in greenhouses in January In February, CO2 values ranged from 187.45 ppm to 1186.38 ppm (morning). In general, the CO2 concentration was within the physiological limits for the vegetative growth and fruiting of tomatoes (Figures 14 and 15). In March we found normal values that ranged between 216.52 ppm and 720.06 ppm (morning).
Figure 14. CO2 concentration in greenhouses I February
Figure 15. CO2 concentration in greenhouses in March
If we analyse if there was any relationship between CO2 values and production and calculating the correlation coefficient we found moderate negative relationships R² = 0.395 (Figure 16).
Figure 16. Relationship between the CO2 content of the
greenhouse and the production obtained for the ‘Cheramy’ variety
However, if we analyse how carbon dioxide influenced production, we could see a negative influence with its increase. The Person relationship indicates a moderately negative correlation (R = -0.629). For the ‘Cheramy’ variety, the increase in CO2 content did not show an increase in production (table). If we analyse how carbon dioxide influenced production, we could see a negative influence, as it increases. The Person relationship indicates a moderately negative correlation (R = -0.629). For the ‘Cheramy’ variety, the increase in CO2 content did not show an increase in production (Table 4).
Table 4. Pearson test on the relationships between the total production obtained in the greenhouse of the
‘Cheramy’ variety, the concentration of CO2 and the sum of the temperatures accumulated in the greenhouse
Cheramy Production (kg)
CO2 concentra
tion (ppm)
Accumulated temperature
sum (oC)
Production (kg) 1
CO2 concentratio
n (ppm) -0.629 1
Accumulated temperature
sum (oC) -0.540 0.033 1
20
70
Rela
tive
Hum
idity
(%
)March 2021
120,38
1250,31
0
500
1000
1500
CO
2 co
ncen
tratio
n (p
pm)
January 2021
348,84470,16
1186,38
187,450
500
1000
1500
CO
2 co
ncen
tratio
n (p
pm)
February 2021
216,52
720,06
180
380
580
780
CO
2 co
ncen
tratio
n (p
pm)
March 2021
y = -19,209x + 1142,3R² = 0,395
0,010,0 15,0 20,0 25,0 30,0 35,0C
O2
conc
entra
tion
ppm
Yield (Kg)CO2…
491
In the ‘Flaviola’ variety there is a weak negative relationship between the CO2 concen-tration and the production obtained R² = 0.1695 (Figure 17).
Figure 17. The influence of CO2 on ‘Flaviola’ production If we look how much the CO2 value in the greenhouse influenced, we find that the ‘Flaviola’ variety reacted less to the increase in CO2 content, the Person relationship indicates a moderately low relationship (r = - 4117) (Figure 18).
Figure 18. Influence of CO2 on ‘Flaviola’ production
Figure 19. Aspect of culture
In ‘Cheramy F1’, the correlation made between the productions obtained during the study period and the sum of the temperatures recorded between the harvesting periods indicated a weak positive influence (R² = 0.2654) between them. To see how much the temperature influenced the production level by the calculation performed by the Person test we found a high positive relationship r = 0.51518 (Figure 20).
Figure 20. The influence of the accumulated temperature between harvests on the total production obtained for the
‘Cheramy’ variety The correlation made between the yields obtained and the cumulative sum of the temperatures recorded during the harvest periods indicated a weak positive influence (R² = 0.0049) between them. To see how much the temperature influenced the production level, the cumulative sum of the recorded temperatures and by the calculation performed using the Person test we found an insignificant positive relation (r = 0.0698) (Figure 21).
Figure 21. Influence of the sum of the cumulative
temperatures between harvests on the production of the ‘Cheramy’ hybrid
y = -7,2116x + 789,79R² = 0,1695
0
200
400
600
800
1000
1200
0 10 20 30 40
CO2
ppm
Yield kg
Flaviola
r = -0.4117
0200400600800
10001200
0 10 20 30 40
CO2
conc
entr
atio
n
Yield (Kg)CO2 concentration
y = 372,55x - 3833,8R² = 0,2654
0
5000
10000
15000
20000
5 10 15 20 25 30 35te
mpe
ratu
re o
C
Yield kg Cheramy
Person test r= 0,51518
y = 430,02x + 47880R² = 0,0049
Test Pearson r= 0.0698
020000400006000080000
100000120000140000
5 10 15 20 25 30 35
oC
Yield kg Cheramy
492
Figure 22. Aspect of culture
In the case of the ‘Flaviola’ variety, we noticed that it reacted to the temperature values recorded between harvests. The correlation made between the productions obtained on each harvest and the temperatures recorded between harvests had a positive influence (R² = 0.4081). To see the extent to which temperature values influenced production we calculated using the Pearson test and obtained a large relationship between them r = 0.639 (Figure 23). If we analyse the influence of the sum of the temperatures accumulated in the greenhouse between harvests we can see that there is a negative relationship R² = 0.4736. To see how much it influences this we calculated using the Pearson test and we noticed that the value was negative (r=-0.688), the influence being average (figure 24).
Figure 23. Relationship between yields obtained on
‘Flaviola’ varieties and the sum of temperatures between harvests
Figure 24. Relationship between yields per harvest and the sum of cumulative temperatures recorded at harvest
Table 5 summarizes the data on the influence of CO2 and the sum of the cumulative temperatures on production of the ‘Flaviola’ variety.
Table 5. Influence of CO2 and sum of temperatures on crops on ʻFlaviolaʼ production
Flaviola Production (kg)
CO2 concentr
ation
The sum of the accumulated temperatures
Production (kg) 1
CO2 concentration -0.4117 1
The sum of the accumulated temperatures
-0.741 0.033 1
The number of plants under observation was 154 plants in the ‘Cheramy’ hybrid and 101 plants in the ‘Flaviola’ cultivar. The total fruit production obtained from the plants harvested from the greenhouse was 223.6 kg for ‘Cheramy F1’ and 155.6 kg for the ‘Flaviola’ variety (Figure 25).
y = 314,8x - 764,41R² = 0,4081
Test Pearson r=0.639
0
5000
10000
15000
20000
0 10 20 30 40
oC
Flaviola
y = -2796,7x + 102366R² = 0,4736
Test Pearson r= -0,688
-50000
0
50000
100000
150000
0 10 20 30 40sum
a te
mpe
ratu
rilor
cu
mul
ate
Flaviola
493
Figure 25. Total production of tomatoes obtained in the
greenhouse If we follow the relation regarding the production obtained between the analysed varieties, we found positive relations between them R² = 0.4031 but the Pearson test clearly shows that the variety reacts differently to the temperature conditions, the influence being significant (Pearson test r = 6635) (Figure 26). The influence of cumulative temperatures had a significant influence (Figure 27).
Figure 26. The interaction between the yields obtained
for the analysed variety
Figure 27. Influence of cumulative temperatures on
production of ‘Cheramy F1’ At the first harvest on 1.02.2021, 36.7 kg were obtained from the ‘Flaviola’ variety and 29.3 kg from the ‘Cheramy’ variety (Figure 28).
Figures 28. Harvests performed on the analysed cultivars
Figure 29. Aspect of culture - ‘Flaviola’
The average production obtained per plant was in the case of the ‘Flaviola’ variety of 1.5406 kg/plant and in the case of the ‘Cheramy’ hybrid of 1.4519 kg/plant (Figures 29 and 30).
Figure 30. The average yield per plant of the ‘Cheramy’
The productions of tomatoes were performed weekly and recorded. Thus, we found that they were higher in the ‘Flaviola’ variety compared to the ‘Cheramy’ hybrid. One conclusion would be that the ‘Cheramy’ hybrid is influenced by variations in the temperature and light factor (Figure 31).
Figure 31. Average weekly harvest on plant
During the care works, we periodically carried out works to remove the leaves on the plant. The first deforestation was carried out after 20 days, and the rest of the deforestation of the vegetative mass of the leaves was made done as many times as needed. The figure shows the dates and the number of days after which the leaves were removed (Figure 32).
Figure 32. Number of days between leaf harvests
All vegetative mass was recorded. We found that, at the first and second harvest, the highest amount of vegetative mass was recorded for the ‘Flaviola’ variety of 11.7 kg at the first harvest and 10.6 kg at the second harvest. In this variety the vegetative mass harvested in the following stages was lower compared to the ‘Cheramy’ hybrid (Figure 33).
Figure 33. The total amount of leaves harvested in the
greenhouse In the case of the ‘Cheramy’ hybrid, a total of 67.6 kg was harvested per plant, with an average per plant of 0.439 kg, and for the ‘Flaviola’ variety, 57.5 kg, with an average per plant of 0.569 kg (Figure 34).
Figure 34. Total amount of leaves harvested at the
analyzed cultivars and the average per plant Analysing the relationship between the analysed varieties and the mass of harvested leaves in stages, we found that between varieties, the influence was small (R² = 0.0453), but the Pearson relationship shows that there was a weak positive relationship between the two varieties and leaf production (r = 0.213) (Figure 35 and Table 6).
Table 6. The correlation between the two varieties on
leaf production
Total mass Leaves Cheramy Flaviola
Cheramy 1 Flaviola 0.213 1
Analysing the total accumulated vegetative mass, for each variety, we found that at the ‘Cheramy’ hybrid a quantity of 184.8 kg was obtained and for the ‘Flaviola’ variety 141.4 kg vegetative mass. On average, 1.2 kg/plant at ‘Cheramy’ hybrid and 1.4 kg/plant at ‘Flaviola’ variety were obtained (Table 7).
Table 7. Total vegetative mass harvested (leaves and
stems)
Specification UM
Cheramy Flaviola Total vegetative mass
kg 184.8 141.4
Total plants No. 154 101 Average mass / plant
kg/plant 1.2 1.4
Table 8. Total vegetative mass and total fruit harvested
on plant in the ‘Cheramy’ hybrid
Total vegetative mass and fruits
Vegetative mass
Total fruit mass
kg kg kg 408.4 184.8 223.6
In ‘Cheramy F1’, the percentage of harvested fruit represented 54.75% of the total accumulated vegetative mass, and the mass of leaves and stems 45.25% (Figure 36).
Figure 36 Percentage of vegetative mass and fruit yield
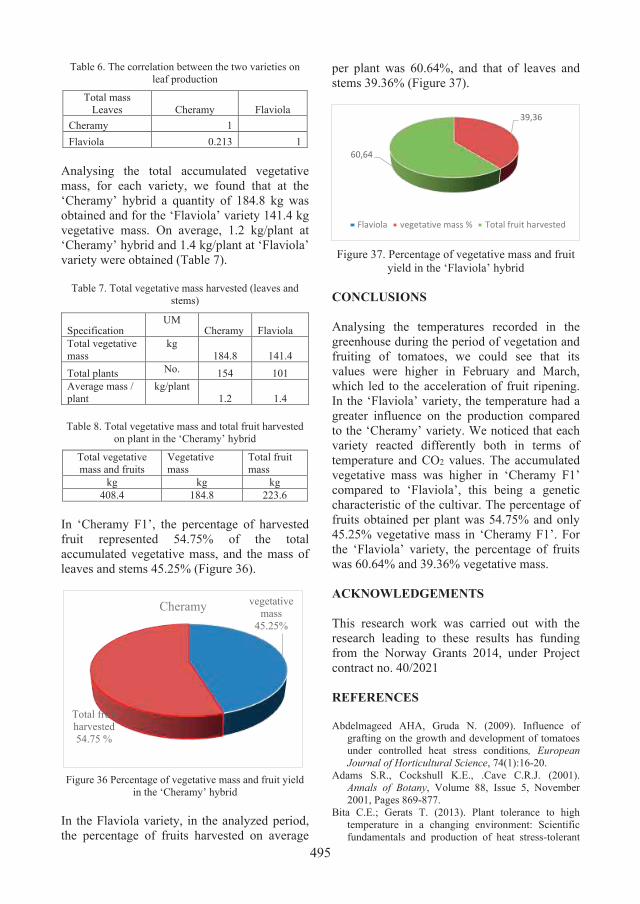
in the ‘Cheramy’ hybrid In the Flaviola variety, in the analyzed period, the percentage of fruits harvested on average
per plant was 60.64%, and that of leaves and stems 39.36% (Figure 37).
Figure 37. Percentage of vegetative mass and fruit
yield in the ‘Flaviola’ hybrid CONCLUSIONS Analysing the temperatures recorded in the greenhouse during the period of vegetation and fruiting of tomatoes, we could see that its values were higher in February and March, which led to the acceleration of fruit ripening. In the ‘Flaviola’ variety, the temperature had a greater influence on the production compared to the ‘Cheramy’ variety. We noticed that each variety reacted differently both in terms of temperature and CO2 values. The accumulated vegetative mass was higher in ‘Cheramy F1’ compared to ‘Flaviola’, this being a genetic characteristic of the cultivar. The percentage of fruits obtained per plant was 54.75% and only 45.25% vegetative mass in ‘Cheramy F1’. For the ‘Flaviola’ variety, the percentage of fruits was 60.64% and 39.36% vegetative mass. ACKNOWLEDGEMENTS This research work was carried out with the research leading to these results has funding from the Norway Grants 2014, under Project contract no. 40/2021 REFERENCES Abdelmageed AHA, Gruda N. (2009). Influence of
grafting on the growth and development of tomatoes under controlled heat stress conditions, European Journal of Horticultural Science, 74(1):16-20.
Adams S.R., Cockshull K.E., .Cave C.R.J. (2001). Annals of Botany, Volume 88, Issue 5, November 2001, Pages 869-877.
Bita C.E.; Gerats T. (2013). Plant tolerance to high temperature in a changing environment: Scientific fundamentals and production of heat stress-tolerant
Buitelaar, K. (1989). Tomatoes- How much foliage should be removed? Groent and Fruit 45(18): 43.
Buitelaar, K., Janse, J. (1987). Removing many leaves is disastrous for tomato quality, Groent. And Fruit 43(21): 42-45.
Dinu Maria, Soare Rodica, C Băbeanu, M. Velea. (2019), Improving the quantitative and qualitative production of peppers under the influence of different foliar fertilization treatments, Scientific Papers. Series B, Horticulture. Vol. LXIII, No. 1, 2019, Print ISSN 2285-5653, CD-ROM ISSN 2285-5661, Online ISSN 2286-1580, ISSN-L 2285-5653
Dinu, M., Dumitru, M. G., Soare, R. (2015). The effect of some biofertilizers on the biochemical components of the tomato plants and fruits. Bulgarian Journal of Agricultural Science, 21(5), 998-1004.
Maria. Dinu., Rodica, Soare., Dorina, Bonea. (2015). Solanum lycopersicum var. Cerasiforme: Harmony and Beauty. Analele Universității din Craiova, Seria Biologie, Horticultura, Tehnologia Prelucrarii Produselor Agricole, Ingineria Mediului. 20, 219-224.
Drăghici Elena Maria, Jerca Ovidiu Ionuț, Sora Dorin (2019). Culturi horticole fără sol (sisteme și tehnologii de cultivare), Ed. Elisavaros, București, ISBN 978-606-982-002-5, pag.267.
Gertsson, U.E. (1992). Influence of temperature on shoot elongation in young tomato plants. Acta Hortic. 327, 71-76 DOI: 10.17660/ActaHortic.1992.327.8
Gruda, N. (2005). Impact of Environmental Factors on Product Quality of Greenhouse Vegetables for Fresh Consumption. Critical Reviews in Plant Sciences. 24(3):227-247.
Heuvelink, E. (1989). Influence of day and night temperature on the growth of young tomato plants. Scientia Horticulturae, 39, 11-22. https://doi.org/10.1016/0304-4238(89)90015.
Heuvelink, E., Li, T., Dorais, M. (2018). Crop growth and yield, In E. Heuvelink (Ed.), Tomatoes (2nd ed., pp. 89-136). (Crop production science in horticulture series; Vol. 27). CABI. https://doi.org/10.1079/9781780641935.0089
Ionuț Ovidiu Jerca, Sorin Mihai Cîmpeanu, Elena Maria Draghici, Stefania Jurcoane, Șerban Purdoiu (2015). The influence of organic fertilization of tomato seedlings for the unconventional crop system with perlite and peat substrate, Volumul 20, nr. 4, Romanian Biotechnological Letters, pag.10727- 10736, Lucrarea nr. 10718, ISSN 1224-5984 http://www.rombio.eu/rbl4vol20/cuprins.htm ISI Thomson, IF= 0,401
Kleinhenz V., Katroschan K., Schütt F., Stützel H. (2006). Biomass Accumulation and Partitioning of Tomato under Protected Cultivation in the Humid
Tropics, Europ.J.Hort.Sci., 71(4). S. 173–182, 2006, ISSN 1611-4426. Verlag Eugen Ulmer KG, StuttgartEurop.J.Hort.Sci. 4/2006
Kraemer, M. E., C. D. Mullins and C. E. Niedziela (2012). Effect of Greenhouse Temperature on Tomato Yield and Ripening. Virginia Journal of Science, 63(1): 3-14.
Kostadinov Kostadin, Stoyan Filipov, Ivanka Tringovska (2020). Influence of organic fertilization on the nutritional regime of tomatoes, Scientific Papers. Series B, Horticulture. Vol. LXIV, No. 1, Print ISSN 2285-5653, CD-ROM ISSN 2285-5661, Online ISSN 2286-1580, ISSN-L 2285-5653
Luxhoi, J., L. Elsgaard, I. K. Thomsen, and L. S. Jensen (2007). Effects of long-term annual inputs of straw and organic manure on plant N uptake and soil N fluxes. Soil Use Management 23:368–373.
Noemi Frias-Moreno, Abelardo Nuñez-Barrios, Ramona Perez-Leal, Ana Cecilia Gonzalez-Franco, Adriana Hernandez-Rodriguez, Loreto Robles-Hernandez (2014). Effect of Nitrogen Deficiency and Toxicity in Two Varieties of Tomatoes (Lycopersicum esculentum L.), Agricultural Sciences, Vol.5 No.14, ISSN Print: 2156-8553 , ISSN Online: 2156-8561
Panter Elena, Pele Maria, Dăghici Elena Maria (2016). Influence of ilumination with Led s on some chemical compounds, Revista de chimie, 67(6),1176-1178, (http://www.revistadechimie.ro/arhiva.asp)
Pescar Svetlana (2013). Cercetări privind distributia si captarea energiei luminoase la tomate si influenta asupra biologiei si calitătii fructelor, Teză de doctorat.
Ploeg A. van der and Heuvelink E. (2005). Influence of sub-optimal temperature on tomato growth and yield: a review, Journal of Horticultural Science and Biotechnology, 80(6), 652-659.
Sima Rodica, Dănuţ Măniuţiu, Alexandru Silviu Apahidean, Maria Apahidean, Vasile Lazăr, Nicuşor Sima, Diana Ficior (2011). The Evaluation of Yield Potential and Quality of Fruits at Tomato Hybrids Cultivated in Greenhouse, Bulletin UASVM Horticulture, 68(1)/2011, Print ISSN 1843-5254; Electronic ISSN 1843-5394
Singh, I., Shono, M., Fukamachi, H. and Suzuki, K. (2005). Effect of heat stress on gas exchange characteristics in tomato. Indian J. Plant Physiol., 10(3): 283-286.
Xiao, S.G., Van der Ploeg, A., Bakker, M. Heuvelink, E. (2004). Two instead of three leaves between tomato trusses: measured and simulated effects on partitioning and yield. Acta Hort., 654, 303-308.
Zhang J., Jiang X., Li T., Yang Z. (2012). Effect of moderatelyhigh temperature stress on photosynthesis andcarbohydrate metabolism in tomato (Lycopersico esculentum L.) leaves. African J. Agril. Res., 7(3): 487-492.