A systematic physico-chemica study of the quality of the ground water, obtained from different sources in and around MaluruTaluk, a suburban Bengaluru, has been carried out. Water is a crucial for the sustenance of life on the earth. Millions of people living in rural and urban areas the tube well water has become very essential these days, According to surveys, ground water accounts for nearly 50% urban water requirement and 80% of rural needs. Keeping in view of the above, an attempt has been made to evaluate the physico-chemical properties of ground water samples collected during pre-monsoon in the year 2012 from twenty tube wells located in and around Maluru. The physico chemical properties have been studied with respect to Temperature, turbidity, pH, TDS, salinity, EC, total hardness, total alkalinity, the concentration of metal ions Ca+, Mg+, Na+, K+ and concentration of Cl-, F-, have been determined . These results are compared with standard results as given by BIS and WHO. The analysis of results indicate that the water samples lie within the permissible standard limits. However some water samples are contaminated above the permissible limit. Keywords: Maluru Taluk, Ground water, Physico Chemical properties, water pollution, seasonal variation.
The precious gift of nature is undoubtedly the water after air, although three fourths of earth is surrounded by water and a little portion of it can be used for drinking purpose. Water is getting polluted every day due to rapid urbanization and industrialization.1 The world is more concerned regarding purification of polluted water. Chemicals, in spite of many uses, are toxic in nature and environmental (land,water and air) contamination by the toxic chemicals is a serious global problem. Industrial effluents containing organic compounds from textile, dying and printing industries may cause skin cancer due to photosensitization and photodynamic damage. On the contrary, degradation products of these organic compounds are relatively less toxic and in some cases these are almost harmless. Secondly, polluted water is of no use and if these organic compounds are removed, then the purified water may be used for irrigation, washing and cleaning purposes1. The groundwater is increasingly gaining imortanc due to its utility inview of scarcity of good quality of water ever needed for growing demands of domestic, agricultural and industrial uses. It has become crucial not only for targeting the groundwater potential zones, but also monitoring and conserving this important resource (CGWB1985). Approximately, 62.5 million people are suffering from –ve effects of fluoride on teeth or bones through the process of fluorosis. The prime sources of water pollution are domestic sewage water, industrial waste water, and chemicals such as pesticides and insecticides and agriculture run off. Maluru is a Taluku located at 13°N 77.94°E. It has an average elevation of 910 metres (2985 ft from the sea level). Malur is at a distance of 46 km from Bangalore City and is located on the Bangalore - Chennai trunk railway line. Distances from Malur to other places are: Whitefield (By Rail): 19 km; K.R Puram (By Rail): 29 km; Hoskote (By Road): 20 km; Devangonthi (By Rail): 13 km; Bagalur (Tamil Nadu by road) -24 km; Hosur (By Road): 36 km. According to the 2011 India census,[2] Malur had a population of 27,791 people with 51% of males and females 49%. Malur is one of the Town in Malur Taluk belonging to Kolar District in Karnataka State. Malur is at a 25.6 kM from Kolar and is 38 km away from Bangalore . The total Population of Malur comprising 345 villages is found to be 1,96,393 people. There are nearly 419 borewells for water supply to all these villages, but the borewells in126 villages have been found to be dried up. However the situation has become worst for the last five years. The only hope that is left for the people of Maluru is to relay on the ground water.
Methods and Materials
Collection of samples
Samples were collected from different tube-well points in and around Malur(villages). The Vilages are, Abbenahalli, Adarsh Nagar, Araleri, Baliganahalli, Banahalli, Chickkakuntur, Chikkathirupathi, Madivala, Malur, Maruthi Extension, Nehru Extension, Patalama Extension, Nosagere, Kavala Giriyana Halli, Rajenahalli,Shivarapatna,Doddashivara,Dadinaikanahallidoddi , Hulimangala Hosakote, Tekal, Masthi, Thornahalli, Rajenahalli, Santehalli and Karanje. An investigation on the study of the physio-chemical properties of tube- well waters collected from these villages.
Determination of Physico – chemical parameters
Twenty four borewell samples have been collected during pre monsoon of 2012 at different villages of the Malur taluk. At the spot the parameters like Temperature, pH, TDS, EC, Salinity, and DO are measured using Systronics Water Analyser-371. The other properties were determined in the laboratory as per the standard methods3-4. Concentrations of Sodium and potassium were determined by Flame Photometer (Systronics FPM Digital µ Controler Based). And Calcium and Magnesium were determined by EDTA titration method followed by Argentometric, SPADNS, titrimetric methods for the determination of Cl-, F- and alkalinity. The parameters were measured by several repetition.
Temperature: The temperature ranged between 21.10C to 26.10C among all the tested bore wells.
Graph-II
pH: Twenty one bore well samples out of twenty four samples were within the permissible limits of ISI & WHO (1993), the other three samples crossed the permissible limits of ISI & WHO.
Graph-III
Turbidity: All the twenty four bore well samples tested for turbidity were within the Nephelometric Turbidity Units (NTU) (1993).
Electrical Conductivity: The EC values ranged between 418µS to 2860µS.
Graph-V
Total Dissolved Solids: The TDS values found in the range of 568 mg/l to 1670 mg/l for the above said 24 bore well samples. Except two samples crossed the permissible limits of ISI & WHO
Graph-VI
Salinity: The values for salinity were ranged between 220mg/l to 1620 mg/l.
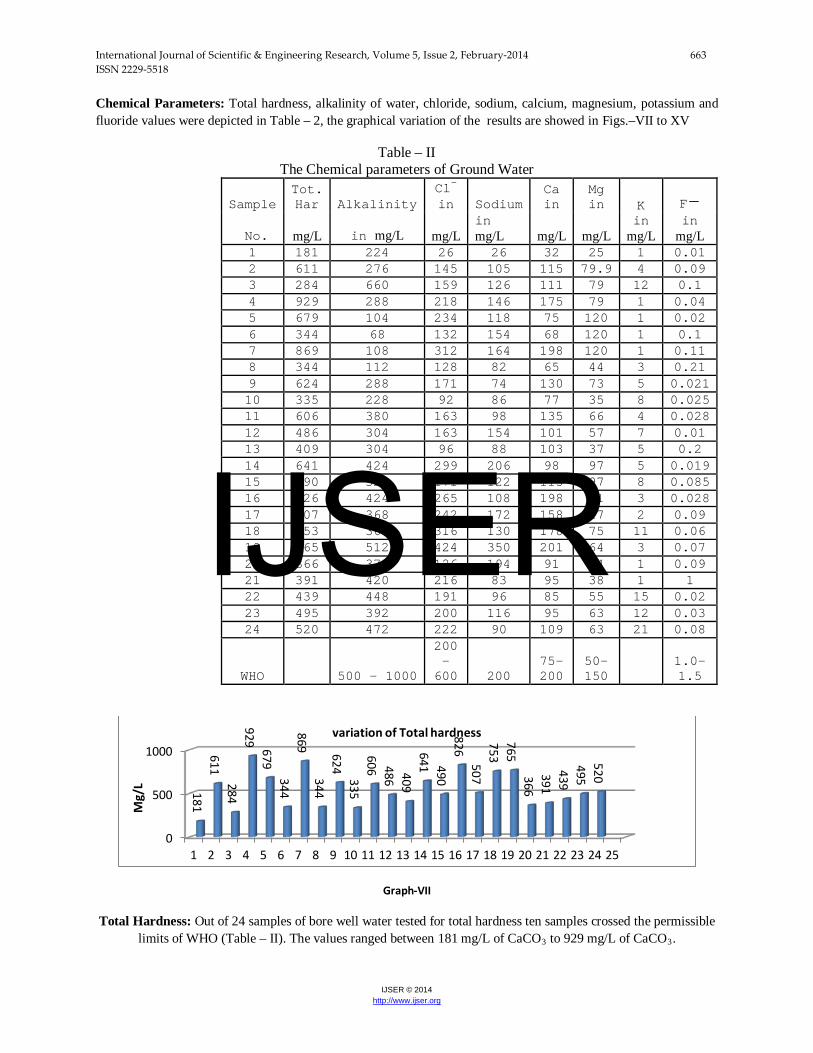
Chemical Parameters: Total hardness, alkalinity of water, chloride, sodium, calcium, magnesium, potassium and fluoride values were depicted in Table – 2, the graphical variation of the results are showed in Figs.–VII to XV
Table – II The Chemical parameters of Ground Water
Total Hardness: Out of 24 samples of bore well water tested for total hardness ten samples crossed the permissible limits of WHO (Table – II). The values ranged between 181 mg/L of CaCO3 to 929 mg/L of CaCO3.
Alkalinity: The alkalinity values were found to be varying between 68 mg/l to 660 mg/L, all the samples were within the permissible limits of ISI & WHO (Table –II)
Graph-IX
Chloride : All the samples collected for measurement were found to be containing chloride within the permissible limits of ISI & WHO (Table – II) they found varying in the range of 26 mg/L to 424 mg/L.
Graph-XI
Sodium : Table – II shows that all the samples tested for the presence of sodium were found in the range of 26mg/L to 350 mg/L, except two samples all the other twenty two samples were within the permissible limits of ISI & WHO
Calcium: Twenty samples of water were within the permissible range of ISI & WHO (Table – II), they varied in the range of 80 mg/L to 201 mg/L.
Graph-XIII
Magnesium : All the collected samples for analysis were found to be within the permissible limits of ISI & WHO. They varied in the range of 02 – 120 mg/L (Table -II)
Graph-XIV
Potassium: All the collected samples were containing potassium and they varied in the range of 01 – 21 mg/L (Table –II).
Fluoride: All the samples collected for analysis were containing fluoride less than the permissible limits of ISI & WHO, (Table -II) and they varied in the range of 0.01 – 01.0 mg/L.
Acknowledgement
We are grateful to Prof.Dr. G.K.Narayanareddy, Former Vice Chancellor Karnatak University,President Janatha Education society Bengaluru, Dr.Venkatesh Thuppil, Principal Advisor, National Referral Centre for Lead Poisoning in India (NRCLPI) and QCI. Sri Manchegowda.C.N Honorary Secretary Jantha education Society, Bengaluru, Dr.Prathima Rao, Dept. of Chemistry, Vivekananda Degree College, Bengaluru. Sri M.Harish Raju Dept. of Chemistry, Atria IT Bangalore, KSPCB, Bangalore, for providing laboratory facilities to complete the above investigation.
Reference
[1]. APHA, (1999). Standard methods for examination of water and waste water. Am. Public health association. Washington DC.
[2]. World health Organisation Guidelines for drinking water quality, Volume 1,2 and 3 WHO Geneva
[3]. CGWB (2002): Ground water balance. Mass awareness programme in Ernakulam district January 5th 2002 by CGWB, Kerala region, Thiruananthapuram, Kerala.
[4]. Appelo, C.A.J and GEirnaert, W. (1991): Process accompanying the intrusion of salt water, - In; Breuk, W. de (ed): Hydogeology of salt water intrusion, a selection of SWIM papers I.A.H. v 11/1991, Vrlag Heinz Heise.
[5]. P.N. Kamble, S. S Bhusal, and S. R. Kuchekar, RASAYAN J. Chemistry., 1, 3 (2008).
[6]. D.V. Sonwane, S.P Lawande, V B Gaikwad, P. N. Kamble and S.R . Kuchekar, RASAYAN J. Chemistry., 2, 421-423 (2009).
[7]. Manivaskam, Water analyst principle Health Laboratory, Coimbathore.
[8]. Abida B. and Harikrishna, 2008. Study on the Quality of Water in Some Streams of Cauvery River, E- Journal of Chemistry, 5, (2): 377-384. [9]. Ahipathi M.V., and Puttaiah, E.T., 2006. Ecological Characteristics of Vrishabhavathi River in Bangalore (India), Environmental Geology, 49: 1217-1222.