Page 1
STUDY ON THE POTENTIAL APPLICATIONS OF THE GEOCOMPOSITE
CELLULAR MAT (GCM) FOR WATER QUALITY AND WALL RADIATION
SHIELDING
SITI FAIRUZ BINTI DIMAN
A thesis submitted in fulfillment of the requirements for the award of the
Degree of Master of Civil Engineering
Faculty of Civil and Environmental Engineering University Tun Hussein Onn Malaysia
MARCH 2016
Page 2
I dedicated this thesis to my beloved parents and siblings for their tremendous support throughout my study.
Page 3
ACKNOWLEDGEMENT
Foremost, I would like to express my deepest gratitude to Prof. Devapriya Chitral
Wijeyesekera for his continuous support, patience and guidance throughout this
research. I appreciate all his contributions of time, ideas, and effort to make my
Master’s experience stimulating and rewarding and will forever be thankful to him.
Moreover, I would to express my thanks to Prof. Dr. Mohd Idrus Bin Mohd
Masirin especially for his guidance and insight as without him I could not complete
my study successfully
I would also like to thank Assoc. Prof. Dr Adnan Bin Zainorabidin as my co-
supervisor for his advice during the completion of this thesis.
To my wonderful friend and colleagues in RECESS 2 who I have been blessed
with, thank you for the immense support and advised. The difficult and joyful times
will forever be ingrained in my mind.
Lastly, special thanks to my family for their loving support and encouragement
particularly to my parents who supported me with my pursuit. Also, my gratitude to
my sisters and brother as their constant lecturing have pushed me to complete my
study. They all kept me going, and this thesis would not have been possible without
them.
S.Fairuz Diman
UTHM
FEB 2016
Page 4
ABSTRACT
Derogatory human activities worldwide, coupled with population increase, has
resulted in a variety of unsustainable geo-environmental challenges in areas such as
water pollution, waste disposal and proliferation of electromagnetic radiations.
Geocomposite Cellular Mat (GCM) is a green innovative product that is currently
being researched, fabricated and developed within the RECESS research group at
UTHM to provide an answer to some of the issues. The multiplicity of its design
characteristics in being of cellular nature, lightweight and yet a stiff mat structure can
meet customer demands on size and usage, promises a wide spectrum of potential
applications of the product to meet some of these geo-environmental challenges. This
research focuses on the potential usages of the product and these therefore, presents
multidisciplinary testing carried out on the product. The possible applications of the
GCM are as a filter medium for water flow transport and electromagnetic wave
radiation shield. The cellular mat structure with appropriate sandwiching fabrics
enable the GCM to be used as permeability controllable water filters, with added infill
that will enable geo environmental cleansing of industrial effluents. The values
achieved from the environmental test for several parameters such as total dissolved
solid, total suspended solid and dissolved oxygen showed significant changes by using
zeolites as infill. Furthermore, GCM cells filled in with aptly researched material
(inorganic and / or organic) have been investigated in this research for their
appropriateness in uses such as shields for electromagnetic radiation. Results from
appropriate tests carried out for each of the applications and the appropriate
environmental standards are presented in this thesis. Thus, it was found the GCM may
be applied for enhancement of water quality and improve the radiation shielding of
walls where required for building construction.
Page 5
ABSTRAK
Aktiviti manusia di seluruh dunia, ditambah lagi dengan peningkatan penduduk telah
menyebabkan pelbagai cabaran terhadap alam sekitar yang tidak lestari seperti
pencemaran air dan radiasi elektromagnetik. ‘Geocomposite cellular mat’ (GCM)
ialah produk hijau yang inovatif yang sedang dalam kajian untuk direka dan
dibangunkan oleh kumpulan penyelidikan RECESS, UTHM bagi mengatasi isu-isu
alam sekitar tersebut. GCM yang dihasilkan menggunakan plastik kitar semula telah
dapat menangani kemapanan dalam penggunaan semula plastik. Dengan kepelbagaian
ciri-ciri reka bentuknya seperti selular, ringan dan struktur mat yang kuat dapat
memenuhi permintaan pelanggan terhadap saiz dan penggunaannya. GCM
menjanjikan spectrum yang luas dengan kebolehan dan keupayaan aplikasinya untuk
memenuhi sebahagian daripada cabaran geo-alam sekitar. Antara aplikasi GCM ialah
boleh digunakan sebagai medium penapis aliran air dan perisai radiasi electromagnet.
Struktur selular dengan fabrik yang sesuai membolehkan GCM digunakan sebagai
penapis air, manakala dengan menambah infill yang sesuai akan membolehkan
permbersihan geo-alam sekitar daripada pelepasan sisa industri. Selain itu, ujikaji yang
dijalankan bagi mendapatkan parameter ujikaji alam sekitar memberikan hasil yang
positif selepas menggunakan zeolites sebagai infill. Ujikaji juga telah dijalankan
terhadap penggunaan infill (organik/bukan organik) bagi mengetahui kesesuaian
penggunaan sebagai perisai radiasi elektromagnetik. Keputusan uji kaji bagi setiap
aplikasi mengikut piawaian yang ditetapkan akan dibentangkan di dalam thesis ini.
Kesimpulanya, GCM dapat diaplikasikan sebagai medium penapis air serta perisai
elektromagnet bagi pembinaan bangunan.
Page 6
CONTENTS
TITLE i
DECLARATION ii
DEDICATION iii
ACKNOWLEDGEMENT iv
ABSTRACT v
CONTENTS vii
LIST OF TABLES xii
LIST OF FIGURES xiii
LIST OF SYMBOLS AND ABBREVIATIONS xviii
CHAPTER 1 INTRODUCTION
1.1 Preface 1
1.1.1 Mega scale use - for erosion pollution
in water bodies 1
1.1.2 Macro scale uses - effects requiring filtration 2
1.1.3 Invisible scale uses- to reduce electromagnetic
radiation effects 4
1.2 Problem statement 5
Page 7
1.3 Research aim 6
1.4 Research objectives 6
1.5 Scope and limitations of study 6
1.6 Structure of thesis 8
CHAPTER 2 LITERATURE REVIEW
2.1 Introduction to chapter 9
2.2 Current issues relating to water resources in Malaysia
2.2.1 Malaysia rivers 9
2.2.2 Global water shortage 14
2.2.3 Water shortage in Malaysia 12
2.2.4 Water pollution 17
2.3 Water quality and control
2.3.1 Water quality parameters
2.3.1.1 Temperature 19
2.3.1.2 Turbidity 19
2.3.1.3 Suspended sediments 19
2.3.1.4 pH 20
2.3.1.5 Dissolved oxygen 20
2.3.1.6 Biochemical Oxygen Demand 20
2.4 Water Quality Index 21
2.5 Water filtration processes and technology 23
2.5.1 Water treatment plant and process 24
2.5.2 Current water filtration methods for
Page 8
industrial applications 29
2.5.3 Current water filtration methods for
domestic applications 34
2.6 Application of materials for wall construction 35
2.6.1 Structural insulated wall panels 36
2.6.2 Gypsum board 38
2.6.3 Noise reduction 39
2.7 Electromagnetic radiation 40
2.7.1 Electromagnetic shielding 42
2.8 Summary to chapter 44
CHAPTER 3 METHODOLOGY
3.1 Introduction to chapter 46
3.2 Research flow and schedule 46
3.3 GCM as water quality filtration material 47
3.3.1 Water samples 48
3.3.2 Geocomposite cellular mats 51
3.3.3 Geosynthetics fibres 54
3.3.4 Fillings 58
3.3.5 Natural zeolites 58
3.3.6 Fabrication of permeameter cell 60
3.3.7 Constant head permeability test 62
3.3.8 Introduction 62
3.3.9 Test procedures 63
Page 9
3.4 GCM as wall radiation shielding material 64
3.4.1 Permittivity test 64
CHAPTER 4 RESULTS AND ANALYSIS
4.1 Introduction to chapter 69
4.2 GCM as filtration material 69
4.2.1 Permeability test 70
4.3 GCM as water quality control 72
4.3.1 Environmental test 73
4.3.2 Observation from Total Dissolved
Solid (TDS) graph analysis 74
4.3.3 Observation from Total Suspended
Solid (TSS) analysis 75
4.3.4 Observation from Biochemical Oxygen
Demand (BOD) analysis 75
4.3.5 Observation from Chemical Oxygen
Demand (COD) graph analysis 77
4.3.6 Observation from Dissolved Oxygen
graph analysis 80
4.3.7 Observation from Turbidity graph analysis 81
4.3.8 Observation from pH graph analysis 82
4.4 GCM as wall radiation shielding material 84
4.4.1 Choices of equipment and fillings 85
Page 10
4.4.2 Observation of the TEM coaxial cell
graph analysis 87
4.4.3 TEM parallel plate calibration using Teflon 88 4.4.4 Observation and analysis from empty GCM 89
4.4.5 Observation and analysis of carbon filled GCM 91
4.5 Summary to chapter 93
CHAPTER 5 CONCLUSION
5.1 Introduction to chapter 94
5.2 Conclusion for the literature review (Objective 1) 95
5.3 Conclusion for the use of GCM as water quality
filtration material (Objective 2) 96
5.3.1 Permeability test on GCM with and
without infill 97
5.3.2 Environmental tests on GCM 97
5.4 Conclusion for the use of GCM as wall radiation
shielding material (Objective 3) 97
5.5 Potential uses of geocomposite cellular mat 98
5.6 Recommendations for further research 99
REFERENCES 100
VITA 110
Page 11
LIST OF TABLES
1.1 Thesis outline 8
2.1 Quality of river waters from 1987-2002 12
2.2 Domestic and Industrial Water Demand (million m3) 16
2.3 Malaysia water quality index class 21
2.4 Excerpt of International Water Quality Standard 22
2.5 INWQS class definition 22
2.6 Advantages and limitations of reverse osmosis process 33
3.1 Coefficient of permeability in different soil. 63
4.1 The water quality parameters for Parit Nipah, Johor
and Sungai Semenyih, Selangor before treatment. 73
4.2 The water quality parameters for Parit Nipah, Johor
and Sungai Semenyih, Selangor after treatment 73
4.3 Data comparison between author’s and M.Halim Shah et al.
and Milan M. Lakdawala et al. 79
5.1 Conclusion for the objectives of the study 95
5.2 Opinion of the potential uses of GCM 98
Page 12
LIST OF FIGURES
1.1 Research flow chart 8
2.1 Peninsula Malaysia river network map 11
2.2 Malaysia river 12
2.3 Water stress indicators in major river basins 13
2.4 Dried up well in Guizhou Province 13
2.5 Malaysia annual water balance. 15
2.6 The depleting level of water at Sungai Selangor dam. 15
2.7 Residents stocking up water from Syarikat Bekalan Air Selangor 16
(SYABAS) truck.
2.8 The total consumption of water for domestic and non-domestic 17
uses in Malaysia for 2010 and 2011.
2.9 Polluted river in Sungai Tebrau, Johor 18
2.10 The typical water treatment process . 24
2.11 Hulu Semenyih dam. 25
2.12 Jenderam Hilir intake station. 26
2.13 Water treatment plant in Precinct 19, Putrajaya. 26
2.14 Sedimentation tank. 27
2.15 Treated water pumping station. 28
2.16 Membrane filtration spectrums. 30
2.17 Schematic representations of the principle membrane modules. 31
2.18 Membrane filters used by Malaysia Diamond Water
Company for water filtration. 31
2.19 Products of Lifestraw® and Lifestraw® Family 1.0 by
Vestergaard. 36
Page 13
2.20 Several water filters that are available in the market. 37
2.21 SIP’s structure which consist of foam core and 38
surrounded by structural sheathing
2.22 Uses of steel frame to improve wind resistivity and 39
structure stabilizing.
2.23 The typical gypsum board wall assembly. 40
2.24 Source and victim of EMI, coupling path. 43
2.25 Electromagnetic wave transmissions through walls. 43
2.26 The transmission configuration when the EM passes
through the sample. 45
3.1 Flow of the research. 47
3.2 Generalized map of Peninsula Malaysia showing the locations
of the sites. 48
3.3 Sungai Semenyih Water Treatment Plant, Precint 19 Putrajaya
location at 2o90’18.5’’N and 101o68’84.1’’E. 49
3.4 Parit Nipah, Johor location at 1o88’38.8’’N and 103o11’94’’E. 49
3.5 The well at Parit Nipah, Johor for water samples collection 50
3.6 The surrounding area at Parit Nipah, Johor. 50
3.7 The water treatment plant in Sungai Semenyih, Putrajaya. 51
3.8 GCM of 50mm in height used for water filtration test. 52
3.9 GCM of 25mm in height used for wall radiation shielding. 52
3.10 Hexagonal-shaped GCM prototype. 53
3.11 Possible variation of GCM for other usages. 53
3.12 Variation of non-woven geotextile fibres. 54
3.13 Non-woven geotextiles from Shanp Deng Enterprise (Asia) 55
Sdn Bhd.
3.14 Formation of an upstream soil filter. 56
3.15 Upstream particles blocking geotextiles opening. 56
3.16 Upstream particles arching over geotextile. 57
3.17 Soil particles clogged within geotextile structure. 57
Page 14
3.18 Carbon powder used for experiment. 58
3.19 Natural zeolites used as filling. 59
3.20 Conventional permeameter cell 60
3.21 The first prototype of the permeameter cell 61
3.22 The second permeameter cell made from stainless steel 61
3.23 The complete set up of the permeameter cell 62
3.24 The complete set up of the parallel plate connected to 65
the vector network analyser.
3.25 A sample inside the TEM parallel plate before testing. 65
3.26 The geocomposite cellular mat sample that is used for
the permittivity test before carbon and fabric is applied. 66
3.27 Teflon sample for calibration purpose. 66
3.28 The complete set up of the coaxial cell connected to the 67
vector network analyzer.
3.29 The 5.5 cm diameter geocomposite cellular mat sample that
are used for the permittivity test. 67
3.25 GCM sample with zinc filling. 68
4.1 Variation of head loss against time for empty GCM 70
4.2 Variation of head loss against time for zeolites filled GCM 71
4.3 Variation of velocity against hydraulic gradient of empty GCM 72
4.4 Variation of velocity against hydraulic gradient when zeolites
are present. 72
4.5 The Total Dissolved Solid (TDS) graphs for Sungai Semenyih
and Parit Nipah 75
4.6 The Total Suspended Solid (TSS) observed for Sungai Semenyih
and Parit Nipah. 77
4.7 The Biochemical Oxygen Demand (BOD) observed for
Sungai Semenyih and Parit Nipah. 79
4.9 The Chemical Oxygen Demand (COD) graphs for Sungai
Semenyih and Parit Nipah. 81
Page 15
4.9 The Dissolved Oxygen (DO) graphs for Sungai Semenyih
and Parit Nipah 82
4.10 The Turbidity level for Sungai Semenyih and Parit Nipah. 83
4.11 The pH graphs for Sungai Semenyih and Parit Nipah 84
4.12 Variations of the transverse electric and magnetic
(TEM) equipment used during experimentation 86
4.13 GCM sample with zinc filling 86
4.14 Graph results of the zinc filling using the TEM coaxial cell. 87
4.15 Graph results for calibration using Teflon 88
4.16 The Teflon sample 89
4.17 The complete set up of TEM parallel plate before calibration
process 89
4.18 The graph results of empty GCM using TEM parallel plate 90
4.19 Comparison of Teflon and empty GCM 90
4.20 The graph results of carbon filled GCM using TEM parallel plate 91
4.21 Comparison of graphs between (Yee, Mohd Jenu, 2013) and
the author’s. 92
4.22 Comparison of data for SE of GCM with and without carbon 92
Page 16
LIST OF SYMBOLS AND ABBREVIATIONS
BOD Biochemical Oxygen Demand
DID Department of Irrigation and Drainage
DO Dissolved Oxygen
DOE Department of Environment Malaysia
EM Electromagnetic
EMI Electromagnetic Interference
EMR Electromagnetic radiation
EPA United States Environmental Protection Agency
GCM Geocomposite Cellular Mat
GLASOD Global Assessment of Human-Induced Soil Degradation
HT High tension
MF Microfiltration
NAHRIM National Hydraulic Research Institute of Malaysia
NGO Non-Governmental Organization
NST New Straits Times
SE Shielding Effectiveness
SIP Structural Insulated Panel
SS Suspended solid
SYABAS Syarikat Bekalan Air Selangor
TDS Total Dissolved Solid
TSS Total Suspended Solid
TEM Transverse Electric and Magnetic
UF Ultrafiltration
UN United Nations
UNESCO United Nations Educational, Scientific and Cultural
Organization
Page 17
UNFCC United Nations Framework Convention on Climate Change
UNWWAP United Nations World Water Assessment Programme
USEPA United States Environmental Protection Agency
WHO World Health Organization
WQI Water Quality Index
Page 18
CHAPTER 1
INTRODUCTION
1.1 Preface
Research and technology stands out today as a mega trend for its ubiquitous impact on
major global aspects such as the social, health, economic and political lives. The
economic landscape is changing from the agriculture, manufacture and service based
drivers to knowledge and innovative-based economies. New platform of knowledge
for innovative product development are founded on multi- / inter- / and trans-
discipline approach. This research study assesses the academic/ research/ industry
benefits and potential applications of geocomposite cellular mat to be produced from
acquired plastic waste. The author presents its potential applications listed and briefly
outlines them below.
1.1.1 Mega scale use - for erosion/pollution in water bodies
Rapid urbanization and the increase in human population have caused great demand
on lands to be utilised mainly for agricultural purposes and other human activities.
Accordingly, this has led many countries to raise major concerns on land degradation
and the increase in demand for clean potable water. Degradation is defined as the
adverse changes which reduced capacity of the land to function as desired (initially
planned). One of the contributing factors of degradation is a consequence of soil
erosion. Soil erosion follows the weathering process caused by water, air or ice and
Page 19
2
S.F.DIMAN
such processes cause major catastrophes such as landslide and siltation of the river
systems. According to the findings by Global Assessment of Human-Induced Soil
Degradation (GLASOD), it is estimated that 55% of degraded soil suffer from soil
erosion by water.
Erosion process causes the removal of top soil until only the sub soil is left. As
the sub soil is less permeable, it will further contribute to the erosion process. Although
erosion is a natural process, it causes problems to the ecosystem particularly if it
happens faster than the formation of soil. Human activities such as deforestation,
agriculture and construction have further instigated the eroding rate of the soil. Human
activities increased the erosion rates tenfold compared to all natural processes
combined together (Wilkinson, 2004). The United States is currently losing 10 times
faster; China and India are losing 30-40 times faster than natural replenishment rate.
Soil erosion also impacts on the economy as it is estimated that cost of damage from
soil erosion worldwide amount to 400 million USD per year (Pimentel, 2006).
According to National Hydraulic Research Institute of Malaysia (NAHRIM), the
human-induced rate of erosion at Klang Valley itself amount up to 2950 tonnes/sq.
km/yr. One of the effects of erosion is transportation of sediments into the fluvial
system and about 60 per cent of soil that is washed away ends up in rivers and streams
which then causes the waterways to be more prone to flooding and be contaminated
with waterborne pollution such as pesticides. This is an application where
geocomposite cellular mat (GCM) can be utilised as a part of sediment trap.
1.1.2 Macro scale uses- effects requiring filtration
One of the impacts of the erosion process is sedimentation. Sedimentation process
contributes to the build-up of environment such as the formation of deltas and
estuaries. Nevertheless, excessive sedimentation process could cause serious geo
environmental problems in the long run. The impacts of sedimentation are clogging of
pipes, drains, the damages to hydroelectric turbines, impairment of the ecosystem and
river pollution as a result of excessive amount of suspended soil that settles and
accumulates at the river bottom. Moreover, heavy rainfall also resulting in the
transportation of heavy silt loaded into lower stretches of Malaysian rivers. The main
reason for excessive sedimentation is due to consequences of widespread land clearing.
Studies in Malaysia have shown that 90% of total sediment loads in rivers came from
Page 20
3
S.F.DIMAN
the construction sites and 1 million m3 of silt needed to be removed from Klang River
annually (Chan, 2008). Sediment pollutions will result in disruption of river
ecosystem, as the sediments will smother the gravel bed that is used by fish to lay eggs
and it decreases oxygen level in rivers as sunlight is blocked due to turbidity. In
addition, more money is needed to filter or dredge out the sediments in order to
increase the water quality for domestic purposes.
Various methods can be used to mitigate and prevent sediment settlement into
rivers and one of them is by using certain geotextiles. Geotextiles also called filter
fabrics have been designed according to the functions needed. One of the applications
of geotextiles is filtration. For filtration, geotextiles allow liquid to pass through while
retaining and protecting the soil. Example of the application of geotextiles is that it can
be used during construction by applying silt fence around the site to prevent sediments
from being transferred into nearby drainage and river system.
Impacts of Malaysia economic and population growth has caused water
imbalance in some of the regions especially in the developed and highly populated
areas such as Kuala Lumpur. Moreover, 2014 water crisis that affected Klang Valley
is an example of such occurrence in Malaysia. The increase in demands is particularly
due for the purpose of consumption as well as productions.
In addition, industrial activities are a significant cause for poor water quality.
As in accordance with the United Nations World Water Assessment Programme
(UNWWAP), the industry and energy production use accounts for nearly 20% of total
global water withdrawals and this water are returned to its source in degraded
condition (UNWWAP, 2009). Wastewater from the industrial facilities such as the
power plants and manufacturing plants contribute to poor water quality around the
world. This wastewater contains waterborne pollutants such as microbiological
contaminants, heavy metals and chemicals. As water is an essential natural resource,
it is necessary to manage our resources carefully as human activities can have a
devastating effect on the environment. In order to do this, the water quality must be
improved by using a sustainable approach that is not detrimental to the environment.
Moreover, the population growth has also increased the amount of household
waste that goes into the landfill. In general, Malaysians generates around 25,000 metric
tonnes of waste every day. The current main approach to manage the household waste
is landfill but the shortages of landfill due to lacks of new land are forcing the authority
to find other sustainable approach in managing the wastes. From Malaysia’s Second
Page 21
4
S.F.DIMAN
National Communication Report to United Nations Framework Convention on
Climate Change (UNFCC), Malaysia plan to achieve the 22% recycling rate by 2020.
In order to achieve this goal, we have come up with a solution by reusing the plastic
waste that is available in the landfill thus reducing its number. From this study,
geocomposite cellular mat is investigated as a proposal to mitigate some of the geo
environmental challenges that our country is currently facing.
1.1.3 Invisible scale- to reduce electromagnetic radiation effects
As Malaysia is trying to accomplish one of its visions that is becoming an
industrialised nation by year 2020, it also causes several geoenvironmental problems
such as shortage of land and proliferation of stray magnetic fields. These are
consequences of the profound impacts of population growth and human activity.
Currently, there is an increase in High Voltage Power distribution works
especially in the city and the rural areas. It has somewhat become a necessity in order
to provide power to remote areas as well as to accommodate the demands required
from the consumers. Electricity is generated at power stations and distributed via
transmission lines/grid. High Voltage (between 132Kv to 755kV) electricity are
transmitted from power station to substation. Then, at the substation the voltage is
lowered to 132kV before being transmitted to the regional electricity companies which
then distribute the electricity to the consumers at even lower voltage.
Moreover, as more residential areas have expanded in order to meet the housing
demands, more homes are being built near or immediately under the high voltage
electricity lines. Medical research indicates that there is an apparently associated
increase of cancer related diseases that are rampant in those who have their abodes
near these high-tension (HT) power cables. The electromagnetic flux created by these
and even to a lesser extent those created by mobile phones are being defined as the
cause for such problems and this GCM provides a possible means of forming the
needed Electromagnetic barrier.
1.2 Problem statement
Due to intense pressure in becoming an industrialised nation by 2020, leads Malaysia
to face serious geo-environmental problems such as water scarcity, shortage of lands,
Page 22
5
S.F.DIMAN
proliferation of stray electromagnetic fields and management of solid waste.
Moreover, these particular problems have also affected many other developing
countries around the world due to the profound impacts of human activity and
population growth. The impacts of population growth and human activity itself have
particularly increased the demand on water for the purpose of consumption as well as
productions. Water a vital resource which used to be abundant has now become a
scarcity.
Technological development and the associated HT Power supply network also
causes undesirable Electromagnetic radiation effects on human health.
Most of these geo environmental problems are interrelated to one another. For
example, uncontrolled constructions have caused the forest to be cleared thus,
increasing the chances of erosion process that can pollute the rivers with sediments
that was transported. Soil erosion can happen naturally because of natural
transportation process such as by wind, air and glacial but human activity has
instigated the rate of erosion to increase significantly over the years. The sediment that
was transported into the rivers has decrease the water quality, thus increasing the cost
on water treatment and filtration process.
Furthermore, shortage of suitable lands and landfill are some of the problems
related to rapid urbanization. The amount of wastes produced has put a pressure on the
government to find a more sustainable approach in dealing with this situation. For
example, in 2006 Malaysia generates about 7.34 millions of waste, enough to fill 42
buildings (Siraj, 2006). One of the materials that made up the solid waste composition
is plastic, which can be found abundant in landfill. To overcome these, the government
has introduced 3R’S program which is Reuse, Recycle and Reduce. Although, the
recycling activity in Malaysia is growing, the industry itself needs to be improved
(Saeed et.al, 2013).
In order to overcome these challenges in this research work, an innovative and
sustainable construction product was designed for water filtration purpose and as a
radiation shielding. This particular product that is being researched is a lightweight
geocomposite cellular mat which is a multipurpose product that can be used in road
construction, lightweight low cost building panel and air filters. Any new and
innovative product development must necessarily be followed by market search for its
uses. The search for the multiplicity of uses and making certain they meet requirements
provides a platform for commercialisation of the product.
Page 23
6
S.F.DIMAN
1.3 Research Aim
The aim of this research is to identify and assess the multiplicity of potential
applications of the geocomposite cellular mat (GCM) as water filters and radiation
shield wall.
1.4 Research Objectives
To achieve the above aim, the specific objectives of this thesis are:
i. To carry out comprehensive literature review and further study of construction
practices to meet the geoenvironmental challenges, the existing water
treatments, different type of fillings and electromagnetic radiation shielding.
ii. To conduct hydraulic conductivity test and environmental test on the empty
geocomposite cellular mat as well as with fillings.
iii. To measure the permittivity value of geocomposite cellular mat when empty
and with filling using Transverse Electric and Magnetic (TEM) parallel plate.
1.5 Scope and Limitations of Study
This study focuses primarily on the multiplicity of applications of geocomposite
cellular mat (GCM) as a filter and electromagnetic radiation shield. Moreover, the
duration taken for this research was 2 years and the tests were mostly conducted at
UTHM as well as at Konsortium Abass Sdn Bhd. Literature review provided the
necessary fundamental information and background, while research plan was
developed for lab experimentation to examine the components required for this study.
Furthermore, personal communication with expert in this field through phone and
email provided current significant information and guidance. The types of test
conducted during the research were constant head test, environmental test and
permittivity test. For this research, it does not cover all the necessary parameters for
drinking water quality and only covers turbidity, pH, total suspended solid (TSS), total
dissolved solid (TDS), dissolved oxygen (DO), biochemical oxygen demand (BOD)
and chemical oxygen demand (COD).
Page 24
7
S.F.DIMAN
1.6 Structure of thesis
The organization of this thesis is as follows. This thesis is divided into 5 chapters
specifically introduction, literature review, research methodology, results and analysis
of laboratory experiment as well as the summarisation of research work and detailed
recommendations for future work.
Chapter one will briefly describes the background of this research, aim,
objectives, problem statement, scope and limitations of study with special references
to geoenvironmental challenges that Malaysia is currently facing and finally the
research flow for this study.
Chapter two which is the literature review will focus on the water shortage,
water pollution, water quality and control, current water filtration techniques for
domestic and industrial usage, non-load bearing wall and proliferation of
electromagnetic waves. The literature review presented from various sources and
researchers are acknowledged accordingly.
Subsequently, chapter three presents the research methodology. This chapter
presents the research framework to produce this study and discusses the required data
and information needed. Additionally, this chapter presents the experimental method
adopted in this research. Tests such as constant head permeability test, environmental
tests and the permittivity test. Additionally, details of sample collections, standard
laboratory testing procedures and development of equipment are discussed in this
chapter.
Chapter four presents the data collected from lab testing and the analysis of the
results. This chapter evaluates the analysis of the experimental results obtained from
various experimental testing and comparing some of the parameters with the results
gain from industrial testing.
Finally, chapter five outlines the summary of the research study and detailed
recommendations for future research based on the current research work. Furthermore,
the importance of this research for knowledge is discussed in this chapter so that new
findings can be established.
Page 25
8
S.F.DIMAN
Literature Review
Identifying Research Aim and Objectives
Laboratory Testing Method
Objective 1
Objectives 2
and 3
Constant Head Test
• Selection of geotextile
• Coefficient of conductivity with and without the presence of zeolites
Environmental Test
• BOD • COD • DO • pH • Turbidity • Total dissolved solid • Total suspended solid
Permittivity Test
• Shielding effectiveness of empty GCM
• Shielding effectiveness of GCM with carbon and zinc
Results Discussion and Analysis
Conclusion and Recommendations
Figure 1.1 Research flow chart
Development and Fabrication of permeameter cell
Design Criteria
• Material for permeameter cell • Diameter of permeameter cell • Resistivity
Sample Locations and Selections
• Sungai Semenyih, Selangor • Parit Nipah, Johor
Identifying fillings
• Natural zeolites • Activated carbon powder • Zinc powder
Page 26
CHAPTER 2
LITERATURE REVIEW
2.1 Introduction to chapter Nowadays, there are many materials being used in construction to enhance the quality
and design life. In this chapter, the literature will focus on the application of
geocomposite cellular mat especially in civil and construction engineering. This
chapter discusses some significant elements such as water scarcity, water quality and
control, water filtration processes and technology as well as electromagnetic
proliferation. Further illustration on the application of geocomposite cellular mat are
shown in Sections 2.4, 2.5 and 2.6.
2.2 Current issues relating to water resources in Malaysia
2.2.1 Malaysia river Management of rivers in Malaysia is currently a central issue for the central
government and the non-governmental organizations (NGOs) as many rivers are
currently in an unacceptable state. Agricultural and industrial waste products are
currently being discharged into rivers by irresponsible people without any treatment
particularly in urban areas. The end products usually consist of suspended solids and
harmful chemicals such as arsenic, lead and cadmium. The study by (Keizrul, 2002),
showed that the rivers that pass through the urban areas suffer the worst degradation
Page 27
10
S.F.DIMAN
and are subjected to heavy liquid and solid disposal from squatter settlements and
excessive silt loads from land clearing.
Moreover, an emergent number of contaminants are being detected in water
that come from agricultural and industrial uses. Also, this number continue rising as
more chemicals are manufactured and industries continue to grow every year.
Stephenson (2009), estimated that around 700 new chemicals are introduced in the
United Stated each year and globally, pesticides usage is approximately 2 million
metric tonnes. These human-produced organic and synthetic chemicals that include
pesticides and toxins can persist in the environment and be transported to other regions
where it was not produced (Carr and Neary, 2008). Besides, these subsurface
contaminants endanger the human lives, environment and increase operation costs for
water treatment.
The water quality is measured by the pollutants in the rivers in terms of
Biological Oxygen Demand (BOD), Suspended Solids (SS) caused by erosion and
sedimentation process and emission of Ammonia Cal Nitrogen (NH3-N). This also
showed that the polluted rivers are mainly affected by pollutants such as suspended
solids and Ammonia Cal Nitrogen. Moreover, the overall rate of change also indicates
negative trend for all pollutants.
In 2001, DOE began again the monitoring of 931 sampling stations in 120 river
basins instead of river-based reporting. Data observed showed that the numbers of
polluted sampling stations are 135 (13%), 303 (33%) are slightly polluted and 489
(53%) are found to be clean. (See Table 2.1)
The Figure 2.1 below shows the river network map for Peninsula Malaysia.
Currently, there are 146 river basins in Malaysia which 120 river basins located in
Peninsula Malaysia and another 26 river basins located in Sabah and Sarawak. A total
of 146 river basin was monitored in year 2006. 80 river basins were considered clean,
59 were slightly polluted and 7 polluted. All of the polluted river basins were located
at Peninsula Malaysia with Johor topping the list. Generally, the polluted river were
located in the industrial area which are Sungai Pinang and Sungai Juru in Penang,
Sungai Buloh in Selangor as well as Sungai Danga, Tebrau, Segget and Pasir Gudang
situated in Johor. This results showed improvement from the year 2005, which 80 river
basins were clean, 51 slightly polluted and 15 polluted. Figure 2.2 shows the example
of river located in our country.
Page 28
11
S.F.DIMAN
Figure 2.1: Peninsula Malaysia river network map
(Source: www.rivernetworks.org)
Page 29
12
S.F.DIMAN
Figure 2.2: Malaysia River
(Source: www.google.com)
Table 2.1: Quality of river waters from 1987-2002 (Source: Department of Environment Malaysia, 2012)
Year Clean Slightly
polluted
Very polluted
2005 338 166 90
2006 335 180 58
2007 368 164 48
2008 334 197 48
2009 306 217 54
2010 293 203 74
2011 275 150 39
2012 278 161 34
2.2.2 Global water shortage
Presently, potable water scarcity is affecting most of the countries worldwide such as
Asia and Sub-Saharan Africa regions that have the most water-stressed countries as
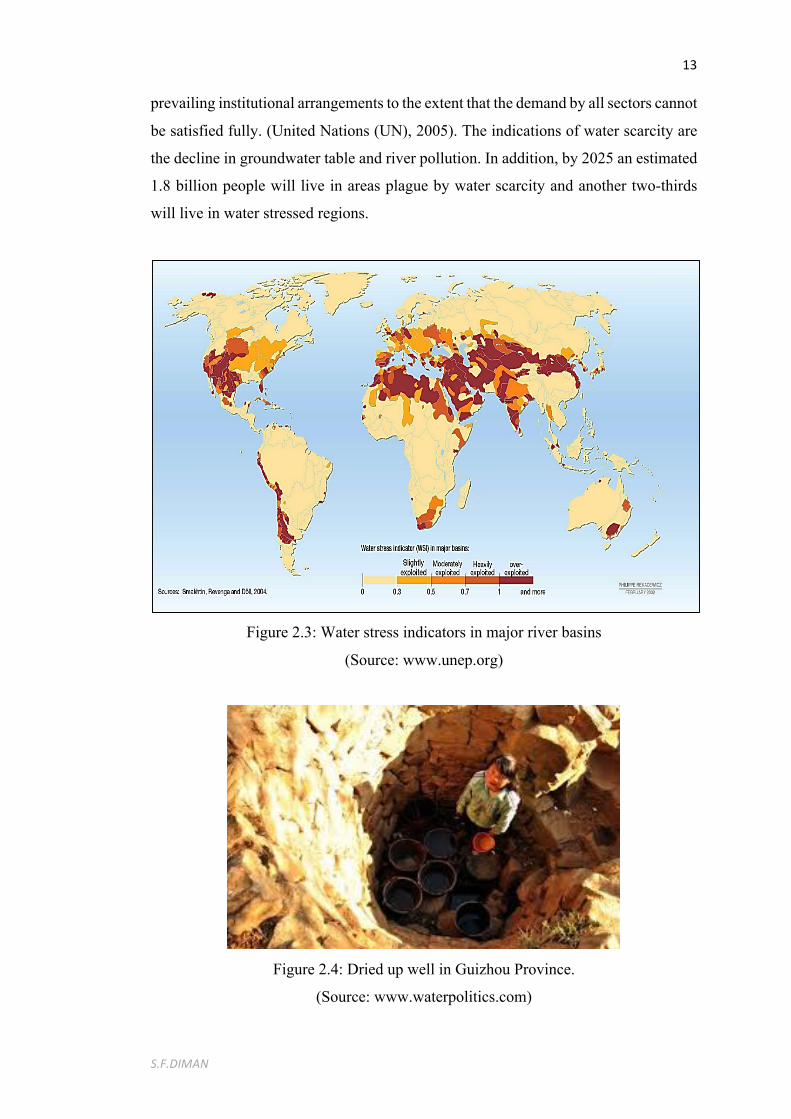
shown in Figure 2.3 and 2.4. Water scarcity is defined as the point at which the
aggregate impact of all users impinges on the supply or quality of water under
Page 30
13
S.F.DIMAN
prevailing institutional arrangements to the extent that the demand by all sectors cannot
be satisfied fully. (United Nations (UN), 2005). The indications of water scarcity are
the decline in groundwater table and river pollution. In addition, by 2025 an estimated
1.8 billion people will live in areas plague by water scarcity and another two-thirds
will live in water stressed regions.
Figure 2.3: Water stress indicators in major river basins
(Source: www.unep.org)
Figure 2.4: Dried up well in Guizhou Province.
(Source: www.waterpolitics.com)
Page 31
14
S.F.DIMAN
2.2.3 Water shortage in Malaysia
At present, Malaysia receives 3000 mm of rainfall every year which give about 990
billion m3 of water (see Figure 2.5). It is estimated that the annual surface runoff is
566 billion m3- 147 billion m3 is in Peninsula Malaysia, 113 billion m3 in Sabah and
306 billion m3 in Sarawak. The remaining 360 billion m3 are then lost through the
evaporation process and 64 billion m3 towards groundwater recharge (Malaysia, 2000).
Although Malaysia is gifted with abundant water resources, it is one of the many
countries that are entering the era of severe water shortage due to factors such as
inexorable growth in population and development. Thus, causing excessive pressure
on the environment and water resources in the country as the water continues to be
degraded. Poor water quality that was resulted from this situation can be associated
with the economic aspects; increased in water treatment cost, effects on the economic
activities and the increase in health-related costs.
The primary cause for the decline is because of overuse and misuse of land and
water resources in river basins in both industrialized and developing countries. Thus,
it contributes to the shortage of water in most parts of the country. This problem has
affected the country particularly the Klang Valley. If this problem is not resolved, the
Selangor state may experience regression in development as it will impede the
economic growth as many factories postponed their operations due to water deficiency.
Currently, the water level at Sungai Selangor dam which supplies water to 1.9 million
users or 62 per cent of users especially in Kuala Lumpur, Gombak, Petaling Jaya, Shah
Alam and Klang is at critical level (see Figures 2.6 and 2.7). Following the checks by
the officials at Selangor Water Management Authority (LUAS), as of 1 August 2014
the recorded water level at the dam stood at 33.46% below the minimum requirement
of 55%. (The Malay Mail Online, 2014).
Furthermore, one of the reasons for water shortage in Malaysia is because the
price of water is cheaper compared to other utilities such as electricity. In average, the
cost of water bill for most Malaysians only amounts to 10% of the electricity bill. Thus,
most consumers do not practice sustainable water consumption. According to Datuk
Seri Peter Chin Fah Kui the Minister of Energy, Green Technology and Water, 70%
of Malaysians overuse their water consumption and do not intend to change their
lifestyle. At present, the consumption of water in Malaysia is the highest compare to
Page 32
15
S.F.DIMAN
other neighbouring countries in South East Asia region. In average, Malaysia used
about 226 litres of water per person daily which is above the daily recommended limit
of 165 litres per day, while Singapore used 154 litres of water and Thailand used only
90 litres of water. Currently, Singapore is taking an initiative in lowering their water
consumption and aims to lower it to 147 litres by 2020 (The Star, 2013).
Figure 2.5: Malaysia annual water balance.
(Source: Malaysia Department of Drainage and Irrigation)
Figure 2.6: The depleting level of water at Sungai Selangor dam.
Annualsurfacerunoff(566m3)
Groundwaterrecharge(64m3)
Evaporationprocess(360m3)
MalaysiaAnnualRainfall(990billionm3)
Page 33
16
S.F.DIMAN
Figure 2.7: Residents stocking up water from Syarikat Bekalan Air Selangor
(SYABAS) truck.
(Source:The Star, 2013)
Table 2.2 below shows the increase in demand of water for domestic and industrial
purposes and these figures continue to escalate from year 1980 to 2000. Since many
development activities were done during the 1990’s till 2000; there is a large increase
in the total water demand during that 10-year period. While, Figure 2.8 shows the
percentage of water consumption for domestic and non-domestic for the year 2010 and
2011. There percentage of domestic usage was 0.3% lowered for year 2011 in contrast
to 2010 while there was an increased in non-domestic usage.
Table 2.2: Domestic and Industrial Water Demand (million m3)
(Source: Department of Irrigation and Drainage (DID))
STATE 1980 1985 1990 2000
Perlis 9 9 16 37
Kedah 49 82 113 266
Penang 124 169 236 343
Perak 145 216 327 596
Selangor 470 658 787 1201
Negeri Sembilan 62 102 131 197
Malacca 30 43 61 112
Page 34
17
S.F.DIMAN
Johor 159 258 338 578
Total 1046 1537 2009 3324
Figure 2.8: The total consumption of water for domestic and non-domestic uses in
Malaysia in 2010 and 2011.
(Source: National Water Services Commissions).
2.2.4 Water pollution
Water pollution is any change in physical, chemical and biological properties of water
that has harmful effect on living things. Furthermore, it affects all major water bodies
in the world such as lake, river and groundwater. Polluted water may cause harmful
waterborne diseases such as diarrhoea and typhoid as it carries viruses and bacteria. In
most cases, children are often affected by inadequate water supply as diseases are
easily spread through water. It is estimated that for every 20 seconds a children die due
to waterborne diseases (UNCF & WHO, 2009). Moreover, death by diarrhoea
attributed to poor water supply, sanitation and hygiene are 3.4 million each year and
99% occur in developing world (WHO, 2008).
Page 35
18
S.F.DIMAN
Sources of water pollution in Malaysia are heavy metals and ammonia, from
sediments run-off and domestic wastes (see Figure 2.9). However, the major
contributor to water pollution in Malaysia is from factories and agricultural wastes.
Industrial production predominantly relies on water as it encompasses in many of its
processes for example cleaning, heating and cooling. Rivers that are used as dumping
outlet will affect not only the people and natural environment but the economy as well.
Additionally, water pollution decreases the total water availability as the cost of
treating polluted water is very high. In some instances, polluted water is not treatable
for consumption. Urbanization especially within the catchment area changed the
quality of runoff which then affects the water quality. Harmful contaminant from land
surfaces that has been washed away by rain into the storm water also contributes to
water pollution in rivers.
Figure 2.9: Polluted river in Sungai Tebrau, Johor
(Source: www.nst.com.my)
Page 36
19
S.F.DIMAN
2.3 Water quality and control
Water quality is measured to ensure the health of river and its ecosystem. Good water
quality for rivers is needed for the thriving of aquatic life. When the water quality
conditions are not met, it will have detrimental effects on the organisms. To measure
the water quality index in rivers, several parameters needed to be considered and it can
be divided into several groups such as physical, chemical, radioactive and biological.
2.3.1 Water quality parameters
2.3.1.1 Temperature
Water temperature is a measurement of the heat content of the water mass and the
influences for the growth rate and survivability of aquatic life. Temperature affects the
physical, biological and chemical characteristics of a river. The changes in temperature
for each river varies depending on the interaction between the surface water and
groundwater inflows. Moreover, wastes discharge can also affect the temperature as
the effluents temperature is normally warmer than water.
2.3.1.2 Turbidity
Turbidity is the amount of fine particles or suspended sediments in water. The particles
present in water may be organic such as algae or inorganic (e.g. sand, fine silts or
clays). Moreover, the fine inorganic particles quantify the degree of light travelling
through water is scattered. High turbidity caused by suspended sediment affects the
penetration of light thus resulting in reduction of plant growth in the river and
damaging the ecosystem (Said et al., 2004).
2.3.1.3 Suspended sediments
Sediments consist of particles with different sizes such as silt, sands and clays. The
adverse effects of sediments are reduction in water quality, damage the fish gills,
disturb the ecosystem by fill in the spaces between gravel where fish lay eggs,
smoothen the gravel beds and it may also cause water pollution as it may carry
Page 37
20
S.F.DIMAN
pollutants into the water system. Human activities such as logging and earthworks
have increases the total sediments load in the river system through the erosion process.
2.3.1.4 pH
pH is the standard measurement of acidity and alkalinity. Low pH value indicates it is
acidic while high pH indicates alkaline conditions. Moreover, pH value of 7 is defined
as neutral condition and most water in Malaysia is in this zone. The pH range for
groundwater that is used for drinking purposes is 6.5-8.5 and it may also be 6.0
especially in shallow unconfined groundwater (from wells less than 30m deep).
2.3.1.5 Dissolved oxygen
Dissolved oxygen is a measurement of the amount of oxygen that is freely available in
water and directly dependent on temperature. Moreover, the colder the temperature of
water, the more oxygen it can hold on (Said et al. 2004) and prolong hot temperature
may reduce the oxygen concentrations as it promotes bacterial activity.
2.3.1.6 Biochemical Oxygen Demand
Biochemical Oxygen Demand (BOD) is the amount of dissolved oxygen needed by
aerobic biological organisms in a body of water to break down organic material
existing in a given water sample at certain temperature over a particular time period.
BOD also determined the oxygen required by pollutants to stabilize domestic and
industrial wastes. Moreover, BOD is used as an indication for organic water quality.
Additionally, BOD test is used to measure the amount of biodegradable wastes that
are present in water (WSDE, 2002) and the amount of food for bacteria. It is estimated
that the amount of BOD loading being discharged in Malaysia is 883,391.08 kg/day.
2.4 Water Quality Index
Water quality index (WQI) is a method that assesses the quality of water by combining
the measurement of selected physical, biological, chemical and radioactive parameters
(Cude et.al, 2001). WQI is a unitless number that varies from 1 to 100 and higher value
Page 38
21
S.F.DIMAN
represents better water quality. Moreover, WQI is important in estimating the water
quality from different sources and observing the changes that occurs in the water as a
function of time and other factors (Abassi, 2002).
WQI is a mathematical tool to convert bulk water quality data into a single
digit. Parameters such as BOD, dissolved oxygen and pH are measured and compared
using the classification tables. These parameters then help in classifying the water into
excellent, good, fair, poor and very poor. WQI that has been used by Malaysia
Department of Environment is based on opinion-poll and is measure using six
parameters such as dissolved oxygen, biological oxygen demand, pH value, suspended
solids, chemical oxygen demand and ammonical nitrogen (Khuan et.al, 2002). The
formulas used to calculate WQI is:
WQI = 0.22 SIDO+0.19 SIBOD+0.16 SICOD+0.16 SISS+0.15 SIAN+0.12 SIpH (2.1)
Where,
WQI = Water quality index
SIDO = Sub-index of dissolved oxygen
SIBOD = Sub-index of biological oxygen demand
SICOD = Sub index of chemical oxygen demand
SIAN = Sub-index of ammonical nitrogen
SISS = Sub-index of suspended solid
SIpH = Sub-index of pH.
Sub-index for dissolved oxygen (DO) (in % saturation):
SIDO = 0 for DO < 8 (2.2)
= 100 for DO > 92 (2.3)
= -0.395 + 0.030DO2 – 0.00020DO3 for 8 < DO < 92 (2.4)
Sub-index for BOD:
SIBOD = 100.4 – 4.23BOD for BOD < 5 (2.5)
= 108e-0.055BOD – 0.1BOD for BOD > 5 (2.6)
Page 39
22
S.F.DIMAN
Sub-index for COD:
SICOD = -1.33COD + 99.1 for COD < 20 (2.7)
= 103e-0.0157COD – 0.04COD for COD > 20 (2.8)
Sub-index for AN:
SIAN = 100.5 – 105AN for AN < 0.3 (2.9)
= 94e-0.573AN – 5 ½ AN – 2 ½ for 0.3 < AN < 4 (2.10)
= 0 for AN > 4 (2.11)
Sub-index for SS:
SISS = 97.5e-0.00676SS + 0.05SS for SS < 100 (2.12)
= 71e-0.0016SS – 0.015SS for 100 <SS < 1000 (2.13)
= 0 for SS > 1000 (2.14)
Sub-index for pH:
SIpH = 17.2 – 17.2pH + 5.02pH2 for pH < 5.5 (2.15)
= -242 + 95.5pH – 6.67pH2 for 5.5 < pH < 7 (2.16)
= -181 +82.4pH – 6.05pH2 for 7 < pH < 8.75 (2.17)
= 536 – 77.0pH + 2.76pH2 for pH > 8.75 (2.18)
The water quality is then classified according to the Malaysia Water Quality Index as
shown below:
Table 2.3: Malaysia water quality index class
(Source: Department of Environment Malaysia, 2006)
Parameters
Class
I II III IV V
AN < 0.1 0.1-0.3 0.3 – 0.9 0.9 – 2.7 > 2.7
BOD < 1 1 – 3 3 – 6 6 – 12 > 12
COD < 10 10 – 25 25 – 50 50 – 100 > 100
DO > 7 5 – 7 3 – 5 1 - 3 < 1
pH > 7 6 – 7 5 – 6 < 5 < 5
TSS < 2.5 25 – 50 50 - 150 150 - 300 > 300
WQI > 92.7 76.5 – 92.7 51.9 – 76.5 31.0 – 51.9 < 31.0
Page 40
23
S.F.DIMAN
Moreover, the classification of Malaysia water quality can be refer to another
standard which is the Interim National Water Quality Standard (INWQS) as some of
the parameters are not presence in the Department of Environment water quality
standard such as the turbidity level and the Total Dissolved Solid. Table 2.4 below
shows the excerpt of INWQS standard and its water quality classes may differ in value
in comparison to the DOE water quality standard.
Table 2.4: Excerpt of International Water Quality Standard
Parameters Units Class I Class
IIA
Class
IIB
Class III Class IV Class V
BOD mg/l 1 3 3 6 12 >12
COD mg/l 10 25 25 50 100 >100
DO mg/l 7 5-7 5-7 3-5 <3 <1
TDS mg/l 500 1000 - - 4000 -
Turbidity NTU 5 50 50 - - -
Table 2.5: INWQS class definition
Class Classifications
I No treatment required
IIA
IIB
Conventional treatment required
Recreational use body contact
III Extensive treatment required
IV Irrigation
V None of the above
2.5 Water filtration processes and technology
Many regions around the world are currently suffering from water scarcity, water
pollution and deterioration in water quality. At present, these are the main problems
associated to the current and future water resources. Due to demand, polluted surface
water and wastewater are being treated to higher quality standard fit for human
consumption and other purposes. Water purification is the process of removing
undesirable chemicals, materials and biological contaminants from contaminated
Page 41
24
S.F.DIMAN
water (Ab. Aziz, 2011). Water treatments such as flocculation, sedimentation, and
filtration are methods being incorporated to remove suspended particles, dissolve
organic matters and viruses. However, membrane filtration is currently gaining
popularity in water treatment as this process have high efficiency and less operating
cost in contrast to conventional methods that have been mentioned before. This section
will present the methods of filtration that are currently available in the market.
2.5.1 Water treatment plant and process
Water sources from surface water and reservoirs will be treated in the water treatment
plant first before being distributed to users (see Figure 2.10). This is to ensure that the
water is clean from contaminants, sediments and harmful chemicals. The treatments
involved may be physical process (settling and filtration), biological process (slow
sand filters) and chemical process (coagulation). The treatments that the water will
undergo are as follow:
Figure 2.10: The typical water treatment process.
(Source: Puncak Niaga Holdings Berhad)
Page 42
REFERENCES
Abbasi, S. A. (2002). Water Quality Indices State–of–the–Art, Pondicherry:
Pondicherry University, Centre for Pollution Control & Energy Technology.
Agassi, M. (Ed). (1996). Soil Erosion, Conservation and Rehabilitation. Marcel
Dekker, New York.
Abdul Latiff, A. A. (2011). Water Pollution: The Never Ending Story. Syarahan
Perdana 2011, Universiti Tun Hussein Onn, Malaysia.
Ahmad, M. S., Abdelazeez, M. K., Zihliv, A., Martuscelli, E., Ragosta, G., &
Scafora, E. (1990). Some properties of nickel-coated carbon bre-
polypropylene composite at microwave frequencies. J. Mater. Sci., Vol. 25,
3083{3088.
Almeida, M. S. S., Spada, J. & Ehrlich, M. (1995). Geotextile filtration tests on
two brazilian soils andcCurrent filter criteria. Geosynthetics International,
Vol. 2, No. 1, pp. 357-377.
Al-Saleh, M. H. & Sundararaj, U. (2009). Electromagnetic interference shielding
mechanisms of CNT/polymer composites," Carbon,Vol.47, 1738{1746,
2009.
Annadurai, P., & Mallick, A. K., & Tripathy, D. K. (2002). Studies on microwave
shielding materials based on ferrite- and carbon black-filled EPDM rubber in
the X-band frequency. J Appl Polym Sci. 2002;83(1):145–50.
Arnoldus, H. M. J. (1974). Soil Erosion: A review of processes, assessment
techniques. Expert Consultation on Soil Degradation. Rome: UNEP.
Page 43
101
Avvannavar, S. M., and Shrihari, S. (2007). Evaluation of water quality index for
drinking purposes for river Netravathi, Mangalore, South India.
Environmental Monitoring and Assessment.
Bennett, H. H. (1939). Soil Conservation. New York: McGrawHill.
Bhatia, S. K. & Huang, Q. (1994). Geotextile filters for internally stable/unstable
soils. Geosynthetics International, Vol. 2, No. 3, pp. 537-565.
Bruvold, W. H. (1970). Mineral taste and the portability of domestic water. Water
Res., 4: 331.
Bruvold, W. H. and Ongerth, H. J. (1969). Taste quality of mineralized water. J. Am.
Water Works Assoc., 61: 170.
Brink, L. E. S., Elbers, S. J. G, Robbertsen, T., Both, P. (1993). The anti-fouling
action of polymers pre adsorbed on ultrafiltration and microfiltration
membranes, J. Membr. Sci. 76 pg. 281.
Carr, G. M. and Neary, J.P. (2008). Water Quality for Ecosystem and Human
Health, 2nd Edition. United Nations Environment Programme Global
Environment Monitoring System.
Chan, N.W (2008). Sustainable management of rivers in Malaysia: Involving all
stakeholders. International Journal of River Basin Management 01/2005;
3(3):147-162.
Chan, N. W. (2012). Managing Urban Rivers and Water Quality in Malaysia for
Sustainable Water Resources. International Journal of Water Resources
Development. Volume 28, Issue 2.Pg. 343-354.
Chung, D. D. L. (2001). Electromagnetic interference shielding effectiveness of
carbon materials. Carbon 2001; 39(2):279–85.
Cooke, R. U. & Doornkamp, J. C. (1990). Geomorphology in Environmental
Management: A New Introduction. Clarendon Press, Oxford.
Cude, C. et.al (2001). Oregon Water Quality Index: a tool for evaluating water
quality management effectiveness, J. Am. Water Resour. Assoc. 37 (1) 125-
137;.
Das, N. C., Chaki, T. K., Khastgir, D., Chakraborty, A. (2001). Electromagnetic
interference shielding effectiveness of ethylene vinyl acetate based
conductive composites containing carbon fillers. J Appl Polym Sci
2001;80:1601–8.
Page 44
102
Duan, Y. P., Liu, S. H., and Guan, H. T. (2005). Investigation of electrical
conductivity and electromagnetic shielding effectiveness of polyaniline
composite. Science and Technology of Advanced Materials, Vol. 6,
513{518, 2005.
Davis, A. P. & McCuen, R. H.(2005). Storm water management for smart growth. 1st
edition. Springer Science and Business Media.
Dunne, T. (1977). Evaluation of erosion conditions and trends. Guidelines for
Watershed Management. Rome: FAO Conservation Guide No. 1, pg 53-83.
Ellison, W. D., and Ellison, O. T. (1947). Soil erosion studies, pt. 7. Soil
transportation by surface flow. Agric. Eng. 28(10):442-444, 450.
Engelman, R., and Leroy, P. (1993). Sustaining water: Population and the future of
renewable water supplies. Population and Environment Program. Washington
D.C: Population Action International.
El-Taweel, G. (1999). Evaluation of Roughing and Slow sand Filters For Water
Treatment. Water, Air, and Soil Pollution 120: 21–28, 2000.
Falkenmark, Lundqvist, J. M., and Windstrand, C. (1989). Macro-scale water
scarcity requires macro-scale approaches: Aspect of vulnerability in semi-
arid development. Natural Resources Forum 13 (4):258-267.
Foster, I. D. L., Charlesworth, S. M. (1996). Heavy metals in the hydrological cycle:
trends and explanation. Hydrological Processes 10: 227–261.
Foster, G. R., Moldenhauer, W. C. and Wischmeier, W. H. (1982). Transferability of
U.S. technology for erosion prediction and control in the tropics. In Proc.
Symposium on Soil Erosion and Conservation in the Tropics, ASAE (Fort
Collins, August 1979). Madison, WI:Soil Sci. Soc. Amer. Special Publ.
Foster, G. R., Meyer, L. D. and Onstad, C. A. (1977). A runoff erosivity factor and
variable slope length exponents for soil loss estimates. Trans.ASAE
20(4):683-687.
Foth, H.D and Turk, L.M. (1972). Fundamentals of Soil Science. Wiley, New York.
Haliburton, T. A. and Wood, P. D., (1982), “Evaluation of the U.S. Army Corps of
engineers gradient ratio test for geotextile performance. Proceedings of the
Second International Conference on Geotextiles. Vol. 1, Las Vegas, NV, pp.
97–101.
Page 45
103
Horton, R. E. (1945) Erosion development of streams and their drainage basins:
Hydrological approach to quantitative morphology. Geological Society
America Bulletin 56:275-370.
Hoek ,E. & Jawor, A. (2007). Nanoscience and Nanotechnology. Nanofiltration
separation. University of California, Riverside California, USA.
Keizrul, A. & Azuhan, M. (1998). Hydrology for Sustainable Water Resources
Planning, Development and Management in Malaysia, International
Conference on Hydrology and Water Resources of Humid Tropics, 24-26
November 1998, Ipoh Malaysia.
Keizrul, A. (2002). Integrated River Basin Management. In Chan, N. W. (Ed.)
Rivers: Towards Sustainable Development. Universiti Sains Malaysia Press,
Penang. Pg. 3-14.
Keizrul A. (2011, March 9). Towards Realising Integrated River Basin Management
in Malaysia: Integrated River Basin Management Report Department of
Irrigation and Drainage, Malaysia.
Khuan, L. Y., Hamzah, N. and Jailani, R. (2002). Prediction of water quality index
(WQI) based on artificial neutral network. Student Conference on Research
and Development Proceedings, Shah Alam, Malaysia.
Knighton, D. (1984). Fluvial Forms and Processes. Edward Arnold, London.
Kondolf, G. M. (1997). Hungry water: effects of dams and gravel mining on river
channels. Environmental Management 21: 533–551.
Koros, W. J, et.al. (1996). Terminology for membranes and membranes process.
International Union of Pure and Applied Chemistry.
Kutay, M. E. & Aydilek, A. H. (2005). Filtration Performance of Two-Layer
Geotextile Systems. Geotechnical Testing Journal, Vol. 28, No. 1 Paper ID
GTJ12580.
KY See, MZ Mohd Jenu. (2013). Shielding Effectiveness of Concrete with Graphite
Fine Powder in Between 50MHz to 400MHz. Asia-Pacific International
Symposium and Exhibition on Electromagnet Compatibility, 20-23 May
2013, Melbourne, Australia.
Leopold, L.B. (1997). Waters, Rivers and Creeks. University Science Books,
California.
Liu, C. & Evett, J. (2008). Soils and foundations.7th Ed. Pearson Education
International.Malaysia.
Page 46
104
Lim, A. L. & Bai, R. (2003). Membrane fouling and cleaning in microfiltration of
activated sludge wastewater. Journal of Membrane Science 216 (2003) 279–
290.
Malaysia (2000, July). Malaysia Initial National Communication. Submitted for
United Nations Framework Convention on Climate Change. Ministry of
Science, Technology and the Environment, Malaysia.
Ma, H., Bowman, C. N., Davis, R. H. (2000). Membrane fouling reduction by back
pulsing and surface modification, Journal Membrane, Sci. 173-191.
Mallevialle, J., Odendaal, P. E., Wiesner, M. R. (1996). Water Treatment
Membrane Processes. McGraw Hill: New York, NY.
McGown, (1978). The Properties of Non-Woven Fabrics Presently Identified as
Being Important in Public Works Applications. Proceeding of Index 78
Congress, European Disposables and Non-woven Association. Congress
held in Amsterdam, The Netherlands, Session I,April 1978, pp.1.1.1-1.1.31.
Montgomery, C. (2010). Environmental Geology 9th Ed. United States: McGraw-Hill
Companies Inc.
Morgan, R. P. C. (1986). Soil Erosion and Conservation. Blackwell, Oxford.
Morari,C., Balan,I., Pintea, J., Chitanu, E., Iordache, I. (2011). Electrical
conductivity and electromagnetic shielding effectiveness of silicone
rubber filled with ferrite and graphite powders. Progress in
Electromagnetics Research M, Vol. 21, 93-104,2011.
Nakatsuka, S. et.al. (1995). Drinking water treatment by using ultrafiltration hollow
fibre membranes. Desalination 106 (1996) 55-6.
Nguyen, M.L., Tanner, C.C., 1998. Ammonium removal from wastewaters using
natural New Zealand zeolites. N.Z. J. Agric. Res. 41, 427–446.
Noori, M., Zendehdel, M., and Ahmadi, A. (2006). Using Natural Zeolite for the
Improvement of Soil Salinity and Crop Yield. Toxicol. Environ. Chem, 2006.
(88), pp. 77-84. Novotny, V. and Olem (1994). Water Quality Management. Academic Press,
NewYork.
Owens, P. N., Batalla, R. J. (2003): A first attempt to approximate Europe's sediment
budget. SedNet Report.
Page 47
105
Owens, P. N., Walling, D. E., Leeks, G. J. L. (2000). Tracing fluvial suspended
sediment sources in the catchment of the River Tweed, Scotland, using
composite fingerprints and a numerical mixing model. In Tracers in
Geomorphology, Wiley:Chichester; 291–308.
Paligova, M., Vilcakova,J., Saha, P. V., Kralek, J. (2004). Electromagnetic
shielding of epoxy resin composites containing carbon coated with polyaniline
base," Physica A, Vol. 335, 421{429.
Parameshwaran, K., Fane, A. G., Cho, B. D., Kim, K. J. (2001). Analysis of
microfiltration performance with constant flux processing of secondary
effluent. Water Res. 35.
Pimentel, D. (2006). Soil Erosion: A Food and Environmental Threat. Environment,
Development and Sustainability. A Multidisciplinary Approach to the
Theory and Practice of Sustainable Development. 8:119-137.
Power, E. (2002). Sediments in England and Wales: Nature and Extent of Issue. A
Scoping Study. Final report to the Environment Agency: Bristol.
Qureshi, S., Kogler, R. M., and Bhatia, S. K., (1990). “Long term filtration behavior
of nonwoven geotextiles”, Proceedings of the Fourth International
Conference on Geotextiles, Geomembranes and Related Products, Balkema,
1990, The Hague, Netherlands,Vol. 1, pp. 301-306.
Said, A., Stevens, D. K., and Sehlke, G. (2004). An innovative index for evaluating
water quality in streams. Environmental Management. 34(3), 406–414.
Saeed, M. O., Hassan,M. N. and Mujeebu, M. A. (2013). Development of Municipal
Solid Waste Generation and Recyclable Components Rate of Kuala Lumpur:
Perspective Study. Penang. Universiti Sains Malaysia.
Salam, R., Hutton, T. and Dawes, W. (1999). Predicting Land Use Impacts on
Regional Scale Groundwater Recharge and Discharge. Journals Environment
Quality. 28,446-460.
Schulz, R. B., Plantz, V. C. and Brush, D. R. (1988). Shielding theory and practice,"
IEEE Trans. on Electromagnetic Compatibility,Vol. 30, No. 3, 187{201,
Aug. 1988.
Serageldin, I. Chairman of the World Commission on Water for the 21st Century-
Water Forum, Netherlands, November 30, 1999.
Page 48
106
Shang, H. et.al (2011). The Load Type Influence on the Filtration Behaviour of Soil
Nonwoven Geotextile Composite. Tamkang Journal of Science and
Engineering. Vol. 14, No. 1, pp. 15_24 (2011).
Siraj, M. (2006), Waste Reduction: No Longer an Option But A Necessity: In
Bernam. Kuala Lumpur.
Stocking, M. A. (1972). Aspects of the role of man in erosion in Rhodesia. Zambia
2(2):1-10.
Stephenson, J. (2009). Testimony before the Subcommittee on Commerce, Trade,
and Consumer Protection, Committee on Energy and Commerce, House of
Representatives: Options for Enhancing the Effectiveness of the Toxic
Substances Control Act. US Government Accountability Office.
Terzaghi,K., Peck, B. R, Mesri G. (1967). Soil Mechanics in Engineering Practice.
John Wiley & Sons, New York.
United Nations Children’s Fund, WHO (2009). Estimated data from Diarrhoea: Why
children are still dying and what can be done.
Walling, D. E., Owens, P. N., Waterfall, B. D., Leeks, G. J. L., Wass, P. D. (2000).
The particle size characteristics of fluvial suspended sediment in the Humber
and Tweed catchments, UK. The Science of the Total Environment
251/252: 205–222.
Walling, D. E., Owens, P. N., Leeks, G. J. L. (1999). Fingerprinting suspended
sediment sources in the catchment of the River Ouse, Yorkshire, UK.
Hydrological Processes 13: 955– 975.
Wang, L.L, Tay, B.B., See, K.Y., Sun, Z., Tan, L. K., Lua, D. (2009).
Electromagnetic interference shielding effectiveness of carbon-based
materials prepared by screen printing. Science direct CARBON 47 ( 2009)
1905 –1910.
World Health Organization (2008). Safer Water, Better Health: Costs, benefits and
sustainability of interventions to protect and promote health; Updated Table
1: WSH deaths by region, 2004.
Yee, S.K., Mohd Jenu, M.Z., (2013). Shielding Effectiveness of Concrete with
Graphite Fine Powder in Between 50MHz to 400MHz. Asia-Pacific
International Symposium and Exhibition on Electromagnetic Compatibility:
APEMC 2013. Barton, A.C.T.: Engineers Australia, 2013: 127-130.
Page 49
107
INTERNET REFERENCES
Abror,A (2004). People Cause More Soil Erosion than All Natural Processes.
Science Daily (2012). Retrieved 18 September 2012 from
http://www.sciencedaily.com/releases/2004/11/041103234736.htm.
Erosion (2012). Erosion search. Retrieved 18 September 2012 from
http://en.wikipedia.org/wiki/Erosion.
Grid Arendal (2005). Vital Water Graphics- Global Sediment Load. Retrieved 18
September 2012 from http://www.grida.no/graphicslib/detail/global-
sediment-loads_a013
Grid Arendal (2007). Environment and Poverty Times #1: WSSD issue- Severity of
land degradation. Retrieved 18 September 2012 from
http://www.grida.no/graphicslib/detail/severity-of-land-degradation_d197
Hazellah, A. (2012). Residents told to evacuate. New Straits Time. Retrieved
13 January 2013 from http://www.nst.com.my/nation/general/residents-told-to-
evacuate-1.193341.
Howard, G. & Bartram, J. (2003). Domestic Water Quantity, Service, Level
and Health. World Health Organization. Retrieved 12 January 2013 from
http://www.who.int/water_sanitation_health/diseases/WSH0302.pdf
Homefront (2014). Retrieved 20 October 2014 from
http://leon.ifas.ufl.edu/FYCS/House%20&%20Home/Performance%20Under
%20Pressure/Structural-Insulated-Panel%20walls.pdf. Homes
McGraw Hill (2014). Retrieved 10 November 2014 from
http://continuingeducation.construction.com/article_print.php?L=18&C=219.
Membrane Processes (2013). Retrieved 24 March 2013 from http://www.drinking-
water.org/html/en/Treatment/Membrane-Processes.html.
Page 50
108
New Straits Times (NST) (2013, February 17). Water shortage may undo
investments in Selangor, New Straits Time. Retrieved 14 March 2013 from
http://www.nst.com.my/latest/water-shortage-may-undo-investments-in
selangor.1.219956.
Northland Construction Company. Retrieved 18 September 2012 from
http://www.northlandconstruction.com/product/filter-fabric-lp6
Puncak Niaga Holdings Berhad (2013). The typical water treatment process.
Retrieved 3 February 2013 from
http://www.puncakniaga.com.my/Services/WaterTreatmentPlantInformation/
WaterTreatmentProcess/TypicalSystem/tabid/103/Default.aspx
Science Daily (2006). Soil Erosion Threatens Environment and Human Health,
Study Reports. Retrieved 15 January 2013 from
http://www.sciencedaily.com/releases/2006/03/060322141021.htm
The Malay Mail Online (2014, 1 August). Conserve water now to avert crisis,
Selangor Government told. Retrieved 2 August 2014 from
http://m.themalaymailonline.com/malaysia/article/conserve-water-now-to-
avert-crisis-selangor-govt-told#sthash.yT7mfELw.dpuf
United Nations Department of Economics and Social Affairs (2005-2012).
International Decade for Action ‘Water for Life’: Water Scarcity. Retrieved
12 January 2013 from https://www.un.org/waterforlifedecade/scarcity.shtml
United Nations World Water Assessment Programme (UNWWAP) (2009). Water
and Industry. Retrieved 10 November 2013 from
http://www.unesco.org/water/wwap/facts_figures/water_industry.shtml.
USEPA (2006). Nonpoint Source Pollution: The Nation’s Largest Water Quality
Problem. US Environment Protection Agency, Washington, D.C. Retrieved
15 December 2012 from http://www.epa.gov/nps/facts/point1.htm
Washington State Department of Ecology, WSDE (2002). Introduction to water
quality index. Retrieved 12 January 2013 from
http://www.fotsch.org/WQI.htm.
Water pollution (2012). Water pollution search. Retrieved 15 December 2012 from
http://www.unwater.org/factsheets.html
Watts, J. (2011, January 4). China makes gain in battle against desertification but has
long fight ahead. The guardian. Retrieved 5 February 2012 from
http://www.guardian.co.uk/world/2011/jan/04/china-desertification
Page 51
109
Wilkinson, B. (2004). People Cause More Soil Erosion than All Natural Processes.
Science daily. Retrieved from
http://www.sciencedaily.com/releases/2004/11/041103234736.htm
World Soil Information- Soil Threats. Retrieved 12 December 2012 from
http://www.isric.org/about-soils/soil- threats.