181
August 6, 2012 Page 1 Study Protocol GUIDing Evidence Based Therapy Using Biomarker Intensified Treatment in Heart Failure (GUIDE-IT) Version Date: August 6, 2012

August 6, 2012 Page 1
Study Protocol
GUIDing Evidence Based Therapy Using Biomarker Intensified Treatment in Heart Failure (GUIDE-IT)
Version Date: August 6, 2012

August 6, 2012 Page 2
TABLE OF CONTENTS LIST OF ABBREVIATIONS ...................................................................................................................................................... 4
PROTOCOL SYNOPSIS ........................................................................................................................................................... 5
STUDY FLOW CHART............................................................................................................................................................. 6
1. HYPOTHESES AND OBJECTIVES................................................................................................................................... 7
1.1 PRIMARY OBJECTIVE ................................................................................................................................................. 7 1.2 SECONDARY OBJECTIVES............................................................................................................................................ 7
2. BACKGROUND AND RATIONALE ................................................................................................................................ 7
2.1 SCOPE OF THE HEART FAILURE PROBLEM ..................................................................................................................... 7 2.2 BIOLOGY AND CLINICAL USES OF NATRIURETIC PEPTIDES ................................................................................................ 7 2.3 GUIDING THERAPY BASED ON NATRIURETIC PEPTIDES: OBSERVATIONAL DATA................................................................... 8 2.4 PRIOR STUDIES OF BIOMARKER-GUIDED THERAPY IN HEART FAILURE ............................................................................... 8 2.5 DESIGN OF GUIDE-IT: RATIONALE FOR AN UNBLINDED STUDY ..................................................................................... 10 2.6 DESIGN OF GUIDE-IT: RATIONALE FOR USING NT-PROBNP AND SPECIFIC TARGET ......................................................... 11 2.7 NATRIURETIC PEPTIDE VARIABILITY OVER TIME............................................................................................................ 11
3. STUDY DESIGN ........................................................................................................................................................... 11
3.1 OVERVIEW ............................................................................................................................................................ 11 3.2 PLANNED NUMBER OF SUBJECTS AND CENTERS........................................................................................................... 12 3.3 STUDY DURATION .................................................................................................................................................. 12
4. STUDY POPULATION.................................................................................................................................................. 12
4.1 OVERVIEW OF STUDY POPULATION............................................................................................................................ 12 4.2 INCLUSION CRITERIA ............................................................................................................................................... 12 4.3 EXCLUSION CRITERIA............................................................................................................................................... 12
5. STUDY INTERVENTIONS ............................................................................................................................................ 13
5.1 BIOMARKER-GUIDED ARM ....................................................................................................................................... 13 5.2 USUAL CARE ARM .................................................................................................................................................. 13
6. STUDY PROCEDURES ................................................................................................................................................. 14
6.1 SCREENING............................................................................................................................................................ 14 6.2 RANDOMIZATION ................................................................................................................................................... 14 6.3 STUDY VISITS......................................................................................................................................................... 14
6.3.1 Baseline ........................................................................................................................................................ 14 6.3.2 Follow-Up Visits ........................................................................................................................................... 14 6.3.3 Follow-up after Adjustment of Therapy or Hospitalization ...................................................................... 15
6.4 BIOREPOSITORY AND CORE LAB BIOMARKER ASSESSMENT ............................................................................................ 15 6.5 MINIMIZING POTENTIAL BIAS................................................................................................................................... 15 6.6 MAXIMIZING PROTOCOL ADHERENCE ........................................................................................................................ 16 6.7 QUALITY OF LIFE ASSESSMENTS ................................................................................................................................ 16 6.8 ECONOMIC DATA COLLECTION PROCEDURES .............................................................................................................. 16 6.9 REMOVAL OR REPLACEMENT OF SUBJECTS.................................................................................................................. 17
7. OUTCOME DETERMINATIONS .................................................................................................................................. 17
7.1 PRIMARY ENDPOINTS.............................................................................................................................................. 17 7.2 SECONDARY ENDPOINTS.......................................................................................................................................... 17 7.3 EXPLORATORY ENDPOINTS....................................................................................................................................... 17 7.4 SAFETY ................................................................................................................................................................. 18

August 6, 2012 Page 3
7.4.1 Collection and Reporting ............................................................................................................................. 18 7.4.2 Safety Events of Interest.............................................................................................................................. 18
8. STATISTICAL CONSIDERATIONS ................................................................................................................................ 19
8.1 DETERMINATION AND JUSTIFICATION OF SAMPLE SIZE .................................................................................................. 19 8.2 PROJECTED ENROLLMENT RATE................................................................................................................................. 20 8.3 PROJECTED EVENT RATES ........................................................................................................................................ 20 8.4 ANTICIPATED EFFECT SIZE ........................................................................................................................................ 21 8.5 POWER CALCULATIONS FOR AGE GROUP BY TREATMENT INTERACTION........................................................................... 21 8.6 SAMPLE SIZE JUSTIFICATION FOR SECONDARY ENDPOINTS............................................................................................. 22 8.7 STATISTICAL ANALYSIS: GENERAL APPROACH .............................................................................................................. 23 8.8 ANALYSIS FOR THE PRIMARY HYPOTHESIS................................................................................................................... 23 8.9 SUPPORTIVE ANALYSES OF THE PRIMARY ENDPOINT..................................................................................................... 23 8.10 ANALYSIS OF SECONDARY ENDPOINTS........................................................................................................................ 24 8.11 MULTIPLE COMPARISONS AND COMPOSITE ENDPOINTS ............................................................................................... 24 8.12 EXPLORATORY ENDPOINTS....................................................................................................................................... 24 8.13 ANALYSIS OF ECONOMIC AND QUALITY OF LIFE DATA................................................................................................... 25 8.14 DATA SAFETY MONITORING BOARD AND INTERIM ANALYSES ........................................................................................ 27
9. DATA MANAGEMENT PROCEDURES ........................................................................................................................ 28
9.1 ELECTRONIC DATA CAPTURE (EDC) SYSTEM............................................................................................................... 28 9.2 ELECTRONIC CASE REPORT FORM (ECRF) .................................................................................................................. 28 9.3 DATA MANAGEMENT PROCESS ................................................................................................................................ 28 9.4 DATA QUALITY CONTROL ........................................................................................................................................ 29
10. STUDY GOVERNANCE AND COMMITTEES........................................................................................................... 29
10.1 CLINICAL COORDINATING CENTER (CCC) ................................................................................................................... 29 10.2 DATA COORDINATING CENTER (DCC) ....................................................................................................................... 30 10.3 ECONOMICS AND QUALITY OF LIFE CORE.................................................................................................................... 30 10.4 BIOMARKERS CORE LAB AND BIOREPOSITORY ............................................................................................................. 30 10.5 EXECUTIVE COMMITTEE .......................................................................................................................................... 30 10.6 STEERING COMMITTEE ............................................................................................................................................ 30 10.7 CLINICAL EVENT CLASSIFICATION COMMITTEE............................................................................................................. 31 10.8 ADHERENCE COMMITTEE......................................................................................................................................... 31 10.9 BIOMARKERS AND GENETICS COMMITTEE .................................................................................................................. 31 10.10 PUBLICATIONS AND PRESENTATIONS COMMITTEE ................................................................................................... 31 10.11 DATA AND SAFETY MONITORING BOARD (DSMB) ................................................................................................. 31
11. REGULATORY ISSUES ............................................................................................................................................ 31
11.1 ETHICS AND GOOD CLINICAL PRACTICE ...................................................................................................................... 31 11.2 INSTITUTIONAL REVIEW BOARD/INDEPENDENT ETHICS COMMITTEE ............................................................................... 32 11.3 INFORMED CONSENT .............................................................................................................................................. 32
12. REMOTE MONITORING......................................................................................................................................... 32
13. REFERENCES........................................................................................................................................................... 33
14. APPENDICES........................................................................................................................................................... 38
14.1 APPENDIX A. SCHEDULE OF STUDY ASSESSMENTS........................................................................................................ 38

August 6, 2012 Page 4
LIST OF ABBREVIATIONS ACE
Angiotensin Converting Enzyme
AE Adverse Event ARB Angiotensin Receptor Blocker BNP B-type Natriuretic Peptide CCC Clinical Coordinating Center CEC Clinical Endpoints Committee CES-D Center for Epidemiologic Studies Depression Scale CRT Cardiac Resynchronization Therapy CV Cardiovascular DASI Duke Activity Status Index DCC Data Coordinating Center DCRI Duke Clinical Research Institute DSMB Data Safety and Monitoring Board eCRF Electronic Case Report Form EDC Electronic Data Capture EQOL Economics and Quality Of Life EQOL CC HF
Economics and Quality Of Life Coordinating Center Heart Failure
ICD Implantable Cardioverter Defibrillator IRB Institutional Review Board IVRS Interactive Voice Response System KCCQ Kansas City Cardiomyopathy Questionnaire LVEF Left Ventricular Ejection Fraction mL Milliliter NHLBI National Heart, Lung, and Blood Institute NT-proBNP Amino-Terminal pro B-type Natriuretic Peptide SAE Serious Adverse Event QOL Quality of Life

August 6, 2012 Page 5
PROTOCOL SYNOPSIS Title: GUIDing Evidence Based Therapy Using Biomarker Intensified Treatment (GUIDE-IT)
Indication: Heart Failure
Location: Approximately 35 clinical centers in U.S.
Rationale: Current guidelines recommend that medical therapy be titrated toward the target doses used in clinical trials, but “therapeutic inertia” often represents a barrier to aggressive titration of medical therapy. There is a pressing need to develop strategies to improve utilization of proven therapies for HF in order to improve clinical outcomes and control costs. Observational studies have shown an association between decreasing natriuretic peptide levels over time and improved outcomes in patients with HF.
Objectives: To compare a strategy of medical therapy titration aimed at achieving and maintaining anNT-proBNP target of < 1000 pg/mL (biomarker-guided therapy) to usual care in high risk patients with systolic heart failure.
Study Design: Prospective, randomized, parallel controlled groups, unblinded, 2-arm, multicenter clinical trial of approximately 1100 patients.
Primary Endpoint:
Time to cardiovascular death or first HF hospitalization
Secondary Endpoints:
Time to all-cause mortalityCumulative morbidityTime to cardiovascular deathTime to first HF hospitalizationHealth-related quality of life (HRQOL)Resource utilization, cost and cost effectivenessSafety

August 6, 2012 Page 6
STUDY FLOW CHART
Hospitalization for HF LVEF < 40% within 12 monthsNT-proBNP > 2000 pg/mL during index hospitalization
SCREENING
Consent obtained at discharge or within 2 weeks of hospital discharge
Randomized within 2 weeks of hospital discharge to either Usual Care (N=550) or Biomarker Guided NT-proBNP < 1000 pg/mL (N=550)
Baseline visit (day 0) History and physical exam, CV medication history, serum creatinine, BUN and electrolytes
and NT-proBNP (local lab), QOL questionnaire, medical resource use and cost assessment, 6MWT, biomarker and DNA sample collection
RANDOMIZATION
2-week follow-up (+ 1 week)History and physical exam, CV medication history, change in HF therapy rationale, serum creatinine, BUN and electrolytes (local lab), NT-proBNP (local lab biomarker guided arm
only), HRQOL questionnaires, medical resource, cost assessment and biomarker samples
6-week follow-up (+ 1 week)History and physical exam, CV medication history, change in HF therapy rationale, serum creatinine, BUN and electrolytes (local lab), NT-proBNP (local lab biomarker guided arm only), QOL questionnaires, medical resource, cost assessment and biomarker samples
3-month follow-up (months 3, 6, 9, 12, 15, 18, 21, and 24) (+ 1 week)History and physical exam, CV medication history, change in HF therapy rationale, serum creatinine, BUN and electrolytes (local lab), NT-proBNP (local lab biomarker guided arm
only), medical resource, cost assessment and biomarker samples
FOLLOW-UP
Notes:Minimum 12 months of follow-up. Study visits occur every 3 months until a maximum of 24 months. Mandatory 2-week (+/- 1 week) follow-up after adjustment of therapy or hospitalization. Follow-up visits include brief clinical assessment, serum creatinine, BUN and electrolytes (local lab), and NT-proBNP (local lab biomarker guided arm only).Follow-up visits continue every 2 weeks until therapeutic targets are reached, or untilfurther titration of therapy is not possible. HRQOL questionnaires to be administered at 3 months, 6 months, 12 months and yearly until the end of the studyEQOL CC will complete QOL questionnaires, medical resource and cost assessments at months 3, 6 and annually to a maximum of 24 months

August 6, 2012 Page 7
1. HYPOTHESES AND OBJECTIVES
1.1 Primary Objective The primary objective of this study is to determine the efficacy of a strategy of biomarker-guided therapy compared with usual care on the composite endpoint of time to cardiovascular death or first heart failure (HF) hospitalization in high risk patients with left ventricular systolic dysfunction.
1.2 Secondary Objectives The secondary objectives of this study are to evaluate the effects of biomarker-guided therapy on:
All-cause mortality Total days alive and not hospitalized for cardiovascular reasons (cumulative morbidity) Time to cardiovascular death Time to first HF hospitalization HRQOL Resource use, cost and cost effectiveness Safety
2. BACKGROUND AND RATIONALE
2.1 Scope of the Heart Failure Problem Heart failure (HF) is a major and growing public health problem in the United States (U.S.), affecting over 5 million Americans, causing over 1 million hospitalizations, and accounting for over 30 billion dollars in total costs annum1. Among U.S. adults age 40, 1 in 5 will develop HF in their lifetime.2 Current practice guidelines for pharmacologic management dictate that neuro-hormonal antagonists such as beta-blockers and ACE-inhibitors be titrated toward the target doses studied in large clinical trials.3,4 Despite these recommendations, available data suggest that most patients in clinical practice are either not treated with these agents or are treated with substantially lower than recommended doses.5-8 “Therapeutic inertia” often represents a barrier to aggressive titration of medical therapy for both providers and patients. A variety of disease management strategies have been evaluated to improve the chronic management of HF patients, ranging from nursing-based interventions to technologically complex interventions using implantable hemodynamic monitors and telemedicine. The majority of these interventions have focused on the monitoring of symptoms and body weight and/or on patient education. Overall, the results from disease management strategies have been mixed,9 and many are personnel intensive, complex10 or costly to implement.11 Thus, there is an unmet need for a simple, effective and easy-to-implement strategy to improve the management of patients with chronic HF such that patient outcomes are demonstrably improved.
2.2 Biology and Clinical Uses of Natriuretic Peptides The natriuretic peptides are a family of important counter-regulatory hormones with vasodilatory, lusitropic, anti-fibrotic, and natriuretic effects.12 The natriuretic peptides b-type natriuretic peptide (BNP) and amino-terminal pro-b-type natriuretic peptide (NT-proBNP) are released from the myocardium in response to hemodynamic stress and provide important diagnostic and prognostic information in HF patients. Multiple studies have linked higher levels of natriuretic peptides to worse clinical outcomes in patients with HF as well as other cardiovascular disorders and in healthy persons.13-16 Both BNP and NT-proBNP have been shown to be very powerful predictors of future risk in both acute17,18 and chronic HF.19,20

August 6, 2012 Page 8
2.3 Guiding Therapy Based on Natriuretic Peptides: Observational Data A large number of studies have also investigated the impact of HF therapies on natriuretic peptide levels. HF therapies proven to have beneficial long-term effects on morbidity and mortality, such as ACE inhibitors,21 angiotensin receptor blockers (ARB),22 beta-blockers,23 aldosterone antagonists,24 and cardiac resynchronization therapy,25 all generally decrease natriuretic peptide levels. Observational studies have shown an association between decreasing natriuretic peptide levels over time and improved outcomes in both inpatients and outpatients with HF.20,26-29. In a representative study, Masson et al examined the prognostic value of baseline and 4 month NT-proBNP values in a prospective substudy of patients enrolled in the placebo arm of the Valsartan Heart Failure (Val-HeFT) study (Figure 1). 29 This study demonstrated the powerful association of change in NT-proBNP levels over time with subsequent clinical outcomes. Using a cut-point NT-proBNP level (derived from receiver operator curve analysis) of 1078 pg/mL, this study showed the prognostic significance of change in NT-proBNP values across this threshold over time. A similar analysis focused on BNP by Latini et al demonstrated substantially similar results.30 These findings appear to be consistent across multiple studies and provide a strong observational foundation for the concept of natriuretic peptide guided therapy in HF.
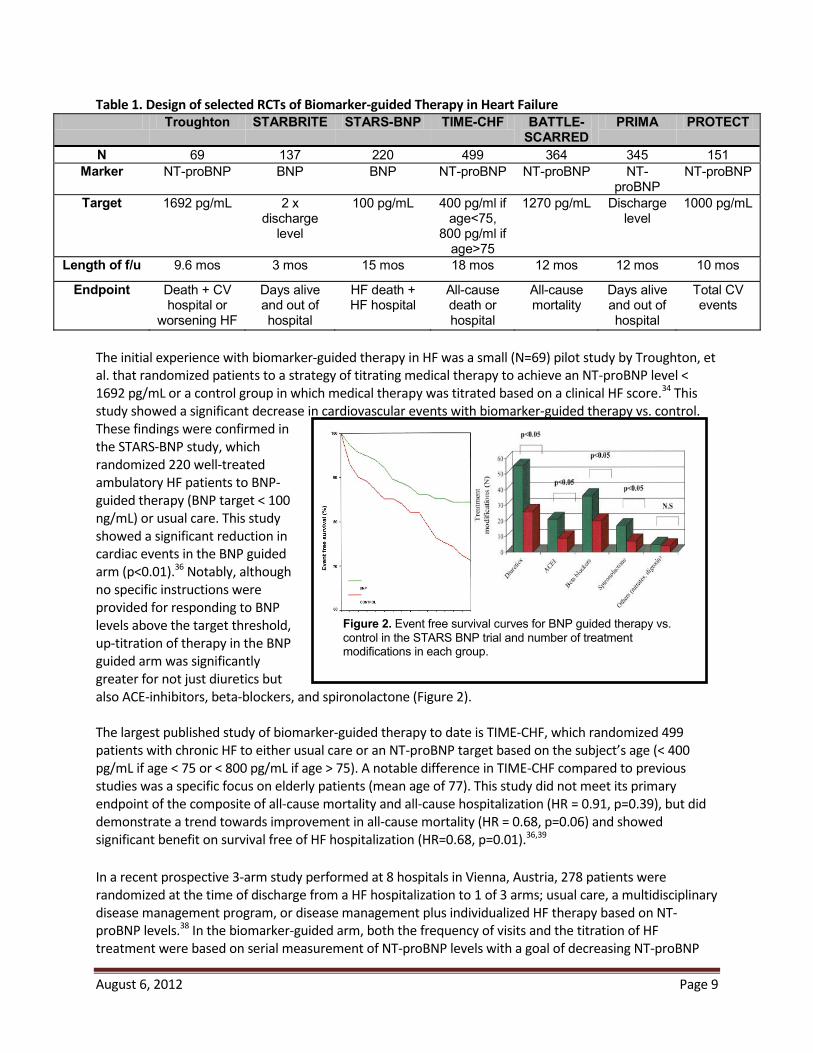
2.4 Prior Studies of Biomarker-Guided Therapy in Heart Failure These observational data have led to the hypothesis that serial measurements of natriuretic peptides may serve as a guide to the titration of chronic medical therapy— “biomarker-guided therapy”. This concept has been tested over the last decade in multiple small randomized controlled studies ranging from 69 to 499 patients.31-38 As shown below, the design of each study has differed with regard to patient population, the biomarker used, the natriuretic peptide target, the nature of the control group, and the study endpoint (Table 1).
Figure 1. Changes in NTproBNP and outcome in Val-HeFT study.
August 6, 2012 Page 9
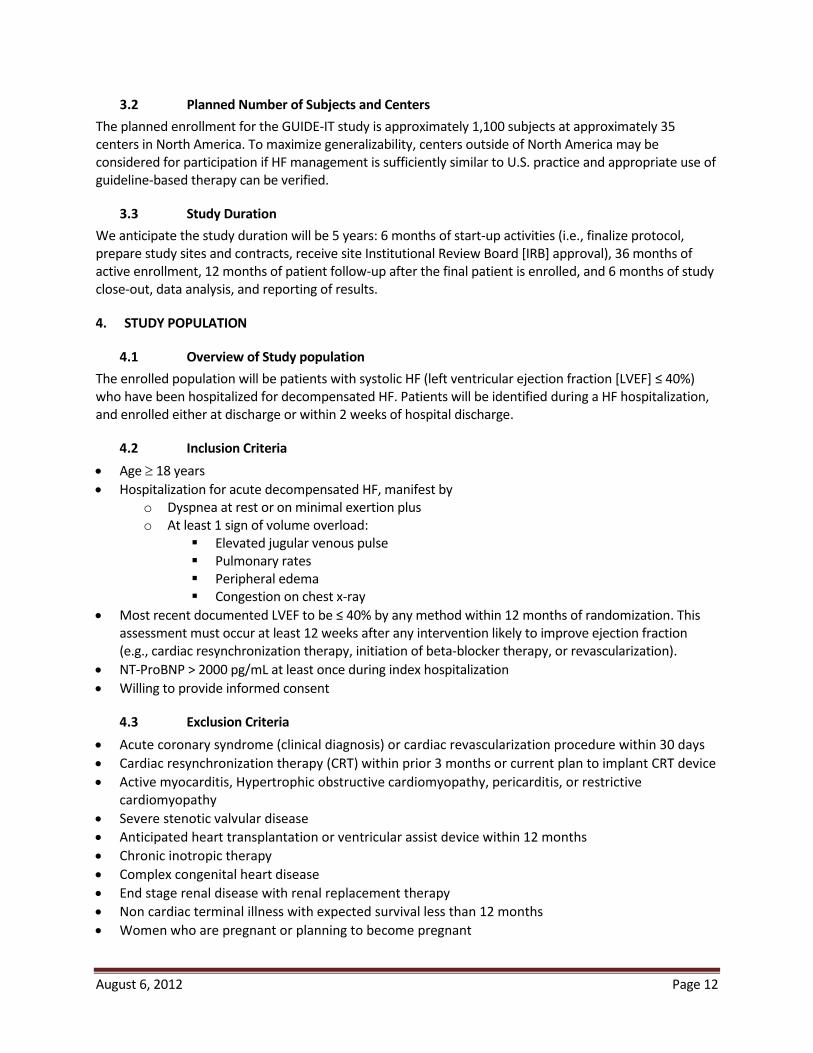
Figure 2. Event free survival curves for BNP guided therapy vs. control in the STARS BNP trial and number of treatment modifications in each group.
Table 1. Design of selected RCTs of Biomarker-guided Therapy in Heart Failure Troughton STARBRITE STARS-BNP TIME-CHF BATTLE-
SCARREDPRIMA PROTECT
N 69 137 220 499 364 345 151Marker NT-proBNP BNP BNP NT-proBNP NT-proBNP NT-
proBNPNT-proBNP
Target 1692 pg/mL 2 x discharge
level
100 pg/mL 400 pg/ml if age<75,
800 pg/ml if age>75
1270 pg/mL Discharge level
1000 pg/mL
Length of f/u 9.6 mos 3 mos 15 mos 18 mos 12 mos 12 mos 10 mos
Endpoint Death + CV hospital or
worsening HF
Days alive and out of hospital
HF death + HF hospital
All-cause death or hospital
All-cause mortality
Days alive and out of hospital
Total CV events
The initial experience with biomarker-guided therapy in HF was a small (N=69) pilot study by Troughton, et al. that randomized patients to a strategy of titrating medical therapy to achieve an NT-proBNP level < 1692 pg/mL or a control group in which medical therapy was titrated based on a clinical HF score.34 This study showed a significant decrease in cardiovascular events with biomarker-guided therapy vs. control. These findings were confirmed in the STARS-BNP study, which randomized 220 well-treated ambulatory HF patients to BNP-guided therapy (BNP target < 100 ng/mL) or usual care. This study showed a significant reduction in cardiac events in the BNP guided arm (p<0.01).36 Notably, although no specific instructions were provided for responding to BNP levels above the target threshold, up-titration of therapy in the BNP guided arm was significantly greater for not just diuretics but also ACE-inhibitors, beta-blockers, and spironolactone (Figure 2). The largest published study of biomarker-guided therapy to date is TIME-CHF, which randomized 499 patients with chronic HF to either usual care or an NT-proBNP target based on the subject’s age (< 400 pg/mL if age < 75 or < 800 pg/mL if age > 75). A notable difference in TIME-CHF compared to previous studies was a specific focus on elderly patients (mean age of 77). This study did not meet its primary endpoint of the composite of all-cause mortality and all-cause hospitalization (HR = 0.91, p=0.39), but did demonstrate a trend towards improvement in all-cause mortality (HR = 0.68, p=0.06) and showed significant benefit on survival free of HF hospitalization (HR=0.68, p=0.01).36,39 In a recent prospective 3-arm study performed at 8 hospitals in Vienna, Austria, 278 patients were randomized at the time of discharge from a HF hospitalization to 1 of 3 arms; usual care, a multidisciplinary disease management program, or disease management plus individualized HF therapy based on NT-proBNP levels.38 In the biomarker-guided arm, both the frequency of visits and the titration of HF treatment were based on serial measurement of NT-proBNP levels with a goal of decreasing NT-proBNP

August 6, 2012 Page 10
Figure 3. Meta-analysis of all-cause mortality in previous studies of biomarker-guided therapy in HF. The overall hazard ratio for mortality was 0.69 (95% confidence intervals 0.55-0.86).
levels to below 2200 pg/mL. The primary endpoint of the study was the composite of time to death or rehospitalization for HF over 18 months. In this study, biomarker-guided therapy was associated with a greater proportion of patients receiving intensified medical therapy (defined as being treated with spironolactone as well as ACE-care or disease management, and this greater intensification of proven therapies resulted in a significantly greater reduction of NT-proBNP levels in the biomarker-guided therapy arm than in the disease management arm. Most importantly, randomization to biomarker-guided therapy was associated with a significant improvement in the survival free of HF
biomarker-guided therapy may have additional biologic effects and provides additive and clinically important benefits above and beyond that provided by intensified disease management alone. The recently published PROTECT study demonstrated a highly significant clinical benefit on total cardiovascular events (logistic odds for event = 0.44, p = 0.02) in a 151 patient single center trial, using an NT-proBNP target of 1000 pg/mL (the same target proposed for the current study). Importantly, the PROTECT data suggested that there were important clinical benefit in both younger and older patients alike37. Two systematic reviews and meta-analyses of the available literature on natriuretic peptide guided therapy in HF, have been published.40,41 Both analyses demonstrated a significant impact on all-cause mortality with biomarker-guided therapy compared to control (Figure 3). Notably, the point estimate for the benefit of biomarker-guided therapy in these meta-analyses was approximately a improvement in survival, a treatment effect comparable to that observed with individual components of HF therapy such as beta-blockers,42,43 ACE-inhibitors44, aldosterone antagonists45, and implantable cardioverter defibrillators (ICDs).46
2.5 Design of GUIDE-IT: Rationale for an Unblinded Study GUIDE-IT will be an unblinded trial because blinding would eliminate one potentially important mechanism of treatment effect: the impact of patient knowledge of their own natriuretic peptide levels on adherence and health-related behaviors. Blinding GUIDE-IT would remove the patient from the critical role of active partnership in the management of his or her disease and would not reflect how biomarker-guided therapy will ultimately be used in practice, thus raising important issues about generalizability. We have taken multiple steps to minimize potential biases related to lack of blinding, including the use of an objective primary endpoint (cardiovascular death or HF hospitalization) and centralized adjudication of events by a Clinical Event Committee blinded to treatment assignment.

August 6, 2012 Page 11
Figure 4. 1-year mortality by deciles of initial NT-proBNP value in PRIDE study; Increased risk at 7th decile corresponds to NT-proBNP level of 972 pg/mL.
2.6 Design of GUIDE-IT: Rationale for Using NT-proBNP and Specific Target Both BNP and NT-proBNP are widely clinically available and both markers have been used in previous trials of biomarker-guided therapy. We have selected NT-proBNP as the biomarker to be used for guiding therapy in the intervention arm of the GUIDE-IT study. The half-life of NT-proBNP is substantially longer than that of BNP (6 hours vs. 20 minutes), suggesting it is preferable for long-term therapeutic monitoring over time. For this reason, more prior studies have used NT-proBNP rather than BNP. NT-proBNP performed better in predicting long-term morbidity and mortality in a head-to-head comparison in Val-HeFT. Finally, the data supporting the validity of a specific natriuretic peptide target are stronger for NT-proBNP than for BNP. Several lines of evidence have led us to select an absolute NT-proBNP target rather than a percentage change. First, the use of specific targets for physiologic parameters is standard in the management of other cardiovascular diseases such a hypertension, hyperlipidemia, and diabetes. A strategy of targeting a specific percentage reduction may leave patients with elevated baseline values with a target that is still associated with substantial risk. The rationale for specific cut points is strongest if there is evidence for specific inflection points in the association of continuous physiologic parameters with risk. Data from the PRIDE study strongly suggests the presence of such a cut-off at approximately 972 pg/mL of NT-proBNP (Figure 4)17. Similarly, in an analysis of VAL-HeFT, the optimal cut point of NT-proBNP to define increased risk was 1078 pg/mL. Finally, as described above the interim results from the PROTECT pilot study demonstrated a strong signal for efficacy using an NT-proBNP target of 1000 pg/mL.32 The consistency of these findings around an NT-proBNP threshold of ~1000 pg/mL has led us to target that level of NT-proBNP suppression for GUIDE-IT.
2.7 Natriuretic Peptide Variability over Time Understanding of intra-patient variability over time is of significant importance in using a biomarker- guided approach in order to distinguish between actionable change and normal biologic variation (i.e., to separate “signal” from “noise”). Araujo et al examined change in NT-proBNP levels over a period of 3 weeks in clinically stable, ambulatory HF patients without changes in therapy, and observed a high degree of intra-patient variability in subjects with low levels (<1000 pg/mL), but a more modest amount of variability in patients with levels in the HF range (~1000-10,000 pg/mL).47 These data suggest that intra-patient variability is sufficiently limited to distinguish a clinical meaningful change from biological variability in chronic HF.
3. STUDY DESIGN
3.1 Overview This study will be a multicenter, prospective, randomized, parallel control group, unblinded, 2-arm multicenter clinical trial comparing biomarker-guided therapy to usual care in patients with systolic HF at high risk for hospitalization or death.
August 6, 2012 Page 12
3.2 Planned Number of Subjects and Centers The planned enrollment for the GUIDE-IT study is approximately 1,100 subjects at approximately 35 centers in North America. To maximize generalizability, centers outside of North America may be considered for participation if HF management is sufficiently similar to U.S. practice and appropriate use of guideline-based therapy can be verified.
3.3 Study Duration We anticipate the study duration will be 5 years: 6 months of start-up activities (i.e., finalize protocol, prepare study sites and contracts, receive site Institutional Review Board [IRB] approval), 36 months of active enrollment, 12 months of patient follow-up after the final patient is enrolled, and 6 months of study close-out, data analysis, and reporting of results.
4. STUDY POPULATION
4.1 Overview of Study population The enrolled population will be patients with systolic HF (left ventricular ejection fraction [LVEF] who have been hospitalized for decompensated HF. Patients will be identified during a HF hospitalization, and enrolled either at discharge or within 2 weeks of hospital discharge.
4.2 Inclusion Criteria Age 18 years Hospitalization for acute decompensated HF, manifest by
o Dyspnea at rest or on minimal exertion plus o At least 1 sign of volume overload:
Elevated jugular venous pulse Pulmonary rates Peripheral edema Congestion on chest x-ray
Most recent documented LVEF to . This assessment must occur at least 12 weeks after any intervention likely to improve ejection fraction (e.g., cardiac resynchronization therapy, initiation of beta-blocker therapy, or revascularization). NT-ProBNP > 2000 pg/mL at least once during index hospitalization Willing to provide informed consent
4.3 Exclusion Criteria Acute coronary syndrome (clinical diagnosis) or cardiac revascularization procedure within 30 days Cardiac resynchronization therapy (CRT) within prior 3 months or current plan to implant CRT device Active myocarditis, Hypertrophic obstructive cardiomyopathy, pericarditis, or restrictive cardiomyopathy Severe stenotic valvular disease Anticipated heart transplantation or ventricular assist device within 12 months Chronic inotropic therapy Complex congenital heart disease End stage renal disease with renal replacement therapy Non cardiac terminal illness with expected survival less than 12 months Women who are pregnant or planning to become pregnant
August 6, 2012 Page 13
Inability to comply with planned study procedures Enrollment or planned enrollment in another clinical trial
5. STUDY INTERVENTIONS GUIDE-IT will randomize patients in a 1:1 allocation to either:
Biomarker-guided arm (approximately 550 subjects): Titration of HF therapy with a goal of achieving and maintaining a target NT-proBNP < 1000 pg/mL OR Usual care (approximately 550 subjects): Titration of HF therapy based on target doses from current evidence based guidelines
5.1 Biomarker-guided Arm In the Biomarker-guided arm, NT-proBNP values from the local clinical laboratory will be utilized by treating physicians for the purpose of achieving at NT-proBNP target of < 1000 pg/mL. The GUIDE-IT protocol will specify interventions to be considered to achieve the NT-proBNP target in the biomarker-guided arm, but specific treatment decisions will be at the discretion of the treating physician. The order of implementation will be based on clinical judgment, and more than one intervention can occur in a single encounter. Titration of neurohormonal antagonists will be emphasized over titration of diuretics except in the case of clinically apparent congestion or in the case of very high NT-proBNP levels, which usually indicate subclinical volume overload. Specific changes in therapy and the rationale for them (e.g., in response to clinical change or NT-proBNP levels) will be captured on the eCRF. Potential interventions to decrease NT-proBNP levels will include:
Up-titrate or add Angiotensin Converting Enzyme (ACE)-inhibitor or ARB Up-titrate or add beta-blocker (if not clinically congested) Up-titrate or add hydralazine-nitrates in African-American patients Increase loop diuretic dosage (if clinically congested or NT-proBNP > 5000 pg/mL) Up-titrate or add spironolactone if tolerated by renal function and potassium Add oral thiazide diuretic Add digoxin Consider adding ARB to ACE-I (if not on spironolactone) Consider hydralazine-nitrates in non-African-American patients Intensified or repeated heart failure education regarding diet, sodium restriction, etc. Consider optimization of cardiac resynchronization therapy (if CRT device implanted) Reconsider potential indications for CRT (if not previously implanted) If in atrial fibrillation, maximize rate control or consider more aggressive attempts at normal sinus rhythm Consider exercise training or cardiac rehabilitation
5.2 Usual Care Arm Patients randomized to the usual care group will receive care based on the most recent AHA/ACC guidelines.4 Investigators will be provided with specific information on evidence-based target doses of neuro-hormonal antagonists (beta-blockers, ACE-inhibitors). Diuretics will be titrated based on clinical judgment of the treating physician. Routine assessment of natriuretic peptides will not be performed in the usual care group except for compelling medical reasons, consistent with current guidelines.4

August 6, 2012 Page 14
6. STUDY PROCEDURES A complete schedule of assessments throughout the study is given in Appendix A.
6.1 Screening Clinical site staff will screen patients hospitalized for acute decompensated heart failure. If patients are eligible to participate, they will be followed, but no study interventions will occur until the time of hospital discharge and after informed consent has been obtained. A screening log will be maintained at each site. Eligible patients will provide written informed consent prior to randomization.
6.2 Randomization Randomization will occur at the time of discharge or within a 2-week window after hospital discharge. Subjects who fulfill all the inclusion criteria and none of the exclusion criteria will be randomized in a 1:1 fashion using an interactive voice response system (IVRS) to either biomarker-guided therapy or usual care. The unit of randomization will be at the patient level rather than the site level. Treatment allocation will be conducted using a complete randomization scheme. At randomization, subjects will undergo a brief interval history and physical exam, cardiovascular (CV) medication history, local laboratory testing for renal function and electrolytes, assessment for adverse events, 6 minute walk test, HRQOL questionnaires, medical resource use and cost assessment, and core laboratory samples.
6.3 Study Visits
6.3.1 Baseline Baseline assessments will occur at the time of randomization and will include:
Focused physical examination CV medication history Serum creatinine, blood urea nitrogen (BUN), and electrolytes (local laboratory) NT-proBNP (local laboratory) Health Related QOL questionnaire (as described in 6.7) 6 minute walk test Biomarker and DNA collection for biorepository (as described in 6.4)
6.3.2 Follow-Up Visits Follow-up visits will occur at 2 weeks, 6 weeks, 3 months, and then every 3 months for the remainder of the study duration period (minimum of 12 months and a maximum of 24 months). All study visits will be completed within a ± 1-week window. The following assessments will occur at each follow-up study visit.
Focused interval history and physical examination CV medication history Document rationale for changes in HF therapy Serum creatinine, BUN, and electrolytes (local laboratory) NT-proBNP (local laboratory, Biomarker-guided Arm only) Health Related QOL questionnaire (as described in 6.7) Medical resource use and cost assessment Ascertainment of interval safety events and endpoints Biomarker collection for biorepository (as described in 6.4)

August 6, 2012 Page 15
Subjects in the biomarker-guided arm will have NT-proBNP testing performed in the local laboratory by appropriately trained personnel, and these values will be used for the purposes of titrating therapy to the protocol-specified target. If therapy is adjusted, the changes in therapy and the rationale for the adjustment (e.g. clinical reason, not at biomarker target) will be recorded on the eCRF. Subjects in the usual care arm will not have routine assessment of natriuretic peptides except for compelling medical reasons.
6.3.3 Follow-up after Adjustment of Therapy or Hospitalization There will be a 2-week (± 1 week) follow-up visit for patients who have a change in therapy, resulting from clinical findings or natriuretic peptide levels. This follow-up visit will include a brief clinical assessment, measurement of renal function and electrolytes, and local laboratory NT-proBNP measurement (biomarker-guided arm only). If patients are unable to return for a 2 week follow-up visit, remote laboratory assessments of renal function, electrolytes, and NT-proBNP (biomarker-guided arm only) may be substituted. Follow-up visits will continue every 2 weeks until therapeutic targets are reached, or the investigator determines that further titration of therapy is not possible. Patients hospitalized for HF during the study will have a 2-week follow-up study visit post discharge to reassess and adjust medical therapy, which will include all standard follow-up assessments as defined above (Section 6.3.2).
6.4 Biorepository and Core Lab Biomarker Assessment Local laboratory NT-proBNP values will be used to adjust therapy in patients randomized to the biomarker-guided arm. Additionally, at each regular study visit, all subjects (regardless of treatment arm) will have blood samples sent to the Biomarker Core Laboratory for the central blinded assessment of NT-proBNP levels. Data from this core lab assessment will not be provided to the sites but will be used to standardize assessments for all study patients (including those in the usual care arm) during data analysis at the completion of the study. As a quality control measure, the correlation between local site laboratory NT-proBNP values and central core lab NT-proBNP values will be assessed after enrollment of the first 100 patients, and as needed thereafter. Additional plasma, serum, and DNA samples (once only) will be collected and stored in the GUIDE-IT biorepository at each regular study visit (see Schedule of Assessments). Samples will be collected, processed, and labeled at the study site and shipped to the biorepository as described in the Manual of Operations. These biorepository samples will be used by GUIDE-IT investigators to evaluate the role of specific “biomarkers” (including genetic biomarkers) in the biology and pathophysiology of HF and the biology of the response to biomarker-guided therapy. A Biomarkers and Genetics Committee will establish and manage the process for scientific review of proposals to use these biologic samples.
6.5 Minimizing Potential Bias To address potential effects of an unblinded trial design on outcome determination, we have chosen an objective primary endpoint (HF hospitalization or CV death) and will use a blinded Clinical Endpoints Committee (CEC) to classify potential endpoints. Source data (i.e., history, laboratory procedures and discharge summaries) on all deaths and hospitalizations will be reviewed by the CEC in a consistent, standardized and unbiased manner. Final cause for each event will be adjudicated using definitions that will be established in the CEC Charter. Another potential source of bias relates to the possibility that the greater frequency of medical visits due to natriuretic peptide guidance will lead to improved patient outcomes through a mechanism other than biomarker-guided titration of HF therapy. While GUIDE-IT will mandate frequent visits in the usual-care
August 6, 2012 Page 16
group (as consistent with standard practice), any observed differential in the number of medical interventions (driven by out-of-range natriuretic peptide levels in apparently stable patients) may be the mechanism by which any treatment effects are realized. The alternative of mandating extra clinical visits for the usual-care arm to mirror the visit pattern of the biomarker-guided arm carries risk of biasing the trial results. Those extra visits, which would not occur in regular clinical practice, could lead to extra testing and treatment modifications that result in the outcomes of the two arms converging, thus masking a real treatment benefit. While there is no perfect solution to this problem, we will have detailed data on the content of each clinic visit in both treatment arms; thus, we will determine how often these visits included significant modifications of medical therapy.
6.6 Maximizing Protocol Adherence In order to persuasively test the primary hypothesis of GUIDE-IT, we will maximize adherence to the assigned strategies. In the case of the biomarker-guided arm, the investigators will act on above-target NT-proBNP levels even in the absence of worsening symptoms or signs of HF. Similar to studies of intensive glycemic control or blood pressure control, adherence monitoring and feedback to providers will be critical to the success of GUIDE-IT. To ensure that investigators adhere to the protocol, GUIDE-IT will convene an Adherence Committee to focus on investigator education and training. Based on our experience in prior studies to identify and correct non-adherence, adherence monitoring and intervention will take a stepped approach. For example, the clinical coordinating center (CCC) will collect patient feedback on adherence. Investigators at sites with two episodes of non-adherence will be contacted to review episodes and the importance of adherence will be reemphasized. Reports on adherence will be provided to the Executive Committee. The Executive Committee will consider suspending enrollment at sites not performing at appropriate levels. Adherence performance will be used in determining authorship of trial manuscripts. Although we recognize that such substantial efforts at ensuring investigator adherence are not practical in all real-world settings, we believe they are critical for a proof-of-concept efficacy trial such as GUIDE-IT.
6.7 Quality of Life Assessments GUIDE-IT will use a battery of validated instruments that build on a disease-specific core, supplemented by generic measures to provide a comprehensive assessment of health related QOL. These assessments of quality of life (QOL) will be performed at baseline by site coordinators and then 3 months, 6 months and annually to a maximum of 24 months by structured telephone interview conducted by the EQOL CC staff. A detailed description of each of these instruments with instructions will be included in the Manual of Operations. Assessments at each visit will include the following:
Kansas City Cardiomyopathy Questionnaire (KCCQ) Duke Activity Status Index (DASI) enter for Epidemiological Studies Depression Scale (CES-D) Medical Outcomes Study Short Form (SF-12) Medical Outcomes Study Short Form (SF-36) subscales: General Health, psychological well-being, vitality, social functioning) EQ-5D
6.8 Economic Data Collection Procedures Total medical costs can be divided into five major components: inpatient hospital care, inpatient physician care, outpatient (ED visits, observational stays, rehabilitation stays, nursing home stays) physician care, outpatient testing, and outpatient medications. Hospital costs will be calculated using hospital billing data,

August 6, 2012 Page 17
with charges converted to costs using the departmental charge-to-cost conversion factors available from each hospital’s annual Medicare Cost Report. Physician costs (both inpatient and outpatient) will be estimated by mapping major procedures and physician services recorded on the case report form and hospital bills to appropriate current procedural terminology (CPT) codes in the Medicare Fee Schedule. Outpatient medication costs will be based on the Drug Topics Red Book average wholesale price, discounted as appropriate to reflect market acquisition costs. Outpatient testing costs will be assigned using the Medicare Fee Schedule for the physician component and the Medicare ambulatory payment classification (as per rates for the institutional and laboratory component). Hospital bills for patients in the U.S. (detailed, summary ledger, and UB-04) will be collected by the GUIDE-IT EQOL CC staff after discharge from the hospital This process typically starts with a call to the head or the representative of the given hospital’s patient accounting department to request the bill, and is followed by a written letter including a copy of the signed consent form if requested. Once received, in order to maintain confidentiality, the patient’s name will be removed and replaced with the GUIDE-IT patient study number and patient initials before further processing. In addition, cost-to-charge ratios (Medicare Cost Report Worksheets C and D-1, Part 2) will be obtained for each hospital where a GUIDE-IT hospitalization is reported. These reports can be obtained from the hospital in question, the Medicare Intermediary for that region, or the Centers for Medicare and Medicaid Services. Reports will be obtained for each year of study enrollment and follow-up up to the most recent report available at the start of the data analysis phase.
6.9 Removal or Replacement of Subjects Subjects have the right to withdraw from the study at any time and for any reason without prejudice to his or her future medical care. In the case of subject withdrawal, the investigator will discuss with the subject the most appropriate way to terminate study participation to ensure the subject’s health. All efforts will be made to complete and report the observations as thoroughly as possible up to the date of study termination. Randomized subjects who withdraw from the study will not be replaced.
7. OUTCOME DETERMINATIONS
7.1 Primary Endpoints The primary endpoint is the time to CV death or first HF hospitalization.
7.2 Secondary Endpoints Time to All-cause mortality Cumulative morbidity (days alive and not-hospitalized for CV reasons) Time to CV death Time to first HF hospitalization Health Related QOL Resource utilization, cost and cost effectiveness Safety
7.3 Exploratory Endpoints Global Rank Endpoint, incorporating death, hospitalization, and change in quality of Life Win-ratio, incorporating death, hospitalization, and change in quality of life
August 6, 2012 Page 18
7.4 Safety The main safety objectives in GUIDE-IT are to characterize the risk profiles of the two management strategies and to monitor for unanticipated risks to study participants. In this study, all medications and procedures commonly used or performed as a part of standard of care for the management of HF have well defined safety profiles. For this trial, reporting is primarily governed by the Common Rule (45 CFR Part 46, Subpart A), Investigational Device Exemptions (Part 812), as well as ICH Guidelines, IRBs and local regulations. The investigator is responsible for monitoring the safety of subjects enrolled into the study at the study site. The investigator or qualified designee will enter the required initial and follow-up information regarding events into the appropriate module of the eCRF within InForm. Investigators are to report serious adverse events in accordance with their local IRB requirements. Investigators should follow usual clinical practices at their institution for reporting to regulatory authorities serious, unexpected events related to standard of care medications and devices.
7.4.1 Collection and Reporting An adverse event (AE) is any untoward medical occurrence in a patient or clinical investigational subject administered an investigational intervention and which does not necessarily have a causal relationship with this treatment. An AE can therefore be any unfavorable and unintended sign (including an abnormal laboratory finding), symptom, or disease temporally associated with the investigational intervention, whether or not considered related to the investigational intervention (ICH1996). In this trial, a serious adverse event (SAE) is any untoward medical occurrence that may result in any of the following outcomes:
Is life-threatening Results in persistent or significant disability/incapacity Is a congenital anomaly/birth defect
Important medical event that may not result in death, be life-threatening, or require hospitalization may be considered a SAE when, based upon appropriate medical judgment, it may jeopardize the patient or subject and may require medical or surgical intervention to prevent one of the outcomes listed above
Non-serious AEs will not require collection in this trial. Serious adverse events will be collected within InForm from randomization through the completion of the follow-up period. The following trial endpoints will be collected on the eCRF and will not be captured separately as SAEs on the AE eCRF. These events will be monitored at regular intervals, and will be adjudicated by the CEC and reviewed by the DSMB:
All deaths All hospitalizations
7.4.2 Safety Events of Interest The following AEs of interest, which may or may not meet serious criteria, will be collected from randomization through the completion of the follow-up period.
Symptomatic hypotension Symptomatic bradycardia Hyperkalemia (Potassium > 6.0 meq/dl or requiring change in therapy) Worsening renal function (increase in creatinine by 0.5 g/dl from last visit or requiring change in therapy)

August 6, 2012 Page 19
The Investigator will follow all SAEs until resolution, stabilization or the event is otherwise explained.
8. STATISTICAL CONSIDERATIONS
8.1 Determination and Justification of Sample Size Several design factors and research objectives have been considered in developing an appropriate sample size for the study. First, patient enrollment has been determined so there would be a sufficient number of endpoints to provide a high degree of confidence for testing the primary hypothesis. Second, the statistical power for secondary endpoints has been considered, including the EQOL endpoints. Finally, the sample size has been determined to provide a reasonable level of confidence for detecting clinically important differences in outcome between the two strategies—even if current projections of enrollment rates and hypothesized differences in clinical outcomes between the two arms prove to be optimistic. Based on the anticipated patient population, we have projected a 1-year CV death and HF hospitalization
r patient population will be similar to that on the EVEREST study, a contemporary multicenter trial of patients with systolic HF randomized at the time of HF hospitalization and followed for a median of 10 months.48 In EVEREST, the
-analysis of Felker all-cause mortality with biomarker-guided therapy, the
impact of biomarker-guided therapy can conservatively be expected to reduce the primary composite endpoint (which we expect to be more sensitive to the effects of the biomarker-guided strategy than all-cause 1 year). Based on the event rates for each arm discussed above, we have determined the sample size required to
actual event rates and the outcome differences between the two testing strategies in GUIDE-IT may vary somewhat from these estimates, and we have determined the power of the study under several different combinations of enrollment rates, event rates and effect sizes. We have conducted the power analyses using simulation studies to mimic the key features of GUIDE-IT. As the primary treatment comparisons will be based on a time-to-event endpoint using the Cox proportional hazards model, we created 1,000 data sets under each condition, and analyzed them using the Cox regression model to estimate the power under a variety of assumptions about the enrollment rates, event rates and effect sizes (Table 2).

August 6, 2012 Page 20
Table 2. Summary of the Power Simulations for the Primary Endpoint Control Event Rate*
Biomarker-guided Event Rate*
Relative Event Rate Reduction
Enrollment Rate (per month)
Estimated
Number of Primary Endpoint
Events
Minimum follow-up (months)
Total Study Duration
(month)**
40% 32% 20% 35 89.4 566 12 52 35 67.1 579 12 52 35 84.6 506 12 52 35 57.7 518 12 52 35 93.8 623 12 52 35 76.3 637 12 52
40% 32% 20% 35 91.2 605 24 64 35 69.6 618 24 64 35 86.8 542 24 64 35 58.9 555 24 64 35 95.8 662 24 64 35 77.2 677 24 64 26.25 89.7 573 12 62 26.25 67.3 586 12 62 26.25 85.1 513 12 62 26.25 57.8 525 12 62 26.25 94.0 630 12 62
4 26.25 76.2 644 12 62 *1-year event rate. **Duration from study award date to last patient in the last study visit—the assumed yearly rate of loss to follow-
- .
8.2 Projected Enrollment rate We anticipate starting enrollment within 6 months from the study award date to finalize the protocol, complete DSMB review and approvals, and activate the sites. Given the complexities of site contracts, IRB approvals and regulatory requirements, we conservatively expect to activate 5 sites each month for enrollment. The recent NHLBI-funded HF-ACTION study enrolled a similar patient population, but required those patients to complete exercise training, which limited recruitment. The average enrollment for HF-ACTION in the U.S. was 0.84 patients per site per month. The 2-site STARBRITE study of biomarker-guided therapy enrolled 137 patients over a 28-month period for an average rate of 2.4 patients per site per month32. In the single-center PROTECT study of biomarker-guided therapy, a total of 151 patients were enrolled over a 2-year period for an average rate of 6.3 patients per site per month.49 For ASCEND HF, the U.S. enrollment rate varied between 1.5-2 patients per site per month. GUIDE-IT’s enrollment will resemble a combination of these trials—patients will be identified at the time of acute HF, and, much like an outpatient HF study, they will be randomized soon after discharge. We believe that once a site is activated, an enrollment rate of 1 patient per site per month is achievable. Once all sites are activated, the target enrollment for GUIDE-IT will be 35 patients per month.
8.3 Projected Event Rates In EVEREST, the event rate for CV death or HF hpatient population, we have assumed a 1-year event rate with control arm, which we believe is a conservative estimate. Unlike EVEREST, GUIDE-IT will require elevated natriuretic peptide levels during the index hospitalization, a powerful marker of increased risk, suggesting GUIDE-IT will have a higher event
were created using randomly generated exponential variables. The non-CV death and the loss-to-follow-up

August 6, 2012 Page 21
rates were generated as independent exponential random variables with 1- variable. In the simulations, the primary outcome variable was censored if the non-CV death or loss-to-follow-up occurred first. The non-CV death rate was based on unpublished data from EVEREST. Drop-in and drop- 2-year follow-up. At the time of drop-in or drop-out, the hazard rate was switched to the rate for the other treatment group.
8.4 Anticipated Effect Size We planned the sample size to detect a relative reduction in the 1-year event rate of 0.20. The power simulations shown below also examine the power with tive reductions. Simulations with relative
Results are based on 1,000 simulated data sets in each scenario with a 2-sided Type I error rate of 0.05 (Table 2). The estimated power is based on the proportion of simulations using the Cox regression model Wald chi-square p-value < 0.05. It is expected that the final subject enrollment will be followed for 12 months resulting in follow-up times varying from 12 to 24 months. However, to illustrate the power increase of additional follow-up, we have examined scenarios with 24 months follow-up on all patients.
1-year biomarker-guided
with the proposed sample size of 1,100 subjects. With the same event and enrollment rates, we would for 24 months. If per site enrollment
is lower than we project at 1 patient per site per month and is closer to 0.75 patients per site per month, Table 1 shows that we can still achieve our target number of primary outcome events by extending the study duration by 10 months. Alternatively, we will have the option of adding more sites in order to maintain total study enrollment at 35 patients per month. Although GUIDE-IT has been powered for the primary endpoint of time-to-CV death or HF hospitalization, a key secondary endpoint is the time to all-cause mortality. The power for this endpoint was evaluated with simulations as described above. With an assumed 1-year all-
-analysis of biomarker-guided therapy.
8.5 Power Calculations for Age Group by Treatment Interaction Two prior studies (TIME-CHF and BATTLESCARRED) stratified randomization by age (> or < 75) and pre-specified sub-group analysis based on age.31,33 Although these subgroups were small, the beneficial effects of biomarker guidance in both studies appeared to be primarily in patients < 75. Given that HF is primarily a disease of the elderly, whether there is a differential treatment effect based on age is of substantial clinical relevance and will be examined in GUIDE-IT. To determine the power to detect possible interactions by age, we have simulated data as described above. Additional parameters were added to define the proportion of the population above 75 years of age, and to define event rates that differ by age group. A binary variable was created to identify those patients in the biomarker-guided group and those 75 or more years of age. The results of the simulations are shown in Table 3. With a sample size of 1,100
1- 1-year event
2-sided 0.05 level.
August 6, 2012 Page 22
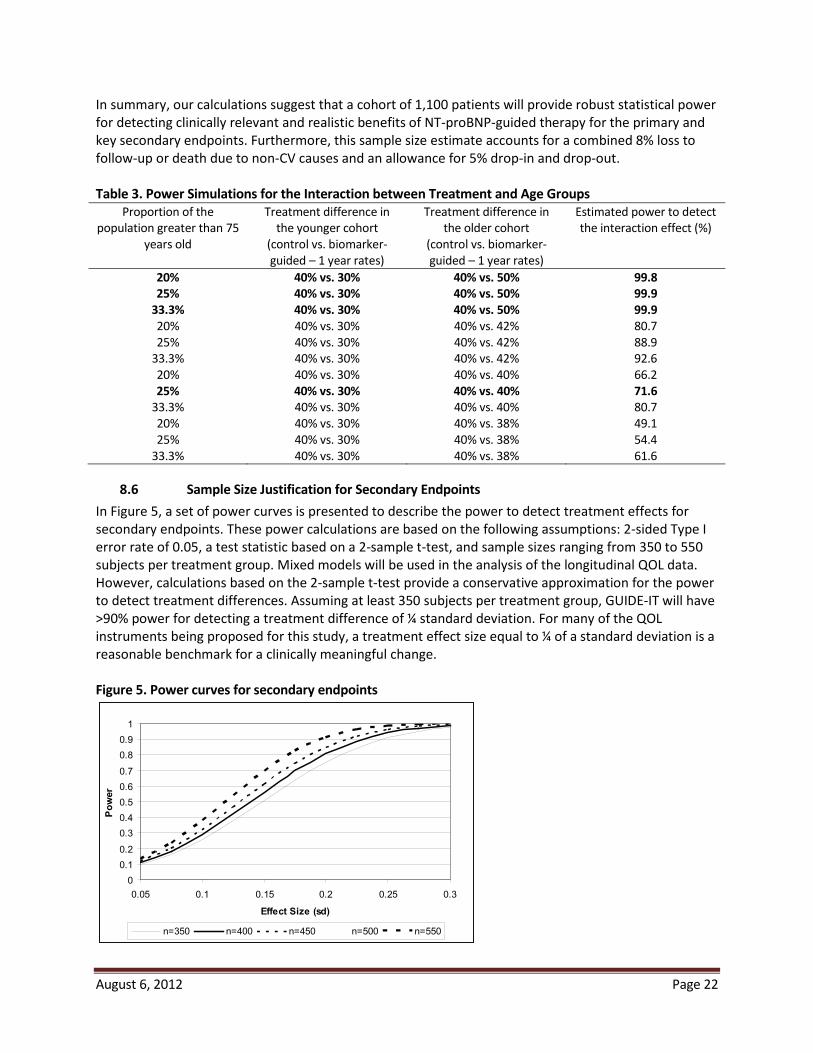
In summary, our calculations suggest that a cohort of 1,100 patients will provide robust statistical power for detecting clinically relevant and realistic benefits of NT-proBNP-guided therapy for the primary and key secondary endpoints. Furthermore, this sample size estimate accfollow-up or death due to non- -in and drop-out.
Table 3. Power Simulations for the Interaction between Treatment and Age Groups
Proportion of the population greater than 75
years old
Treatment difference in the younger cohort
(control vs. biomarker-guided – 1 year rates)
Treatment difference in the older cohort
(control vs. biomarker-guided – 1 year rates)
Estimated power to detect
20% 40% vs. 30% 40% vs. 50% 99.8 25% 40% vs. 30% 40% vs. 50% 99.9
33.3% 40% vs. 30% 40% vs. 50% 99.9 80.7 88.9 92.6
66.2 25% 40% vs. 30% 40% vs. 40% 71.6
4 80.7 49.1 54.4 61.6
8.6 Sample Size Justification for Secondary Endpoints In Figure 5, a set of power curves is presented to describe the power to detect treatment effects for secondary endpoints. These power calculations are based on the following assumptions: 2-sided Type I error rate of 0.05, a test statistic based on a 2-sample t-test, and sample sizes ranging from 350 to 550 subjects per treatment group. Mixed models will be used in the analysis of the longitudinal QOL data. However, calculations based on the 2-sample t-test provide a conservative approximation for the power to detect treatment differences. Assuming at least 350 subjects per treatment group, GUIDE-IT will have
reasonable benchmark for a clinically meaningful change. Figure 5. Power curves for secondary endpoints
00.10.20.30.40.50.60.70.80.9
1
0.05 0.1 0.15 0.2 0.25 0.3
Effect Size (sd)
Pow
er
n=350 n=400 n=450 n=500 n=550

August 6, 2012 Page 23
8.7 Statistical Analysis: General Approach Statistical analysis will be performed by the GUIDE-IT data coordinating center (DCC) at Duke Clinical Research Institute (DCRI). All major treatment comparisons between the randomized groups in this trial will be performed according to the principle of "intention-to-treat;" that is, subjects will be analyzed (and endpoints attributed) according to the treatment strategy to which patients are randomized, regardless of subsequent additional post-randomization treatment and medical care. Statistical comparisons will be performed using 2-sided significance tests. Additional perspective regarding the interpretation of the data will be provided through extensive use of confidence intervals and graphical displays. Baseline demographic and clinical variables will be summarized for each randomized arm of the study, for example: relevant descriptors from the history, physical and laboratory examination; CV risk factors; co-morbidity descriptors; and course of the patient’s symptoms. Descriptive summaries of the distribution of continuous baseline variables will be presented in terms of percentiles (e.g., median, 25th and 75th percentiles), while discrete variables will be summarized in terms of frequencies and percentages. Because randomization is expected to produce excellent balance at baseline between the two arms of the trial, statistical comparisons of treatment groups with respect to baseline characteristics will be more informal. For comparisons of continuous baseline variables, emphasis will be given to nonparametric procedures such as the Wilcoxon rank sum test. Group comparisons with respect to discrete baseline variables will use the conventional chi-square test or Fisher’s Exact Test as appropriate.
8.8 Analysis for the Primary Hypothesis The statistical comparison of the two randomized arms with respect to the primary endpoint will be a time-to-event analysis, and therefore will be based on the time from randomization to the first occurrence of CV death or HF hospitalization. The Cox proportional hazards regression model will be the primary tool
confidence interval for summarizing the difference in outcomes between the two treatment arms will be computed using the Cox model. This comparison will constitute the primary statistical assessment of the effect of biomarker guidance versus usual care on overall clinical outcomes. The Cox model will include an indicator variable for treatment group and baseline adjustment variables for age, gender, NT-proBNP, diabetes mellitus and ejection fraction. In order to select the best set of adjustment covariates, we reviewed prognostic models from other large datasets in chronic HF. We selected covariates based upon the importance of choosing variables with minimal missing data and adjusted the primary analysis for the following baseline variables: age, NT-proBNP, ejection fraction, and diabetes mellitus.
8.9 Supportive Analyses of the Primary Endpoint If the data provide evidence of an overall difference in outcome between randomized arms, we will examine whether the effect is similar for all patients, or whether it varies according to specific patient characteristics. In particular, we will focus on whether the relative benefit differs according to patient age, sex, race, co-morbidity, and selected risk factors. These analyses will use the Cox model by testing for interactions between the randomized groups and specific baseline variables. In addition to the statistical hypothesis testing, Kaplan-Meier survival estimates will be constructed based on the time from randomization to the first occurrence of CV death or HF hospitalization.

August 6, 2012 Page 24
8.10 Analysis of Secondary Endpoints Secondary endpoints will include the following: (a) time to all-cause mortality, (b) time to CV death or CV hospitalization, (c) time to all-cause mortality or all-cause hospitalization, (d) total days alive and out of the hospital, (e) HRQOL, and (f) costs, resource use, and cost effectiveness. In addition, we will monitor and report major adverse events (other than the endpoints listed above). The analyses for the time-to-event secondary endpoints will be similar to those outlined for the primary endpoint using the time from randomization through the first occurrence of any component of a specific secondary endpoint (or censoring) as the response variable, and assessing group differences using the Cox proportional hazards model. The effect of the NT-proBNP-guided treatment strategy on these time-to-event secondary endpoints will be summarized using hazard ratios (with associated confidence intervals) computed from the Cox model. Kaplan-Meier curves will be constructed to display the cumulative event rates of the two treatment groups. For analysis of the total days alive and out of the hospital endpoint, we will apply the inverse probability weighted estimators of Bang and Tsiatis to account for the potential bias due to censored and incomplete data.50
8.11 Multiple Comparisons and Composite Endpoints With the primary hypothesis and the various secondary endpoints, there is a multiplicity of analyses to be performed and an increased probability that at least one of the comparisons could be "significant" by chance. There are adjustments (e.g., based on the Bonferroni inequality) that can be used to preserve the overall type I error level by adjusting for the multiplicity of secondary endpoints by requiring small significance levels for every comparison. We will be conservative in the interpretation of these analyses, taking into account the degree of significance, and looking for consistency across endpoints. Also, we have pre-specified the primary and secondary outcome variables to help avoid over-interpretation and to reduce the problems inherent with multiple testing. A related issue is the interpretation of composite endpoints in clinical trials. To understand the importance of the components of the primary endpoint, we will estimate the treatment effect and frequency of each component (CV mortality and HF hospitalization) separately. Based on the prior biomarker-guided studies in HF, we have pre-years of age) as a key subgroup of interest. The examination of this subgroup will include a formal test of
intervals will be used to examine the consistency of the treatment effect across subgroups.
8.12 Exploratory Endpoints In order to explore the contribution of recurrent hospitalization and quality of life to the overall efficacy and safety of biomarker guided therapy, alternative methodologies for assessing multiple endpoints will be analyzed. These will include the global rank approach as previous described51. Generally, a pre-specified hierarchy of endpoints will be created that will include death, hospitalization, and quality of life. All patients will be ranked according to this hierarchy, and the primary statistical comparison will be the comparison of ranks between the treatment and control group. An alternative approach to be explored will be the “win ratio” as described by Pocock et al52. In this approach, patients randomized to biomarker guided therapy and control will be matched based on baseline characteristics, and the overall post randomization experience between each pair will be compared using a pre-specified hierarchy of endpoints in order to determine a “winner”. The primary metric will be the proportion of pairs with the biomarker guided arm wins relative to control.

August 6, 2012 Page 25
8.13 Analysis of Economic and Quality of Life Data For each of the QOL measures examined in this study, data analysis will proceed in several stages. Initially, we will provide simple descriptive and comparative analyses by intention-to-treat. A nonparametric
p-values. Since there is currently no consensus in the statistical literature about the best way to deal with the multiple comparisons problem arising from testing each individual scale at each time point separately, we propose two complementary approaches. First, we will pre-specify the overall summary score from the KCCQ and functional status using the Duke Activity Status Index as the primary QOL comparisons of interest and assign all other comparisons to a secondary (descriptive) status. Second, we will fit mixed models, which make use of all available QOL data at each study assessment point. Statistical power estimates for the KCCQ, based on data collected in the HF-ACTION trial demonstrate that we should have >
standard deviation difference (about 5 points on a 0-100 scale) in the KCCQ overall score and in the DASI (about 4 points on a 0-58 scale). We expect refusal rates to be quite low overall. In a 2966-patient QOL substudy iThe rate of patient incapacity expected for GUIDE-IT is uncertain, but should be similarly low. Several important methodologic challenges must be considered in the analysis of QOL data: the effect of differential mortality in the treatment arms and the effect of missing data (from death, incapacity or loss to follow-up). Our approach to missing data is to minimize it as much as possible. If the primary study hypotheses are confirmed, analysis of QOL data may be complicated by the fact that the biomarker-guided strategy was more successful at keeping patients alive. Even a relatively small difference in mortality due to treatment may create a paradox in the QOL data such that the more effective therapy is associated with worse QOL (for example, if the patients with the worst QOL died in the usual care arm but were saved in the biomarker-guided arm.) We will address this problem by estimating the Survivor Average Causal Effects, which involves a counterfactual analysis to predict the QOL scores of interest assuming that the patient had not died or been otherwise unable to provide their own data. For the economic analyses, the primary statistical comparisons between the two treatment arms will be performed by intention-to-treat. A nonparametric bootstrap will be used to estimate treatment
-values. Estimates and confidence limits around the observed cost differences can be created using several different approaches. In recent work, we have used bootstrap methods for this. Although our data analysis will not make parametric assumptions about the distributions of costs, we can approximate the precision of our estimates by assuming that costs follow a log-normal distribution. Previous studies suggest that this is a reasonable assumption. For data that are log normally distributed, the coefficient of variation (i.e., the standard deviation divided by the mean) remains constant, an observation that we have seen empirically across different studies and treatment arms. In fact, our experience has shown that the coefficient of variation is very close to 1 (i.e., the standard deviation is equal to the mean). Under the assumption of log normal distributions and CV=1, with > 500 patients (>
treatments to within approximately 0.12 standard deviations based on the half-width (1.96 times the l. This means, for example, if the mean cost per treatment
estimate for the difference +/- $1,208. In order to provide a second (descriptive) perspective on cost differences for each strategy in GUIDE-IT, we will also directly measure major health care resource items used including hospital days (e.g., intensive

August 6, 2012 Page 26
care, step-down units, wards) and cardiac procedures (e.g., ICD, VAD placement, catheterization, coronary revascularization, atrial fibrillation ablation) as well as selected smaller ticket items such as outpatient physician and emergency department visits. A basic set of resource data will be collected on the eCRF, and will be supplemented by the additional resource data that can be collected from the detailed hospital billing forms. To estimate the incremental cost effectiveness of the biomarker-guided approach relative to usual care, we will calculate a base case cost-effectiveness ratio that defines the incremental cost required to add an extra life year with the biomarker-guided strategy relative to usual care. A second series of analyses will calculate the corresponding cost-utility ratio, using utility data from the EQ-5D collected in the GUIDE-IT trial. These analyses will use the societal perspective and a lifetime time horizon so that the estimated incremental cost-effectiveness and cost-utility ratios can be compared with societal benchmarks. Where extrapolations from empirical data and other assumptions are required, they will be based, to the extent possible, on the empirical data from the GUIDE-IT trial and will be accompanied by appropriate examination of the effects of uncertainty using both stochastic methods and sensitivity analyses. For descriptive purposes, we will also calculate within-trial cost-effectiveness and cost-utility ratios, since they do not require any extrapolations. However, these within-trial ratios are limited due to their failure to account fully for long-term benefits and costs, and the absence of comparative benchmarks. At the time of analysis, costs will be adjusted to the most recent year for which the Producer Price Index has been published. Both costs and life expectancy will be discounted to present valu
ned in sensitivity analyses). Since many of the patients will remain alive at the conclusion of the trial, a method is required for converting observed trial experience into the corresponding lifetime survival and cost figures needed for use in the incremental cost-effectiveness calculations. There are three general methods that we have previously used to make the necessary lifetime extrapolations called for in cost-effectiveness analysis: use of the trial data for extrapolation, use of secondary data sources to base the extrapolations upon, and use of Markov models. GUIDE-IT will provide a rich empirical data set involving up to 2 years of clinical outcome, cost, and utility data, with over 2,000 patient-years of follow-up information. We will use these data in age-based survival models to create estimates for each GUIDE-IT patient of life expectancy, quality-adjusted life expectancy and lifetime medical costs. The method, in brief, involves 5 basic steps. 1) Using Cox Proportional Hazards regression methodology for left-truncated and right-censored data, we model the hazard of death as a function of age, adjusting for additional prognostic factors through covariates. This model "adjusts for" age as the metric over which the hazard is computed, treats additional prognostic factors as covariates, and stratifies on treatment group (if necessary to satisfy the proportional hazards assumption). By estimating the hazard over the age metric (rather than over the time metric, as is traditionally done), we can produce data-based survival predictions through a much longer time period due to the broad representation of ages in our database. 2) This hazard relationship, which under proportional hazards is well estimated through the age range represented in our data, is used for prediction on a patient-by-patient basis. The predicted survival estimates for each patient are then combined with the empirical GUIDE-IT survival data and averaged over all the patients for both treatment groups. 3) Again using a Cox Proportional Hazards regression model, together with the post-HF hospitalization survival experience available in the GUIDE-IT data (and if necessary, secondary data sources available at the DCRI including HF-ACTION), we will estimate the long-term survival impact of a HF hospitalization, the non-fatal component of the study primary endpoint. This model will provide a quantitative measure of the increased relative risk attributable to these non-fatal events for later incorporation in the individual patient predictions. 4) For the oldest age range, where the amount of

August 6, 2012 Page 27
empirical data may not be sufficient, we will use a Gompertz-based function for extrapolation. The estimated mean survival curves are integrated over a lifetime to obtain life expectancy for each treatment group. 5) The difference between the areas under each survival curve is computed to obtain the biomarker-guided arm incremental life expectancy. Uncertainty in cost-effectiveness estimates related to sampling variation will be quantified using non-parametric bootstrap techniques (1,000 samples with replacement with a cost-effectiveness ratio calculated for each sample) and expressed in three complementary formats. First, cost-effectiveness ratios arising from the bootstrap will be displayed on the cost-effectiveness plane to characterize the precision and magnitude of the estimates. Second, we will examine the net monetary benefit of the intervention, defined as the difference between the increase in effectiveness (valued using the willingness- to-pay threshold per unit of effectiveness), and the increase in cost. Net monetary benefit and associated confidence intervals will be displayed for a range of willingness-to-pay thresholds. Finally, we will plot the cost-effectiveness acceptability curve, which indicates the probability that that the intervention is cost effective (i.e., incremental net benefit > 0) for a range of willingness-to-pay thresholds. We will also perform sensitivity analyses to address uncertainty related to methodological assumptions regarding key parameters. If appropriate, bootstrap analyses will be repeated for alternative parameter values. It must be emphasized that although the general plan of our cost-effectiveness analyses can be specified prospectively, there is clearly an iterative quality to building successful cost-effectiveness models.
8.14 Data Safety Monitoring Board and Interim Analyses For ethical reasons, an interim examination of key safety and endpoint data will be performed at regular intervals during the course of the trial. The primary objectives of these analyses will be to evaluate the accumulated data for high frequency of negative clinical outcomes in either of the two randomized arms. In addition, the interim monitoring will also involve a review of the control arm event rates, patient recruitment, compliance with the study protocol, status of data collection, and other factors that reflect the overall progress and integrity of the study. The results of the interim analyses and status reports will be carefully and confidentially reviewed by an NHLBI-appointed DSMB. It is anticipated that the DSMB will meet every 6-months to review the accumulating data. Prior to each meeting, the DCC will conduct any requested statistical analyses and prepare a summary report along with the following information: patient enrollment reports, rates of compliance with the assigned testing strategy, frequency of protocol violations, and description of SAEs (statistical comparisons of the randomized arms with respect to these SAEs will use chi-square or other appropriate 2-sample methods). The extracted data files and analysis programs for each DSMB report will be archived and maintained at the DCC for the life of the study. For futility monitoring, we will apply the inefficacy monitoring rule of Freidlin, Korn, and Gray53 to stop the trial if the biomarker-guided strategy is not beneficial. We propose to use the conservative boundary LIB0 along with a harm look
events are expected and the first interim review for futility and efficacy would be scheduled to occur after approximately 140 primary endpoint events have been observed. If the data suggested a benefit for the usual care arm with a p-value of <0.05, the Freidlin, Korn, and Gray approach would suggest stopping the
k. The second interim review would be scheduled after approximately 241 primary endpoint events have been observed. , the LIB0 conservative boundary would suggest stopping the trial for inefficacy if the biomarker-guided arm had a hazard ratio > 1.0 compared to usual-care arm. The Freidlin, Korn, and Gray approach will result in a
August 6, 2012 Page 28
trivial loss of power and requires no sample size adjustment. The DSMB will weigh any trade-offs between short-term versus long-term results. We propose to use the method of Haybittle and Peto as a guide in interpreting interim efficacy analyses.54,55 every assessment until the planned final analysis. Because of the conservatism throughout the trial, the critical value at the final analysis is conducted at the "nominal" critical value. The DSMB will weigh any trade-offs between short-term versus long-term results. The DSMB will play a valuable role in advising the study leadership on the relevance of advances in the diagnosis and treatment of patients with systolic HF. The DSMB would be asked to offer proper perspective on any therapeutic or diagnostic testing advances that may occur during the course of the trial. If protocol modifications are warranted, close consultation among the DSMB, the NHLBI staff and the study leadership will be required. A separate DSMB charter will outline the operating guidelines for the committee, and the protocol for evaluation of data—the charter will be created prior to patient randomization and agreed upon during the initial meeting of the DSMB. Minutes of all DSMB meetings will be prepared and distributed to committee members.
9. DATA MANAGEMENT PROCEDURES
9.1 Electronic Data Capture (EDC) System To ensure an efficient and timely data capture system, a rapid transmission and integration of this information into the trial processes and study database, and the elimination of paper documents, the web-based electronic data capture system, known as InForm will be used.
9.2 Electronic Case Report Form (eCRF) The eCRF for GUIDE-IT will have several forms including enrollment and demographics, relevant history, HF symptoms, physical exam results, laboratory results, baseline biomarker levels, and other baseline presenting characteristics; follow-up worksheets for use during regular follow-up visits and to track the patient’s clinical course over time; and event worksheets for recording the circumstances and details surrounding the occurrence of a death or hospitalization. Economics and Quality of Life (EQOL) data will be collected as summarized above and detailed in the Manual of Operations. A dictionary, glossary of terms and instructions for completing the forms will be provided to the sites.
9.3 Data Management Process We will use InForm software (described above) for data entry, screen handling and simple reports. We will use an Oracle database server on an existing UNIX-based network server for this operational database management. Data will be entered into the InForm eCRF by clinical site personnel. Any out-of-range values and missing key variables will be flagged and addressed, or answered at the site during the data entry process, allowing many queries to be resolved in real-time. Queries can also be generated from manual review of the data forms. These will be entered into the database and tracked in the same manner as the computer-generated queries. We will compare distributions of selected variables across sites to ensure that consistent definitions are used. Examples of these variables include the following: frequency of missing critical variables, biological or medical history parameters, fields that define study procedure compliance and safety irregularities. In our surveillance, we will use statistical process control to ensure that issues not likely to be the result of normal random variation are investigated. The DCRI will create reports to identify trends in the data that may require additional clarification and training. These reports will be available to the sites and to the study leadership, as we work with the sites to correct negative trends and eliminate future data errors.

August 6, 2012 Page 29
The DCRI will perform internal database quality-control checks and data audits during the trial and at the conclusion to track the frequency of random errors and to identify any systematic deviation requiring correction. Patients whose data are audited will be randomly selected from the total enrollment. Data management operations are also reviewed internally for their compliance with standard procedures, rules and guidelines for processing, quality control and productivity.
9.4 Data Quality Control Data quality control goes beyond the data management process. All groups at the DCRI will work in tandem to ensure that the data collected in this study are as complete and correct as possible. A 4-step, multi-functional approach to data quality control will be implemented and is summarized below:
1. Training: Prior to the start of enrollment, the physician investigators and study coordinators at each site will be trained with the clinical protocol and data collection procedures, including how to use the InForm system and complete the eCRF data. Initial investigator and coordinator training will occur with an InForm trainer and hands-on database interaction. This trainer will present slides, demonstrate key InForm functionality and guide attendees through practice exercises. Follow-up training and training for new study personnel will be conducted by DCRI personnel who will present slides, demonstrate the system and guide attendees through practice exercises using on-line web-based teleconferences.
2. Monitoring: The clinical and data coordinating center will ensure that data collection is being handled properly, will provide in-service training, and address questions from site investigators and coordinators. Data quality and completeness will be reviewed by the DCRI team on a regular and ongoing basis, and any issues noted will be addressed with the site. Monitoring visits will be completed as described in the Clinical Monitoring Plan.
3. Managing data: After the data have been transferred to SAS for statistical summarization, data description, and data analysis, further cross-checking of the data will be performed with discrepant observations being flagged and appropriately resolved through a data query system.
4. Reviewing data: Deaths and hospitalization events will be reviewed by the CEC to ensure an appropriate standardized classification of the component events comprising the primary composite endpoint. The DCC will provide the CEC with detailed information for classification and adjudication of these events. The CEC will be blinded to the randomized treatment strategy assignment to ensure unbiased evaluation of outcome events.
10. STUDY GOVERNANCE AND COMMITTEES The governance and management of the GUIDE-IT study will be organized as follows.
10.1 Clinical Coordinating Center (CCC) The CCC will be at the DCRI. The CCC functions as a clinical trial center and is responsible for all aspects of conducting this trial, including: clinical operations; oversight of all committees and working groups; development of the protocol and all amendments; site identification, recruitment, education, and retention; oversight of core laboratories; quality control; site reimbursement; monitoring of study progress; maintenance of a 24-hour helpline for questions from clinical sites; and leadership in data analysis, presentations, and publications. Clinical Operations is the critical functional component of the CCC, and will provide project management; development and preparation of study materials; site management; education of all site-based personnel on the rationale, design, and execution of GUIDE-IT; oversight of the study helpline; and assistance with preparation of manuscripts and publications.

August 6, 2012 Page 30
The CCC will be the primary day-to-day contact for sites. CCC staff will develop and implement educational and training plans, communication initiatives including phone and email contact, conference calls, newsletters, website, and will use social networking technology. The CCC staff will collaborate with the sites to ensure their understanding of the protocol, the operationalization of the protocol, and the successful identification of eligible patients for screening and enrollment. From working on many other multicenter randomized controlled studies, these project team members bring substantial operational experience. The CCC expects that our efforts to significantly vet sites for interest and capabilities, to extensively educate sites, and to carefully and clearly state the expectations for sites will minimize problems with sites performance. An important asset to the site management component of the CCC will be the use of the DCRI’s Clinical Trials Management System, a web-based application that provides the DCRI project teams with direct access to trial data, and can be used to manage various aspects of the study, including: protocols, accounts, contracts, sites, site monitoring, and subject management. Using this centralized system will ensure an integrated approach to handling trial information, and will help the CCC and the DCC work together seamlessly.
10.2 Data Coordinating Center (DCC) The DCC will be at the DCRI. The DCC will support the GUIDE-IT trial in study design, study start-up, and project implementation. This includes developing the eCRF and instructions; establishing data management methods; creating and maintaining a patient database; resolving queries; collecting and reporting SAEs; analyzing the data; and assisting with trial design, protocol development, presentations and manuscripts.
10.3 Economics and Quality of Life Core The EQOL core will be at the DCRI. Integration of the EQOL core into overall trial operations will be facilitated by the fact that the CCC, DCC, and EQOL are all located at DCRI. The CCC, DCC, and EQOL core will coordinate site management and data management activities as they relate to the collection of EQOL data.
10.4 Biomarkers Core Lab and Biorepository The core lab and biorepository will be located at the NC Research Campus at Kannapolis, a joint enterprise between the research universities of NC to provide core lab services. Instructions for collection, processing, labeling, and shipping of biological specimens will be provided in a manual of operations.
10.5 Executive Committee The Executive Committee is the primary decision making body of the study and is responsible for its successful completion. The Executive Committee will meet weekly by teleconference. They will review and have input on the trial protocol, manual of operations, monitoring plan, electronic case report form (eCRF), site materials, data management plan and statistical plan. On issues requiring a vote, 1 vote per member will be allowed. This Committee will meet in person at least twice a year, typically at the annual scientific sessions of the American Heart Association and American College of Cardiology. All members of the Executive Committee will be expected to make ongoing substantive intellectual and operational contributions to the study.
10.6 Steering Committee The Steering Committee will address enrollment issues, education and training to promote compliance with the study protocol. Membership will include the EC, committee chairs, core lab directors, and other
August 6, 2012 Page 31
selected site PIs, selected study coordinators, and other members as required. The Steering Committee will meet in person and/or via teleconference throughout the conduct of the trial.
10.7 Clinical Event Classification Committee The Clinical Events Classification Committee (CEC) is an independent committee providing independent and blinded adjudication of determined primary outcome events. Members of the CEC will not be participating in the GUIDE-IT study in any way, and will be blinded as to treatment assignment. Endpoint definitions will be formulated prior to the initiation of the study, and will be approved by the EC. A charter will be developed to guide CEC activities.
10.8 Adherence Committee This committee will serve to promote and monitor investigator adherence to the study protocol, particularly with regard to responsiveness to natriuretic peptide levels in the biomarker-guided arm. They will review data on adherence to the protocol and results of interventions by the CCC on a monthly basis. When necessary, the committee will intervene with individual investigators or the investigators as a whole. Given the importance of adherence to testing the hypothesis of GUIDE-IT (as outlined in the Research Plan), the Adherence Committee will play an active and engaged role in the ongoing operations of the study.
10.9 Biomarkers and Genetics Committee The Biomarkers and Genetics Committee will establish and operationalize policies and procedures for analysis of biorepository samples by GUIDE-IT investigators.
10.10 Publications and Presentations Committee The Publications and Presentations Committee will review publication proposals and manuscripts, and will assist in dissemination of trial results.
10.11 Data and Safety Monitoring Board (DSMB) The DSMB is an independent committee that oversees the safety of research subjects. It is anticipated that the DSMB will meet every 6-months to review the accumulating data. Prior to each meeting, the DCC will conduct any requested statistical analyses and prepare a summary report along with the following information: patient enrollment reports, rates of compliance with the assigned testing strategy, frequency of protocol violations, and description of SAEs (statistical comparisons of the randomized arms with respect to these SAEs will use chi-square or other appropriate 2-sample methods). The extracted data files and analysis programs for each DSMB report will be archived and maintained at the DCC for the life of the study.
11. REGULATORY ISSUES
11.1 Ethics and Good Clinical Practice This study must be carried out in compliance with the protocol and in accordance with DCRI standard operating procedures. These procedures are designed to ensure adherence to Good Clinical Practice, as described in the following documents:
1. ICH Harmonized Tripartite Guidelines for Good Clinical Practice 1996.
2. US 21 Code of Federal Regulations dealing with clinical studies (including parts 50 and 56 concerning informed consent and IRB regulations).

August 6, 2012 Page 32
3. Declaration of Helsinki, concerning medical research in humans (Recommendations Guiding Physicians in Biomedical Research Involving Human Subjects, Helsinki 1964, amended Tokyo 1975, Venice 1983, Hong Kong 1989, Somerset West 1996).
The investigator agrees, when signing the protocol, to adhere to the instructions and procedures described in it and thereby to adhere to the principles of Good Clinical Practice that it conforms to.
11.2 Institutional Review Board/Independent Ethics Committee Before implementing this study, the protocol, the proposed informed consent form and other information to subjects, must be reviewed by a properly constituted Institutional Review Board/Independent Ethics Committee (IRB/IEC). A signed and dated statement that the protocol and informed consent have been approved by the IRB/IEC must be given to the Coordinating Center before study initiation. The name and occupation of the chairman and the members of the IRB/IEC must be supplied to the Coordinating Center if this information is released by IRB/IEC. Any amendments to the protocol, other than administrative ones, must be approved by this committee.
11.3 Informed Consent The investigator or designee must explain to each subject (or legally authorized representative) the nature of the study, its purpose, the procedures involved, the expected duration, the potential risks and benefits involved and any discomfort it may entail. Each subject must be informed that participation in the study is voluntary and that he/she may withdraw from the study at any time and that withdrawal of consent will not affect his/her subsequent medical treatment or relationship with the treating physician. This informed consent should be given by means of a standard written statement, written in non-technical language. The subject should read and consider the statement before signing and dating it, and should be given a copy of the signed document. If written consent is not possible, oral consent can be obtained if witnessed by a signed statement from one or more persons not involved in the study, mentioning why the patient was unable to sign the form. No patient can enter the study before his/her informed consent has been obtained. The informed consent forms are part of the protocol, and must be submitted by the investigator with it for IRB/IEC approval. The Coordinating Center will supply proposed informed consent forms, which comply with regulatory requirements, and are considered appropriate for the study. Any changes to the proposed consent form suggested by the Investigator must be agreed to by the Coordinating Center before submission to the IRB/IEC, and a copy of the approved version must be provided to the Coordinating Center after IRB/IEC approval.
12. Remote Monitoring The study will be monitored remotely by representatives of the DCRI or its designee according to the prospective clinical monitoring plan (CMP) for the following purposes:
Real-time monitoring of compliance with study protocol inclusion/exclusion criteria is enabled via triggers and range checks programmed in the InForm database.
Assist site personnel who will verify data identified within query reports against source documents through frequent telephone and email contact.
Verify that written informed consent was obtained before initiation of any screening procedures that are performed solely for the purpose of determining eligibility for the clinical study and/or prior to the patient’s randomization to a procedure.
August 6, 2012 Page 33
13. REFERENCES
1. Lloyd-Jones D, Adams R, Carnethon M, et al. Heart Disease and Stroke Statistics--2009Update: A Report From the American Heart Association Statistics Committee and Stroke Statistics Subcommittee. Circulation 2009;119:e21-181.
2. Lloyd-Jones DM, Larson MG, Leip EP, et al. Lifetime risk for developing congestive heart failure: the Framingham Heart Study. Circulation 2002;106:3068-72.
3. Lindenfeld J, Albert NM, Boehmer J, et al. Executive Summary: HFSA 2010 Comprehensive Heart Failure Practice Guideline. Journal of Cardiac Failure 2010;16:475-539.
4. Jessup M, Abraham WT, Casey DE, et al. 2009 focused update: ACCF/AHA Guidelines for the Diagnosis and Management of Heart Failure in Adults: a report of the American College of Cardiology Foundation/American Heart Association Task Force on Practice Guidelines: developed in collaboration with the International Society for Heart and Lung Transplantation. Circulation 2009;119:1977-2016.
5. Lee DS, Mamdani MM, Austin PC, et al. Trends in heart failure outcomes and pharmacotherapy: 1992 to 2000. Am J Med 2004;116:581-9.
6. Johnson D, Jin Y, Quan H, Cujec B. Beta-blockers and angiotensin-converting enzyme inhibitors/receptor blockers prescriptions after hospital discharge for heart failure are associated with decreased mortality in Alberta, Canada. J Am Coll Cardiol 2003;42:1438-45.
7. Smith NL, Psaty BM, Pitt B, Garg R, Gottdiener JS, Heckbert SR. Temporal patterns in the medical treatment of congestive heart failure with angiotensin-converting enzyme inhibitors in older adults, 1989 through 1995. Arch Intern Med 1998;158:1074-80.
8. Stafford RS, Radley DC. The underutilization of cardiac medications of proven benefit, 1990 to 2002. J Am Coll Cardiol 2003;41:56-61.
9. Whellan DJ, Hasselblad V, Peterson E, O'Connor CM, Schulman KA. Metaanalysis and review of heart failure disease management randomized controlled clinical trials. American Heart Journal 2005;149:722-9.
10. Cleland JG, Louis AA, Rigby AS, Janssens U, Balk AH. Noninvasive home telemonitoring for patients with heart failure at high risk of recurrent admission and death: the Trans-European Network-Home-Care Management System (TEN-HMS) study. J Am Coll Cardiol 2005;45:1654-64.
11. Bourge RC, Abraham WT, Adamson PB, et al. Randomized Controlled Trial of an Implantable Continuous Hemodynamic Monitor in Patients With Advanced Heart Failure: The COMPASS-HF Study. J Am Coll Cardiol 2008;51:1073-9.
12. Felker GM, Petersen JW, Mark DB. Natriuretic peptides in the diagnosis and management of heart failure. CMAJ 2006;175:611-7.

August 6, 2012 Page 34
13. deFilippi CR, Christenson RH, Gottdiener JS, Kop WJ, Seliger SL. Dynamic Cardiovascular Risk Assessment in Elderly People: The Role of Repeated N-Terminal Pro-B-Type Natriuretic Peptide Testing. J Am Coll Cardiol 2010;55:441-50.
14. Morrow DA, de Lemos JA, Blazing MA, et al. Prognostic Value of Serial B-Type Natriuretic Peptide Testing During Follow-up of Patients With Unstable Coronary Artery Disease. Jama 2005;294:2866-71.
15. Wang TJ, Larson MG, Levy D, et al. Plasma Natriuretic Peptide Levels and the Risk of Cardiovascular Events and Death. N Engl J Med 2004;350:655-63.
16. Kragelund C, Gronning B, Kober L, Hildebrandt P, Steffensen R. N-Terminal Pro-B-Type Natriuretic Peptide and Long-Term Mortality in Stable Coronary Heart Disease. N Engl J Med 2005;352:666-75.
17. Januzzi JL, Jr., Sakhuja R, O'Donoghue M, et al. Utility of amino-terminal pro-brain natriuretic peptide testing for prediction of 1-year mortality in patients with dyspnea treated in the emergency department. Arch Intern Med 2006;166:315-20.
18. Fonarow GC, Peacock WF, Phillips CO, Givertz MM, Lopatin M. Admission B-Type Natriuretic Peptide Levels and In-Hospital Mortality in Acute Decompensated Heart Failure. J Am Coll Cardiol 2007;49:1943-50.
19. Cleland JG, McMurray JJ, Kjekshus J, et al. Plasma concentration of amino-terminal pro-brain natriuretic peptide in chronic heart failure: prediction of cardiovascular events and interaction with the effects of rosuvastatin: a report from CORONA (Controlled Rosuvastatin MultinationalTrial in Heart Failure). J Am Coll Cardiol 2009;54:1850-9.
20. Anand IS, Fisher LD, Chiang YT, et al. Changes in Brain Natriuretic Peptide and Norepinephrine Over Time and Mortality and Morbidity in the Valsartan Heart Failure Trial (Val-HeFT). Circulation 2003;107:1278-83.
21. McKelvie RS, Yusuf S, Pericak D, et al. Comparison of Candesartan, Enalapril, and Their Combination in Congestive Heart Failure : Randomized Evaluation of Strategies for Left Ventricular Dysfunction (RESOLVD) Pilot Study: The RESOLVD Pilot Study Investigators. Circulation 1999;100:1056-64.
22. Latini R, Masson S, Anand I, et al. Effects of valsartan on circulating brain natriuretic peptide and norepinephrine in symptomatic chronic heart failure: the Valsartan Heart Failure Trial (Val-HeFT). Circulation 2002;106:2454-8.
23. Frantz RP, Olson LJ, Grill D, et al. Carvedilol therapy is associated with a sustained decline in brain natriuretic peptide levels in patients with congestive heart failure. Am Heart J 2005;149:541-7.
24. Tsutamoto T, Wada A, Maeda K, et al. Effect of spironolactone on plasma brain natriuretic peptide and left ventricular remodeling in patients with congestive heart failure. J Am Coll Cardiol 2001;37:1228-33.
August 6, 2012 Page 35
25. Fruhwald FM, Fahrleitner-Pammer A, Berger R, et al. Early and sustained effects of cardiac resynchronization therapy on N-terminal pro-B-type natriuretic peptide in patients with moderate to severe heart failure and cardiac dyssynchrony. Eur Heart J 2007;28:1592-7.
26. Logeart D, Thabut G, Jourdain P, et al. Predischarge B-type natriuretic peptide assay for identifying patients at high risk of re-admission after decompensated heart failure. J Am Coll Cardiol 2004;43:635-41.
27. Bettencourt P, Azevedo A, Pimenta J, Frioes F, Ferreira S, Ferreira A. N-Terminal-Pro-Brain Natriuretic Peptide Predicts Outcome After Hospital Discharge in Heart Failure Patients. Circulation 2004;110:2168-74.
28. Metra M, Nodari S, Parrinello G, et al. The role of plasma biomarkers in acute heart failure. Serial changes and independent prognostic value of NT-proBNP and cardiac troponin-T. Eur J Heart Fail 2007;9:776-86.
29. Masson S, Latini R, Anand IS, et al. Prognostic Value of Changes in N-Terminal Pro-Brain Natriuretic Peptide in Val-HeFT (Valsartan Heart Failure Trial). J Am Coll Cardiol 2008;52:997-1003.
30. Latini R, Masson S, Wong M, et al. Incremental Prognostic Value of Changes in B-Type Natriuretic Peptide in Heart Failure. The American Journal of Medicine 2006;119:70-.
31. Eurlings LWM, van Pol PEJ, Kok WE, et al. Management of Chronic Heart Failure Guided by Individual N-Terminal Pro-B-Type Natriuretic Peptide Targets: Results of the PRIMA (Can PRo-brain-natriuretic peptide guided therapy of chronic heart failure IMprove heart fAilure morbidity and mortality?) Study. Journal of the American College of Cardiology 2010;56:2090-100.
32. Shah MR, Califf RM, Nohria A, et al. The STARBRITE trial: a randomized, pilot study of B-type natriuretic peptide-guided therapy in patients with advanced heart failure. J Card Fail 2011;17:613-21.
33. Jourdain P, Jondeau G, Funck F, et al. Plasma Brain Natriuretic Peptide-Guided Therapy to Improve Outcome in Heart Failure: The STARS-BNP Multicenter Study. J Am Coll Cardiol 2007;49:1733-9.
34. Troughton RW, Frampton CW, Yandle TG, Espiner EA, Nicholls MG, Richards AM. Treatment of heart failure guided by plasma aminoterminal brain natriuretic peptide (N-BNP) concentrations. Lancet 2000;355:1126-30.
35. Lainchbury JG, Troughton RW, Strangman KM, et al. N-Terminal Pro-B-Type Natriuretic Peptide-Guided Treatment for Chronic Heart Failure: Results From the BATTLESCARRED (NT-proBNP-Assisted Treatment To Lessen Serial Cardiac Readmissions and Death) Trial. J Am Coll Cardiol 2009;55:53-60.
36. Pfisterer M, Buser P, Rickli H, et al. BNP-guided vs symptom-guided heart failure therapy: the Trial of Intensified vs Standard Medical Therapy in Elderly Patients With Congestive Heart Failure (TIME-CHF) randomized trial. Jama 2009;301:383-92.
August 6, 2012 Page 36
37. Januzzi JL, Jr., Rehman SU, Mohammed AA, et al. Use of amino-terminal pro-B-type natriuretic peptide to guide outpatient therapy of patients with chronic left ventricular systolic dysfunction. J Am Coll Cardiol 2011;58:1881-9.
38. Berger R, Moertl D, Peter S, et al. N-Terminal Pro-B-Type Natriuretic Peptide-Guided, Intensive Patient Management in Addition to Multidisciplinary Care in Chronic Heart Failure: A 3-Arm, Prospective, Randomized Pilot Study. J Am Coll Cardiol 2010;55:645-53.
39. Pina IL, O'Connor C. BNP-guided therapy for heart failure. Jama 2009;301:432-4.
40. Felker GM, Hasselblad V, Hernandez AF, O'Connor CM. Biomarker-guided therapy in chronic heart failure: a meta-analysis of randomized controlled trials. Am Heart J 2009;158:422-30.
41. Porapakkham P, Zimmet H, Billah B, Krum H. B-type natriuretic peptide-guided heart failure therapy: A meta-analysis. Arch Intern Med 2010;170:507-14.
42. Effect of metoprolol CR/XL in chronic heart failure: Metoprolol CR/XL Randomised Intervention Trial in Congestive Heart Failure (MERIT-HF). Lancet 1999;353:2001-7.
43. Packer M, Bristow MR, Cohn JN, et al. The Effect of Carvedilol on Morbidity and Mortality in Patients with Chronic Heart Failure. N Engl J Med 1996;334:1349-55.
44. The SI. Effect of enalapril on survival in patients with reduced left ventricular ejection fractions and congestive heart failure. N Engl J Med 1991;325:293-302.
45. Pitt B, Zannad F, Remme WJ, et al. The effect of spironolactone on morbidity and mortality in patients with severe heart failure. Randomized Aldactone Evaluation Study Investigators. N Engl J Med 1999;341:709-17.
46. Bardy GH, Lee KL, Mark DB, et al. Amiodarone or an Implantable Cardioverter-Defibrillator for Congestive Heart Failure. N Engl J Med 2005;352:225-37.
47. Araujo JP, Azevedo A, Lourenco P, Rocha-Goncalves F, Ferreira A, Bettencourt P. Intraindividual variation of amino-terminal pro-B-type natriuretic peptide levels in patients with stable heart failure. Am J Cardiol 2006;98:1248-50.
48. Konstam MA, Gheorghiade M, Burnett JC, Jr., et al. Effects of Oral Tolvaptan in Patients Hospitalized for Worsening Heart Failure: The EVEREST Outcome Trial. JAMA 2007;297:1319-31.
49. Cleland JG, Coletta AP, Clark AL, Cullington D. Clinical trials update from the American College of Cardiology 2009: ADMIRE-HF, PRIMA, STICH, REVERSE, IRIS, partial ventricular support, FIX-HF-5, vagal stimulation, REVIVAL-3, pre-RELAX-AHF, ACTIVE-A, HF-ACTION, JUPITER, AURORA, and OMEGA. Eur J Heart Fail 2009;11:622-30.
50. Bang H, Tsiatis A. Estimating medical costs with censored data. Biometrika 2000;87:329-43.
51. Felker GM, Maisel AS. A global rank end point for clinical trials in acute heart failure. Circ Heart Fail 2010;3:643-6.

August 6, 2012 Page 37
52. Pocock SJ, Ariti CA, Collier TJ, Wang D. The win ratio: a new approach to the analysis of composite endpoints in clinical trials based on clinical priorities. Eur Heart J 2012;33:176-82.
53. Freidlin B, Korn EL, Gray R. A general inefficacy interim monitoring rule for randomized clinical trials. Clin Trials 2010;7:197-208.
54. Haybittle JL. Repeated assessment of results in clinical trials of cancer treatment. Br J Radiol 1971;44:793-7.
55. Peto R, Pike MC, Armitage P, et al. Design and analysis of randomized clinical trials requiring prolonged observation of each patient. I. Introduction and design. Br J Cancer 1976;34:585-612.

38
14. APPENDICES
14.1 Appendix A. Schedule of Study Assessments
Screening Day 0(Randomization)
2 wks(+ 1 week)
6 wks(+ 1 week)
3 mos(+ 1 week)
6 mos(+ 1 week)
9 mos(+ 1 week)
12 mos*(+ 1 week)
Informed Consent XHistory and physical X X X X X X X XCV Medication History X X X X X X X XDocument rationale for changes in therapy X X X X X X
6 minute walk XQOL** X X X XMedical resource use and cost assessment X X X X X X X
Local lab NT-proBNP (standard of care group)
X X
Local lab NT-proBNP (guided only) X X X X X X X X
Cr, BUN, electrolytes(local lab) X X X X X X X X
Core lab plasma sample X X X X X X X
Core lab serum sample X X X X X X X
Core lab DNA sample(once only) X
Safety assessments X X X X X X*Patients will be followed for a minimum of 12 months up to a maximum of 24 months** QOL will be administered yearly after the 12 month visit

May 21, 2013 Page 1
Study Protocol Amendment 1
GUIDing Evidence Based Therapy Using Biomarker IntensifiedTreatment in Heart Failure (GUIDE IT)
Version Date: May 21, 2013

May 21, 2013 Page 2
TABLE OF CONTENTSLIST OF ABBREVIATIONS ...................................................................................................................................................... 4
PROTOCOL SYNOPSIS ........................................................................................................................................................... 5
STUDY FLOW CHART ............................................................................................................................................................. 6
1. HYPOTHESES AND OBJECTIVES ................................................................................................................................... 7
1.1 PRIMARY OBJECTIVE ................................................................................................................................................. 71.2 SECONDARY OBJECTIVES ............................................................................................................................................ 7
2. BACKGROUND AND RATIONALE ................................................................................................................................ 7
2.1 SCOPE OF THE HEART FAILURE PROBLEM ..................................................................................................................... 72.2 BIOLOGY AND CLINICAL USES OF NATRIURETIC PEPTIDES ................................................................................................ 72.3 GUIDING THERAPY BASED ON NATRIURETIC PEPTIDES: OBSERVATIONAL DATA ................................................................... 82.4 PRIOR STUDIES OF BIOMARKER GUIDED THERAPY IN HEART FAILURE ............................................................................... 82.5 DESIGN OF GUIDE IT: RATIONALE FOR AN UNBLINDED STUDY ..................................................................................... 102.6 DESIGN OF GUIDE IT: RATIONALE FOR USING NT PROBNP AND SPECIFIC TARGET ......................................................... 112.7 NATRIURETIC PEPTIDE VARIABILITY OVER TIME ............................................................................................................ 11
3. STUDY DESIGN ........................................................................................................................................................... 11
3.1 OVERVIEW ............................................................................................................................................................ 113.2 PLANNED NUMBER OF SUBJECTS AND CENTERS ........................................................................................................... 123.3 STUDY DURATION .................................................................................................................................................. 12
4. STUDY POPULATION .................................................................................................................................................. 12
4.1 OVERVIEW OF STUDY POPULATION ............................................................................................................................ 124.2 INCLUSION CRITERIA ............................................................................................................................................... 124.3 EXCLUSION CRITERIA ............................................................................................................................................... 12
5. STUDY INTERVENTIONS ............................................................................................................................................ 13
5.1 BIOMARKER GUIDED ARM ....................................................................................................................................... 135.2 USUAL CARE ARM .................................................................................................................................................. 14
6. STUDY PROCEDURES ................................................................................................................................................. 14
6.1 SCREENING ............................................................................................................................................................ 146.2 RANDOMIZATION ................................................................................................................................................... 146.3 STUDY VISITS ......................................................................................................................................................... 14
6.3.1 Baseline ........................................................................................................................................................ 146.3.2 Follow Up Visits ........................................................................................................................................... 146.3.3 Follow up after Adjustment of Therapy or Hospitalization ...................................................................... 15
6.4 BIOREPOSITORY AND CORE LAB BIOMARKER ASSESSMENT ............................................................................................ 156.5 MINIMIZING POTENTIAL BIAS ................................................................................................................................... 156.6 MAXIMIZING PROTOCOL ADHERENCE ........................................................................................................................ 166.7 QUALITY OF LIFE ASSESSMENTS ................................................................................................................................ 166.8 ECONOMIC DATA COLLECTION PROCEDURES .............................................................................................................. 176.9 REMOVAL OR REPLACEMENT OF SUBJECTS .................................................................................................................. 17
7. OUTCOME DETERMINATIONS .................................................................................................................................. 17
7.1 PRIMARY ENDPOINTS .............................................................................................................................................. 177.2 SECONDARY ENDPOINTS .......................................................................................................................................... 177.3 EXPLORATORY ENDPOINTS ....................................................................................................................................... 187.4 SAFETY ................................................................................................................................................................. 18
May 21, 2013 Page 3
7.4.1 Collection and Reporting ............................................................................................................................. 187.4.2 Safety Events of Interest ................................................................................ Error! Bookmark not defined.
8. STATISTICAL CONSIDERATIONS ................................................................................................................................ 19
8.1 DETERMINATION AND JUSTIFICATION OF SAMPLE SIZE .................................................................................................. 198.2 PROJECTED ENROLLMENT RATE ................................................................................................................................. 208.3 PROJECTED EVENT RATES ........................................................................................................................................ 218.4 ANTICIPATED EFFECT SIZE ........................................................................................................................................ 218.5 POWER CALCULATIONS FOR AGE GROUP BY TREATMENT INTERACTION ........................................................................... 218.6 SAMPLE SIZE JUSTIFICATION FOR SECONDARY ENDPOINTS ............................................................................................. 228.7 STATISTICAL ANALYSIS: GENERAL APPROACH .............................................................................................................. 238.8 ANALYSIS FOR THE PRIMARY HYPOTHESIS ................................................................................................................... 238.9 SUPPORTIVE ANALYSES OF THE PRIMARY ENDPOINT ..................................................................................................... 248.10 ANALYSIS OF SECONDARY ENDPOINTS ........................................................................................................................ 248.11 MULTIPLE COMPARISONS AND COMPOSITE ENDPOINTS ............................................................................................... 248.12 EXPLORATORY ENDPOINTS ....................................................................................................................................... 248.13 ANALYSIS OF ECONOMIC AND QUALITY OF LIFE DATA ................................................................................................... 258.14 DATA SAFETY MONITORING BOARD AND INTERIM ANALYSES ........................................................................................ 27
9. DATA MANAGEMENT PROCEDURES ........................................................................................................................ 28
9.1 ELECTRONIC DATA CAPTURE (EDC) SYSTEM ............................................................................................................... 289.2 ELECTRONIC CASE REPORT FORM (ECRF) .................................................................................................................. 289.3 DATA MANAGEMENT PROCESS ................................................................................................................................ 289.4 DATA QUALITY CONTROL ........................................................................................................................................ 29
10. STUDY GOVERNANCE AND COMMITTEES ........................................................................................................... 29
10.1 CLINICAL COORDINATING CENTER (CCC) ................................................................................................................... 2910.2 DATA COORDINATING CENTER (DCC) ....................................................................................................................... 3010.3 ECONOMICS AND QUALITY OF LIFE CORE .................................................................................................................... 3010.4 BIOMARKERS CORE LAB AND BIOREPOSITORY ............................................................................................................. 3010.5 EXECUTIVE COMMITTEE .......................................................................................................................................... 3010.6 STEERING COMMITTEE ............................................................................................................................................ 3110.7 CLINICAL EVENT CLASSIFICATION COMMITTEE ............................................................................................................. 3110.8 ADHERENCE COMMITTEE ......................................................................................................................................... 3110.9 BIOMARKERS AND GENETICS COMMITTEE .................................................................................................................. 3110.10 PUBLICATIONS AND PRESENTATIONS COMMITTEE ................................................................................................... 3110.11 DATA AND SAFETY MONITORING BOARD (DSMB) ................................................................................................. 31
11. REGULATORY ISSUES ............................................................................................................................................ 32
11.1 ETHICS AND GOOD CLINICAL PRACTICE ...................................................................................................................... 3211.2 INSTITUTIONAL REVIEW BOARD/INDEPENDENT ETHICS COMMITTEE ............................................................................... 3211.3 INFORMED CONSENT .............................................................................................................................................. 32
12. REMOTE MONITORING ......................................................................................................................................... 32
13. REFERENCES ........................................................................................................................................................... 34
14. APPENDICES .......................................................................................................................................................... 39
14.1 APPENDIX A. SCHEDULE OF STUDY ASSESSMENTS ........................................................................................................ 39
May 21, 2013 Page 4
LIST OF ABBREVIATIONS
ACE Angiotensin Converting EnzymeAE Adverse EventARB Angiotensin Receptor BlockerBNP B type Natriuretic PeptideCCC Clinical Coordinating CenterCEC Clinical Endpoints CommitteeCES D Center for Epidemiologic Studies Depression ScaleCRT Cardiac Resynchronization TherapyCV CardiovascularDASI Duke Activity Status IndexDCC Data Coordinating CenterDCRI Duke Clinical Research InstituteDSMB Data Safety and Monitoring BoardeCRF Electronic Case Report FormEDC Electronic Data CaptureEQOL Economics and Quality Of LifeEQOL CCHF
Economics and Quality Of Life Coordinating CenterHeart Failure
ICD Implantable Cardioverter DefibrillatorIRB Institutional Review BoardIVRS Interactive Voice Response SystemKCCQ Kansas City Cardiomyopathy QuestionnaireLVEF Left Ventricular Ejection FractionmL MilliliterNHLBI National Heart, Lung, and Blood InstituteNT proBNP Amino Terminal pro B type Natriuretic PeptideSAE Serious Adverse EventSIRE Simple Internal Randomization EngineQOL Quality of Life

May 21, 2013 Page 5
PROTOCOL SYNOPSIS
Title: GUIDing Evidence Based Therapy Using Biomarker Intensified Treatment (GUIDE-IT)
Indication: Heart Failure
Location: Approximately 40 clinical centers in North America
Rationale: Current guidelines recommend that medical therapy be titrated toward the target doses used in clinical trials, but “therapeutic inertia” often represents a barrier to aggressive titration of medical therapy. There is a pressing need to develop strategies to improve utilization of proven therapies for HF in order to improve clinical outcomes and control costs. Observational studies have shown an association between decreasing natriuretic peptide levels over time and improved outcomes in patients with HF.
Objectives: To compare a strategy of medical therapy titration aimed at achieving and maintaining an NT-proBNP target of < 1000 pg/mL (biomarker-guided therapy) to usual care in high risk patients with systolic heart failure.
Study Design: Prospective, randomized, parallel controlled groups, unblinded, 2-arm, multicenter clinical trial of approximately 1100 patients.
Primary Endpoint:
Time to cardiovascular death or first HF hospitalization
Secondary Endpoints:
Time to all-cause mortality Recurrent hospitalizations Days alive and not hospitalized for CV reasons Time to cardiovascular death Time to first HF hospitalization Health-related quality of life (HRQOL) Resource utilization, cost and cost effectiveness Safety

May 21, 2013 Page 6
STUDY FLOW CHART
Hospitalization (or clinical equivalent) for HF LVEF < 40% within 12 months NT-proBNP > 2000 pg/mL or BNP > 400 pg/mL during index hospitalization
SCREENING
Consent obtained at discharge or within 4 weeks of hospital discharge or clinical equivalent
Randomized within 4 weeks of hospital discharge or clinical equivalent to either Usual Care (N=550) or Biomarker Guided NT-proBNP < 1000 pg/mL (N=550)
Baseline visit (day 0) History and physical exam, CV medication history, serum creatinine, BUN and electrolytes
and NT-proBNP (local lab), QOL questionnaire, medical resource use and cost assessment, 6MWT, biomarker and DNA sample collection
RANDOMIZATION
2-week follow-up (+ 1 week) History and physical exam, CV medication history, change in HF therapy rationale, serum creatinine, BUN and electrolytes (local lab), NT-proBNP (local lab biomarker guided arm
only), medical resource, cost assessment and biomarker samples
6-week follow-up (+ 1 week) History and physical exam, CV medication history, change in HF therapy rationale, serum creatinine, BUN and electrolytes (local lab), NT-proBNP (local lab biomarker guided arm
only), medical resource, cost assessment and biomarker samples
3-month follow-up (months 3, 6, 9, 12, 15, 18, 21, and 24) (+ 1 week) History and physical exam, CV medication history, change in HF therapy rationale, serum creatinine, BUN and electrolytes (local lab), NT-proBNP (local lab biomarker guided arm
only), medical resource, cost assessment and biomarker samples
FOLLOW-UP
Notes: Minimum 12 months of follow-up. Study visits occur every 3 months until a maximum of 24 months. Mandatory 2-week (+/- 1 week) follow-up after adjustment of therapy or
hospitalization. Follow-up visits include brief clinical assessment, serum creatinine, BUN and
electrolytes (local lab), and NT-proBNP (local lab biomarker guided arm only). Follow-up visits continue every 2 weeks until therapeutic targets are reached, or until
further titration of therapy is not possible. QOL questionnaires to be administered by EQOL CC at 3 months, 6 months, 12
months and yearly until the end of the study EQOL CC will collect medical resource and cost assessments throughout the length
of the study. months
May 21, 2013 Page 7
1. HYPOTHESES AND OBJECTIVES
1.1 Primary ObjectiveThe primary objective of this study is to determine the efficacy of a strategy of biomarker guided therapycompared with usual care on the composite endpoint of time to cardiovascular death or first heart failure(HF) hospitalization in high risk patients with left ventricular systolic dysfunction.
1.2 Secondary ObjectivesThe secondary objectives of this study are to evaluate the effects of biomarker guided therapy on:
Time to All cause mortalityRecurrent hospitalizationsTotal days alive and not hospitalized for cardiovascular reasonsTime to cardiovascular deathTime to first HF hospitalizationHRQOLResource use, cost and cost effectivenessSafety
2. BACKGROUND AND RATIONALE
2.1 Scope of the Heart Failure Problem
Heart failure (HF) is a major and growing public health problem in the United States (U.S.), affecting over 5million Americans, causing over 1 million hospitalizations, and accounting for over 30 billion dollars in totalcosts annum1. Among U.S. adults age 40, 1 in 5 will develop HF in their lifetime.2 Current practiceguidelines for pharmacologic management dictate that neuro hormonal antagonists such as beta blockersand ACE inhibitors be titrated toward the target doses studied in large clinical trials.3,4 Despite theserecommendations, available data suggest that most patients in clinical practice are either not treated withthese agents or are treated with substantially lower than recommended doses.5 8 “Therapeutic inertia”often represents a barrier to aggressive titration of medical therapy for both providers and patients. Avariety of disease management strategies have been evaluated to improve the chronic management of HFpatients, ranging from nursing based interventions to technologically complex interventions usingimplantable hemodynamic monitors and telemedicine. The majority of these interventions have focusedon the monitoring of symptoms and body weight and/or on patient education. Overall, the results fromdisease management strategies have been mixed,9 and many are personnel intensive, complex10 or costlyto implement.11 Thus, there is an unmet need for a simple, effective and easy to implement strategy toimprove the management of patients with chronic HF such that patient outcomes are demonstrablyimproved.
2.2 Biology and Clinical Uses of Natriuretic PeptidesThe natriuretic peptides are a family of important counter regulatory hormones with vasodilatory,lusitropic, anti fibrotic, and natriuretic effects.12 The natriuretic peptides b type natriuretic peptide (BNP)and amino terminal pro b type natriuretic peptide (NT proBNP) are released from the myocardium inresponse to hemodynamic stress and provide important diagnostic and prognostic information in HFpatients. Multiple studies have linked higher levels of natriuretic peptides to worse clinical outcomes inpatients with HF as well as other cardiovascular disorders and in healthy persons.13 16 Both BNP and NT

May 21, 2013 Page 8
proBNP have been shown to be very powerful predictors of future risk in both acute17,18 and chronicHF.19,20
2.3 Guiding Therapy Based on Natriuretic Peptides: Observational DataA large number of studies have also investigated the impact of HF therapies on natriuretic peptide levels.HF therapies proven to have beneficial long term effects on morbidity and mortality, such as ACEinhibitors,21 angiotensin receptor blockers (ARB),22 beta blockers,23 aldosterone antagonists,24 and cardiacresynchronization therapy,25 all generally decrease natriuretic peptide levels. Observational studies haveshown an association between decreasing natriuretic peptide levels over time and improved outcomes inboth inpatients and outpatientswith HF.20,26 29. In arepresentative study, Masson etal examined the prognostic valueof baseline and 4 month NTproBNP values in a prospectivesubstudy of patients enrolled inthe placebo arm of the ValsartanHeart Failure (Val HeFT) study(Figure 1). 29
This study demonstrated thepowerful association of change inNT proBNP levels over time withsubsequent clinical outcomes.Using a cut point NT proBNPlevel (derived from receiveroperator curve analysis) of 1078pg/mL, this study showed the prognostic significance of change in NT proBNP values across this thresholdover time. A similar analysis focused on BNP by Latini et al demonstrated substantially similar results.30
These findings appear to be consistent across multiple studies and provide a strong observationalfoundation for the concept of natriuretic peptide guided therapy in HF.
2.4 Prior Studies of Biomarker Guided Therapy in Heart FailureThese observational data have led to the hypothesis that serial measurements of natriuretic peptides mayserve as a guide to the titration of chronic medical therapy— “biomarker guided therapy”. This concepthas been tested over the last decade in multiple small randomized controlled studies ranging from 69 to499 patients.31 38 As shown below, the design of each study has differed with regard to patient population,the biomarker used, the natriuretic peptide target, the nature of the control group, and the study endpoint(Table 1).
Figure 1. Changes in NTproBNP and outcome in Val-HeFT study.

May 21, 2013 Page 9
Figure 2. Event free survival curves for BNP guided therapy vs. control in the STARS BNP trial and number of treatment modifications in each group.
Table 1. Design of selected RCTs of Biomarker guided Therapy in Heart FailureTroughton STARBRITE STARS-BNP TIME-CHF BATTLE-
SCARRED PRIMA PROTECT
N 69 137 220 499 364 345 151 Marker NT-proBNP BNP BNP NT-proBNP NT-proBNP NT-
proBNPNT-proBNP
Target 1692 pg/mL 2 x discharge
level
100 pg/mL 400 pg/ml if age<75,
800 pg/ml if age>75
1270 pg/mL Discharge level
1000 pg/mL
Length of f/u 9.6 mos 3 mos 15 mos 18 mos 12 mos 12 mos 10 mos
Endpoint Death + CV hospital or
worsening HF
Days alive and out of hospital
HF death + HF hospital
All-causedeath or hospital
All-causemortality
Days alive and out of hospital
Total CV events
The initial experience with biomarker guided therapy in HF was a small (N=69) pilot study by Troughton, etal. that randomized patients to a strategy of titrating medical therapy to achieve an NT proBNP level <1692 pg/mL or a control group in which medical therapy was titrated based on a clinical HF score.34 Thisstudy showed a significant decrease in cardiovascular events with biomarker guided therapy vs. control.These findings were confirmed inthe STARS BNP study, whichrandomized 220 well treatedambulatory HF patients to BNPguided therapy (BNP target < 100ng/mL) or usual care. This studyshowed a significant reduction incardiac events in the BNP guidedarm (p<0.01).36 Notably, althoughno specific instructions wereprovided for responding to BNPlevels above the target threshold,up titration of therapy in the BNPguided arm was significantlygreater for not just diuretics butalso ACE inhibitors, beta blockers, and spironolactone (Figure 2).
The largest published study of biomarker guided therapy to date is TIME CHF, which randomized 499patients with chronic HF to either usual care or an NT proBNP target based on the subject’s age (< 400pg/mL if age < 75 or < 800 pg/mL if age > 75). A notable difference in TIME CHF compared to previousstudies was a specific focus on elderly patients (mean age of 77). This study did not meet its primaryendpoint of the composite of all cause mortality and all cause hospitalization (HR = 0.91, p=0.39), but diddemonstrate a trend towards improvement in all cause mortality (HR = 0.68, p=0.06) and showedsignificant benefit on survival free of HF hospitalization (HR=0.68, p=0.01).36,39
In a recent prospective 3 arm study performed at 8 hospitals in Vienna, Austria, 278 patients wererandomized at the time of discharge from a HF hospitalization to 1 of 3 arms; usual care, a multidisciplinarydisease management program, or disease management plus individualized HF therapy based on NTproBNP levels.38 In the biomarker guided arm, both the frequency of visits and the titration of HFtreatment were based on serial measurement of NT proBNP levels with a goal of decreasing NT proBNP
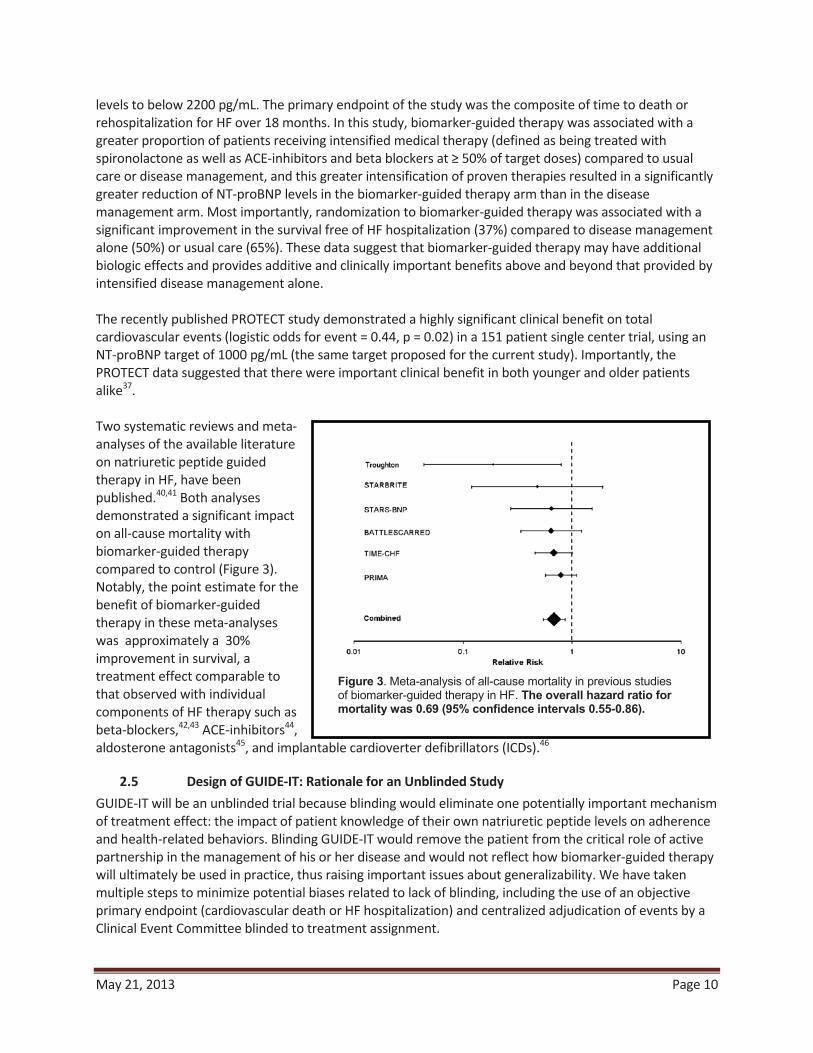
May 21, 2013 Page 10
Figure 3. Meta-analysis of all-cause mortality in previous studies of biomarker-guided therapy in HF. The overall hazard ratio for mortality was 0.69 (95% confidence intervals 0.55-0.86).
levels to below 2200 pg/mL. The primary endpoint of the study was the composite of time to death orrehospitalization for HF over 18 months. In this study, biomarker guided therapy was associated with agreater proportion of patients receiving intensified medical therapy (defined as being treated withspironolactone as well as ACE inhibitors and beta blockers at 50% of target doses) compared to usualcare or disease management, and this greater intensification of proven therapies resulted in a significantlygreater reduction of NT proBNP levels in the biomarker guided therapy arm than in the diseasemanagement arm. Most importantly, randomization to biomarker guided therapy was associated with asignificant improvement in the survival free of HF hospitalization (37%) compared to disease managementalone (50%) or usual care (65%). These data suggest that biomarker guided therapy may have additionalbiologic effects and provides additive and clinically important benefits above and beyond that provided byintensified disease management alone.
The recently published PROTECT study demonstrated a highly significant clinical benefit on totalcardiovascular events (logistic odds for event = 0.44, p = 0.02) in a 151 patient single center trial, using anNT proBNP target of 1000 pg/mL (the same target proposed for the current study). Importantly, thePROTECT data suggested that there were important clinical benefit in both younger and older patientsalike37.
Two systematic reviews and metaanalyses of the available literatureon natriuretic peptide guidedtherapy in HF, have beenpublished.40,41 Both analysesdemonstrated a significant impacton all cause mortality withbiomarker guided therapycompared to control (Figure 3).Notably, the point estimate for thebenefit of biomarker guidedtherapy in these meta analyseswas approximately a 30%improvement in survival, atreatment effect comparable tothat observed with individualcomponents of HF therapy such asbeta blockers,42,43 ACE inhibitors44,aldosterone antagonists45, and implantable cardioverter defibrillators (ICDs).46
2.5 Design of GUIDE IT: Rationale for an Unblinded StudyGUIDE IT will be an unblinded trial because blinding would eliminate one potentially important mechanismof treatment effect: the impact of patient knowledge of their own natriuretic peptide levels on adherenceand health related behaviors. Blinding GUIDE IT would remove the patient from the critical role of activepartnership in the management of his or her disease and would not reflect how biomarker guided therapywill ultimately be used in practice, thus raising important issues about generalizability. We have takenmultiple steps to minimize potential biases related to lack of blinding, including the use of an objectiveprimary endpoint (cardiovascular death or HF hospitalization) and centralized adjudication of events by aClinical Event Committee blinded to treatment assignment.

May 21, 2013 Page 11
Figure 4. 1-year mortality by deciles of initial NT-proBNP value in PRIDE study; Increased risk at 7th decile corresponds to NT-proBNP level of 972 pg/mL.
2.6 Design of GUIDE IT: Rationale for Using NT proBNP and Specific TargetBoth BNP and NT proBNP are widely clinically available and both markers have been used in previous trialsof biomarker guided therapy. We have selected NT proBNP as the biomarker to be used for guidingtherapy in the intervention arm of the GUIDE IT study. The half life of NT proBNP is substantially longerthan that of BNP (6 hours vs. 20 minutes), suggesting it is preferable for long term therapeutic monitoringover time. For this reason, more prior studies have used NT proBNP rather than BNP. NT proBNPperformed better in predicting long term morbidity and mortality in a head to head comparison in ValHeFT. Finally, the data supporting the validity of a specific natriuretic peptide target are stronger for NTproBNP than for BNP.
Several lines of evidence have led us to select an absolute NT proBNP target rather than a percentagechange. First, the use of specific targets for physiologic parameters is standard in the management of othercardiovascular diseases such a hypertension,hyperlipidemia, and diabetes. A strategy of targeting aspecific percentage reduction may leave patients withelevated baseline values with a target that is stillassociated with substantial risk. The rationale for specificcut points is strongest if there is evidence for specificinflection points in the association of continuousphysiologic parameters with risk. Data from the PRIDEstudy strongly suggests the presence of such a cut off atapproximately 972 pg/mL of NT proBNP (Figure 4)17.Similarly, in an analysis of VAL HeFT, the optimal cutpoint of NT proBNP to define increased risk was 1078pg/mL. Finally, as described above the interim resultsfrom the PROTECT pilot study demonstrated a strongsignal for efficacy using an NT proBNP target of 1000pg/mL.32 The consistency of these findings around anNT proBNP threshold of ~1000 pg/mL has led us totarget that level of NT proBNP suppression for GUIDE IT.
2.7 Natriuretic Peptide Variability over TimeUnderstanding of intra patient variability over time is of significant importance in using a biomarkerguided approach in order to distinguish between actionable change and normal biologic variation (i.e., toseparate “signal” from “noise”). Araujo et al examined change in NT proBNP levels over a period of 3weeks in clinically stable, ambulatory HF patients without changes in therapy, and observed a high degreeof intra patient variability in subjects with low levels (<1000 pg/mL), but a more modest amount ofvariability in patients with levels in the HF range (~1000 10,000 pg/mL).47 These data suggest that intrapatient variability is sufficiently limited to distinguish a clinical meaningful change from biologicalvariability in chronic HF.
3. STUDY DESIGN
3.1 OverviewThis study will be a multicenter, prospective, randomized, parallel control group, unblinded, 2 armmulticenter clinical trial comparing biomarker guided therapy to usual care in patients with systolic HF athigh risk for hospitalization or death.

May 21, 2013 Page 12
3.2 Planned Number of Subjects and CentersThe planned enrollment for the GUIDE IT study is approximately 1,100 subjects at approximately 40centers in North America. To maximize generalizability, centers outside of North America may beconsidered for participation if HF management is sufficiently similar to U.S. practice and appropriate use ofguideline based therapy can be verified.
3.3 Study DurationWe anticipate the study duration will be 5 years: 6 months of start up activities (i.e., finalize protocol,prepare study sites and contracts, receive site Institutional Review Board [IRB] approval), 36 months ofactive enrollment, 12 months of patient follow up after the final patient is enrolled, and 6 months of studyclose out, data analysis, and reporting of results.
4. STUDY POPULATION
4.1 Overview of Study populationThe enrolled population will be patients with systolic HF (left ventricular ejection fraction [LVEF] 40%)who have been hospitalized (or clinical equivalent, see below) for decompensated HF. Patients will beenrolled either at discharge or within 4 weeks of discharge
4.2 Inclusion CriteriaAge 18 yearsHospitalization for acute decompensated HF, manifest by
o Dyspnea at rest or on minimal exertion pluso At least 1 sign of volume overload:
Elevated jugular venous pulsePulmonary ratesPeripheral edemaCongestion on chest x ray
o For the purposes of qualification for the GUIDE IT study, treatment in the Emergencydepartment or observation unit for signs and symptoms of heart failure with intravenous loopdiuretics will qualify as a ‘hospitalization equivalent’ provided all other inclusion criteria aremet
Most recent documented LVEF to be 40% by any method within 12 months of randomization. Thisassessment must occur at least 12 weeks after any intervention likely to improve ejection fraction(e.g., cardiac resynchronization therapy, initiation of beta blocker therapy, or revascularization).NT ProBNP > 2000 pg/mL or BNP > 400 pg/mL at least once during index hospitalizationWilling to provide informed consent
4.3 Exclusion CriteriaAcute coronary syndrome or cardiac revascularization procedure within 30 days (NOTE: Given thatcardiac biomarkers such as troponin are frequently elevated in HF patients, the diagnosis of acutecoronary syndrome should be based on clinical diagnosis, not biomarkers alone)Cardiac resynchronization therapy (CRT) within prior 3 months or current plan to implant CRT deviceActive myocarditis, Hypertrophic obstructive cardiomyopathy, pericarditis, or restrictivecardiomyopathySevere stenotic valvular disease

May 21, 2013 Page 13
Anticipated heart transplantation or ventricular assist device within 12 monthsChronic inotropic therapyComplex congenital heart diseaseEnd stage renal disease with renal replacement therapyNon cardiac terminal illness with expected survival less than 12 monthsWomen who are pregnant or planning to become pregnantInability to comply with planned study proceduresEnrollment or planned enrollment in another clinical trial
5. STUDY INTERVENTIONSGUIDE IT will randomize patients in a 1:1 allocation to either:
Biomarker guided arm (approximately 550 subjects): Titration of HF therapy with a goal ofachieving and maintaining a target NT proBNP < 1000 pg/mLORUsual care (approximately 550 subjects): Titration of HF therapy based on target doses fromcurrent evidence based guidelines
5.1 Biomarker guided ArmIn the Biomarker guided arm, NT proBNP values from the local clinical laboratory will be utilized bytreating physicians for the purpose of achieving at NT proBNP target of < 1000 pg/mL. The GUIDE ITprotocol will specify interventions to be considered to achieve the NT proBNP target in the biomarkerguided arm, but specific treatment decisions will be at the discretion of the treating physician. The order ofimplementation will be based on clinical judgment, and more than one intervention can occur in a singleencounter. Titration of neurohormonal antagonists will be emphasized over titration of diuretics except inthe case of clinically apparent congestion or in the case of very high NT proBNP levels, which usuallyindicate subclinical volume overload. Specific changes in therapy and the rationale for them (e.g., inresponse to clinical change or NT proBNP levels) will be captured on the eCRF. Potential interventions todecrease NT proBNP levels will include:
Up titrate or add Angiotensin Converting Enzyme (ACE) inhibitor or ARBUp titrate or add beta blocker (if not clinically congested)Up titrate or add hydralazine nitrates in African American patientsIncrease loop diuretic dosage (if clinically congested or NT proBNP > 5000 pg/mL)Up titrate or add spironolactone if tolerated by renal function and potassiumAdd oral thiazide diureticAdd digoxinConsider adding ARB to ACE I (if not on spironolactone)Consider hydralazine nitrates in non African American patientsIntensified or repeated heart failure education regarding diet, sodium restriction, etc.Consider optimization of cardiac resynchronization therapy (if CRT device implanted)Reconsider potential indications for CRT (if not previously implanted)If in atrial fibrillation, maximize rate control or consider more aggressive attempts at normal sinusrhythmConsider exercise training or cardiac rehabilitation

May 21, 2013 Page 14
5.2 Usual Care ArmPatients randomized to the usual care group will receive care based on the most recent AHA/ACCguidelines.4 Investigators will be provided with specific information on evidence based target doses ofneuro hormonal antagonists (beta blockers, ACE inhibitors). Diuretics will be titrated based on clinicaljudgment of the treating physician. Routine assessment of natriuretic peptides will not be performed inthe usual care group except for compelling medical reasons, consistent with current guidelines.4
6. STUDY PROCEDURESA complete schedule of assessments throughout the study is given in Appendix A.
6.1 ScreeningClinical site staff will screen patients hospitalized (or clinical equivalent) for acute decompensated heartfailure. If patients are eligible to participate, they will be followed, but no study interventions will occuruntil the time of hospital discharge and after informed consent has been obtained. A screening log will bemaintained at each site. Eligible patients will provide written informed consent prior to randomization.
6.2 RandomizationRandomization will occur at the time of discharge or within a 4 week window after hospital discharge.Subjects who fulfill all the inclusion criteria and none of the exclusion criteria will be randomized in a 1:1fashion using the Simple Internal Randomization Engine (SIRE) system to either biomarker guided therapyor usual care. The unit of randomization will be at the patient level rather than the site level. Treatmentallocation will be conducted using a complete randomization scheme. At randomization, subjects willundergo a brief interval history and physical exam, cardiovascular (CV) medication history, local laboratorytesting for renal function and electrolytes, assessment for adverse events, 6 minute walk test, QOLquestionnaires, medical resource use and cost assessment, and core laboratory samples.
6.3 Study Visits
6.3.1 BaselineBaseline assessments will occur at the time of randomization and will include:
Focused physical examinationCV medication historySerum creatinine, blood urea nitrogen (BUN), and electrolytes (local laboratory)NT proBNP (local laboratory)Health Related QOL questionnaire (as described in 6.7)6 minute walk testBiomarker and DNA collection for biorepository (as described in 6.4)
6.3.2 Follow Up VisitsFollow up visits will occur at 2 weeks, 6 weeks, 3 months, and then every 3 months for the remainder ofthe study duration period (minimum of 12 months and a maximum of 24 months). All study visits will becompleted within a ± 1 week window. The following assessments will occur at each follow up study visit.
Focused interval history and physical examinationCV medication historyDocument rationale for changes in HF therapySerum creatinine, BUN, and electrolytes (local laboratory)

May 21, 2013 Page 15
NT proBNP (local laboratory, Biomarker guided Arm only)QOL questionnaire (as described in 6.7)Medical resource use and cost assessmentAscertainment of interval safety events and endpointsBiomarker collection for biorepository (as described in 6.4)
Subjects in the biomarker guided arm will have NT proBNP testing performed in the local laboratory byappropriately trained personnel, and these values will be used for the purposes of titrating therapy to theprotocol specified target. If therapy is adjusted, the changes in therapy and the rationale for theadjustment (e.g. clinical reason, not at biomarker target) will be recorded on the eCRF. Subjects in theusual care arm will not have routine assessment of natriuretic peptides except for compelling medicalreasons.
6.3.3 Follow up after Adjustment of Therapy or HospitalizationThere will be a 2 week (± 1 week) follow up visit for patients who have a change in therapy, resulting fromclinical findings or natriuretic peptide levels. This follow up visit will include a brief clinical assessment,measurement of renal function and electrolytes, and local laboratory NT proBNP measurement(biomarker guided arm only). If patients are unable to return for a 2 week follow up visit, remotelaboratory assessments of renal function, electrolytes, and NT proBNP (biomarker guided arm only) maybe substituted. Follow up visits will continue every 2 weeks until therapeutic targets are reached, or theinvestigator determines that further titration of therapy is not possible. Patients hospitalized for HF duringthe study will have a 2 week follow up study visit post discharge to reassess and adjust medical therapy,which will include all standard follow up assessments as defined above (Section 6.3.2).
6.4 Biorepository and Core Lab Biomarker AssessmentLocal laboratory NT proBNP values will be used to adjust therapy in patients randomized to the biomarkerguided arm. Additionally, at each regular study visit, all subjects (regardless of treatment arm) will haveblood samples sent to the Biomarker Core Laboratory for the central blinded assessment of NT proBNPlevels. Data from this core lab assessment will not be provided to the sites but will be used to standardizeassessments for all study patients (including those in the usual care arm) during data analysis at thecompletion of the study. As a quality control measure, the correlation between local site laboratory NTproBNP values and central core lab NT proBNP values will be assessed after enrollment of the first 100patients, and as needed thereafter.
Additional plasma, serum, and DNA samples (once only) will be collected and stored in the GUIDE ITbiorepository at each regular study visit (see Schedule of Assessments). Individual study subjects will bepermitted to opt out of the biorepository while still participating in the main trial, but participation in thebiorepository for all subjects will be strongly encouraged. Samples will be collected, processed, and labeledat the study site and shipped to the biorepository as described in the Manual of Operations. Thesebiorepository samples will be used by GUIDE IT investigators to evaluate the role of specific “biomarkers”(including genetic biomarkers) in the biology and pathophysiology of HF and the biology of the response tobiomarker guided therapy. A Biomarkers and Genetics Committee will establish and manage the processfor scientific review of proposals to use these biologic samples.
6.5 Minimizing Potential BiasTo address potential effects of an unblinded trial design on outcome determination, we have chosen anobjective primary endpoint (HF hospitalization or CV death) and will use a blinded Clinical Endpoints
May 21, 2013 Page 16
Committee (CEC) to classify potential endpoints. Source data (i.e., history, laboratory procedures anddischarge summaries) on all deaths and hospitalizations will be reviewed by the CEC in a consistent,standardized and unbiased manner. Final cause for each event will be adjudicated using definitions thatwill be established in the CEC Charter.
Another potential source of bias relates to the possibility that the greater frequency of medical visits dueto natriuretic peptide guidance will lead to improved patient outcomes through a mechanism other thanbiomarker guided titration of HF therapy. While GUIDE IT will mandate frequent visits in the usual caregroup (as consistent with standard practice), any observed differential in the number of medicalinterventions (driven by out of range natriuretic peptide levels in apparently stable patients) may be themechanism by which any treatment effects are realized. The alternative of mandating extra clinical visitsfor the usual care arm to mirror the visit pattern of the biomarker guided arm carries risk of biasing thetrial results. Those extra visits, which would not occur in regular clinical practice, could lead to extra testingand treatment modifications that result in the outcomes of the two arms converging, thus masking a realtreatment benefit. While there is no perfect solution to this problem, we will have detailed data on thecontent of each clinic visit in both treatment arms; thus, we will determine how often these visits includedsignificant modifications of medical therapy.
6.6 Maximizing Protocol AdherenceIn order to persuasively test the primary hypothesis of GUIDE IT, we will maximize adherence to theassigned strategies. In the case of the biomarker guided arm, the investigators will act on above target NTproBNP levels even in the absence of worsening symptoms or signs of HF. Similar to studies of intensiveglycemic control or blood pressure control, adherence monitoring and feedback to providers will be criticalto the success of GUIDE IT. To ensure that investigators adhere to the protocol, GUIDE IT will convene anAdherence Committee to focus on investigator education and training.
Based on our experience in prior studies to identify and correct non adherence, adherence monitoring andintervention will take a stepped approach. For example, the clinical coordinating center (CCC) will collectpatient feedback on adherence. Investigators at sites with two episodes of non adherence will becontacted to review episodes and the importance of adherence will be reemphasized. Reports onadherence will be provided to the Executive Committee. The Executive Committee will considersuspending enrollment at sites not performing at appropriate levels. Adherence performance will be usedin determining authorship of trial manuscripts. Although we recognize that such substantial efforts atensuring investigator adherence are not practical in all real world settings, we believe they are critical for aproof of concept efficacy trial such as GUIDE IT.
6.7 Quality of Life AssessmentsGUIDE IT will use a battery of validated instruments that build on a disease specific core, supplemented bygeneric measures to provide a comprehensive assessment of health related QOL. These assessments ofquality of life (QOL) will be performed at baseline by site coordinators and then 3 months, 6 months andannually to a maximum of 24 months by structured telephone interview conducted by the EQOL CC staff.A detailed description of each of these instruments with instructions will be included in the Manual ofOperations. Assessments at each visit will include the following:
Kansas City Cardiomyopathy Questionnaire (KCCQ)Duke Activity Status Index (DASI)enter for Epidemiological Studies Depression Scale (CES D)Medical Outcomes Study Short Form (SF 12)

May 21, 2013 Page 17
Medical Outcomes Study Short Form (SF 36) subscales: General Health, psychological well being,vitality, social functioning)EQ 5D
6.8 Economic Data Collection ProceduresTotal medical costs can be divided into five major components: inpatient hospital care, inpatient physiciancare, outpatient (ED visits, observational stays, rehabilitation stays, nursing home stays) physician care,outpatient testing, and outpatient medications. Hospital costs will be calculated using hospital billing data,with charges converted to costs using the departmental charge to cost conversion factors available fromeach hospital’s annual Medicare Cost Report. Physician costs (both inpatient and outpatient) will beestimated by mapping major procedures and physician services recorded on the case report form andhospital bills to appropriate current procedural terminology (CPT) codes in the Medicare Fee Schedule.Outpatient medication costs will be based on the Drug Topics Red Book average wholesale price,discounted as appropriate to reflect market acquisition costs. Outpatient testing costs will be assignedusing the Medicare Fee Schedule for the physician component and the Medicare ambulatory paymentclassification (as per rates for the institutional and laboratory component).
Hospital bills for patients in the U.S. (detailed, summary ledger, and UB 04) will be collected by the GUIDEIT EQOL CC staff after discharge from the hospital This process typically starts with a call to the head or therepresentative of the given hospital’s patient accounting department to request the bill, and is followed bya written letter including a copy of the signed consent form if requested. Once received, in order tomaintain confidentiality, the patient’s name will be removed and replaced with the GUIDE IT patient studynumber and patient initials before further processing.
In addition, cost to charge ratios (Medicare Cost Report Worksheets C and D 1, Part 2) will be obtained foreach hospital where a GUIDE IT hospitalization is reported. These reports can be obtained from thehospital in question, the Medicare Intermediary for that region, or the Centers for Medicare and MedicaidServices. Reports will be obtained for each year of study enrollment and follow up up to the most recentreport available at the start of the data analysis phase.
6.9 Removal or Replacement of SubjectsSubjects have the right to withdraw from the study at any time and for any reason without prejudice to hisor her future medical care. In the case of subject withdrawal, the investigator will discuss with the subjectthe most appropriate way to terminate study participation to ensure the subject’s health. All efforts will bemade to complete and report the observations as thoroughly as possible up to the date of studytermination. Randomized subjects who withdraw from the study will not be replaced.
7. OUTCOME DETERMINATIONS
7.1 Primary EndpointsThe primary endpoint is the time to CV death or first HF hospitalization.
7.2 Secondary EndpointsTime to All cause mortalityRecurrent hospitalizationsDays alive and not hospitalized for CV reasonsTime to CV death

May 21, 2013 Page 18
Time to first HF hospitalizationHealth Related QOLResource utilization, cost and cost effectivenessSafety
7.3 Exploratory EndpointsGlobal Rank Endpoint, incorporating death, hospitalization, and change in quality of LifeWin ratio, incorporating death, hospitalization, and change in quality of life
7.4 SafetyThe main safety objectives in GUIDE IT are to characterize the risk profiles of the two managementstrategies and to monitor for unanticipated risks to study participants. In this study, all medications andprocedures commonly used or performed as a part of standard of care for the management of HF havewell defined safety profiles. For this trial, reporting is primarily governed by the Common Rule (45 CFR Part46, Subpart A), Investigational Device Exemptions (Part 812), as well as ICH Guidelines, IRBs and localregulations.
The investigator is responsible for monitoring the safety of subjects enrolled into the study at the studysite. The investigator or qualified designee will enter the required initial and follow up informationregarding events into the appropriate module of the eCRF within InForm. Investigators are to reportserious adverse events in accordance with their local IRB requirements. Investigators should follow usualclinical practices at their institution for reporting to regulatory authorities serious, unexpected eventsrelated to standard of care medications and devices.
7.4.1 DefinitionsAn adverse event (AE) is any untoward medical occurrence in a patient or clinical investigational subjectadministered an investigational intervention and which does not necessarily have a causal relationshipwith this treatment. An AE can therefore be any unfavorable and unintended sign (including anabnormal laboratory finding), symptom, or disease temporally associated with the investigationalintervention, whether or not considered related to the investigational intervention (ICH1996).
A serious adverse event (SAE) is any adverse event that may result in any of the following outcomes:Death
• Is life threatening• Results in persistent or significant disability/incapacity• Is a congenital anomaly/birth defect
Important medical event that may not result in death, be life threatening, or requirehospitalization may be considered a SAE when, based upon appropriate medical judgment, itmay jeopardize the patient or subject and may require medical or surgical intervention toprevent one of the outcomes listed above
AEs of Interest for the GUIDE IT trial, which may or may not meet serious criteria, include any of thefollowing:
Symptomatic hypotensionSymptomatic bradycardiaHyperkalemia (Potassium > 6.0 meq/dl or requiring change in therapy)
May 21, 2013 Page 19
Worsening renal function (increase in creatinine by 0.5 g/dl from last visit or requiring change intherapy)
7.4.2 Reporting Adverse Events
Adverse Events that do not meet SAE criteria and that are not an AE of Interest will not be reported in theInForm database.
SAEs and AEs of Interest that occur from randomization through completion of the final study visit will bereported in the InForm database in the following manner:
o AEs of Interest that do not meet SAE criteria will be recorded on the AE eCRF.o SAEs that require hospitalization will be reported on the HOSP eCRF noting the reason
for the hospitalization. AEs of Interest that require hospitalization will be reported onthe HOSP eCRF rather than the AE eCRF.
o Secondary SAEs that may occur while a subject is hospitalized due to a different reasonwill be reported on the AE eCRF.
o Deaths will be reported on the DEATH eCRF.o If the subject was hospitalized for the event that led to death, the event will need to be
reported both on the HOSP eCRF and the DEATH eCRF.
The Investigator will follow all SAEs and AEs of Interest until resolution, stabilization or the event isotherwise explained.
8. STATISTICAL CONSIDERATIONS
8.1 Determination and Justification of Sample Size
Several design factors and research objectives have been considered in developing an appropriate samplesize for the study. First, patient enrollment has been determined so there would be a sufficient number ofendpoints to provide a high degree of confidence for testing the primary hypothesis. Second, the statisticalpower for secondary endpoints has been considered, including the EQOL endpoints. Finally, the samplesize has been determined to provide a reasonable level of confidence for detecting clinically importantdifferences in outcome between the two strategies—even if current projections of enrollment rates andhypothesized differences in clinical outcomes between the two arms prove to be optimistic.
Based on the anticipated patient population, we have projected a 1 year CV death and HF hospitalizationrate of 40% for subjects randomized to the usual care arm. We estimate our patient population will besimilar to that on the EVEREST study, a contemporary multicenter trial of patients with systolic HFrandomized at the time of HF hospitalization and followed for a median of 10 months.48 In EVEREST, theevent rate for CV death or HF hospitalization at 10 months was 41%. Given that the meta analysis of Felkeret al. found an aggregate reduction of about 30% in all cause mortality with biomarker guided therapy, theimpact of biomarker guided therapy can conservatively be expected to reduce the primary compositeendpoint (which we expect to be more sensitive to the effects of the biomarker guided strategy than allcause mortality) by 20% (from 40% to 32% at 1 year).

May 21, 2013 Page 20
Based on the event rates for each arm discussed above, we have determined the sample size required toprovide high power for detecting the postulated 20% relative risk reduction. As we recognize that theactual event rates and the outcome differences between the two testing strategies in GUIDE IT may varysomewhat from these estimates, and we have determined the power of the study under several differentcombinations of enrollment rates, event rates and effect sizes. We have conducted the power analysesusing simulation studies to mimic the key features of GUIDE IT. As the primary treatment comparisons willbe based on a time to event endpoint using the Cox proportional hazards model, we created 1,000 datasets under each condition, and analyzed them using the Cox regression model to estimate the powerunder a variety of assumptions about the enrollment rates, event rates and effect sizes (Table 2).
Table 2. Summary of the Power Simulations for the Primary EndpointControlEventRate*
BiomarkerguidedEventRate*
RelativeEvent RateReduction
EnrollmentRate (permonth)
EstimatedPower (%)
Numberof PrimaryEndpoint
Events
Minimumfollow up(months)
Total StudyDuration
(month)**
40% 32% 20% 35 89.4 566 12 5240% 34% 15% 35 67.1 579 12 5235% 28% 20% 35 84.6 506 12 5235% 29.75% 15% 35 57.7 518 12 5245% 36% 20% 35 93.8 623 12 5245% 38.25% 15% 35 76.3 637 12 5240% 32% 20% 35 91.2 605 24 6440% 34% 15% 35 69.6 618 24 6435% 28% 20% 35 86.8 542 24 6435% 29.75% 15% 35 58.9 555 24 6445% 36% 20% 35 95.8 662 24 6445% 38.25% 15% 35 77.2 677 24 6440% 32% 20% 26.25 89.7 573 12 6240% 34% 15% 26.25 67.3 586 12 6235% 28% 20% 26.25 85.1 513 12 6235% 29.75% 15% 26.25 57.8 525 12 6245% 36% 20% 26.25 94.0 630 12 6245% 38.25% 15% 26.25 76.2 644 12 62
*1 year event rate.**Duration from study award date to last patient in the last study visit—the assumed yearly rate of loss to follow
up was 4% and the yearly non CV death rate was 4%.
8.2 Projected Enrollment rateWe anticipate starting enrollment within 6 months from the study award date to finalize the protocol,complete DSMB review and approvals, and activate the sites. Given the complexities of site contracts, IRBapprovals and regulatory requirements, we conservatively expect to activate 5 sites each month forenrollment. The recent NHLBI funded HF ACTION study enrolled a similar patient population, but requiredthose patients to complete exercise training, which limited recruitment. The average enrollment for HFACTION in the U.S. was 0.84 patients per site per month. The 2 site STARBRITE study of biomarker guidedtherapy enrolled 137 patients over a 28 month period for an average rate of 2.4 patients per site permonth32. In the single center PROTECT study of biomarker guided therapy, a total of 151 patients wereenrolled over a 2 year period for an average rate of 6.3 patients per site per month.49 For ASCEND HF, theU.S. enrollment rate varied between 1.5 2 patients per site per month. GUIDE IT’s enrollment willresemble a combination of these trials—patients will be identified at the time of acute HF, and, much like

May 21, 2013 Page 21
an outpatient HF study, they will be randomized soon after discharge. We believe that once a site isactivated, an enrollment rate of 1 patient per site per month is achievable. Once all sites are activated, thetarget enrollment for GUIDE IT will be 35 patients per month.
8.3 Projected Event RatesIn EVEREST, the event rate for CV death or HF hospitalization at 10 months was 41%. Based on a similarpatient population, we have assumed a 1 year event rate with a 40% control arm, which we believe is aconservative estimate. Unlike EVEREST, GUIDE IT will require elevated natriuretic peptide levels during theindex hospitalization, a powerful marker of increased risk, suggesting GUIDE IT will have a higher eventrate than EVEREST. Power simulations were conducted varying this rate from 35% to 45%. Event timeswere created using randomly generated exponential variables. The non CV death and the loss to follow uprates were generated as independent exponential random variables with 1 year event rates of 4% for eachvariable. In the simulations, the primary outcome variable was censored if the non CV death or loss tofollow up occurred first. The non CV death rate was based on unpublished data from EVEREST. Drop inand drop out rates were assumed to be distributed uniformly in 5% of subjects over the 2 year follow up.At the time of drop in or drop out, the hazard rate was switched to the rate for the other treatment group.
8.4 Anticipated Effect SizeWe planned the sample size to detect a relative reduction in the 1 year event rate of 0.20. The powersimulations shown below also examine the power with 15% relative reductions. Simulations with relativeevent rate reductions greater than 25% typically resulted in power greater than 99%.Results are based on 1,000 simulated data sets in each scenario with a 2 sided Type I error rate of 0.05(Table 2). The estimated power is based on the proportion of simulations using the Cox regression modelWald chi square p value < 0.05. It is expected that the final subject enrollment will be followed for 12months resulting in follow up times varying from 12 to 24 months. However, to illustrate the powerincrease of additional follow up, we have examined scenarios with 24 months follow up on all patients.
Based on our best estimates for event rates and enrollment with a 20% reduction in events from a 1 yearrate of 40% in the control group to 32% in the biomarker guided group, we anticipate having 89.4% powerwith the proposed sample size of 1,100 subjects. With the same event and enrollment rates, we wouldhave a slight increase in power to 91.2% if every subject was followed for 24 months. If per site enrollmentis lower than we project at 1 patient per site per month and is closer to 0.75 patients per site per month,Table 1 shows that we can still achieve our target number of primary outcome events by extending thestudy duration by 10 months. Alternatively, we will have the option of adding more sites in order tomaintain total study enrollment at 35 patients per month.
Although GUIDE IT has been powered for the primary endpoint of time to CV death or HF hospitalization,a key secondary endpoint is the time to all cause mortality. The power for this endpoint was evaluatedwith simulations as described above. With an assumed 1 year all cause mortality rate of 25% in the controlgroup, we estimated the power at 86.0% and 96.3% to detect relative event rate reductions of 25% and30%, respectively, which are consistent with the treatment effect seen in a recent meta analysis ofbiomarker guided therapy.
8.5 Power Calculations for Age Group by Treatment InteractionTwo prior studies (TIME CHF and BATTLESCARRED) stratified randomization by age (> or < 75) and prespecified sub group analysis based on age.31,33 Although these subgroups were small, the beneficial effectsof biomarker guidance in both studies appeared to be primarily in patients < 75. Given that HF is primarily
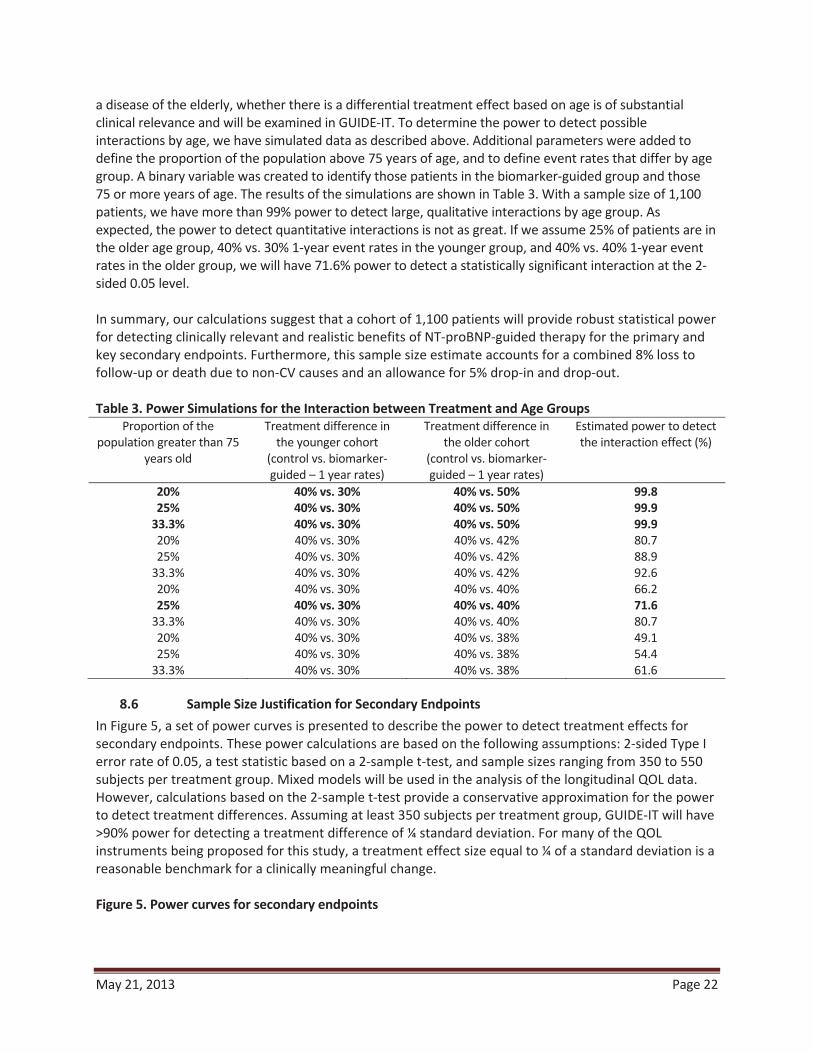
May 21, 2013 Page 22
a disease of the elderly, whether there is a differential treatment effect based on age is of substantialclinical relevance and will be examined in GUIDE IT. To determine the power to detect possibleinteractions by age, we have simulated data as described above. Additional parameters were added todefine the proportion of the population above 75 years of age, and to define event rates that differ by agegroup. A binary variable was created to identify those patients in the biomarker guided group and those75 or more years of age. The results of the simulations are shown in Table 3. With a sample size of 1,100patients, we have more than 99% power to detect large, qualitative interactions by age group. Asexpected, the power to detect quantitative interactions is not as great. If we assume 25% of patients are inthe older age group, 40% vs. 30% 1 year event rates in the younger group, and 40% vs. 40% 1 year eventrates in the older group, we will have 71.6% power to detect a statistically significant interaction at the 2sided 0.05 level.
In summary, our calculations suggest that a cohort of 1,100 patients will provide robust statistical powerfor detecting clinically relevant and realistic benefits of NT proBNP guided therapy for the primary andkey secondary endpoints. Furthermore, this sample size estimate accounts for a combined 8% loss tofollow up or death due to non CV causes and an allowance for 5% drop in and drop out.
Table 3. Power Simulations for the Interaction between Treatment and Age GroupsProportion of the
population greater than 75years old
Treatment difference inthe younger cohort
(control vs. biomarkerguided – 1 year rates)
Treatment difference inthe older cohort
(control vs. biomarkerguided – 1 year rates)
Estimated power to detectthe interaction effect (%)
20% 40% vs. 30% 40% vs. 50% 99.825% 40% vs. 30% 40% vs. 50% 99.9
33.3% 40% vs. 30% 40% vs. 50% 99.920% 40% vs. 30% 40% vs. 42% 80.725% 40% vs. 30% 40% vs. 42% 88.9
33.3% 40% vs. 30% 40% vs. 42% 92.620% 40% vs. 30% 40% vs. 40% 66.225% 40% vs. 30% 40% vs. 40% 71.6
33.3% 40% vs. 30% 40% vs. 40% 80.720% 40% vs. 30% 40% vs. 38% 49.125% 40% vs. 30% 40% vs. 38% 54.4
33.3% 40% vs. 30% 40% vs. 38% 61.6
8.6 Sample Size Justification for Secondary EndpointsIn Figure 5, a set of power curves is presented to describe the power to detect treatment effects forsecondary endpoints. These power calculations are based on the following assumptions: 2 sided Type Ierror rate of 0.05, a test statistic based on a 2 sample t test, and sample sizes ranging from 350 to 550subjects per treatment group. Mixed models will be used in the analysis of the longitudinal QOL data.However, calculations based on the 2 sample t test provide a conservative approximation for the powerto detect treatment differences. Assuming at least 350 subjects per treatment group, GUIDE IT will have>90% power for detecting a treatment difference of ¼ standard deviation. For many of the QOLinstruments being proposed for this study, a treatment effect size equal to ¼ of a standard deviation is areasonable benchmark for a clinically meaningful change.
Figure 5. Power curves for secondary endpoints

May 21, 2013 Page 23
00.10.20.30.40.50.60.70.80.9
1
0.05 0.1 0.15 0.2 0.25 0.3
Effect Size (sd)
Pow
er
n=350 n=400 n=450 n=500 n=550
8.7 Statistical Analysis: General ApproachStatistical analysis will be performed by the GUIDE IT data coordinating center (DCC) at Duke ClinicalResearch Institute (DCRI). All major treatment comparisons between the randomized groups in this trialwill be performed according to the principle of "intention to treat;" that is, subjects will be analyzed (andendpoints attributed) according to the treatment strategy to which patients are randomized, regardless ofsubsequent additional post randomization treatment and medical care. Statistical comparisons will beperformed using 2 sided significance tests. Additional perspective regarding the interpretation of the datawill be provided through extensive use of confidence intervals and graphical displays.
Baseline demographic and clinical variables will be summarized for each randomized arm of the study, forexample: relevant descriptors from the history, physical and laboratory examination; CV risk factors; comorbidity descriptors; and course of the patient’s symptoms. Descriptive summaries of the distribution ofcontinuous baseline variables will be presented in terms of percentiles (e.g., median, 25th and 75thpercentiles), while discrete variables will be summarized in terms of frequencies and percentages. Becauserandomization is expected to produce excellent balance at baseline between the two arms of the trial,statistical comparisons of treatment groups with respect to baseline characteristics will be more informal.For comparisons of continuous baseline variables, emphasis will be given to nonparametric proceduressuch as the Wilcoxon rank sum test. Group comparisons with respect to discrete baseline variables will usethe conventional chi square test or Fisher’s Exact Test as appropriate.
8.8 Analysis for the Primary HypothesisThe statistical comparison of the two randomized arms with respect to the primary endpoint will be atime to event analysis, and therefore will be based on the time from randomization to the first occurrenceof CV death or HF hospitalization. The Cox proportional hazards regression model will be the primary toolto analyze and assess outcome differences between the two treatment arms. A hazard ratio and 95%confidence interval for summarizing the difference in outcomes between the two treatment arms will becomputed using the Cox model. This comparison will constitute the primary statistical assessment of theeffect of biomarker guidance versus usual care on overall clinical outcomes. The Cox model will include anindicator variable for treatment group and baseline adjustment variables for age, sex, NT proBNP, diabetesmellitus and ejection fraction.
In order to select the best set of adjustment covariates, we reviewed prognostic models from other largedatasets in chronic HF. We selected covariates based upon the importance of choosing variables with
May 21, 2013 Page 24
minimal missing data and adjusted the primary analysis for the following baseline variables: age, sex, NTproBNP, ejection fraction, and diabetes mellitus.
8.9 Supportive Analyses of the Primary EndpointIf the data provide evidence of an overall difference in outcome between randomized arms, we willexamine whether the effect is similar for all patients, or whether it varies according to specific patientcharacteristics. In particular, we will focus on whether the relative benefit differs according to patient age,sex, race, co morbidity, and selected risk factors. These analyses will use the Cox model by testing forinteractions between the randomized groups and specific baseline variables. In addition to the statisticalhypothesis testing, Kaplan Meier survival estimates will be constructed based on the time fromrandomization to the first occurrence of CV death or HF hospitalization.
8.10 Analysis of Secondary Endpoints
The analyses for the time to event secondary endpoints will be similar to those outlined for the primaryendpoint using the time from randomization through the first occurrence of any component of a specificsecondary endpoint (or censoring) as the response variable, and assessing group differences using the Coxproportional hazards model. The effect of the NT proBNP guided treatment strategy on these time toevent secondary endpoints will be summarized using hazard ratios (with associated confidence intervals)computed from the Cox model. Kaplan Meier curves will be constructed to display the cumulative eventrates of the two treatment groups. For analysis of the total days alive and out of the hospital endpoint, wewill apply the inverse probability weighted estimators of Bang and Tsiatis to account for the potential biasdue to censored and incomplete data.50
8.11 Multiple Comparisons and Composite EndpointsWith the primary hypothesis and the various secondary endpoints, there is a multiplicity of analyses to beperformed and an increased probability that at least one of the comparisons could be "significant" bychance. There are adjustments (e.g., based on the Bonferroni inequality) that can be used to preserve theoverall type I error level by adjusting for the multiplicity of secondary endpoints by requiring smallsignificance levels for every comparison. We will be conservative in the interpretation of these analyses,taking into account the degree of significance, and looking for consistency across endpoints. Also, we havepre specified the primary and secondary outcome variables to help avoid over interpretation and toreduce the problems inherent with multiple testing. A related issue is the interpretation of compositeendpoints in clinical trials. To understand the importance of the components of the primary endpoint, wewill estimate the treatment effect and frequency of each component (CV mortality and HF hospitalization)separately. Based on the prior biomarker guided studies in HF, we have pre specified age ( 75 or < 75years of age) as a key subgroup of interest. The examination of this subgroup will include a formal test ofinteraction with the Cox regression model. Hazard ratio plots with point estimates and 95% confidenceintervals will be used to examine the consistency of the treatment effect across subgroups.
8.12 Exploratory EndpointsIn order to explore the contribution of recurrent hospitalization and quality of life to the overall efficacyand safety of biomarker guided therapy, alternative methodologies for assessing multiple endpoints will beanalyzed. These will include the global rank approach as previous described51. Generally, a pre specifiedhierarchy of endpoints will be created that will include death, hospitalization, and quality of life. Allpatients will be ranked according to this hierarchy, and the primary statistical comparison will be the

May 21, 2013 Page 25
comparison of ranks between the treatment and control group. An alternative approach to be exploredwill be the “win ratio” as described by Pocock et al52. In this approach, patients randomized to biomarkerguided therapy and control will be matched based on baseline characteristics, and the overall postrandomization experience between each pair will be compared using a pre specified hierarchy ofendpoints in order to determine a “winner”. The primary metric will be the proportion of pairs with thebiomarker guided arm wins relative to control.
8.13 Analysis of Economic and Quality of Life DataFor each of the QOL measures examined in this study, data analysis will proceed in several stages. Initially,we will provide simple descriptive and comparative analyses by intention to treat. A nonparametricbootstrap will be used to estimate treatment differences with 95% confidence intervals (CI) and p values.Since there is currently no consensus in the statistical literature about the best way to deal with themultiple comparisons problem arising from testing each individual scale at each time point separately, wepropose two complementary approaches. First, we will pre specify the overall summary score from theKCCQ and functional status using the Duke Activity Status Index as the primary QOL comparisons ofinterest and assign all other comparisons to a secondary (descriptive) status. Second, we will fit mixedmodels, which make use of all available QOL data at each study assessment point. Statistical powerestimates for the KCCQ, based on data collected in the HF ACTION trial demonstrate that we should have >90% power to detect a ¼ standard deviation difference (about 5 points on a 0 100 scale) in the KCCQoverall score and in the DASI (about 4 points on a 0 58 scale). We expect refusal rates to be quite lowoverall. In a 2966 patient QOL substudy in GUSTO, we had a 1% refusal rate at each of three interviews.The rate of patient incapacity expected for GUIDE IT is uncertain, but should be similarly low.
Several important methodologic challenges must be considered in the analysis of QOL data: the effect ofdifferential mortality in the treatment arms and the effect of missing data (from death, incapacity or lossto follow up). Our approach to missing data is to minimize it as much as possible. If the primary studyhypotheses are confirmed, analysis of QOL data may be complicated by the fact that the biomarker guidedstrategy was more successful at keeping patients alive. Even a relatively small difference in mortality dueto treatment may create a paradox in the QOL data such that the more effective therapy is associated withworse QOL (for example, if the patients with the worst QOL died in the usual care arm but were saved inthe biomarker guided arm.) We will address this problem by estimating the Survivor Average CausalEffects, which involves a counterfactual analysis to predict the QOL scores of interest assuming that thepatient had not died or been otherwise unable to provide their own data.
For the economic analyses, the primary statistical comparisons between the two treatment arms will beperformed by intention to treat. A nonparametric bootstrap will be used to estimate treatmentdifferences with 95% CI and p values. Estimates and confidence limits around the observed costdifferences can be created using several different approaches. In recent work, we have used bootstrapmethods for this.
Although our data analysis will not make parametric assumptions about the distributions of costs, we canapproximate the precision of our estimates by assuming that costs follow a log normal distribution.Previous studies suggest that this is a reasonable assumption. For data that are log normally distributed,the coefficient of variation (i.e., the standard deviation divided by the mean) remains constant, anobservation that we have seen empirically across different studies and treatment arms. In fact, ourexperience has shown that the coefficient of variation is very close to 1 (i.e., the standard deviation isequal to the mean). Under the assumption of log normal distributions and CV=1, with > 500 patients (>90%) with cost data per treatment arm, we will be able to estimate the difference in mean costs between

May 21, 2013 Page 26
treatments to within approximately 0.12 standard deviations based on the half width (1.96 times thestandard error) of the 95% confidence interval. This means, for example, if the mean cost per treatmentarm was $10,000, then the 95% confidence interval for the treatment difference in cost would be the pointestimate for the difference +/ $1,208.
In order to provide a second (descriptive) perspective on cost differences for each strategy in GUIDE IT, wewill also directly measure major health care resource items used including hospital days (e.g., intensivecare, step down units, wards) and cardiac procedures (e.g., ICD, VAD placement, catheterization, coronaryrevascularization, atrial fibrillation ablation) as well as selected smaller ticket items such as outpatientphysician and emergency department visits. A basic set of resource data will be collected on the eCRF, andwill be supplemented by the additional resource data that can be collected from the detailed hospitalbilling forms.
To estimate the incremental cost effectiveness of the biomarker guided approach relative to usual care,we will calculate a base case cost effectiveness ratio that defines the incremental cost required to add anextra life year with the biomarker guided strategy relative to usual care. A second series of analyses willcalculate the corresponding cost utility ratio, using utility data from the EQ 5D collected in the GUIDE ITtrial. These analyses will use the societal perspective and a lifetime time horizon so that the estimatedincremental cost effectiveness and cost utility ratios can be compared with societal benchmarks. Whereextrapolations from empirical data and other assumptions are required, they will be based, to the extentpossible, on the empirical data from the GUIDE IT trial and will be accompanied by appropriateexamination of the effects of uncertainty using both stochastic methods and sensitivity analyses. Fordescriptive purposes, we will also calculate within trial cost effectiveness and cost utility ratios, since theydo not require any extrapolations. However, these within trial ratios are limited due to their failure toaccount fully for long term benefits and costs, and the absence of comparative benchmarks. At the time ofanalysis, costs will be adjusted to the most recent year for which the Producer Price Index has beenpublished. Both costs and life expectancy will be discounted to present value at a 3% annual discount rate(with rates from 0 to 7% examined in sensitivity analyses).
Since many of the patients will remain alive at the conclusion of the trial, a method is required forconverting observed trial experience into the corresponding lifetime survival and cost figures needed foruse in the incremental cost effectiveness calculations. There are three general methods that we havepreviously used to make the necessary lifetime extrapolations called for in cost effectiveness analysis: useof the trial data for extrapolation, use of secondary data sources to base the extrapolations upon, and useof Markov models. GUIDE IT will provide a rich empirical data set involving up to 2 years of clinicaloutcome, cost, and utility data, with over 2,000 patient years of follow up information. We will use thesedata in age based survival models to create estimates for each GUIDE IT patient of life expectancy, qualityadjusted life expectancy and lifetime medical costs.
The method, in brief, involves 5 basic steps. 1) Using Cox Proportional Hazards regression methodology forleft truncated and right censored data, we model the hazard of death as a function of age, adjusting foradditional prognostic factors through covariates. This model "adjusts for" age as the metric over which thehazard is computed, treats additional prognostic factors as covariates, and stratifies on treatment group (ifnecessary to satisfy the proportional hazards assumption). By estimating the hazard over the age metric(rather than over the time metric, as is traditionally done), we can produce data based survival predictionsthrough a much longer time period due to the broad representation of ages in our database. 2) This hazardrelationship, which under proportional hazards is well estimated through the age range represented in ourdata, is used for prediction on a patient by patient basis. The predicted survival estimates for each patient

May 21, 2013 Page 27
are then combined with the empirical GUIDE IT survival data and averaged over all the patients for bothtreatment groups. 3) Again using a Cox Proportional Hazards regression model, together with the post HFhospitalization survival experience available in the GUIDE IT data (and if necessary, secondary data sourcesavailable at the DCRI including HF ACTION), we will estimate the long term survival impact of a HFhospitalization, the non fatal component of the study primary endpoint. This model will provide aquantitative measure of the increased relative risk attributable to these non fatal events for laterincorporation in the individual patient predictions. 4) For the oldest age range, where the amount ofempirical data may not be sufficient, we will use a Gompertz based function for extrapolation. Theestimated mean survival curves are integrated over a lifetime to obtain life expectancy for each treatmentgroup. 5) The difference between the areas under each survival curve is computed to obtain thebiomarker guided arm incremental life expectancy.
Uncertainty in cost effectiveness estimates related to sampling variation will be quantified using nonparametric bootstrap techniques (1,000 samples with replacement with a cost effectiveness ratiocalculated for each sample) and expressed in three complementary formats. First, cost effectiveness ratiosarising from the bootstrap will be displayed on the cost effectiveness plane to characterize the precisionand magnitude of the estimates. Second, we will examine the net monetary benefit of the intervention,defined as the difference between the increase in effectiveness (valued using the willingness to paythreshold per unit of effectiveness), and the increase in cost. Net monetary benefit and associatedconfidence intervals will be displayed for a range of willingness to pay thresholds. Finally, we will plot thecost effectiveness acceptability curve, which indicates the probability that that the intervention is costeffective (i.e., incremental net benefit > 0) for a range of willingness to pay thresholds. We will alsoperform sensitivity analyses to address uncertainty related to methodological assumptions regarding keyparameters. If appropriate, bootstrap analyses will be repeated for alternative parameter values. It mustbe emphasized that although the general plan of our cost effectiveness analyses can be specifiedprospectively, there is clearly an iterative quality to building successful cost effectiveness models.
8.14 Data Safety Monitoring Board and Interim AnalysesFor ethical reasons, an interim examination of key safety and endpoint data will be performed at regularintervals during the course of the trial. The primary objectives of these analyses will be to evaluate theaccumulated data for high frequency of negative clinical outcomes in either of the two randomized arms.In addition, the interim monitoring will also involve a review of the control arm event rates, patientrecruitment, compliance with the study protocol, status of data collection, and other factors that reflectthe overall progress and integrity of the study. The results of the interim analyses and status reports will becarefully and confidentially reviewed by an NHLBI appointed DSMB.
It is anticipated that the DSMB will meet every 6 months to review the accumulating data. Prior to eachmeeting, the DCC will conduct any requested statistical analyses and prepare a summary report along withthe following information: patient enrollment reports, rates of compliance with the assigned testingstrategy, frequency of protocol violations, and description of SAEs (statistical comparisons of therandomized arms with respect to these SAEs will use chi square or other appropriate 2 sample methods).The extracted data files and analysis programs for each DSMB report will be archived and maintained atthe DCC for the life of the study.
For futility monitoring, we will apply the inefficacy monitoring rule of Freidlin, Korn, and Gray53 to stop thetrial if the biomarker guided strategy is not beneficial. We propose to use the conservative boundary LIB0along with a harm look at 25% of expected information. This approach will include 7 interim looksscheduled at roughly 25%, 40%, 50%, 60%, 70%, 80%, and 90%. With the proposed design, a total of 566
May 21, 2013 Page 28
events are expected and the first interim review for futility and efficacy would be scheduled to occur afterapproximately 140 primary endpoint events have been observed. If the data suggested a benefit for theusual care arm with a p value of <0.05, the Freidlin, Korn, and Gray approach would suggest stopping thetrial at the 25% look. The second interim review would be scheduled after approximately 241 primaryendpoint events have been observed. For the interim reviews at 40%, 50%, 60%, 70%, 80%, and 90%, theLIB0 conservative boundary would suggest stopping the trial for inefficacy if the biomarker guided arm hada hazard ratio > 1.0 compared to usual care arm. The Freidlin, Korn, and Gray approach will result in atrivial loss of power and requires no sample size adjustment. The DSMB will weigh any trade offs betweenshort term versus long term results. We propose to use the method of Haybittle and Peto as a guide ininterpreting interim efficacy analyses.54,55 This procedure requires large critical values (Z=3, p 0.001) forevery assessment until the planned final analysis. Because of the conservatism throughout the trial, thecritical value at the final analysis is conducted at the "nominal" critical value.
The DSMB will weigh any trade offs between short term versus long term results. The DSMB will play avaluable role in advising the study leadership on the relevance of advances in the diagnosis and treatmentof patients with systolic HF. The DSMB would be asked to offer proper perspective on any therapeutic ordiagnostic testing advances that may occur during the course of the trial. If protocol modifications arewarranted, close consultation among the DSMB, the NHLBI staff and the study leadership will be required.A separate DSMB charter will outline the operating guidelines for the committee, and the protocol forevaluation of data—the charter will be created prior to patient randomization and agreed upon during theinitial meeting of the DSMB. Minutes of all DSMB meetings will be prepared and distributed to committeemembers.
9. DATA MANAGEMENT PROCEDURES
9.1 Electronic Data Capture (EDC) SystemTo ensure an efficient and timely data capture system, a rapid transmission and integration of thisinformation into the trial processes and study database, and the elimination of paper documents, the webbased electronic data capture system, known as InForm will be used.
9.2 Electronic Case Report Form (eCRF)The eCRF for GUIDE IT will have several forms including enrollment and demographics, relevant history, HFsymptoms, physical exam results, laboratory results, baseline biomarker levels, and other baselinepresenting characteristics; follow up worksheets for use during regular follow up visits and to track thepatient’s clinical course over time; and event worksheets for recording the circumstances and detailssurrounding the occurrence of a death or hospitalization. Economics and Quality of Life (EQOL) data will becollected as summarized above and detailed in the Manual of Operations. A dictionary, glossary of termsand instructions for completing the forms will be provided to the sites.
9.3 Data Management ProcessWe will use InForm software (described above) for data entry, screen handling and simple reports. We willuse an Oracle database server on an existing UNIX based network server for this operational databasemanagement. Data will be entered into the InForm eCRF by clinical site personnel. Any out of range valuesand missing key variables will be flagged and addressed, or answered at the site during the data entryprocess, allowing many queries to be resolved in real time. Queries can also be generated from manualreview of the data forms. These will be entered into the database and tracked in the same manner as thecomputer generated queries.

May 21, 2013 Page 29
We will compare distributions of selected variables across sites to ensure that consistent definitions areused. Examples of these variables include the following: frequency of missing critical variables, biological ormedical history parameters, fields that define study procedure compliance and safety irregularities. In oursurveillance, we will use statistical process control to ensure that issues not likely to be the result ofnormal random variation are investigated. The DCRI will create reports to identify trends in the data thatmay require additional clarification and training. These reports will be available to the sites and to thestudy leadership, as we work with the sites to correct negative trends and eliminate future data errors.
The DCRI will perform internal database quality control checks and data audits during the trial and at theconclusion to track the frequency of random errors and to identify any systematic deviation requiringcorrection. Patients whose data are audited will be randomly selected from the total enrollment. Datamanagement operations are also reviewed internally for their compliance with standard procedures, rulesand guidelines for processing, quality control and productivity.
9.4 Data Quality ControlData quality control goes beyond the data management process. All groups at the DCRI will work intandem to ensure that the data collected in this study are as complete and correct as possible. A 4 step,multi functional approach to data quality control will be implemented and is summarized below:
1. Training: Prior to the start of enrollment, the physician investigators and study coordinators ateach site will be trained with the clinical protocol and data collection procedures, including how touse the InForm system and complete the eCRF data. Initial investigator and coordinator trainingwill occur with an InForm trainer and hands on database interaction. This trainer will presentslides, demonstrate key InForm functionality and guide attendees through practice exercises.Follow up training and training for new study personnel will be conducted by DCRI personnel whowill present slides, demonstrate the system and guide attendees through practice exercises usingon line web based teleconferences.
2. Monitoring: The clinical and data coordinating center will ensure that data collection is beinghandled properly, will provide in service training, and address questions from site investigatorsand coordinators. Data quality and completeness will be reviewed by the DCRI team on a regularand ongoing basis, and any issues noted will be addressed with the site. Monitoring visits will becompleted as described in the Clinical Monitoring Plan.
3. Managing data: After the data have been transferred to SAS for statistical summarization, datadescription, and data analysis, further cross checking of the data will be performed withdiscrepant observations being flagged and appropriately resolved through a data query system.
4. Reviewing data: Deaths and hospitalization events will be reviewed by the CEC to ensure anappropriate standardized classification of the component events comprising the primarycomposite endpoint. The DCC will provide the CEC with detailed information for classification andadjudication of these events. The CEC will be blinded to the randomized treatment strategyassignment to ensure unbiased evaluation of outcome events.
10. STUDY GOVERNANCE AND COMMITTEESThe governance and management of the GUIDE IT study will be organized as follows.
10.1 Clinical Coordinating Center (CCC)The CCC will be at the DCRI. The CCC functions as a clinical trial center and is responsible for all aspects ofconducting this trial, including: clinical operations; oversight of all committees and working groups;development of the protocol and all amendments; site identification, recruitment, education, and

May 21, 2013 Page 30
retention; oversight of core laboratories; quality control; site reimbursement; monitoring of studyprogress; maintenance of a 24 hour helpline for questions from clinical sites; and leadership in dataanalysis, presentations, and publications. Clinical Operations is the critical functional component of theCCC, and will provide project management; development and preparation of study materials; sitemanagement; education of all site based personnel on the rationale, design, and execution of GUIDE IT;oversight of the study helpline; and assistance with preparation of manuscripts and publications.
The CCC will be the primary day to day contact for sites. CCC staff will develop and implement educationaland training plans, communication initiatives including phone and email contact, conference calls,newsletters, website, and will use social networking technology. The CCC staff will collaborate with thesites to ensure their understanding of the protocol, the operationalization of the protocol, and thesuccessful identification of eligible patients for screening and enrollment. From working on many othermulticenter randomized controlled studies, these project team members bring substantial operationalexperience. The CCC expects that our efforts to significantly vet sites for interest and capabilities, toextensively educate sites, and to carefully and clearly state the expectations for sites will minimizeproblems with sites performance. An important asset to the site management component of the CCC willbe the use of the DCRI’s Clinical Trials Management System, a web based application that provides theDCRI project teams with direct access to trial data, and can be used to manage various aspects of thestudy, including: protocols, accounts, contracts, sites, site monitoring, and subject management. Using thiscentralized system will ensure an integrated approach to handling trial information, and will help the CCCand the DCC work together seamlessly.
10.2 Data Coordinating Center (DCC)The DCC will be at the DCRI. The DCC will support the GUIDE IT trial in study design, study start up, andproject implementation. This includes developing the eCRF and instructions; establishing datamanagement methods; creating and maintaining a patient database; resolving queries; collecting andreporting SAEs; analyzing the data; and assisting with trial design, protocol development, presentationsand manuscripts.
10.3 Economics and Quality of Life CoreThe EQOL core will be at the DCRI. Integration of the EQOL core into overall trial operations will befacilitated by the fact that the CCC, DCC, and EQOL are all located at DCRI. The CCC, DCC, and EQOL corewill coordinate site management and data management activities as they relate to the collection of EQOLdata.
10.4 Biomarkers Core Lab and BiorepositoryThe core lab and biorepository will be located at the NC Research Campus at Kannapolis, a joint enterprisebetween the research universities of NC to provide core lab services. Instructions for collection, processing,labeling, and shipping of biological specimens will be provided in a manual of operations.
10.5 Executive CommitteeThe Executive Committee is the primary decision making body of the study and is responsible for itssuccessful completion. The Executive Committee will meet weekly by teleconference. They will review andhave input on the trial protocol, manual of operations, monitoring plan, electronic case report form (eCRF),site materials, data management plan and statistical plan. On issues requiring a vote, 1 vote per memberwill be allowed. This Committee will meet in person at least twice a year, typically at the annual scientificsessions of the American Heart Association and American College of Cardiology. All members of the

May 21, 2013 Page 31
Executive Committee will be expected to make ongoing substantive intellectual and operationalcontributions to the study.
10.6 Steering CommitteeThe Steering Committee will address enrollment issues, education and training to promote compliancewith the study protocol. Membership will include the EC, committee chairs, core lab directors, and otherselected site PIs, selected study coordinators, and other members as required. The Steering Committeewill meet in person and/or via teleconference throughout the conduct of the trial.
10.7 Clinical Event Classification CommitteeThe Clinical Events Classification Committee (CEC) is an independent committee providing independentand blinded adjudication of determined primary outcome events. Members of the CEC will not beparticipating in the GUIDE IT study in any way, and will be blinded as to treatment assignment. Endpointdefinitions will be formulated prior to the initiation of the study, and will be approved by the EC. A charterwill be developed to guide CEC activities.
10.8 Adherence CommitteeThis committee will serve to promote and monitor investigator adherence to the study protocol,particularly with regard to responsiveness to natriuretic peptide levels in the biomarker guided arm. Theywill review data on adherence to the protocol and results of interventions by the CCC on a monthly basis.When necessary, the committee will intervene with individual investigators or the investigators as a whole.Given the importance of adherence to testing the hypothesis of GUIDE IT (as outlined in the ResearchPlan), the Adherence Committee will play an active and engaged role in the ongoing operations of thestudy.
10.9 Biomarkers and Genetics CommitteeThe Biomarkers and Genetics Committee will establish and operationalize policies and procedures foranalysis of biorepository samples by GUIDE IT investigators.
10.10 Publications and Presentations CommitteeThe Publications and Presentations Committee will review publication proposals and manuscripts, and willassist in dissemination of trial results.
10.11 Data and Safety Monitoring Board (DSMB)The DSMB is an independent committee that oversees the safety of research subjects. It is anticipated thatthe DSMB will meet every 6 months to review the accumulating data. Prior to each meeting, the DCC willconduct any requested statistical analyses and prepare a summary report along with the followinginformation: patient enrollment reports, rates of compliance with the assigned testing strategy, frequencyof protocol violations, and description of SAEs (statistical comparisons of the randomized arms withrespect to these SAEs will use chi square or other appropriate 2 sample methods). The extracted data filesand analysis programs for each DSMB report will be archived and maintained at the DCC for the life of thestudy.
May 21, 2013 Page 32
11. REGULATORY ISSUES
11.1 Ethics and Good Clinical PracticeThis study must be carried out in compliance with the protocol and in accordance with DCRI standardoperating procedures. These procedures are designed to ensure adherence to Good Clinical Practice, asdescribed in the following documents:
1. ICH Harmonized Tripartite Guidelines for Good Clinical Practice 1996.
2. US 21 Code of Federal Regulations dealing with clinical studies (including parts 50 and 56concerning informed consent and IRB regulations).
3. Declaration of Helsinki, concerning medical research in humans (Recommendations GuidingPhysicians in Biomedical Research Involving Human Subjects, Helsinki 1964, amended Tokyo 1975,Venice 1983, Hong Kong 1989, Somerset West 1996).
The investigator agrees, when signing the protocol, to adhere to the instructions and procedures describedin it and thereby to adhere to the principles of Good Clinical Practice that it conforms to.
11.2 Institutional Review Board/Independent Ethics CommitteeBefore implementing this study, the protocol, the proposed informed consent form and other informationto subjects, must be reviewed by a properly constituted Institutional Review Board/Independent EthicsCommittee (IRB/IEC). A signed and dated statement that the protocol and informed consent have beenapproved by the IRB/IEC must be given to the Coordinating Center before study initiation. The name andoccupation of the chairman and the members of the IRB/IEC must be supplied to the Coordinating Centerif this information is released by IRB/IEC. Any amendments to the protocol, other than administrativeones, must be approved by this committee.
11.3 Informed ConsentThe investigator or designee must explain to each subject (or legally authorized representative) the natureof the study, its purpose, the procedures involved, the expected duration, the potential risks and benefitsinvolved and any discomfort it may entail. Each subject must be informed that participation in the study isvoluntary and that he/she may withdraw from the study at any time and that withdrawal of consent willnot affect his/her subsequent medical treatment or relationship with the treating physician.
This informed consent should be given by means of a standard written statement, written in non technicallanguage. The subject should read and consider the statement before signing and dating it, and should begiven a copy of the signed document. If written consent is not possible, oral consent can be obtained ifwitnessed by a signed statement from one or more persons not involved in the study, mentioning why thepatient was unable to sign the form. No patient can enter the study before his/her informed consent hasbeen obtained. The informed consent forms are part of the protocol, and must be submitted by theinvestigator with it for IRB/IEC approval. The Coordinating Center will supply proposed informed consentforms, which comply with regulatory requirements, and are considered appropriate for the study. Anychanges to the proposed consent form suggested by the Investigator must be agreed to by theCoordinating Center before submission to the IRB/IEC, and a copy of the approved version must beprovided to the Coordinating Center after IRB/IEC approval.
12. Remote Monitoring
May 21, 2013 Page 33
The study will be monitored remotely by representatives of the DCRI or its designee according to theprospective clinical monitoring plan (CMP) for the following purposes:
Real time monitoring of compliance with study protocol inclusion/exclusion criteria is enabledvia triggers and range checks programmed in the InForm database.
Assist site personnel who will verify data identified within query reports against sourcedocuments through frequent telephone and email contact.
Verify that written informed consent was obtained before initiation of any screening proceduresthat are performed solely for the purpose of determining eligibility for the clinical study and/or priorto the patient’s randomization to a procedure.

May 21, 2013 Page 34
13. REFERENCES
1. Lloyd-Jones D, Adams R, Carnethon M, et al. Heart Disease and Stroke Statistics--2009 Update: A Report From the American Heart Association Statistics Committee and Stroke Statistics Subcommittee. Circulation 2009;119:e21-181.
2. Lloyd-Jones DM, Larson MG, Leip EP, et al. Lifetime risk for developing congestive heart failure: the Framingham Heart Study. Circulation 2002;106:3068-72.
3. Lindenfeld J, Albert NM, Boehmer J, et al. Executive Summary: HFSA 2010 Comprehensive Heart Failure Practice Guideline. Journal of Cardiac Failure 2010;16:475-539.
4. Jessup M, Abraham WT, Casey DE, et al. 2009 focused update: ACCF/AHA Guidelines for the Diagnosis and Management of Heart Failure in Adults: a report of the American College of Cardiology Foundation/American Heart Association Task Force on Practice Guidelines: developed in collaboration with the International Society for Heart and Lung Transplantation. Circulation 2009;119:1977-2016.
5. Lee DS, Mamdani MM, Austin PC, et al. Trends in heart failure outcomes and pharmacotherapy: 1992 to 2000. Am J Med 2004;116:581-9.
6. Johnson D, Jin Y, Quan H, Cujec B. Beta-blockers and angiotensin-converting enzyme inhibitors/receptor blockers prescriptions after hospital discharge for heart failure are associated with decreased mortality in Alberta, Canada. J Am Coll Cardiol 2003;42:1438-45.
7. Smith NL, Psaty BM, Pitt B, Garg R, Gottdiener JS, Heckbert SR. Temporal patterns in the medical treatment of congestive heart failure with angiotensin-converting enzyme inhibitors in older adults, 1989 through 1995. Arch Intern Med 1998;158:1074-80.
8. Stafford RS, Radley DC. The underutilization of cardiac medications of proven benefit, 1990 to 2002. J Am Coll Cardiol 2003;41:56-61.
9. Whellan DJ, Hasselblad V, Peterson E, O'Connor CM, Schulman KA. Metaanalysis and review of heart failure disease management randomized controlled clinical trials. American Heart Journal 2005;149:722-9.
10. Cleland JG, Louis AA, Rigby AS, Janssens U, Balk AH. Noninvasive home telemonitoring for patients with heart failure at high risk of recurrent admission and death: the Trans-European Network-Home-Care Management System (TEN-HMS) study. J Am Coll Cardiol 2005;45:1654-64.
11. Bourge RC, Abraham WT, Adamson PB, et al. Randomized Controlled Trial of an Implantable Continuous Hemodynamic Monitor in Patients With Advanced Heart Failure: The COMPASS-HF Study. J Am Coll Cardiol 2008;51:1073-9.
12. Felker GM, Petersen JW, Mark DB. Natriuretic peptides in the diagnosis and management of heart failure. CMAJ 2006;175:611-7.

May 21, 2013 Page 35
13. deFilippi CR, Christenson RH, Gottdiener JS, Kop WJ, Seliger SL. Dynamic Cardiovascular Risk Assessment in Elderly People: The Role of Repeated N-Terminal Pro-B-Type Natriuretic Peptide Testing. J Am Coll Cardiol 2010;55:441-50.
14. Morrow DA, de Lemos JA, Blazing MA, et al. Prognostic Value of Serial B-Type Natriuretic Peptide Testing During Follow-up of Patients With Unstable Coronary Artery Disease. Jama 2005;294:2866-71.
15. Wang TJ, Larson MG, Levy D, et al. Plasma Natriuretic Peptide Levels and the Risk of Cardiovascular Events and Death. N Engl J Med 2004;350:655-63.
16. Kragelund C, Gronning B, Kober L, Hildebrandt P, Steffensen R. N-Terminal Pro-B-Type Natriuretic Peptide and Long-Term Mortality in Stable Coronary Heart Disease. N Engl J Med 2005;352:666-75.
17. Januzzi JL, Jr., Sakhuja R, O'Donoghue M, et al. Utility of amino-terminal pro-brain natriuretic peptide testing for prediction of 1-year mortality in patients with dyspnea treated in the emergency department. Arch Intern Med 2006;166:315-20.
18. Fonarow GC, Peacock WF, Phillips CO, Givertz MM, Lopatin M. Admission B-Type Natriuretic Peptide Levels and In-Hospital Mortality in Acute Decompensated Heart Failure. J Am Coll Cardiol 2007;49:1943-50.
19. Cleland JG, McMurray JJ, Kjekshus J, et al. Plasma concentration of amino-terminal pro-brain natriuretic peptide in chronic heart failure: prediction of cardiovascular events and interaction with the effects of rosuvastatin: a report from CORONA (Controlled Rosuvastatin Multinational Trial in Heart Failure). J Am Coll Cardiol 2009;54:1850-9.
20. Anand IS, Fisher LD, Chiang YT, et al. Changes in Brain Natriuretic Peptide and Norepinephrine Over Time and Mortality and Morbidity in the Valsartan Heart Failure Trial (Val-HeFT). Circulation 2003;107:1278-83.
21. McKelvie RS, Yusuf S, Pericak D, et al. Comparison of Candesartan, Enalapril, and Their Combination in Congestive Heart Failure : Randomized Evaluation of Strategies for Left Ventricular Dysfunction (RESOLVD) Pilot Study: The RESOLVD Pilot Study Investigators. Circulation 1999;100:1056-64.
22. Latini R, Masson S, Anand I, et al. Effects of valsartan on circulating brain natriuretic peptide and norepinephrine in symptomatic chronic heart failure: the Valsartan Heart Failure Trial (Val-HeFT). Circulation 2002;106:2454-8.
23. Frantz RP, Olson LJ, Grill D, et al. Carvedilol therapy is associated with a sustained decline in brain natriuretic peptide levels in patients with congestive heart failure. Am Heart J 2005;149:541-7.
24. Tsutamoto T, Wada A, Maeda K, et al. Effect of spironolactone on plasma brain natriuretic peptide and left ventricular remodeling in patients with congestive heart failure. J Am Coll Cardiol 2001;37:1228-33.

May 21, 2013 Page 36
25. Fruhwald FM, Fahrleitner-Pammer A, Berger R, et al. Early and sustained effects of cardiac resynchronization therapy on N-terminal pro-B-type natriuretic peptide in patients with moderate to severe heart failure and cardiac dyssynchrony. Eur Heart J 2007;28:1592-7.
26. Logeart D, Thabut G, Jourdain P, et al. Predischarge B-type natriuretic peptide assay for identifying patients at high risk of re-admission after decompensated heart failure. J Am Coll Cardiol 2004;43:635-41.
27. Bettencourt P, Azevedo A, Pimenta J, Frioes F, Ferreira S, Ferreira A. N-Terminal-Pro-Brain Natriuretic Peptide Predicts Outcome After Hospital Discharge in Heart Failure Patients. Circulation 2004;110:2168-74.
28. Metra M, Nodari S, Parrinello G, et al. The role of plasma biomarkers in acute heart failure. Serial changes and independent prognostic value of NT-proBNP and cardiac troponin-T. Eur J Heart Fail 2007;9:776-86.
29. Masson S, Latini R, Anand IS, et al. Prognostic Value of Changes in N-Terminal Pro-Brain Natriuretic Peptide in Val-HeFT (Valsartan Heart Failure Trial). J Am Coll Cardiol 2008;52:997-1003.
30. Latini R, Masson S, Wong M, et al. Incremental Prognostic Value of Changes in B-Type Natriuretic Peptide in Heart Failure. The American Journal of Medicine 2006;119:70-.
31. Eurlings LWM, van Pol PEJ, Kok WE, et al. Management of Chronic Heart Failure Guided by Individual N-Terminal Pro-B-Type Natriuretic Peptide Targets: Results of the PRIMA (Can PRo-brain-natriuretic peptide guided therapy of chronic heart failure IMprove heart fAilure morbidity and mortality?) Study. Journal of the American College of Cardiology 2010;56:2090-100.
32. Shah MR, Califf RM, Nohria A, et al. The STARBRITE trial: a randomized, pilot study of B-type natriuretic peptide-guided therapy in patients with advanced heart failure. J Card Fail 2011;17:613-21.
33. Jourdain P, Jondeau G, Funck F, et al. Plasma Brain Natriuretic Peptide-Guided Therapy to Improve Outcome in Heart Failure: The STARS-BNP Multicenter Study. J Am Coll Cardiol 2007;49:1733-9.
34. Troughton RW, Frampton CW, Yandle TG, Espiner EA, Nicholls MG, Richards AM. Treatment of heart failure guided by plasma aminoterminal brain natriuretic peptide (N-BNP) concentrations. Lancet 2000;355:1126-30.
35. Lainchbury JG, Troughton RW, Strangman KM, et al. N-Terminal Pro-B-Type Natriuretic Peptide-Guided Treatment for Chronic Heart Failure: Results From the BATTLESCARRED (NT-proBNP-Assisted Treatment To Lessen Serial Cardiac Readmissions and Death) Trial. J Am Coll Cardiol 2009;55:53-60.
36. Pfisterer M, Buser P, Rickli H, et al. BNP-guided vs symptom-guided heart failure therapy: the Trial of Intensified vs Standard Medical Therapy in Elderly Patients With Congestive Heart Failure (TIME-CHF) randomized trial. Jama 2009;301:383-92.

May 21, 2013 Page 37
37. Januzzi JL, Jr., Rehman SU, Mohammed AA, et al. Use of amino-terminal pro-B-type natriuretic peptide to guide outpatient therapy of patients with chronic left ventricular systolic dysfunction. J Am Coll Cardiol 2011;58:1881-9.
38. Berger R, Moertl D, Peter S, et al. N-Terminal Pro-B-Type Natriuretic Peptide-Guided, Intensive Patient Management in Addition to Multidisciplinary Care in Chronic Heart Failure: A 3-Arm, Prospective, Randomized Pilot Study. J Am Coll Cardiol 2010;55:645-53.
39. Pina IL, O'Connor C. BNP-guided therapy for heart failure. Jama 2009;301:432-4.
40. Felker GM, Hasselblad V, Hernandez AF, O'Connor CM. Biomarker-guided therapy in chronic heart failure: a meta-analysis of randomized controlled trials. Am Heart J 2009;158:422-30.
41. Porapakkham P, Zimmet H, Billah B, Krum H. B-type natriuretic peptide-guided heart failure therapy: A meta-analysis. Arch Intern Med 2010;170:507-14.
42. Effect of metoprolol CR/XL in chronic heart failure: Metoprolol CR/XL Randomised Intervention Trial in Congestive Heart Failure (MERIT-HF). Lancet 1999;353:2001-7.
43. Packer M, Bristow MR, Cohn JN, et al. The Effect of Carvedilol on Morbidity and Mortality in Patients with Chronic Heart Failure. N Engl J Med 1996;334:1349-55.
44. The SI. Effect of enalapril on survival in patients with reduced left ventricular ejection fractions and congestive heart failure. N Engl J Med 1991;325:293-302.
45. Pitt B, Zannad F, Remme WJ, et al. The effect of spironolactone on morbidity and mortality in patients with severe heart failure. Randomized Aldactone Evaluation Study Investigators. N Engl J Med 1999;341:709-17.
46. Bardy GH, Lee KL, Mark DB, et al. Amiodarone or an Implantable Cardioverter-Defibrillator for Congestive Heart Failure. N Engl J Med 2005;352:225-37.
47. Araujo JP, Azevedo A, Lourenco P, Rocha-Goncalves F, Ferreira A, Bettencourt P. Intraindividual variation of amino-terminal pro-B-type natriuretic peptide levels in patients with stable heart failure. Am J Cardiol 2006;98:1248-50.
48. Konstam MA, Gheorghiade M, Burnett JC, Jr., et al. Effects of Oral Tolvaptan in Patients Hospitalized for Worsening Heart Failure: The EVEREST Outcome Trial. JAMA 2007;297:1319-31.
49. Cleland JG, Coletta AP, Clark AL, Cullington D. Clinical trials update from the American College of Cardiology 2009: ADMIRE-HF, PRIMA, STICH, REVERSE, IRIS, partial ventricular support, FIX-HF-5, vagal stimulation, REVIVAL-3, pre-RELAX-AHF, ACTIVE-A, HF-ACTION, JUPITER, AURORA, and OMEGA. Eur J Heart Fail 2009;11:622-30.
50. Bang H, Tsiatis A. Estimating medical costs with censored data. Biometrika 2000;87:329-43.
51. Felker GM, Maisel AS. A global rank end point for clinical trials in acute heart failure. Circ Heart Fail 2010;3:643-6.

May 21, 2013 Page 38
52. Pocock SJ, Ariti CA, Collier TJ, Wang D. The win ratio: a new approach to the analysis of composite endpoints in clinical trials based on clinical priorities. Eur Heart J 2012;33:176-82.
53. Freidlin B, Korn EL, Gray R. A general inefficacy interim monitoring rule for randomized clinical trials. Clin Trials 2010;7:197-208.
54. Haybittle JL. Repeated assessment of results in clinical trials of cancer treatment. Br J Radiol 1971;44:793-7.
55. Peto R, Pike MC, Armitage P, et al. Design and analysis of randomized clinical trials requiring prolonged observation of each patient. I. Introduction and design. Br J Cancer 1976;34:585-612.

39
14. APPENDICES
14.1 Appendix A. Schedule of Study Assessments
Screening Day 0 (Randomization)
2 wks (+ 1 week)
6 wks (+ 1 week)
3 mos(+ 1 week)
6 mos(+ 1 week)
9 mos(+ 1 week)
12 mos*(+ 1 week)
Informed Consent X History and physical X X X X X X X X CV Medication History X X X X X X X X Document rationale for changes in therapy X X X X X X
6 minute walk X QOL** X X X X Medical resource use and cost assessment X X X X X X X
Local lab NT-proBNP (standard of care group)
X X
Local lab NT-proBNP (guided only) X X X X X X X X
Cr, BUN, electrolytes (local lab) X X X X X X X X
Core lab plasma sample X X X X X X X
Core lab serum sample X X X X X X X
Core lab DNA sample (once only) X
Safety assessments X X X X X X *Patients will be followed for a minimum of 12 months up to a maximum of 24 months ** QOL will be administered yearly after the 12 month visit. QOL interviewing windows per QOL MOO.
December 3, 2013 Page 1
Study Protocol Amendment 2
GUIDing Evidence Based Therapy Using Biomarker Intensified Treatment in Heart Failure (GUIDE-IT)
Version Date: December 3, 2013

December 3, 2013 Page 2
TABLE OF CONTENTS LIST OF ABBREVIATIONS ...................................................................................................................................................... 4
PROTOCOL SYNOPSIS ........................................................................................................................................................... 5
STUDY FLOW CHART............................................................................................................................................................. 6
1. HYPOTHESES AND OBJECTIVES................................................................................................................................... 7
1.1 PRIMARY OBJECTIVE ................................................................................................................................................. 7 1.2 SECONDARY OBJECTIVES............................................................................................................................................ 7
2. BACKGROUND AND RATIONALE ................................................................................................................................ 7
2.1 SCOPE OF THE HEART FAILURE PROBLEM ..................................................................................................................... 7 2.2 BIOLOGY AND CLINICAL USES OF NATRIURETIC PEPTIDES ................................................................................................ 7 2.3 GUIDING THERAPY BASED ON NATRIURETIC PEPTIDES: OBSERVATIONAL DATA................................................................... 8 2.4 PRIOR STUDIES OF BIOMARKER-GUIDED THERAPY IN HEART FAILURE ............................................................................... 8 2.5 DESIGN OF GUIDE-IT: RATIONALE FOR AN UNBLINDED STUDY ..................................................................................... 10 2.6 DESIGN OF GUIDE-IT: RATIONALE FOR USING NT-PROBNP AND SPECIFIC TARGET ......................................................... 11 2.7 NATRIURETIC PEPTIDE VARIABILITY OVER TIME............................................................................................................ 11
3. STUDY DESIGN ........................................................................................................................................................... 11
3.1 OVERVIEW ............................................................................................................................................................ 11 3.2 PLANNED NUMBER OF SUBJECTS AND CENTERS........................................................................................................... 12 3.3 STUDY DURATION .................................................................................................................................................. 12
4. STUDY POPULATION.................................................................................................................................................. 12
4.1 OVERVIEW OF STUDY POPULATION............................................................................................................................ 12 4.2 INCLUSION CRITERIA ............................................................................................................................................... 12 4.3 EXCLUSION CRITERIA............................................................................................................................................... 12
5. STUDY INTERVENTIONS ............................................................................................................................................ 13
5.1 BIOMARKER-GUIDED ARM ....................................................................................................................................... 13 5.2 USUAL CARE ARM .................................................................................................................................................. 13
6. STUDY PROCEDURES ................................................................................................................................................. 14
6.1 SCREENING............................................................................................................................................................ 14 6.2 RANDOMIZATION ................................................................................................................................................... 14 6.3 STUDY VISITS......................................................................................................................................................... 14
6.3.1 Baseline ........................................................................................................................................................ 14 6.3.2 Follow-Up Visits ........................................................................................................................................... 14 6.3.3 Follow-up Assessments after Adjustment of Therapy or Hospitalization ................................................ 15
6.4 BIOREPOSITORY AND CORE LAB BIOMARKER ASSESSMENT ............................................................................................ 15 6.5 MINIMIZING POTENTIAL BIAS................................................................................................................................... 15 6.6 MAXIMIZING PROTOCOL ADHERENCE ........................................................................................................................ 16 6.7 QUALITY OF LIFE ASSESSMENTS ................................................................................................................................ 16 6.8 ECONOMIC DATA COLLECTION PROCEDURES .............................................................................................................. 16 6.9 REMOVAL OR REPLACEMENT OF SUBJECTS.................................................................................................................. 17
7. OUTCOME DETERMINATIONS .................................................................................................................................. 17
7.1 PRIMARY ENDPOINTS.............................................................................................................................................. 17 7.2 SECONDARY ENDPOINTS.......................................................................................................................................... 17 7.3 EXPLORATORY ENDPOINTS....................................................................................................................................... 17 7.4 SAFETY ................................................................................................................................................................. 18

December 3, 2013 Page 3
7.4.1 Definitions .................................................................................................................................................... 18 7.4.2 Reporting Adverse Events ........................................................................................................................... 18
8. STATISTICAL CONSIDERATIONS ................................................................................................................................ 19
8.1 DETERMINATION AND JUSTIFICATION OF SAMPLE SIZE .................................................................................................. 19 8.2 PROJECTED ENROLLMENT RATE................................................................................................................................. 20 8.3 PROJECTED EVENT RATES ........................................................................................................................................ 20 8.4 ANTICIPATED EFFECT SIZE ........................................................................................................................................ 21 8.5 POWER CALCULATIONS FOR AGE GROUP BY TREATMENT INTERACTION........................................................................... 21 8.6 SAMPLE SIZE JUSTIFICATION FOR SECONDARY ENDPOINTS............................................................................................. 22 8.7 STATISTICAL ANALYSIS: GENERAL APPROACH .............................................................................................................. 23 8.8 ANALYSIS FOR THE PRIMARY HYPOTHESIS................................................................................................................... 23 8.9 SUPPORTIVE ANALYSES OF THE PRIMARY ENDPOINT..................................................................................................... 24 8.10 ANALYSIS OF SECONDARY ENDPOINTS........................................................................................................................ 24 8.11 MULTIPLE COMPARISONS AND COMPOSITE ENDPOINTS ............................................................................................... 24 8.12 EXPLORATORY ENDPOINTS....................................................................................................................................... 24 8.13 ANALYSIS OF ECONOMIC AND QUALITY OF LIFE DATA................................................................................................... 25 8.14 DATA SAFETY MONITORING BOARD AND INTERIM ANALYSES ........................................................................................ 27
9. DATA MANAGEMENT PROCEDURES ........................................................................................................................ 28
9.1 ELECTRONIC DATA CAPTURE (EDC) SYSTEM............................................................................................................... 28 9.2 ELECTRONIC CASE REPORT FORM (ECRF) .................................................................................................................. 28 9.3 DATA MANAGEMENT PROCESS ................................................................................................................................ 28 9.4 DATA QUALITY CONTROL ........................................................................................................................................ 29
10. STUDY GOVERNANCE AND COMMITTEES........................................................................................................... 29
10.1 CLINICAL COORDINATING CENTER (CCC) ................................................................................................................... 29 10.2 DATA COORDINATING CENTER (DCC) ....................................................................................................................... 30 10.3 ECONOMICS AND QUALITY OF LIFE CORE.................................................................................................................... 30 10.4 BIOMARKERS CORE LAB AND BIOREPOSITORY ............................................................................................................. 30 10.5 EXECUTIVE COMMITTEE .......................................................................................................................................... 30 10.6 STEERING COMMITTEE ............................................................................................................................................ 31 10.7 CLINICAL EVENT CLASSIFICATION COMMITTEE............................................................................................................. 31 10.8 ADHERENCE COMMITTEE......................................................................................................................................... 31 10.9 BIOMARKERS AND GENETICS COMMITTEE .................................................................................................................. 31 10.10 PUBLICATIONS AND PRESENTATIONS COMMITTEE ................................................................................................... 31 10.11 DATA AND SAFETY MONITORING BOARD (DSMB) ................................................................................................. 31
11. REGULATORY ISSUES ............................................................................................................................................ 32
11.1 ETHICS AND GOOD CLINICAL PRACTICE ...................................................................................................................... 32 11.2 INSTITUTIONAL REVIEW BOARD/INDEPENDENT ETHICS COMMITTEE ............................................................................... 32 11.3 INFORMED CONSENT .............................................................................................................................................. 32
12. REMOTE MONITORING......................................................................................................................................... 32
13. REFERENCES........................................................................................................................................................... 34
14. APPENDICES........................................................................................................................................................... 42
14.1 APPENDIX A. SCHEDULE OF STUDY ASSESSMENTS........................................................................................................ 42

December 3, 2013 Page 4
LIST OF ABBREVIATIONS ACE
Angiotensin Converting Enzyme
AE Adverse Event ARB Angiotensin Receptor Blocker BNP B-type Natriuretic Peptide CCC Clinical Coordinating Center CEC Clinical Endpoints Committee CES-D Center for Epidemiologic Studies Depression Scale CRT Cardiac Resynchronization Therapy CV Cardiovascular DASI Duke Activity Status Index DCC Data Coordinating Center DCRI Duke Clinical Research Institute DSMB Data Safety and Monitoring Board eCRF Electronic Case Report Form EDC Electronic Data Capture EQOL Economics and Quality Of Life EQOL CC HF
Economics and Quality Of Life Coordinating Center Heart Failure
ICD Implantable Cardioverter Defibrillator IRB Institutional Review Board IVRS Interactive Voice Response System KCCQ Kansas City Cardiomyopathy Questionnaire LVEF Left Ventricular Ejection Fraction mL Milliliter NHLBI National Heart, Lung, and Blood Institute NT-proBNP Amino-Terminal pro B-type Natriuretic Peptide SAE Serious Adverse Event SIRE Simple Internal Randomization Engine QOL Quality of Life

December 3, 2013 Page 5
PROTOCOL SYNOPSIS Title: GUIDing Evidence Based Therapy Using Biomarker Intensified Treatment (GUIDE-IT)
Indication: Heart Failure
Location: Approximately 40 clinical centers in North America
Rationale: Current guidelines recommend that medical therapy be titrated toward the target doses used in clinical trials, but “therapeutic inertia” often represents a barrier to aggressive titration of medical therapy. There is a pressing need to develop strategies to improve utilization of proven therapies for HF in order to improve clinical outcomes and control costs. Observational studies have shown an association between decreasing natriuretic peptide levels over time and improved outcomes in patients with HF.
Objectives: To compare a strategy of medical therapy titration aimed at achieving and maintaining anNT-proBNP target of < 1000 pg/mL (biomarker-guided therapy) to usual care in high risk patients with systolic heart failure.
Study Design: Prospective, randomized, parallel controlled groups, unblinded, 2-arm, multicenter clinical trial of approximately 1100 patients.
Primary Endpoint:
Time to cardiovascular death or first HF hospitalization
Secondary Endpoints:
Time to all-cause mortalityRecurrent hospitalizationsDays alive and not hospitalized for CV reasonsTime to cardiovascular deathTime to first HF hospitalizationHealth-related quality of life (HRQOL)Resource utilization, cost and cost effectivenessSafety

December 3, 2013 Page 6
STUDY FLOW CHART
High risk systolic heart failure patients, with EF 40%, a heart failure event within prior 12 months, and NT-proBNP > 2000 pg/mL or BNP > 400 pg/mL during the 30 days prior to
randomization
SCREENING
Randomized to either Usual Care (N=550) or Biomarker Guided NT-proBNP < 1000 pg/mL (N=550)
Baseline visit (day 0) History and physical exam, CV medication history, serum creatinine, BUN and electrolytes
and NT-proBNP (local lab), QOL questionnaire, medical resource use and cost assessment, 6MWT, biomarker and DNA sample collection
RANDOMIZATION
2-week follow-up (+ 1 week)History and physical exam, CV medication history, change in HF therapy rationale, serum creatinine, BUN and electrolytes (local lab), NT-proBNP (local lab biomarker guided arm
only), medical resource, cost assessment and biomarker samples
6-week follow-up (+ 1 week)History and physical exam, CV medication history, change in HF therapy rationale, serum creatinine, BUN and electrolytes (local lab), NT-proBNP (local lab biomarker guided arm
only), medical resource, cost assessment and biomarker samples
3-month follow-up (months 3, 6, 9, 12, 15, 18, 21, and 24) (+ 1 week)History and physical exam, CV medication history, change in HF therapy rationale, serum creatinine, BUN and electrolytes (local lab), NT-proBNP (local lab biomarker guided arm
only), medical resource, cost assessment and biomarker samples
FOLLOW-UP
Notes:Minimum 12 months of follow-up. Study visits occur every 3 months until a maximum of 24 months. 2-week (+/- 1 week) follow-up after adjustment of therapy or hospitalization. Follow-up visits include brief clinical assessment, serum creatinine, BUN and electrolytes (local lab), and NT-proBNP (local lab biomarker guided arm only).Follow-up visits continue every 2 weeks until therapeutic targets are reached, or untilfurther titration of therapy is not possible. QOL questionnaires to be administered by EQOL CC at 3 months, 6 months, 12 months and yearly until the end of the studyEQOL CC will collect medical resource and cost assessments throughout the length of the study

December 3, 2013 Page 7
1. HYPOTHESES AND OBJECTIVES
1.1 Primary Objective The primary objective of this study is to determine the efficacy of a strategy of biomarker-guided therapy compared with usual care on the composite endpoint of time to cardiovascular death or first heart failure (HF) hospitalization in high risk patients with left ventricular systolic dysfunction.
1.2 Secondary Objectives The secondary objectives of this study are to evaluate the effects of biomarker-guided therapy on:
Time to All-cause mortality Recurrent hospitalizations Total days alive and not hospitalized for cardiovascular reasons Time to cardiovascular death Time to first HF hospitalization HRQOL Resource use, cost and cost effectiveness Safety
2. BACKGROUND AND RATIONALE
2.1 Scope of the Heart Failure Problem Heart failure (HF) is a major and growing public health problem in the United States (U.S.), affecting over 5 million Americans, causing over 1 million hospitalizations, and accounting for over 30 billion dollars in total costs annum1. Among U.S. adults age 40, 1 in 5 will develop HF in their lifetime.2 Current practice guidelines for pharmacologic management dictate that neuro-hormonal antagonists such as beta-blockers and ACE-inhibitors be titrated toward the target doses studied in large clinical trials.3,4 Despite these recommendations, available data suggest that most patients in clinical practice are either not treated with these agents or are treated with substantially lower than recommended doses.5-8 “Therapeutic inertia” often represents a barrier to aggressive titration of medical therapy for both providers and patients. A variety of disease management strategies have been evaluated to improve the chronic management of HF patients, ranging from nursing-based interventions to technologically complex interventions using implantable hemodynamic monitors and telemedicine. The majority of these interventions have focused on the monitoring of symptoms and body weight and/or on patient education. Overall, the results from disease management strategies have been mixed,9 and many are personnel intensive, complex10 or costly to implement.11 Thus, there is an unmet need for a simple, effective and easy-to-implement strategy to improve the management of patients with chronic HF such that patient outcomes are demonstrably improved.
2.2 Biology and Clinical Uses of Natriuretic Peptides The natriuretic peptides are a family of important counter-regulatory hormones with vasodilatory, lusitropic, anti-fibrotic, and natriuretic effects.12 The natriuretic peptides b-type natriuretic peptide (BNP) and amino-terminal pro-b-type natriuretic peptide (NT-proBNP) are released from the myocardium in response to hemodynamic stress and provide important diagnostic and prognostic information in HF patients. Multiple studies have linked higher levels of natriuretic peptides to worse clinical outcomes in patients with HF as well as other cardiovascular disorders and in healthy persons.13-16 Both BNP and NT-

December 3, 2013 Page 8
proBNP have been shown to be very powerful predictors of future risk in both acute17,18 and chronic HF.19,20
2.3 Guiding Therapy Based on Natriuretic Peptides: Observational Data A large number of studies have also investigated the impact of HF therapies on natriuretic peptide levels. HF therapies proven to have beneficial long-term effects on morbidity and mortality, such as ACE inhibitors,21 angiotensin receptor blockers (ARB),22 beta-blockers,23 aldosterone antagonists,24 and cardiac resynchronization therapy,25 all generally decrease natriuretic peptide levels. Observational studies have shown an association between decreasing natriuretic peptide levels over time and improved outcomes in both inpatients and outpatients with HF.20,26-29. In a representative study, Masson et al examined the prognostic value of baseline and 4 month NT-proBNP values in a prospective substudy of patients enrolled in the placebo arm of the Valsartan Heart Failure (Val-HeFT) study (Figure 1). 29 This study demonstrated the powerful association of change in NT-proBNP levels over time with subsequent clinical outcomes. Using a cut-point NT-proBNP level (derived from receiver operator curve analysis) of 1078 pg/mL, this study showed the prognostic significance of change in NT-proBNP values across this threshold over time. A similar analysis focused on BNP by Latini et al demonstrated substantially similar results.30 These findings appear to be consistent across multiple studies and provide a strong observational foundation for the concept of natriuretic peptide guided therapy in HF.
2.4 Prior Studies of Biomarker-Guided Therapy in Heart Failure These observational data have led to the hypothesis that serial measurements of natriuretic peptides may serve as a guide to the titration of chronic medical therapy— “biomarker-guided therapy”. This concept has been tested over the last decade in multiple small randomized controlled studies ranging from 69 to 499 patients.31-38 As shown below, the design of each study has differed with regard to patient population, the biomarker used, the natriuretic peptide target, the nature of the control group, and the study endpoint (Table 1).
Figure 1. Changes in NTproBNP and outcome in Val-HeFT study.

December 3, 2013 Page 9
Figure 2. Event free survival curves for BNP guided therapy vs. control in the STARS BNP trial and number of treatment modifications in each group.
Table 1. Design of selected RCTs of Biomarker-guided Therapy in Heart Failure Troughton STARBRITE STARS-BNP TIME-CHF BATTLE-
SCARREDPRIMA PROTECT
N 69 137 220 499 364 345 151Marker NT-proBNP BNP BNP NT-proBNP NT-proBNP NT-
proBNPNT-proBNP
Target 1692 pg/mL 2 x discharge
level
100 pg/mL 400 pg/ml if age<75,
800 pg/ml if age>75
1270 pg/mL Discharge level
1000 pg/mL
Length of f/u 9.6 mos 3 mos 15 mos 18 mos 12 mos 12 mos 10 mos
Endpoint Death + CV hospital or
worsening HF
Days alive and out of hospital
HF death + HF hospital
All-cause death or hospital
All-cause mortality
Days alive and out of hospital
Total CV events
The initial experience with biomarker-guided therapy in HF was a small (N=69) pilot study by Troughton, et al. that randomized patients to a strategy of titrating medical therapy to achieve an NT-proBNP level < 1692 pg/mL or a control group in which medical therapy was titrated based on a clinical HF score.34 This study showed a significant decrease in cardiovascular events with biomarker-guided therapy vs. control. These findings were confirmed in the STARS-BNP study, which randomized 220 well-treated ambulatory HF patients to BNP-guided therapy (BNP target < 100 ng/mL) or usual care. This study showed a significant reduction in cardiac events in the BNP guided arm (p<0.01).36 Notably, although no specific instructions were provided for responding to BNP levels above the target threshold, up-titration of therapy in the BNP guided arm was significantly greater for not just diuretics but also ACE-inhibitors, beta-blockers, and spironolactone (Figure 2). The largest published study of biomarker-guided therapy to date is TIME-CHF, which randomized 499 patients with chronic HF to either usual care or an NT-proBNP target based on the subject’s age (< 400 pg/mL if age < 75 or < 800 pg/mL if age > 75). A notable difference in TIME-CHF compared to previous studies was a specific focus on elderly patients (mean age of 77). This study did not meet its primary endpoint of the composite of all-cause mortality and all-cause hospitalization (HR = 0.91, p=0.39), but did demonstrate a trend towards improvement in all-cause mortality (HR = 0.68, p=0.06) and showed significant benefit on survival free of HF hospitalization (HR=0.68, p=0.01).36,39 In a recent prospective 3-arm study performed at 8 hospitals in Vienna, Austria, 278 patients were randomized at the time of discharge from a HF hospitalization to 1 of 3 arms; usual care, a multidisciplinary disease management program, or disease management plus individualized HF therapy based on NT-proBNP levels.38 In the biomarker-guided arm, both the frequency of visits and the titration of HF treatment were based on serial measurement of NT-proBNP levels with a goal of decreasing NT-proBNP

December 3, 2013 Page 10
Figure 3. Meta-analysis of all-cause mortality in previous studies of biomarker-guided therapy in HF. The overall hazard ratio for mortality was 0.69 (95% confidence intervals 0.55-0.86).
levels to below 2200 pg/mL. The primary endpoint of the study was the composite of time to death or rehospitalization for HF over 18 months. In this study, biomarker-guided therapy was associated with a greater proportion of patients receiving intensified medical therapy (defined as being treated with spironolactone as well as ACE-care or disease management, and this greater intensification of proven therapies resulted in a significantly greater reduction of NT-proBNP levels in the biomarker-guided therapy arm than in the disease management arm. Most importantly, randomization to biomarker-guided therapy was associated with a significant improvement in the survival free of HF hospitalization (3
biomarker-guided therapy may have additional biologic effects and provides additive and clinically important benefits above and beyond that provided by intensified disease management alone. The recently published PROTECT study demonstrated a highly significant clinical benefit on total cardiovascular events (logistic odds for event = 0.44, p = 0.02) in a 151 patient single center trial, using an NT-proBNP target of 1000 pg/mL (the same target proposed for the current study). Importantly, the PROTECT data suggested that there were important clinical benefit in both younger and older patients alike37. Two systematic reviews and meta-analyses of the available literature on natriuretic peptide guided therapy in HF, have been published.40,41 Both analyses demonstrated a significant impact on all-cause mortality with biomarker-guided therapy compared to control (Figure 3). Notably, the point estimate for the benefit of biomarker-guided therapy in these meta-analyses was approximately a improvement in survival, a treatment effect comparable to that observed with individual components of HF therapy such as beta-blockers,42,43 ACE-inhibitors44, aldosterone antagonists45, and implantable cardioverter defibrillators (ICDs).46
2.5 Design of GUIDE-IT: Rationale for an Unblinded Study GUIDE-IT will be an unblinded trial because blinding would eliminate one potentially important mechanism of treatment effect: the impact of patient knowledge of their own natriuretic peptide levels on adherence and health-related behaviors. Blinding GUIDE-IT would remove the patient from the critical role of active partnership in the management of his or her disease and would not reflect how biomarker-guided therapy will ultimately be used in practice, thus raising important issues about generalizability. We have taken multiple steps to minimize potential biases related to lack of blinding, including the use of an objective primary endpoint (cardiovascular death or HF hospitalization) and centralized adjudication of events by a Clinical Event Committee blinded to treatment assignment.
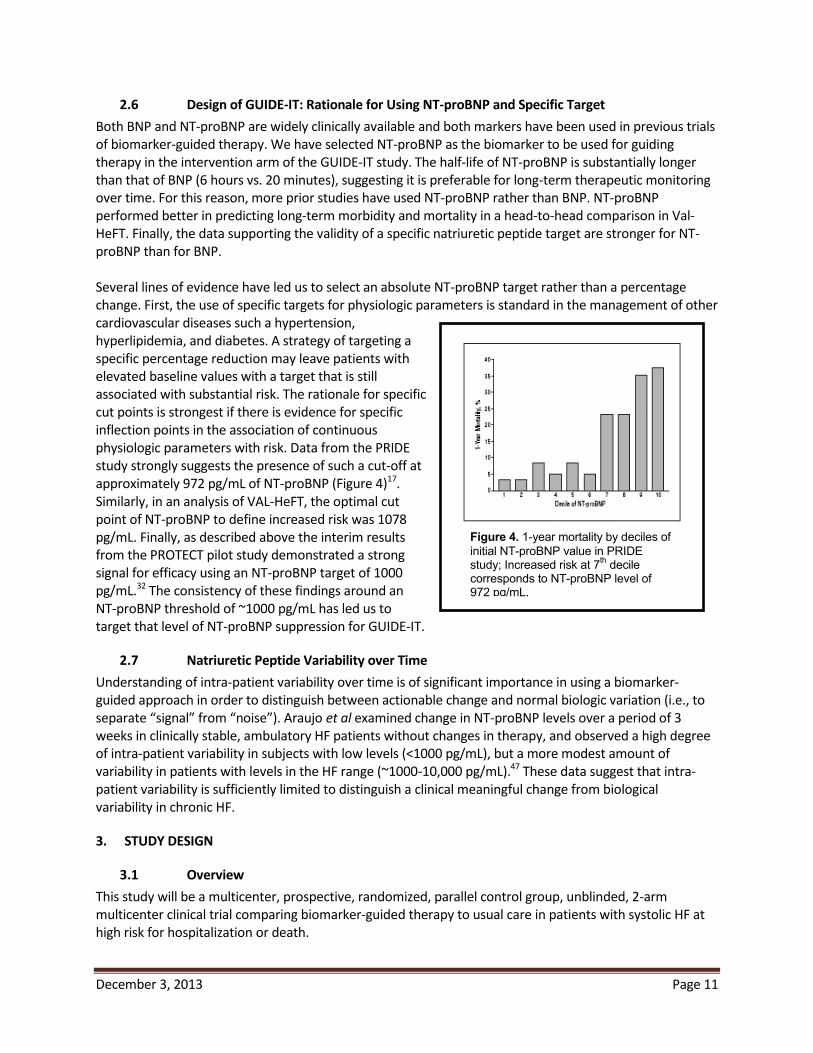
December 3, 2013 Page 11
Figure 4. 1-year mortality by deciles of initial NT-proBNP value in PRIDE study; Increased risk at 7th decile corresponds to NT-proBNP level of 972 pg/mL.
2.6 Design of GUIDE-IT: Rationale for Using NT-proBNP and Specific Target Both BNP and NT-proBNP are widely clinically available and both markers have been used in previous trials of biomarker-guided therapy. We have selected NT-proBNP as the biomarker to be used for guiding therapy in the intervention arm of the GUIDE-IT study. The half-life of NT-proBNP is substantially longer than that of BNP (6 hours vs. 20 minutes), suggesting it is preferable for long-term therapeutic monitoring over time. For this reason, more prior studies have used NT-proBNP rather than BNP. NT-proBNP performed better in predicting long-term morbidity and mortality in a head-to-head comparison in Val-HeFT. Finally, the data supporting the validity of a specific natriuretic peptide target are stronger for NT-proBNP than for BNP. Several lines of evidence have led us to select an absolute NT-proBNP target rather than a percentage change. First, the use of specific targets for physiologic parameters is standard in the management of other cardiovascular diseases such a hypertension, hyperlipidemia, and diabetes. A strategy of targeting a specific percentage reduction may leave patients with elevated baseline values with a target that is still associated with substantial risk. The rationale for specific cut points is strongest if there is evidence for specific inflection points in the association of continuous physiologic parameters with risk. Data from the PRIDE study strongly suggests the presence of such a cut-off at approximately 972 pg/mL of NT-proBNP (Figure 4)17. Similarly, in an analysis of VAL-HeFT, the optimal cut point of NT-proBNP to define increased risk was 1078 pg/mL. Finally, as described above the interim results from the PROTECT pilot study demonstrated a strong signal for efficacy using an NT-proBNP target of 1000 pg/mL.32 The consistency of these findings around an NT-proBNP threshold of ~1000 pg/mL has led us to target that level of NT-proBNP suppression for GUIDE-IT.
2.7 Natriuretic Peptide Variability over Time Understanding of intra-patient variability over time is of significant importance in using a biomarker- guided approach in order to distinguish between actionable change and normal biologic variation (i.e., to separate “signal” from “noise”). Araujo et al examined change in NT-proBNP levels over a period of 3 weeks in clinically stable, ambulatory HF patients without changes in therapy, and observed a high degree of intra-patient variability in subjects with low levels (<1000 pg/mL), but a more modest amount of variability in patients with levels in the HF range (~1000-10,000 pg/mL).47 These data suggest that intra-patient variability is sufficiently limited to distinguish a clinical meaningful change from biological variability in chronic HF.
3. STUDY DESIGN
3.1 Overview This study will be a multicenter, prospective, randomized, parallel control group, unblinded, 2-arm multicenter clinical trial comparing biomarker-guided therapy to usual care in patients with systolic HF at high risk for hospitalization or death.
December 3, 2013 Page 12
3.2 Planned Number of Subjects and Centers The planned enrollment for the GUIDE-IT study is approximately 1,100 subjects at approximately 40 centers in North America. To maximize generalizability, centers outside of North America may be considered for participation if HF management is sufficiently similar to U.S. practice and appropriate use of guideline-based therapy can be verified.
3.3 Study Duration We anticipate the study duration will be 5 years: 6 months of start-up activities (i.e., finalize protocol, prepare study sites and contracts, receive site Institutional Review Board [IRB] approval), 36 months of active enrollment, 12 months of patient follow-up after the final patient is enrolled, and 6 months of study close-out, data analysis, and reporting of results.
4. STUDY POPULATION
4.1 Overview of Study population The enrolled population will be high-risk patients with systolic HF (left ventricular ejection fraction [LVEF]
. High-risk patients are defined below.
4.2 Inclusion Criteria Age 18 years Most recent LVEF High risk heart failure as defined by the following criteria
o A Heart Failure Event in the prior 12 months, defined as any one of the following: HF Hospitalization Treatment in the Emergency Department (or equivalent) for Heart Failure Outpatient treatment for heart failure with intravenous diuretics
AND
o NT-proBNP > 2000 pg/mL or BNP > 400 pg/mL at any time during the 30 days prior to randomization
Willing to provide informed consent
4.3 Exclusion Criteria Acute coronary syndrome or cardiac revascularization procedure within 30 days (NOTE: Given that cardiac biomarkers such as troponin are frequently elevated in HF patients, the diagnosis of acute coronary syndrome should be based on clinical diagnosis, not biomarkers alone) Cardiac resynchronization therapy (CRT) within prior 3 months or current plan to implant CRT device Active myocarditis, Hypertrophic obstructive cardiomyopathy, pericarditis, or restrictive cardiomyopathy Severe stenotic valvular disease Anticipated heart transplantation or ventricular assist device within 12 months Chronic inotropic therapy Complex congenital heart disease End stage renal disease with renal replacement therapy Non cardiac terminal illness with expected survival less than 12 months Women who are pregnant or planning to become pregnant

December 3, 2013 Page 13
Inability to comply with planned study procedures Enrollment or planned enrollment in another clinical trial
5. STUDY INTERVENTIONS GUIDE-IT will randomize patients in a 1:1 allocation to either:
Biomarker-guided arm (approximately 550 subjects): Titration of HF therapy with a goal of achieving and maintaining a target NT-proBNP < 1000 pg/mL OR Usual care (approximately 550 subjects): Titration of HF therapy based on target doses from current evidence based guidelines
5.1 Biomarker-guided Arm In the Biomarker-guided arm, NT-proBNP values from the local clinical laboratory will be utilized by treating physicians for the purpose of achieving at NT-proBNP target of < 1000 pg/mL. The GUIDE-IT protocol will specify interventions to be considered to achieve the NT-proBNP target in the biomarker-guided arm, but specific treatment decisions will be at the discretion of the treating physician. The order of implementation will be based on clinical judgment, and more than one intervention can occur in a single encounter. Titration of neurohormonal antagonists will be emphasized over titration of diuretics except in the case of clinically apparent congestion or in the case of very high NT-proBNP levels, which usually indicate subclinical volume overload. Specific changes in therapy and the rationale for them (e.g., in response to clinical change or NT-proBNP levels) will be captured on the eCRF. Potential interventions to decrease NT-proBNP levels will include:
Up-titrate or add Angiotensin Converting Enzyme (ACE)-inhibitor or ARB Up-titrate or add beta-blocker (if not clinically congested) Up-titrate or add hydralazine-nitrates in African-American patients Increase loop diuretic dosage (if clinically congested or NT-proBNP > 5000 pg/mL) Up-titrate or add spironolactone if tolerated by renal function and potassium Add oral thiazide diuretic Add digoxin Consider adding ARB to ACE-I (if not on spironolactone) Consider hydralazine-nitrates in non-African-American patients Intensified or repeated heart failure education regarding diet, sodium restriction, etc. Consider optimization of cardiac resynchronization therapy (if CRT device implanted) Reconsider potential indications for CRT (if not previously implanted) If in atrial fibrillation, maximize rate control or consider more aggressive attempts at normal sinus rhythm Consider exercise training or cardiac rehabilitation
5.2 Usual Care Arm Patients randomized to the usual care group will receive care based on the most recent AHA/ACC guidelines.4 Investigators will be provided with specific information on evidence-based target doses of neuro-hormonal antagonists (beta-blockers, ACE-inhibitors). Diuretics will be titrated based on clinical judgment of the treating physician. Routine assessment of natriuretic peptides will not be performed in the usual care group except for compelling medical reasons, consistent with current guidelines.4
December 3, 2013 Page 14
6. STUDY PROCEDURES A complete schedule of assessments throughout the study is given in Appendix A.
6.1 Screening Clinical site staff will screen patients in both the inpatient and outpatient setting to identify high risk patients with systolic heart failure. If identified during a heart failure hospitalization, patients will not be randomized until the time of hospital discharge. A screening log will be maintained at each site. Eligible patients will provide written informed consent prior to randomization.
6.2 Randomization Subjects who fulfill all the inclusion criteria and none of the exclusion criteria will be randomized in a 1:1 fashion using the Simple Internal Randomization Engine (SIRE) system to either biomarker-guided therapy or usual care. The unit of randomization will be at the patient level rather than the site level. Treatment allocation will be conducted using a complete randomization scheme. At randomization, subjects will undergo a brief interval history and physical exam, cardiovascular (CV) medication history, local laboratory testing for renal function and electrolytes, assessment for adverse events, 6 minute walk test, QOL questionnaires, medical resource use and cost assessment, and core laboratory samples.
6.3 Study Visits
6.3.1 Baseline Baseline assessments will occur at the time of randomization and will include:
Focused physical examination CV medication history Serum creatinine, blood urea nitrogen (BUN), and electrolytes (local laboratory) NT-proBNP (local laboratory) Health Related QOL questionnaire (as described in 6.7) 6 minute walk test Biomarker and DNA collection for biorepository (as described in 6.4)
6.3.2 Follow-Up Visits Follow-up visits will occur at 2 weeks, 6 weeks, 3 months, and then every 3 months for the remainder of the study duration period (minimum of 12 months and a maximum of 24 months). All study visits will be completed within a ± 1-week window. The following assessments will occur at each follow-up study visit.
Focused interval history and physical examination CV medication history Document rationale for changes in HF therapy Serum creatinine, BUN, and electrolytes (local laboratory) NT-proBNP (local laboratory, Biomarker-guided Arm only) QOL questionnaire (as described in 6.7) Medical resource use and cost assessment Ascertainment of interval safety events and endpoints Biomarker collection for biorepository (as described in 6.4)
Subjects in the biomarker-guided arm will have NT-proBNP testing performed in the local laboratory by appropriately trained personnel, and these values will be used for the purposes of titrating therapy to the

December 3, 2013 Page 15
protocol-specified target. If therapy is adjusted, the changes in therapy and the rationale for the adjustment (e.g. clinical reason, not at biomarker target) will be recorded on the eCRF. Subjects in the usual care arm will not have routine assessment of natriuretic peptides except for compelling medical reasons.
6.3.3 Follow-up Assessments after Adjustment of Therapy or Hospitalization
There will be a 2-week (± 1 week) reassessment for patients who have a change in therapy, resulting from clinical findings or natriuretic peptide levels. This follow up can be in person or a remote laboratory evaluation at the discretion of the treating physician. This follow-up assessment will include a brief clinical assessment (if in person visit), measurement of renal function and electrolytes, and local laboratory NT-proBNP measurement (biomarker-guided arm only. Follow-up assessments will continue every 2 weeks until therapeutic targets are reached, or the investigator determines that further titration of therapy is not possible. Patients hospitalized for HF during the study will have a 2-week follow-up study visit post discharge to reassess and adjust medical therapy, which will include all standard follow-up assessments as defined above (Section 6.3.2).
6.4 Biorepository and Core Lab Biomarker Assessment Local laboratory NT-proBNP values will be used to adjust therapy in patients randomized to the biomarker-guided arm. Additionally, at each regular study visit, all subjects (regardless of treatment arm) will have blood samples sent to the Biomarker Core Laboratory for the central blinded assessment of NT-proBNP levels. Data from this core lab assessment will not be provided to the sites but will be used to standardize assessments for all study patients (including those in the usual care arm) during data analysis at the completion of the study. As a quality control measure, the correlation between local site laboratory NT-proBNP values and central core lab NT-proBNP values will be assessed after enrollment of the first 100 patients, and as needed thereafter. Additional plasma, serum, and DNA samples (once only) will be collected and stored in the GUIDE-IT biorepository at each regular study visit (see Schedule of Assessments). Individual study subjects will be permitted to opt out of the biorepository while still participating in the main trial, but participation in the biorepository for all subjects will be strongly encouraged. Samples will be collected, processed, and labeled at the study site and shipped to the biorepository as described in the Manual of Operations. These biorepository samples will be used by GUIDE-IT investigators to evaluate the role of specific “biomarkers” (including genetic biomarkers) in the biology and pathophysiology of HF and the biology of the response to biomarker-guided therapy. A Biomarkers and Genetics Committee will establish and manage the process for scientific review of proposals to use these biologic samples.
6.5 Minimizing Potential Bias To address potential effects of an unblinded trial design on outcome determination, we have chosen an objective primary endpoint (HF hospitalization or CV death) and will use a blinded Clinical Endpoints Committee (CEC) to classify potential endpoints. Source data (i.e., history, laboratory procedures and discharge summaries) on all deaths and hospitalizations will be reviewed by the CEC in a consistent, standardized and unbiased manner. Final cause for each event will be adjudicated using definitions that will be established in the CEC Charter. Another potential source of bias relates to the possibility that the greater frequency of medical visits due to natriuretic peptide guidance will lead to improved patient outcomes through a mechanism other than
December 3, 2013 Page 16
biomarker-guided titration of HF therapy. While GUIDE-IT will mandate frequent visits in the usual-care group (as consistent with standard practice), any observed differential in the number of medical interventions (driven by out-of-range natriuretic peptide levels in apparently stable patients) may be the mechanism by which any treatment effects are realized. The alternative of mandating extra clinical visits for the usual-care arm to mirror the visit pattern of the biomarker-guided arm carries risk of biasing the trial results. Those extra visits, which would not occur in regular clinical practice, could lead to extra testing and treatment modifications that result in the outcomes of the two arms converging, thus masking a real treatment benefit. While there is no perfect solution to this problem, we will have detailed data on the content of each clinic visit in both treatment arms; thus, we will determine how often these visits included significant modifications of medical therapy.
6.6 Maximizing Protocol Adherence In order to persuasively test the primary hypothesis of GUIDE-IT, we will maximize adherence to the assigned strategies. In the case of the biomarker-guided arm, the investigators will act on above-target NT-proBNP levels even in the absence of worsening symptoms or signs of HF. Similar to studies of intensive glycemic control or blood pressure control, adherence monitoring and feedback to providers will be critical to the success of GUIDE-IT. To ensure that investigators adhere to the protocol, GUIDE-IT will convene an Adherence Committee to focus on investigator education and training. Based on our experience in prior studies to identify and correct non-adherence, adherence monitoring and intervention will take a stepped approach. For example, the clinical coordinating center (CCC) will collect patient feedback on adherence. Investigators at sites with two episodes of non-adherence will be contacted to review episodes and the importance of adherence will be reemphasized. Reports on adherence will be provided to the Executive Committee. The Executive Committee will consider suspending enrollment at sites not performing at appropriate levels. Adherence performance will be used in determining authorship of trial manuscripts. Although we recognize that such substantial efforts at ensuring investigator adherence are not practical in all real-world settings, we believe they are critical for a proof-of-concept efficacy trial such as GUIDE-IT.
6.7 Quality of Life Assessments GUIDE-IT will use a battery of validated instruments that build on a disease-specific core, supplemented by generic measures to provide a comprehensive assessment of health related QOL. These assessments of quality of life (QOL) will be performed at baseline by site coordinators and then 3 months, 6 months and annually to a maximum of 24 months by structured telephone interview conducted by the EQOL CC staff. A detailed description of each of these instruments with instructions will be included in the Manual of Operations. Assessments at each visit will include the following:
Kansas City Cardiomyopathy Questionnaire (KCCQ) Duke Activity Status Index (DASI) enter for Epidemiological Studies Depression Scale (CES-D) Medical Outcomes Study Short Form (SF-12) Medical Outcomes Study Short Form (SF-36) subscales: General Health, psychological well-being, vitality, social functioning) EQ-5D
6.8 Economic Data Collection Procedures Total medical costs can be divided into five major components: inpatient hospital care, inpatient physician care, outpatient (ED visits, observational stays, rehabilitation stays, nursing home stays) physician care,

December 3, 2013 Page 17
outpatient testing, and outpatient medications. Hospital costs will be calculated using hospital billing data, with charges converted to costs using the departmental charge-to-cost conversion factors available from each hospital’s annual Medicare Cost Report. Physician costs (both inpatient and outpatient) will be estimated by mapping major procedures and physician services recorded on the case report form and hospital bills to appropriate current procedural terminology (CPT) codes in the Medicare Fee Schedule. Outpatient medication costs will be based on the Drug Topics Red Book average wholesale price, discounted as appropriate to reflect market acquisition costs. Outpatient testing costs will be assigned using the Medicare Fee Schedule for the physician component and the Medicare ambulatory payment classification (as per rates for the institutional and laboratory component). Hospital bills for patients in the U.S. (detailed, summary ledger, and UB-04) will be collected by the GUIDE-IT EQOL CC staff after discharge from the hospital This process typically starts with a call to the head or the representative of the given hospital’s patient accounting department to request the bill, and is followed by a written letter including a copy of the signed consent form if requested. Once received, in order to maintain confidentiality, the patient’s name will be removed and replaced with the GUIDE-IT patient study number and patient initials before further processing. In addition, cost-to-charge ratios (Medicare Cost Report Worksheets C and D-1, Part 2) will be obtained for each hospital where a GUIDE-IT hospitalization is reported. These reports can be obtained from the hospital in question, the Medicare Intermediary for that region, or the Centers for Medicare and Medicaid Services. Reports will be obtained for each year of study enrollment and follow-up up to the most recent report available at the start of the data analysis phase.
6.9 Removal or Replacement of Subjects Subjects have the right to withdraw from the study at any time and for any reason without prejudice to his or her future medical care. In the case of subject withdrawal, the investigator will discuss with the subject the most appropriate way to terminate study participation to ensure the subject’s health. All efforts will be made to complete and report the observations as thoroughly as possible up to the date of study termination. Randomized subjects who withdraw from the study will not be replaced.
7. OUTCOME DETERMINATIONS
7.1 Primary Endpoints The primary endpoint is the time to CV death or first HF hospitalization.
7.2 Secondary Endpoints Time to All-cause mortality Recurrent hospitalizations Days alive and not-hospitalized for CV reasons Time to CV death Time to first HF hospitalization Health Related QOL Resource utilization, cost and cost effectiveness Safety
7.3 Exploratory Endpoints Global Rank Endpoint, incorporating death, hospitalization, and change in quality of Life

December 3, 2013 Page 18
Win-ratio, incorporating death, hospitalization, and change in quality of life
7.4 Safety The main safety objectives in GUIDE-IT are to characterize the risk profiles of the two management strategies and to monitor for unanticipated risks to study participants. In this study, all medications and procedures commonly used or performed as a part of standard of care for the management of HF have well defined safety profiles. For this trial, reporting is primarily governed by the Common Rule (45 CFR Part 46, Subpart A), Investigational Device Exemptions (Part 812), as well as ICH Guidelines, IRBs and local regulations. The investigator is responsible for monitoring the safety of subjects enrolled into the study at the study site. The investigator or qualified designee will enter the required initial and follow-up information regarding events into the appropriate module of the eCRF within InForm. Investigators are to report serious adverse events in accordance with their local IRB requirements. Investigators should follow usual clinical practices at their institution for reporting to regulatory authorities serious, unexpected events related to standard of care medications and devices.
7.4.1 Definitions An adverse event (AE) is any untoward medical occurrence in a patient or clinical investigational subject administered an investigational intervention and which does not necessarily have a causal relationship with this treatment. An AE can therefore be any unfavorable and unintended sign (including an abnormal laboratory finding), symptom, or disease temporally associated with the investigational intervention, whether or not considered related to the investigational intervention (ICH1996). A serious adverse event (SAE) is any adverse event that may result in any of the following outcomes:
Death Is life-threatening Results in persistent or significant disability/incapacity Is a congenital anomaly/birth defect
Important medical event that may not result in death, be life-threatening, or require hospitalization may be considered a SAE when, based upon appropriate medical judgment, it may jeopardize the patient or subject and may require medical or surgical intervention to prevent one of the outcomes listed above
AEs of Interest for the GUIDE IT trial, which may or may not meet serious criteria, include any of the following:
Symptomatic hypotension Symptomatic bradycardia Hyperkalemia (Potassium > 6.0 meq/dl or requiring change in therapy) Worsening renal function (increase in creatinine by 0.5 mg/dl from last visit or requiring change in therapy)
7.4.2 Reporting Adverse Events
Adverse Events that do not meet SAE criteria and that are not an AE of Interest will not be reported in the InForm database.
December 3, 2013 Page 19
SAEs and AEs of Interest that occur from randomization through completion of the final study visit will be reported in the InForm database in the following manner:
o AEs of Interest that do not meet SAE criteria will be recorded on the AE eCRF. o SAEs that require hospitalization will be reported on the HOSP eCRF noting the reason
for the hospitalization. AEs of Interest that require hospitalization will be reported on the HOSP eCRF rather than the AE eCRF.
o Secondary SAEs that may occur while a subject is hospitalized due to a different reason will be reported on the AE eCRF.
o Deaths will be reported on the DEATH eCRF. o If the subject was hospitalized for the event that led to death, the event will need to be
reported both on the HOSP eCRF and the DEATH eCRF.
The Investigator will follow all SAEs and AEs of Interest until resolution, stabilization or the event is otherwise explained.
8. STATISTICAL CONSIDERATIONS
8.1 Determination and Justification of Sample Size Several design factors and research objectives have been considered in developing an appropriate sample size for the study. First, patient enrollment has been determined so there would be a sufficient number of endpoints to provide a high degree of confidence for testing the primary hypothesis. Second, the statistical power for secondary endpoints has been considered, including the EQOL endpoints. Finally, the sample size has been determined to provide a reasonable level of confidence for detecting clinically important differences in outcome between the two strategies—even if current projections of enrollment rates and hypothesized differences in clinical outcomes between the two arms prove to be optimistic. Based on the anticipated patient population, we have projected a 1-year CV death and HF hospitalization
similar to that on the EVEREST study, a contemporary multicenter trial of patients with systolic HF randomized at the time of HF hospitalization and followed for a median of 10 months.48 In EVEREST, the
-analysis of Felker all-cause mortality with biomarker-guided therapy, the
impact of biomarker-guided therapy can conservatively be expected to reduce the primary composite endpoint (which we expect to be more sensitive to the effects of the biomarker-guided strategy than all-cause 1 year). Based on the event rates for each arm discussed above, we have determined the sample size required to provide high power for detectactual event rates and the outcome differences between the two testing strategies in GUIDE-IT may vary somewhat from these estimates, and we have determined the power of the study under several different combinations of enrollment rates, event rates and effect sizes. We have conducted the power analyses using simulation studies to mimic the key features of GUIDE-IT. As the primary treatment comparisons will be based on a time-to-event endpoint using the Cox proportional hazards model, we created 1,000 data

December 3, 2013 Page 20
sets under each condition, and analyzed them using the Cox regression model to estimate the power under a variety of assumptions about the enrollment rates, event rates and effect sizes (Table 2).
Table 2. Summary of the Power Simulations for the Primary Endpoint
Control Event Rate*
Biomarker-guided Event Rate*
Relative Event Rate Reduction
Enrollment Rate (per month)
Estimated
Number of Primary Endpoint
Events
Minimum follow-up (months)
Total Study Duration
(month)**
40% 32% 20% 35 89.4 566 12 52 35 67.1 579 12 52 35 84.6 506 12 52 35 57.7 518 12 52 35 93.8 623 12 52 35 76.3 637 12 52
40% 32% 20% 35 91.2 605 24 64 35 69.6 618 24 64 35 86.8 542 24 64 35 58.9 555 24 64 35 95.8 662 24 64 35 77.2 677 24 64 26.25 89.7 573 12 62 26.25 67.3 586 12 62 26.25 85.1 513 12 62 26.25 57.8 525 12 62 26.25 94.0 630 12 62 26.25 76.2 644 12 62
*1-year event rate. **Duration from study award date to last patient in the last study visit—the assumed yearly rate of loss to follow-
- .
8.2 Projected Enrollment rate We anticipate starting enrollment within 6 months from the study award date to finalize the protocol, complete DSMB review and approvals, and activate the sites. Given the complexities of site contracts, IRB approvals and regulatory requirements, we conservatively expect to activate 5 sites each month for enrollment. The recent NHLBI-funded HF-ACTION study enrolled a similar patient population, but required those patients to complete exercise training, which limited recruitment. The average enrollment for HF-ACTION in the U.S. was 0.84 patients per site per month. The 2-site STARBRITE study of biomarker-guided therapy enrolled 137 patients over a 28-month period for an average rate of 2.4 patients per site per month32. In the single-center PROTECT study of biomarker-guided therapy, a total of 151 patients were enrolled over a 2-year period for an average rate of 6.3 patients per site per month.49 For ASCEND HF, the U.S. enrollment rate varied between 1.5-2 patients per site per month. GUIDE-IT’s enrollment will resemble a combination of these trials—patients will be identified at the time of acute HF, and, much like an outpatient HF study, they will be randomized soon after discharge. We believe that once a site is activated, an enrollment rate of 1 patient per site per month is achievable. Once all sites are activated, the target enrollment for GUIDE-IT will be 35 patients per month.
8.3 Projected Event Rates
patient population, we have assumed a 1-year event rate with control arm, which we believe is a conservative estimate. Unlike EVEREST, GUIDE-IT will require elevated natriuretic peptide levels during the

December 3, 2013 Page 21
index hospitalization, a powerful marker of increased risk, suggesting GUIDE-IT will have a higher event rate than EVEREST. Power simulations were conduwere created using randomly generated exponential variables. The non-CV death and the loss-to-follow-up rates were generated as independent exponential random variables with 1- ach variable. In the simulations, the primary outcome variable was censored if the non-CV death or loss-to-follow-up occurred first. The non-CV death rate was based on unpublished data from EVEREST. Drop-in and drop-out rates were assumed to be distributed 2-year follow-up. At the time of drop-in or drop-out, the hazard rate was switched to the rate for the other treatment group.
8.4 Anticipated Effect Size We planned the sample size to detect a relative reduction in the 1-year event rate of 0.20. The power simulations shown below also examine the power with . Simulations with relative
Results are based on 1,000 simulated data sets in each scenario with a 2-sided Type I error rate of 0.05 (Table 2). The estimated power is based on the proportion of simulations using the Cox regression model Wald chi-square p-value < 0.05. It is expected that the final subject enrollment will be followed for 12 months resulting in follow-up times varying from 12 to 24 months. However, to illustrate the power increase of additional follow-up, we have examined scenarios with 24 months follow-up on all patients. Based on our best estimates 1-year
biomarker-guided with the proposed sample size of 1,100 subjects. With the same event and enrollment rates, we would
is lower than we project at 1 patient per site per month and is closer to 0.75 patients per site per month, Table 1 shows that we can still achieve our target number of primary outcome events by extending the study duration by 10 months. Alternatively, we will have the option of adding more sites in order to maintain total study enrollment at 35 patients per month. Although GUIDE-IT has been powered for the primary endpoint of time-to-CV death or HF hospitalization, a key secondary endpoint is the time to all-cause mortality. The power for this endpoint was evaluated with simulations as described above. With an assumed 1-year all-
-analysis of biomarker-guided therapy.
8.5 Power Calculations for Age Group by Treatment Interaction Two prior studies (TIME-CHF and BATTLESCARRED) stratified randomization by age (> or < 75) and pre-specified sub-group analysis based on age.31,33 Although these subgroups were small, the beneficial effects of biomarker guidance in both studies appeared to be primarily in patients < 75. Given that HF is primarily a disease of the elderly, whether there is a differential treatment effect based on age is of substantial clinical relevance and will be examined in GUIDE-IT. To determine the power to detect possible interactions by age, we have simulated data as described above. Additional parameters were added to define the proportion of the population above 75 years of age, and to define event rates that differ by age group. A binary variable was created to identify those patients in the biomarker-guided group and those 75 or more years of age. The results of the simulations are shown in Table 3. With a sample size of 1,100
expected, the 1- 1-year event

December 3, 2013 Page 22
ct a statistically significant interaction at the 2-sided 0.05 level. In summary, our calculations suggest that a cohort of 1,100 patients will provide robust statistical power for detecting clinically relevant and realistic benefits of NT-proBNP-guided therapy for the primary and
follow-up or death due to non- -in and drop-out.
Table 3. Power Simulations for the Interaction between Treatment and Age Groups Proportion of the
population greater than 75 years old
Treatment difference in the younger cohort
(control vs. biomarker-guided – 1 year rates)
Treatment difference in the older cohort
(control vs. biomarker-guided – 1 year rates)
Estimated power to detect
20% 40% vs. 30% 40% vs. 50% 99.8 25% 40% vs. 30% 40% vs. 50% 99.9
33.3% 40% vs. 30% 40% vs. 50% 99.9 80.7 88.9 92.6
66.2 25% 40% vs. 30% 40% vs. 40% 71.6
80.7 49.1 54.4 61.6
8.6 Sample Size Justification for Secondary Endpoints In Figure 5, a set of power curves is presented to describe the power to detect treatment effects for secondary endpoints. These power calculations are based on the following assumptions: 2-sided Type I error rate of 0.05, a test statistic based on a 2-sample t-test, and sample sizes ranging from 350 to 550 subjects per treatment group. Mixed models will be used in the analysis of the longitudinal QOL data. However, calculations based on the 2-sample t-test provide a conservative approximation for the power to detect treatment differences. Assuming at least 350 subjects per treatment group, GUIDE-IT will have
instruments being proposed for this sreasonable benchmark for a clinically meaningful change. Figure 5. Power curves for secondary endpoints

December 3, 2013 Page 23
00.10.20.30.40.50.60.70.80.9
1
0.05 0.1 0.15 0.2 0.25 0.3
Effect Size (sd)
Pow
er
n=350 n=400 n=450 n=500 n=550
8.7 Statistical Analysis: General Approach Statistical analysis will be performed by the GUIDE-IT data coordinating center (DCC) at Duke Clinical Research Institute (DCRI). All major treatment comparisons between the randomized groups in this trial will be performed according to the principle of "intention-to-treat;" that is, subjects will be analyzed (and endpoints attributed) according to the treatment strategy to which patients are randomized, regardless of subsequent additional post-randomization treatment and medical care. Statistical comparisons will be performed using 2-sided significance tests. Additional perspective regarding the interpretation of the data will be provided through extensive use of confidence intervals and graphical displays. Baseline demographic and clinical variables will be summarized for each randomized arm of the study, for example: relevant descriptors from the history, physical and laboratory examination; CV risk factors; co-morbidity descriptors; and course of the patient’s symptoms. Descriptive summaries of the distribution of continuous baseline variables will be presented in terms of percentiles (e.g., median, 25th and 75th percentiles), while discrete variables will be summarized in terms of frequencies and percentages. Because randomization is expected to produce excellent balance at baseline between the two arms of the trial, statistical comparisons of treatment groups with respect to baseline characteristics will be more informal. For comparisons of continuous baseline variables, emphasis will be given to nonparametric procedures such as the Wilcoxon rank sum test. Group comparisons with respect to discrete baseline variables will use the conventional chi-square test or Fisher’s Exact Test as appropriate.
8.8 Analysis for the Primary Hypothesis The statistical comparison of the two randomized arms with respect to the primary endpoint will be a time-to-event analysis, and therefore will be based on the time from randomization to the first occurrence of CV death or HF hospitalization. The Cox proportional hazards regression model will be the primary tool to aconfidence interval for summarizing the difference in outcomes between the two treatment arms will be computed using the Cox model. This comparison will constitute the primary statistical assessment of the effect of biomarker guidance versus usual care on overall clinical outcomes. The Cox model will include an indicator variable for treatment group and baseline adjustment variables for age, sex, NT-proBNP, diabetes mellitus and ejection fraction. In order to select the best set of adjustment covariates, we reviewed prognostic models from other large datasets in chronic HF. We selected covariates based upon the importance of choosing variables with

December 3, 2013 Page 24
minimal missing data and adjusted the primary analysis for the following baseline variables: age, sex, NT-proBNP, ejection fraction, and diabetes mellitus.
8.9 Supportive Analyses of the Primary Endpoint If the data provide evidence of an overall difference in outcome between randomized arms, we will examine whether the effect is similar for all patients, or whether it varies according to specific patient characteristics. In particular, we will focus on whether the relative benefit differs according to patient age, sex, race, co-morbidity, and selected risk factors. These analyses will use the Cox model by testing for interactions between the randomized groups and specific baseline variables. In addition to the statistical hypothesis testing, Kaplan-Meier survival estimates will be constructed based on the time from randomization to the first occurrence of CV death or HF hospitalization.
8.10 Analysis of Secondary Endpoints The analyses for the time-to-event secondary endpoints will be similar to those outlined for the primary endpoint using the time from randomization through the first occurrence of any component of a specific secondary endpoint (or censoring) as the response variable, and assessing group differences using the Cox proportional hazards model. The effect of the NT-proBNP-guided treatment strategy on these time-to-event secondary endpoints will be summarized using hazard ratios (with associated confidence intervals) computed from the Cox model. Kaplan-Meier curves will be constructed to display the cumulative event rates of the two treatment groups. For analysis of the total days alive and out of the hospital endpoint, we will apply the inverse probability weighted estimators of Bang and Tsiatis to account for the potential bias due to censored and incomplete data.50
8.11 Multiple Comparisons and Composite Endpoints With the primary hypothesis and the various secondary endpoints, there is a multiplicity of analyses to be performed and an increased probability that at least one of the comparisons could be "significant" by chance. There are adjustments (e.g., based on the Bonferroni inequality) that can be used to preserve the overall type I error level by adjusting for the multiplicity of secondary endpoints by requiring small significance levels for every comparison. We will be conservative in the interpretation of these analyses, taking into account the degree of significance, and looking for consistency across endpoints. Also, we have pre-specified the primary and secondary outcome variables to help avoid over-interpretation and to reduce the problems inherent with multiple testing. A related issue is the interpretation of composite endpoints in clinical trials. To understand the importance of the components of the primary endpoint, we will estimate the treatment effect and frequency of each component (CV mortality and HF hospitalization) separately. Based on the prior biomarker-guided studies in HF, we have pre-years of age) as a key subgroup of interest. The examination of this subgroup will include a formal test of
intervals will be used to examine the consistency of the treatment effect across subgroups.
8.12 Exploratory Endpoints In order to explore the contribution of recurrent hospitalization and quality of life to the overall efficacy and safety of biomarker guided therapy, alternative methodologies for assessing multiple endpoints will be analyzed. These will include the global rank approach as previous described51. Generally, a pre-specified hierarchy of endpoints will be created that will include death, hospitalization, and quality of life. All patients will be ranked according to this hierarchy, and the primary statistical comparison will be the

December 3, 2013 Page 25
comparison of ranks between the treatment and control group. An alternative approach to be explored will be the “win ratio” as described by Pocock et al52. In this approach, patients randomized to biomarker guided therapy and control will be matched based on baseline characteristics, and the overall post randomization experience between each pair will be compared using a pre-specified hierarchy of endpoints in order to determine a “winner”. The primary metric will be the proportion of pairs with the biomarker guided arm wins relative to control.
8.13 Analysis of Economic and Quality of Life Data For each of the QOL measures examined in this study, data analysis will proceed in several stages. Initially, we will provide simple descriptive and comparative analyses by intention-to-treat. A nonparametric
-values. Since there is currently no consensus in the statistical literature about the best way to deal with the multiple comparisons problem arising from testing each individual scale at each time point separately, we propose two complementary approaches. First, we will pre-specify the overall summary score from the KCCQ and functional status using the Duke Activity Status Index as the primary QOL comparisons of interest and assign all other comparisons to a secondary (descriptive) status. Second, we will fit mixed models, which make use of all available QOL data at each study assessment point. Statistical power estimates for the KCCQ, based on data collected in the HF-ACTION trial demonstrate that we should have >
standard deviation difference (about 5 points on a 0-100 scale) in the KCCQ overall score and in the DASI (about 4 points on a 0-58 scale). We expect refusal rates to be quite low overall. In a 2966- ree interviews. The rate of patient incapacity expected for GUIDE-IT is uncertain, but should be similarly low. Several important methodologic challenges must be considered in the analysis of QOL data: the effect of differential mortality in the treatment arms and the effect of missing data (from death, incapacity or loss to follow-up). Our approach to missing data is to minimize it as much as possible. If the primary study hypotheses are confirmed, analysis of QOL data may be complicated by the fact that the biomarker-guided strategy was more successful at keeping patients alive. Even a relatively small difference in mortality due to treatment may create a paradox in the QOL data such that the more effective therapy is associated with worse QOL (for example, if the patients with the worst QOL died in the usual care arm but were saved in the biomarker-guided arm.) We will address this problem by estimating the Survivor Average Causal Effects, which involves a counterfactual analysis to predict the QOL scores of interest assuming that the patient had not died or been otherwise unable to provide their own data. For the economic analyses, the primary statistical comparisons between the two treatment arms will be performed by intention-to-treat. A nonparametric bootstrap will be used to estimate treatment
-values. Estimates and confidence limits around the observed cost differences can be created using several different approaches. In recent work, we have used bootstrap methods for this. Although our data analysis will not make parametric assumptions about the distributions of costs, we can approximate the precision of our estimates by assuming that costs follow a log-normal distribution. Previous studies suggest that this is a reasonable assumption. For data that are log normally distributed, the coefficient of variation (i.e., the standard deviation divided by the mean) remains constant, an observation that we have seen empirically across different studies and treatment arms. In fact, our experience has shown that the coefficient of variation is very close to 1 (i.e., the standard deviation is equal to the mean). Under the assumption of log normal distributions and CV=1, with > 500 patients (>
e will be able to estimate the difference in mean costs between
December 3, 2013 Page 26
treatments to within approximately 0.12 standard deviations based on the half-width (1.96 times the r treatment
estimate for the difference +/- $1,208. In order to provide a second (descriptive) perspective on cost differences for each strategy in GUIDE-IT, we will also directly measure major health care resource items used including hospital days (e.g., intensive care, step-down units, wards) and cardiac procedures (e.g., ICD, VAD placement, catheterization, coronary revascularization, atrial fibrillation ablation) as well as selected smaller ticket items such as outpatient physician and emergency department visits. A basic set of resource data will be collected on the eCRF, and will be supplemented by the additional resource data that can be collected from the detailed hospital billing forms. To estimate the incremental cost effectiveness of the biomarker-guided approach relative to usual care, we will calculate a base case cost-effectiveness ratio that defines the incremental cost required to add an extra life year with the biomarker-guided strategy relative to usual care. A second series of analyses will calculate the corresponding cost-utility ratio, using utility data from the EQ-5D collected in the GUIDE-IT trial. These analyses will use the societal perspective and a lifetime time horizon so that the estimated incremental cost-effectiveness and cost-utility ratios can be compared with societal benchmarks. Where extrapolations from empirical data and other assumptions are required, they will be based, to the extent possible, on the empirical data from the GUIDE-IT trial and will be accompanied by appropriate examination of the effects of uncertainty using both stochastic methods and sensitivity analyses. For descriptive purposes, we will also calculate within-trial cost-effectiveness and cost-utility ratios, since they do not require any extrapolations. However, these within-trial ratios are limited due to their failure to account fully for long-term benefits and costs, and the absence of comparative benchmarks. At the time of analysis, costs will be adjusted to the most recent year for which the Producer Price Index has been
(with rates from ned in sensitivity analyses). Since many of the patients will remain alive at the conclusion of the trial, a method is required for converting observed trial experience into the corresponding lifetime survival and cost figures needed for use in the incremental cost-effectiveness calculations. There are three general methods that we have previously used to make the necessary lifetime extrapolations called for in cost-effectiveness analysis: use of the trial data for extrapolation, use of secondary data sources to base the extrapolations upon, and use of Markov models. GUIDE-IT will provide a rich empirical data set involving up to 2 years of clinical outcome, cost, and utility data, with over 2,000 patient-years of follow-up information. We will use these data in age-based survival models to create estimates for each GUIDE-IT patient of life expectancy, quality-adjusted life expectancy and lifetime medical costs. The method, in brief, involves 5 basic steps. 1) Using Cox Proportional Hazards regression methodology for left-truncated and right-censored data, we model the hazard of death as a function of age, adjusting for additional prognostic factors through covariates. This model "adjusts for" age as the metric over which the hazard is computed, treats additional prognostic factors as covariates, and stratifies on treatment group (if necessary to satisfy the proportional hazards assumption). By estimating the hazard over the age metric (rather than over the time metric, as is traditionally done), we can produce data-based survival predictions through a much longer time period due to the broad representation of ages in our database. 2) This hazard relationship, which under proportional hazards is well estimated through the age range represented in our data, is used for prediction on a patient-by-patient basis. The predicted survival estimates for each patient

December 3, 2013 Page 27
are then combined with the empirical GUIDE-IT survival data and averaged over all the patients for both treatment groups. 3) Again using a Cox Proportional Hazards regression model, together with the post-HF hospitalization survival experience available in the GUIDE-IT data (and if necessary, secondary data sources available at the DCRI including HF-ACTION), we will estimate the long-term survival impact of a HF hospitalization, the non-fatal component of the study primary endpoint. This model will provide a quantitative measure of the increased relative risk attributable to these non-fatal events for later incorporation in the individual patient predictions. 4) For the oldest age range, where the amount of empirical data may not be sufficient, we will use a Gompertz-based function for extrapolation. The estimated mean survival curves are integrated over a lifetime to obtain life expectancy for each treatment group. 5) The difference between the areas under each survival curve is computed to obtain the biomarker-guided arm incremental life expectancy. Uncertainty in cost-effectiveness estimates related to sampling variation will be quantified using non-parametric bootstrap techniques (1,000 samples with replacement with a cost-effectiveness ratio calculated for each sample) and expressed in three complementary formats. First, cost-effectiveness ratios arising from the bootstrap will be displayed on the cost-effectiveness plane to characterize the precision and magnitude of the estimates. Second, we will examine the net monetary benefit of the intervention, defined as the difference between the increase in effectiveness (valued using the willingness- to-pay threshold per unit of effectiveness), and the increase in cost. Net monetary benefit and associated confidence intervals will be displayed for a range of willingness-to-pay thresholds. Finally, we will plot the cost-effectiveness acceptability curve, which indicates the probability that that the intervention is cost effective (i.e., incremental net benefit > 0) for a range of willingness-to-pay thresholds. We will also perform sensitivity analyses to address uncertainty related to methodological assumptions regarding key parameters. If appropriate, bootstrap analyses will be repeated for alternative parameter values. It must be emphasized that although the general plan of our cost-effectiveness analyses can be specified prospectively, there is clearly an iterative quality to building successful cost-effectiveness models.
8.14 Data Safety Monitoring Board and Interim Analyses For ethical reasons, an interim examination of key safety and endpoint data will be performed at regular intervals during the course of the trial. The primary objectives of these analyses will be to evaluate the accumulated data for high frequency of negative clinical outcomes in either of the two randomized arms. In addition, the interim monitoring will also involve a review of the control arm event rates, patient recruitment, compliance with the study protocol, status of data collection, and other factors that reflect the overall progress and integrity of the study. The results of the interim analyses and status reports will be carefully and confidentially reviewed by an NHLBI-appointed DSMB. It is anticipated that the DSMB will meet every 6-months to review the accumulating data. Prior to each meeting, the DCC will conduct any requested statistical analyses and prepare a summary report along with the following information: patient enrollment reports, rates of compliance with the assigned testing strategy, frequency of protocol violations, and description of SAEs (statistical comparisons of the randomized arms with respect to these SAEs will use chi-square or other appropriate 2-sample methods). The extracted data files and analysis programs for each DSMB report will be archived and maintained at the DCC for the life of the study. For futility monitoring, we will apply the inefficacy monitoring rule of Freidlin, Korn, and Gray53 to stop the trial if the biomarker-guided strategy is not beneficial. We propose to use the conservative boundary LIB0
ill include 7 interim looks

December 3, 2013 Page 28
events are expected and the first interim review for futility and efficacy would be scheduled to occur after approximately 140 primary endpoint events have been observed. If the data suggested a benefit for the usual care arm with a p-value of <0.05, the Freidlin, Korn, and Gray approach would suggest stopping the
. The second interim review would be scheduled after approximately 226 primary endpoint events have been observed. , the LIB0 conservative boundary would suggest stopping the trial for inefficacy if the biomarker-guided arm had a hazard ratio > 1.0 compared to usual-care arm. The Freidlin, Korn, and Gray approach will result in a trivial loss of power and requires no sample size adjustment. The DSMB will weigh any trade-offs between short-term versus long-term results. We propose to use the method of Haybittle and Peto as a guide in interpreting interim efficacy analyses.54,55 This procedure requirevery assessment until the planned final analysis. Because of the conservatism throughout the trial, the critical value at the final analysis is conducted at the "nominal" critical value. The DSMB will weigh any trade-offs between short-term versus long-term results. The DSMB will play a valuable role in advising the study leadership on the relevance of advances in the diagnosis and treatment of patients with systolic HF. The DSMB would be asked to offer proper perspective on any therapeutic or diagnostic testing advances that may occur during the course of the trial. If protocol modifications are warranted, close consultation among the DSMB, the NHLBI staff and the study leadership will be required. A separate DSMB charter will outline the operating guidelines for the committee, and the protocol for evaluation of data—the charter will be created prior to patient randomization and agreed upon during the initial meeting of the DSMB. Minutes of all DSMB meetings will be prepared and distributed to committee members.
9. DATA MANAGEMENT PROCEDURES
9.1 Electronic Data Capture (EDC) System To ensure an efficient and timely data capture system, a rapid transmission and integration of this information into the trial processes and study database, and the elimination of paper documents, the web-based electronic data capture system, known as InForm will be used.
9.2 Electronic Case Report Form (eCRF) The eCRF for GUIDE-IT will have several forms including enrollment and demographics, relevant history, HF symptoms, physical exam results, laboratory results, baseline biomarker levels, and other baseline presenting characteristics; follow-up worksheets for use during regular follow-up visits and to track the patient’s clinical course over time; and event worksheets for recording the circumstances and details surrounding the occurrence of a death or hospitalization. Economics and Quality of Life (EQOL) data will be collected as summarized above and detailed in the Manual of Operations. A dictionary, glossary of terms and instructions for completing the forms will be provided to the sites.
9.3 Data Management Process We will use InForm software (described above) for data entry, screen handling and simple reports. We will use an Oracle database server on an existing UNIX-based network server for this operational database management. Data will be entered into the InForm eCRF by clinical site personnel. Any out-of-range values and missing key variables will be flagged and addressed, or answered at the site during the data entry process, allowing many queries to be resolved in real-time. Queries can also be generated from manual review of the data forms. These will be entered into the database and tracked in the same manner as the computer-generated queries.

December 3, 2013 Page 29
We will compare distributions of selected variables across sites to ensure that consistent definitions are used. Examples of these variables include the following: frequency of missing critical variables, biological or medical history parameters, fields that define study procedure compliance and safety irregularities. In our surveillance, we will use statistical process control to ensure that issues not likely to be the result of normal random variation are investigated. The DCRI will create reports to identify trends in the data that may require additional clarification and training. These reports will be available to the sites and to the study leadership, as we work with the sites to correct negative trends and eliminate future data errors. The DCRI will perform internal database quality-control checks and data audits during the trial and at the conclusion to track the frequency of random errors and to identify any systematic deviation requiring correction. Patients whose data are audited will be randomly selected from the total enrollment. Data management operations are also reviewed internally for their compliance with standard procedures, rules and guidelines for processing, quality control and productivity.
9.4 Data Quality Control Data quality control goes beyond the data management process. All groups at the DCRI will work in tandem to ensure that the data collected in this study are as complete and correct as possible. A 4-step, multi-functional approach to data quality control will be implemented and is summarized below:
1. Training: Prior to the start of enrollment, the physician investigators and study coordinators at each site will be trained with the clinical protocol and data collection procedures, including how to use the InForm system and complete the eCRF data. Initial investigator and coordinator training will occur with an InForm trainer and hands-on database interaction. This trainer will present slides, demonstrate key InForm functionality and guide attendees through practice exercises. Follow-up training and training for new study personnel will be conducted by DCRI personnel who will present slides, demonstrate the system and guide attendees through practice exercises using on-line web-based teleconferences.
2. Monitoring: The clinical and data coordinating center will ensure that data collection is being handled properly, will provide in-service training, and address questions from site investigators and coordinators. Data quality and completeness will be reviewed by the DCRI team on a regular and ongoing basis, and any issues noted will be addressed with the site. Monitoring visits will be completed as described in the Clinical Monitoring Plan.
3. Managing data: After the data have been transferred to SAS for statistical summarization, data description, and data analysis, further cross-checking of the data will be performed with discrepant observations being flagged and appropriately resolved through a data query system.
4. Reviewing data: Deaths and hospitalization events will be reviewed by the CEC to ensure an appropriate standardized classification of the component events comprising the primary composite endpoint. The DCC will provide the CEC with detailed information for classification and adjudication of these events. The CEC will be blinded to the randomized treatment strategy assignment to ensure unbiased evaluation of outcome events.
10. STUDY GOVERNANCE AND COMMITTEES The governance and management of the GUIDE-IT study will be organized as follows.
10.1 Clinical Coordinating Center (CCC) The CCC will be at the DCRI. The CCC functions as a clinical trial center and is responsible for all aspects of conducting this trial, including: clinical operations; oversight of all committees and working groups; development of the protocol and all amendments; site identification, recruitment, education, and

December 3, 2013 Page 30
retention; oversight of core laboratories; quality control; site reimbursement; monitoring of study progress; maintenance of a 24-hour helpline for questions from clinical sites; and leadership in data analysis, presentations, and publications. Clinical Operations is the critical functional component of the CCC, and will provide project management; development and preparation of study materials; site management; education of all site-based personnel on the rationale, design, and execution of GUIDE-IT; oversight of the study helpline; and assistance with preparation of manuscripts and publications. The CCC will be the primary day-to-day contact for sites. CCC staff will develop and implement educational and training plans, communication initiatives including phone and email contact, conference calls, newsletters, website, and will use social networking technology. The CCC staff will collaborate with the sites to ensure their understanding of the protocol, the operationalization of the protocol, and the successful identification of eligible patients for screening and enrollment. From working on many other multicenter randomized controlled studies, these project team members bring substantial operational experience. The CCC expects that our efforts to significantly vet sites for interest and capabilities, to extensively educate sites, and to carefully and clearly state the expectations for sites will minimize problems with sites performance. An important asset to the site management component of the CCC will be the use of the DCRI’s Clinical Trials Management System, a web-based application that provides the DCRI project teams with direct access to trial data, and can be used to manage various aspects of the study, including: protocols, accounts, contracts, sites, site monitoring, and subject management. Using this centralized system will ensure an integrated approach to handling trial information, and will help the CCC and the DCC work together seamlessly.
10.2 Data Coordinating Center (DCC) The DCC will be at the DCRI. The DCC will support the GUIDE-IT trial in study design, study start-up, and project implementation. This includes developing the eCRF and instructions; establishing data management methods; creating and maintaining a patient database; resolving queries; collecting and reporting SAEs; analyzing the data; and assisting with trial design, protocol development, presentations and manuscripts.
10.3 Economics and Quality of Life Core The EQOL core will be at the DCRI. Integration of the EQOL core into overall trial operations will be facilitated by the fact that the CCC, DCC, and EQOL are all located at DCRI. The CCC, DCC, and EQOL core will coordinate site management and data management activities as they relate to the collection of EQOL data.
10.4 Biomarkers Core Lab and Biorepository The core lab and biorepository will be located at the NC Research Campus at Kannapolis, a joint enterprise between the research universities of NC to provide core lab services. Instructions for collection, processing, labeling, and shipping of biological specimens will be provided in a manual of operations.
10.5 Executive Committee The Executive Committee is the primary decision making body of the study and is responsible for its successful completion. The Executive Committee will meet weekly by teleconference. They will review and have input on the trial protocol, manual of operations, monitoring plan, electronic case report form (eCRF), site materials, data management plan and statistical plan. On issues requiring a vote, 1 vote per member will be allowed. This Committee will meet in person at least twice a year, typically at the annual scientific sessions of the American Heart Association and American College of Cardiology. All members of the

December 3, 2013 Page 31
Executive Committee will be expected to make ongoing substantive intellectual and operational contributions to the study.
10.6 Steering Committee The Steering Committee will address enrollment issues, education and training to promote compliance with the study protocol. Membership will include the EC, committee chairs, core lab directors, and other selected site PIs, selected study coordinators, and other members as required. The Steering Committee will meet in person and/or via teleconference throughout the conduct of the trial.
10.7 Clinical Event Classification Committee The Clinical Events Classification Committee (CEC) is an independent committee providing independent and blinded adjudication of determined primary outcome events. Members of the CEC will not be participating in the GUIDE-IT study in any way, and will be blinded as to treatment assignment. Endpoint definitions will be formulated prior to the initiation of the study, and will be approved by the EC. A charter will be developed to guide CEC activities.
10.8 Adherence Committee This committee will serve to promote and monitor investigator adherence to the study protocol, particularly with regard to responsiveness to natriuretic peptide levels in the biomarker-guided arm. They will review data on adherence to the protocol and results of interventions by the CCC on a monthly basis. When necessary, the committee will intervene with individual investigators or the investigators as a whole. Given the importance of adherence to testing the hypothesis of GUIDE-IT (as outlined in the Research Plan), the Adherence Committee will play an active and engaged role in the ongoing operations of the study.
10.9 Biomarkers and Genetics Committee The Biomarkers and Genetics Committee will establish and operationalize policies and procedures for analysis of biorepository samples by GUIDE-IT investigators.
10.10 Publications and Presentations Committee The Publications and Presentations Committee will review publication proposals and manuscripts, and will assist in dissemination of trial results.
10.11 Data and Safety Monitoring Board (DSMB) The DSMB is an independent committee that oversees the safety of research subjects. It is anticipated that the DSMB will meet every 6-months to review the accumulating data. Prior to each meeting, the DCC will conduct any requested statistical analyses and prepare a summary report along with the following information: patient enrollment reports, rates of compliance with the assigned testing strategy, frequency of protocol violations, and description of SAEs (statistical comparisons of the randomized arms with respect to these SAEs will use chi-square or other appropriate 2-sample methods). The extracted data files and analysis programs for each DSMB report will be archived and maintained at the DCC for the life of the study.

December 3, 2013 Page 32
11. REGULATORY ISSUES
11.1 Ethics and Good Clinical Practice This study must be carried out in compliance with the protocol and in accordance with DCRI standard operating procedures. These procedures are designed to ensure adherence to Good Clinical Practice, as described in the following documents:
1. ICH Harmonized Tripartite Guidelines for Good Clinical Practice 1996.
2. US 21 Code of Federal Regulations dealing with clinical studies (including parts 50 and 56 concerning informed consent and IRB regulations).
3. Declaration of Helsinki, concerning medical research in humans (Recommendations Guiding Physicians in Biomedical Research Involving Human Subjects, Helsinki 1964, amended Tokyo 1975, Venice 1983, Hong Kong 1989, Somerset West 1996).
The investigator agrees, when signing the protocol, to adhere to the instructions and procedures described in it and thereby to adhere to the principles of Good Clinical Practice that it conforms to.
11.2 Institutional Review Board/Independent Ethics Committee Before implementing this study, the protocol, the proposed informed consent form and other information to subjects, must be reviewed by a properly constituted Institutional Review Board/Independent Ethics Committee (IRB/IEC). A signed and dated statement that the protocol and informed consent have been approved by the IRB/IEC must be given to the Coordinating Center before study initiation. The name and occupation of the chairman and the members of the IRB/IEC must be supplied to the Coordinating Center if this information is released by IRB/IEC. Any amendments to the protocol, other than administrative ones, must be approved by this committee.
11.3 Informed Consent The investigator or designee must explain to each subject (or legally authorized representative) the nature of the study, its purpose, the procedures involved, the expected duration, the potential risks and benefits involved and any discomfort it may entail. Each subject must be informed that participation in the study is voluntary and that he/she may withdraw from the study at any time and that withdrawal of consent will not affect his/her subsequent medical treatment or relationship with the treating physician. This informed consent should be given by means of a standard written statement, written in non-technical language. The subject should read and consider the statement before signing and dating it, and should be given a copy of the signed document. If written consent is not possible, oral consent can be obtained if witnessed by a signed statement from one or more persons not involved in the study, mentioning why the patient was unable to sign the form. No patient can enter the study before his/her informed consent has been obtained. The informed consent forms are part of the protocol, and must be submitted by the investigator with it for IRB/IEC approval. The Coordinating Center will supply proposed informed consent forms, which comply with regulatory requirements, and are considered appropriate for the study. Any changes to the proposed consent form suggested by the Investigator must be agreed to by the Coordinating Center before submission to the IRB/IEC, and a copy of the approved version must be provided to the Coordinating Center after IRB/IEC approval.
12. Remote Monitoring

December 3, 2013 Page 33
The study will be monitored remotely by representatives of the DCRI or its designee according to the prospective clinical monitoring plan (CMP) for the following purposes:
Real-time monitoring of compliance with study protocol inclusion/exclusion criteria is enabled via triggers and range checks programmed in the InForm database.
Assist site personnel who will verify data identified within query reports against source documents through frequent telephone and email contact.
Verify that written informed consent was obtained before initiation of any screening procedures that are performed solely for the purpose of determining eligibility for the clinical study and/or prior to the patient’s randomization to a procedure.

December 3, 2013 Page 34
13. REFERENCES
1. Lloyd-Jones D, Adams R, Carnethon M, et al. Heart Disease and Stroke Statistics--2009
Update: A Report From the American Heart Association Statistics Committee and Stroke Statistics
Subcommittee. Circulation 2009;119:e21-181.
2. Lloyd-Jones DM, Larson MG, Leip EP, et al. Lifetime risk for developing congestive heart
failure: the Framingham Heart Study. Circulation 2002;106:3068-72.
3. Lindenfeld J, Albert NM, Boehmer J, et al. Executive Summary: HFSA 2010
Comprehensive Heart Failure Practice Guideline. Journal of Cardiac Failure 2010;16:475-539.
4. Jessup M, Abraham WT, Casey DE, et al. 2009 focused update: ACCF/AHA Guidelines
for the Diagnosis and Management of Heart Failure in Adults: a report of the American College of
Cardiology Foundation/American Heart Association Task Force on Practice Guidelines:
developed in collaboration with the International Society for Heart and Lung Transplantation.
Circulation 2009;119:1977-2016.
5. Lee DS, Mamdani MM, Austin PC, et al. Trends in heart failure outcomes and
pharmacotherapy: 1992 to 2000. Am J Med 2004;116:581-9.
6. Johnson D, Jin Y, Quan H, Cujec B. Beta-blockers and angiotensin-converting enzyme
inhibitors/receptor blockers prescriptions after hospital discharge for heart failure are associated
with decreased mortality in Alberta, Canada. J Am Coll Cardiol 2003;42:1438-45.
7. Smith NL, Psaty BM, Pitt B, Garg R, Gottdiener JS, Heckbert SR. Temporal patterns in the
medical treatment of congestive heart failure with angiotensin-converting enzyme inhibitors in
older adults, 1989 through 1995. Arch Intern Med 1998;158:1074-80.
December 3, 2013 Page 35
8. Stafford RS, Radley DC. The underutilization of cardiac medications of proven benefit,
1990 to 2002. J Am Coll Cardiol 2003;41:56-61.
9. Whellan DJ, Hasselblad V, Peterson E, O'Connor CM, Schulman KA. Metaanalysis and
review of heart failure disease management randomized controlled clinical trials. American Heart
Journal 2005;149:722-9.
10. Cleland JG, Louis AA, Rigby AS, Janssens U, Balk AH. Noninvasive home telemonitoring
for patients with heart failure at high risk of recurrent admission and death: the Trans-European
Network-Home-Care Management System (TEN-HMS) study. J Am Coll Cardiol 2005;45:1654-
64.
11. Bourge RC, Abraham WT, Adamson PB, et al. Randomized Controlled Trial of an
Implantable Continuous Hemodynamic Monitor in Patients With Advanced Heart Failure: The
COMPASS-HF Study. J Am Coll Cardiol 2008;51:1073-9.
12. Felker GM, Petersen JW, Mark DB. Natriuretic peptides in the diagnosis and management
of heart failure. CMAJ 2006;175:611-7.
13. deFilippi CR, Christenson RH, Gottdiener JS, Kop WJ, Seliger SL. Dynamic
Cardiovascular Risk Assessment in Elderly People: The Role of Repeated N-Terminal Pro-B-Type
Natriuretic Peptide Testing. J Am Coll Cardiol 2010;55:441-50.
14. Morrow DA, de Lemos JA, Blazing MA, et al. Prognostic Value of Serial B-Type Natriuretic
Peptide Testing During Follow-up of Patients With Unstable Coronary Artery Disease. Jama
2005;294:2866-71.
15. Wang TJ, Larson MG, Levy D, et al. Plasma Natriuretic Peptide Levels and the Risk of
Cardiovascular Events and Death. N Engl J Med 2004;350:655-63.
December 3, 2013 Page 36
16. Kragelund C, Gronning B, Kober L, Hildebrandt P, Steffensen R. N-Terminal Pro-B-Type
Natriuretic Peptide and Long-Term Mortality in Stable Coronary Heart Disease. N Engl J Med
2005;352:666-75.
17. Januzzi JL, Jr., Sakhuja R, O'Donoghue M, et al. Utility of amino-terminal pro-brain
natriuretic peptide testing for prediction of 1-year mortality in patients with dyspnea treated in the
emergency department. Arch Intern Med 2006;166:315-20.
18. Fonarow GC, Peacock WF, Phillips CO, Givertz MM, Lopatin M. Admission B-Type
Natriuretic Peptide Levels and In-Hospital Mortality in Acute Decompensated Heart Failure. J Am
Coll Cardiol 2007;49:1943-50.
19. Cleland JG, McMurray JJ, Kjekshus J, et al. Plasma concentration of amino-terminal pro-
brain natriuretic peptide in chronic heart failure: prediction of cardiovascular events and interaction
with the effects of rosuvastatin: a report from CORONA (Controlled Rosuvastatin Multinational
Trial in Heart Failure). J Am Coll Cardiol 2009;54:1850-9.
20. Anand IS, Fisher LD, Chiang YT, et al. Changes in Brain Natriuretic Peptide and
Norepinephrine Over Time and Mortality and Morbidity in the Valsartan Heart Failure Trial (Val-
HeFT). Circulation 2003;107:1278-83.
21. McKelvie RS, Yusuf S, Pericak D, et al. Comparison of Candesartan, Enalapril, and Their
Combination in Congestive Heart Failure : Randomized Evaluation of Strategies for Left
Ventricular Dysfunction (RESOLVD) Pilot Study: The RESOLVD Pilot Study Investigators.
Circulation 1999;100:1056-64.
22. Latini R, Masson S, Anand I, et al. Effects of valsartan on circulating brain natriuretic
peptide and norepinephrine in symptomatic chronic heart failure: the Valsartan Heart Failure Trial
(Val-HeFT). Circulation 2002;106:2454-8.
December 3, 2013 Page 37
23. Frantz RP, Olson LJ, Grill D, et al. Carvedilol therapy is associated with a sustained
decline in brain natriuretic peptide levels in patients with congestive heart failure. Am Heart J
2005;149:541-7.
24. Tsutamoto T, Wada A, Maeda K, et al. Effect of spironolactone on plasma brain natriuretic
peptide and left ventricular remodeling in patients with congestive heart failure. J Am Coll Cardiol
2001;37:1228-33.
25. Fruhwald FM, Fahrleitner-Pammer A, Berger R, et al. Early and sustained effects of
cardiac resynchronization therapy on N-terminal pro-B-type natriuretic peptide in patients with
moderate to severe heart failure and cardiac dyssynchrony. Eur Heart J 2007;28:1592-7.
26. Logeart D, Thabut G, Jourdain P, et al. Predischarge B-type natriuretic peptide assay for
identifying patients at high risk of re-admission after decompensated heart failure. J Am Coll
Cardiol 2004;43:635-41.
27. Bettencourt P, Azevedo A, Pimenta J, Frioes F, Ferreira S, Ferreira A. N-Terminal-Pro-
Brain Natriuretic Peptide Predicts Outcome After Hospital Discharge in Heart Failure Patients.
Circulation 2004;110:2168-74.
28. Metra M, Nodari S, Parrinello G, et al. The role of plasma biomarkers in acute heart failure.
Serial changes and independent prognostic value of NT-proBNP and cardiac troponin-T. Eur J
Heart Fail 2007;9:776-86.
29. Masson S, Latini R, Anand IS, et al. Prognostic Value of Changes in N-Terminal Pro-Brain
Natriuretic Peptide in Val-HeFT (Valsartan Heart Failure Trial). J Am Coll Cardiol 2008;52:997-
1003.

December 3, 2013 Page 38
30. Latini R, Masson S, Wong M, et al. Incremental Prognostic Value of Changes in B-Type
Natriuretic Peptide in Heart Failure. The American Journal of Medicine 2006;119:70-.
31. Eurlings LWM, van Pol PEJ, Kok WE, et al. Management of Chronic Heart Failure Guided
by Individual N-Terminal Pro-B-Type Natriuretic Peptide Targets: Results of the PRIMA (Can
PRo-brain-natriuretic peptide guided therapy of chronic heart failure IMprove heart fAilure
morbidity and mortality?) Study. Journal of the American College of Cardiology 2010;56:2090-100.
32. Shah MR, Califf RM, Nohria A, et al. The STARBRITE trial: a randomized, pilot study of B-
type natriuretic peptide-guided therapy in patients with advanced heart failure. J Card Fail
2011;17:613-21.
33. Jourdain P, Jondeau G, Funck F, et al. Plasma Brain Natriuretic Peptide-Guided Therapy
to Improve Outcome in Heart Failure: The STARS-BNP Multicenter Study. J Am Coll Cardiol
2007;49:1733-9.
34. Troughton RW, Frampton CW, Yandle TG, Espiner EA, Nicholls MG, Richards AM.
Treatment of heart failure guided by plasma aminoterminal brain natriuretic peptide (N-BNP)
concentrations. Lancet 2000;355:1126-30.
35. Lainchbury JG, Troughton RW, Strangman KM, et al. N-Terminal Pro-B-Type Natriuretic
Peptide-Guided Treatment for Chronic Heart Failure: Results From the BATTLESCARRED (NT-
proBNP-Assisted Treatment To Lessen Serial Cardiac Readmissions and Death) Trial. J Am Coll
Cardiol 2009;55:53-60.
36. Pfisterer M, Buser P, Rickli H, et al. BNP-guided vs symptom-guided heart failure therapy:
the Trial of Intensified vs Standard Medical Therapy in Elderly Patients With Congestive Heart
Failure (TIME-CHF) randomized trial. Jama 2009;301:383-92.

December 3, 2013 Page 39
37. Januzzi JL, Jr., Rehman SU, Mohammed AA, et al. Use of amino-terminal pro-B-type
natriuretic peptide to guide outpatient therapy of patients with chronic left ventricular systolic
dysfunction. Journal of the American College of Cardiology 2011;58:1881-9.
38. Berger R, Moertl D, Peter S, et al. N-Terminal Pro-B-Type Natriuretic Peptide-Guided,
Intensive Patient Management in Addition to Multidisciplinary Care in Chronic Heart Failure: A 3-
Arm, Prospective, Randomized Pilot Study. J Am Coll Cardiol 2010;55:645-53.
39. Pina IL, O'Connor C. BNP-guided therapy for heart failure. Jama 2009;301:432-4.
40. Felker GM, Hasselblad V, Hernandez AF, O'Connor CM. Biomarker-guided therapy in
chronic heart failure: a meta-analysis of randomized controlled trials. Am Heart J 2009;158:422-
30.
41. Porapakkham P, Zimmet H, Billah B, Krum H. B-type natriuretic peptide-guided heart
failure therapy: A meta-analysis. Arch Intern Med 2010;170:507-14.
42. Effect of metoprolol CR/XL in chronic heart failure: Metoprolol CR/XL Randomised
Intervention Trial in Congestive Heart Failure (MERIT-HF). Lancet 1999;353:2001-7.
43. Packer M, Bristow MR, Cohn JN, et al. The Effect of Carvedilol on Morbidity and Mortality
in Patients with Chronic Heart Failure. N Engl J Med 1996;334:1349-55.
44. The SI. Effect of enalapril on survival in patients with reduced left ventricular ejection
fractions and congestive heart failure. N Engl J Med 1991;325:293-302.
45. Pitt B, Zannad F, Remme WJ, et al. The effect of spironolactone on morbidity and mortality
in patients with severe heart failure. Randomized Aldactone Evaluation Study Investigators. N
Engl J Med 1999;341:709-17.
December 3, 2013 Page 40
46. Bardy GH, Lee KL, Mark DB, et al. Amiodarone or an Implantable Cardioverter-
Defibrillator for Congestive Heart Failure. N Engl J Med 2005;352:225-37.
47. Araujo JP, Azevedo A, Lourenco P, Rocha-Goncalves F, Ferreira A, Bettencourt P.
Intraindividual variation of amino-terminal pro-B-type natriuretic peptide levels in patients with
stable heart failure. Am J Cardiol 2006;98:1248-50.
48. Konstam MA, Gheorghiade M, Burnett JC, Jr., et al. Effects of Oral Tolvaptan in Patients
Hospitalized for Worsening Heart Failure: The EVEREST Outcome Trial. JAMA 2007;297:1319-
31.
49. Cleland JG, Coletta AP, Clark AL, Cullington D. Clinical trials update from the American
College of Cardiology 2009: ADMIRE-HF, PRIMA, STICH, REVERSE, IRIS, partial ventricular
support, FIX-HF-5, vagal stimulation, REVIVAL-3, pre-RELAX-AHF, ACTIVE-A, HF-ACTION,
JUPITER, AURORA, and OMEGA. Eur J Heart Fail 2009;11:622-30.
50. Bang H, Tsiatis A. Estimating medical costs with censored data. Biometrika 2000;87:329-
43.
51. Felker GM, Maisel AS. A global rank end point for clinical trials in acute heart failure. Circ
Heart Fail 2010;3:643-6.
52. Pocock SJ, Ariti CA, Collier TJ, Wang D. The win ratio: a new approach to the analysis of
composite endpoints in clinical trials based on clinical priorities. Eur Heart J 2012;33:176-82.
53. Freidlin B, Korn EL, Gray R. A general inefficacy interim monitoring rule for randomized
clinical trials. Clin Trials 2010;7:197-208.
54. Haybittle JL. Repeated assessment of results in clinical trials of cancer treatment. Br J
Radiol 1971;44:793-7.

December 3, 2013 Page 41
55. Peto R, Pike MC, Armitage P, et al. Design and analysis of randomized clinical trials
requiring prolonged observation of each patient. I. Introduction and design. Br J Cancer
1976;34:585-612.

42
14. APPENDICES
14.1 Appendix A. Schedule of Study Assessments
Screening Day 0(Randomization)
2 wks(+ 1 week)
6 wks(+ 1 week)
3 mos(+ 1 week)
6 mos(+ 1 week)
9 mos(+ 1 week)
12 mos*(+ 1 week)
Informed Consent XHistory and physical X X X X X X X XCV Medication History X X X X X X X XDocument rationale for changes in therapy X X X X X X
6 minute walk XQOL** X X X XMedical resource use and cost assessment X X X X X X X
Local lab NT-proBNP (standard of care group)
X X
Local lab NT-proBNP (guided only) X X X X X X X X
Cr, BUN, electrolytes(local lab) X X X X X X X X
Core lab plasma sample X X X X X X X
Core lab serum sample X X X X X X X
Core lab DNA sample(once only) X
Safety assessments X X X X X X*Patients will be followed for a minimum of 12 months up to a maximum of 24 months** QOL will be administered yearly after the 12 month visit. QOL interviewing windows per QOL MOO.

Statistical Analysis Plan
GUIDing Evidence Based Therapy Using Biomarker Intensified
Treatment in Heart Failure (GUIDE-IT)
Version Date: September 19, 2014
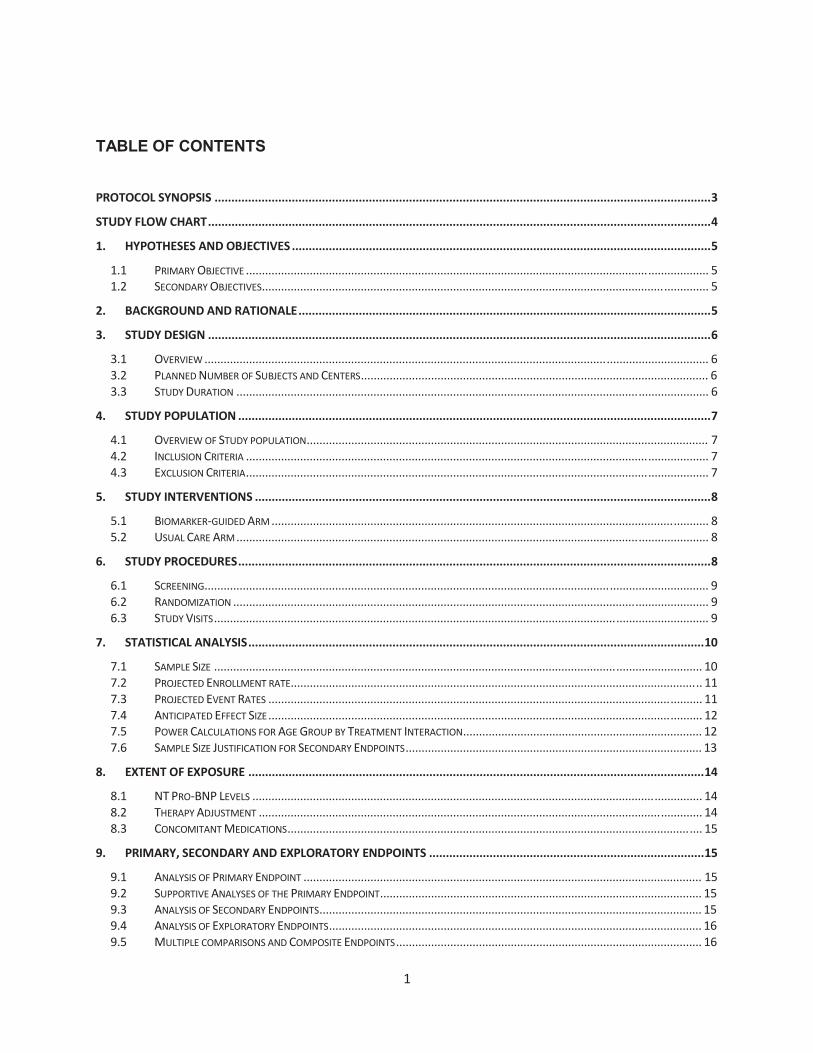
1
TABLE OF CONTENTS
PROTOCOL SYNOPSIS .................................................................................................................................................... 3
STUDY FLOW CHART ...................................................................................................................................................... 4
1. HYPOTHESES AND OBJECTIVES ............................................................................................................................. 5
1.1 PRIMARY OBJECTIVE ................................................................................................................................................. 5 1.2 SECONDARY OBJECTIVES ............................................................................................................................................ 5
2. BACKGROUND AND RATIONALE ........................................................................................................................... 5
3. STUDY DESIGN ...................................................................................................................................................... 6
3.1 OVERVIEW .............................................................................................................................................................. 6 3.2 PLANNED NUMBER OF SUBJECTS AND CENTERS ............................................................................................................. 6 3.3 STUDY DURATION .................................................................................................................................................... 6
4. STUDY POPULATION ............................................................................................................................................. 7
4.1 OVERVIEW OF STUDY POPULATION .............................................................................................................................. 7 4.2 INCLUSION CRITERIA ................................................................................................................................................. 7 4.3 EXCLUSION CRITERIA ................................................................................................................................................. 7
5. STUDY INTERVENTIONS ........................................................................................................................................ 8
5.1 BIOMARKER-GUIDED ARM ......................................................................................................................................... 8 5.2 USUAL CARE ARM .................................................................................................................................................... 8
6. STUDY PROCEDURES ............................................................................................................................................. 8
6.1 SCREENING.............................................................................................................................................................. 9 6.2 RANDOMIZATION ..................................................................................................................................................... 9 6.3 STUDY VISITS ........................................................................................................................................................... 9
7. STATISTICAL ANALYSIS ........................................................................................................................................ 10
7.1 SAMPLE SIZE ......................................................................................................................................................... 10 7.2 PROJECTED ENROLLMENT RATE................................................................................................................................. 11 7.3 PROJECTED EVENT RATES ........................................................................................................................................ 11 7.4 ANTICIPATED EFFECT SIZE ........................................................................................................................................ 12 7.5 POWER CALCULATIONS FOR AGE GROUP BY TREATMENT INTERACTION ........................................................................... 12 7.6 SAMPLE SIZE JUSTIFICATION FOR SECONDARY ENDPOINTS ............................................................................................. 13
8. EXTENT OF EXPOSURE ........................................................................................................................................ 14
8.1 NT PRO-BNP LEVELS ............................................................................................................................................. 14 8.2 THERAPY ADJUSTMENT ........................................................................................................................................... 14 8.3 CONCOMITANT MEDICATIONS .................................................................................................................................. 15
9. PRIMARY, SECONDARY AND EXPLORATORY ENDPOINTS .................................................................................. 15
9.1 ANALYSIS OF PRIMARY ENDPOINT ............................................................................................................................. 15 9.2 SUPPORTIVE ANALYSES OF THE PRIMARY ENDPOINT ..................................................................................................... 15 9.3 ANALYSIS OF SECONDARY ENDPOINTS ........................................................................................................................ 15 9.4 ANALYSIS OF EXPLORATORY ENDPOINTS ..................................................................................................................... 16 9.5 MULTIPLE COMPARISONS AND COMPOSITE ENDPOINTS ................................................................................................ 16

2
9.6 ANALYSIS OF ECONOMIC AND QUALITY OF LIFE DATA ................................................................................................... 16
10. SAFETY ................................................................................................................................................................ 19
10.1 ADVERSE EVENTS ................................................................................................................................................... 19 10.2 LABORATORY DATA ................................................................................................................................................ 19 10.3 VITAL SIGNS AND PHYSICAL EXAM ............................................................................................................................. 19
11. DSMB AND INTERIM ANALYSES .......................................................................................................................... 20
12. LOCATION OF DATABASE .................................................................................................................................... 21
13. REFERENCES ........................................................................................................................................................ 22
APPENDIX A. SCHEDULE OF STUDY ASSESSMENTS ..................................................................................................... 27
APPENDIX B. TABLE SHELLS ......................................................................................................................................... 28 FIGURE 1. FLOWCHART OF PATIENT ACCOUNTABILITY ................................................................................................................ 28 TABLE 1. BASELINE CHARATERISTICS AND MEDICAL HISTORY BY TREATMENT ................................................................................. 29 TABLE 2. DEATH, HF HOSPITALIZATION, ALL-CAUSE MORTALITY AND MORBIDITY ......................................................................... 37 FIGURE 2. KM CURVE FOR TIME TO CARDIOVASCULAR DEATH OR FIRST HF HOSPITALIZATION BY TREATMENT .................................... 39 FIGURE 3. KM CURVE FOR TIME TO ALL-CAUSE MORTALITY BY TREATMENT .................................................................................. 40 FIGURE 4. KM CURVE FOR TIME TO CV DEATH BY TREATMENT .................................................................................................... 40 FIGURE 5. KM CURVE FOR TIME TO FIRST HF HOSPITALIZATION BY TREATMENT ............................................................................. 40 TABLE 3. SUPPORTIVE ANALYSES OF PRIMARY ENDPOINT........................................................................................................... 41 FIGURE 6. SUPPORTIVE ANALYSES OF PRIMARY ENDPOINT – FOREST PLOT OF TREATMENT AND DEMOGRAPHIC CHARACTERISTICS ......... 44 TABLE 4A. ADVERSE EVENTS DURING THERAPY .......................................................................................................................... 45 TABLE 4B. SERIOUS ADVERSE EVENTS DURING THERAPY ............................................................................................................. 46 TABLE 5. LABS .................................................................................................................................................................... 47 TABLE6. MEDICATION USE ................................................................................................................................................... 48 TABLE7. ADJUSTMENT OF CONCOMITANT MEDICATION OR THERAPY – ALL PATIENTS ................................................................... 49 TABLE 7A. ADJUSTMENT OF CONCOMITANT MEDICATION OR THERAPY – TREATMENT A .................................................................. 51 TABLE 7B. ADJUSTMENT OF CONCOMITANT MEDICATION OR THERAPY – TREATMENT B .................................................................. 53 TABLE 8A. NT-PROBNP LEVEL ................................................................................................................................................ 55 TABLE 8B. PERCENT OF SUBJECTS WITH NT-PROBNP LEVEL < 1000 PG/ML BY TREATMENT AND VISIT .............................................. 56 TABLE 9. CHANGE OF NT-PROBNP LEVEL RELATIVE TO BASELINE ............................................................................................... 57 TABLE 10. MIXED MODEL ESTIMATES – NT-PROBNP LEVEL ........................................................................................................ 58 FIGURE 7. MEAN ABSOLUTE VALUES OVER TIME ....................................................................................................................... 59 FIGURE 8. MEAN ABSOLUTE CHANGE OVER TIME ...................................................................................................................... 59 FIGURE 9. MEAN % CHANGE OVER TIME ................................................................................................................................. 59 FIGURE 10. MEAN PREDICTED NT-PROBNP LEVEL OVER TIME ...................................................................................................... 59 FIGURE 11. CORRELATION BETWEEN LOCAL NT-PROBNP LEVEL AND CORE LAB NT-PROBNP............................................................ 61

3
PROTOCOL SYNOPSIS
Title: GUIDing Evidence Based Therapy Using Biomarker Intensified Treatment (GUIDE-IT)
Indication: Heart Failure
Location: Approximately 40 clinical centers in North America
Rationale: Current guidelines recommend that medical therapy be titrated toward the target doses used in clinical trials, but “therapeutic inertia” often represents a barrier to aggressive titration of medical therapy. There is a pressing need to develop strategies to improve utilization of proven therapies for HF in order to improve clinical outcomes and control costs. Observational studies have shown an association between decreasing natriuretic peptide levels over time and improved outcomes in patients with HF.
Objectives: To compare a strategy of medical therapy titration aimed at achieving and maintaining an NT-proBNP target of < 1000 pg/mL (biomarker-guided therapy) to usual care in high risk patients with systolic heart failure.
Study Design: Prospective, randomized, parallel controlled groups, unblinded, 2-arm, multicenter clinical trial of approximately 1100 patients.
Primary Endpoint: Time to cardiovascular death or first HF hospitalization
Secondary Endpoints:
Time to all-cause mortality Recurrent hospitalizations Days alive and not hospitalized for CV reasons Time to cardiovascular death Time to first HF hospitalization Health-related quality of life (HRQOL) Resource utilization, cost and cost effectiveness Safety

4
STUDY FLOW CHART
High risk systolic heart failure patients, with EF < 40%, a heart failure event within prior 12 months, and NT-proBNP > 2000 pg/mL or BNP > 400 pg/mL during the 30 days prior to randomization
SCREENING
Randomized to either Usual Care (N=550) or Biomarker Guided NT-proBNP < 1000 pg/mL (N=550)
Baseline visit (day 0) History and physical exam, CV medication history, serum creatinine, BUN and electrolytes and NT-
proBNP (local lab), HRQOL questionnaires, medical resource use and cost assessment, 6MWT, biomarker and DNA sample collection
RANDOMIZATIONN
2-week follow-up (+ 1 week) History and physical exam, CV medication history, change in HF therapy rationale, serum
creatinine, BUN and electrolytes (local lab), NT-proBNP (local lab biomarker guided arm only), HRQOL questionnaires, medical resource, cost assessment and biomarker samples
6-week follow-up (+ 1 week) History and physical exam, CV medication history, change in HF therapy rationale, serum
creatinine, BUN and electrolytes (local lab), NT-proBNP (local lab biomarker guided arm only), HRQOL questionnaires, medical resource, cost assessment and biomarker samples
3-month follow-up (months 3, 6, 9, 12,15, 18, 21, and 24)(+ 1 week) History and physical exam, CV medication history, change in HF therapy rationale, serum
creatinine, BUN and electrolytes (local lab), NT-proBNP (local lab biomarker guided arm only), HRQOL questionnaires, medical resource, cost assessment and biomarker samples
FOLLOW-UP
Notes:
Minimum 12 months of follow-up. Study visits occur every 3 months until a maximum of 24 months. Mandatory 2-week (+/- 1 week) follow-up after adjustment of therapy or hospitalization. Follow-up visits include brief clinical assessment, serum creatinine, BUN and electrolytes
(local lab), and NT-proBNP (local lab biomarker guided arm only). Follow-up visits continue every 2 weeks until therapeutic targets are reached, or until
further titration of therapy is not possible.

5
1. HYPOTHESES AND OBJECTIVES
1.1 Primary Objective The primary objective of this study is to determine the efficacy of a strategy of biomarker-guided therapy compared with usual care on the composite endpoint of time to cardiovascular death or first heart failure (HF) hospitalization in high risk patients with left ventricular systolic dysfunction. 1.2 Secondary Objectives The secondary objectives of this study are to evaluate the effects of biomarker-guided therapy on: • All-cause mortality • Total days alive and not hospitalized for cardiovascular reasons (cumulative morbidity) • Time to cardiovascular death • Time to first HF hospitalization • HRQOL • Resource use, cost and cost effectiveness • Safety 2. BACKGROUND AND RATIONALE Heart failure (HF) is a major and growing public health problem in the United States (U.S.), affecting over 5 million Americans, causing over 1 million hospitalizations, and accounting for over 30 billion dollars in total costs annum1. Among U.S. adults age 40, 1 in 5 will develop HF in their lifetime.2 Current practice guidelines for pharmacologic management dictate that neuro-hormonal antagonists such as beta-blockers and ACE-inhibitors be titrated toward the target doses studied in large clinical trials.3,4 Despite these recommendations, available data suggest that most patients in clinical practice are either not treated with these agents or are treated with substantially lower than recommended doses.5-8
“Therapeutic inertia” often represents a barrier to aggressive titration of medical therapy for both providers and patients. A variety of disease management strategies have been evaluated to improve the chronic management of HF patients, ranging from nursing-based interventions to technologically complex interventions using implantable hemodynamic monitors and telemedicine. The majority of these interventions have focused on the monitoring of symptoms and body weight and/or on patient education. Overall, the results from disease management strategies have been mixed,9 and many are personnel intensive, complex10 or costly to implement.11 Thus, there is an unmet need for a simple, effective and easy-to-implement strategy to improve the management of patients with chronic HF such that patient outcomes are demonstrably improved. The natriuretic peptides are a family of important counter-regulatory hormones with vasodilatory, lusitropic, anti-fibrotic, and natriuretic effects.12 The natriuretic peptides b-type natriuretic peptide (BNP) and amino-terminal pro-b-type natriuretic peptide (NT-proBNP) are released from the myocardium in response to hemodynamic stress and provide important diagnostic and prognostic information in HF patients. Multiple studies have linked higher levels of natriuretic peptides to worse clinical outcomes in patients with HF as well as other cardiovascular disorders and in healthy persons.13-

6
16 Both BNP and NT-proBNP have been shown to be very powerful predictors of future risk in both acute 17,18 and chronic HF.19,20
Observational studies have shown an association between decreasing natriuretic peptide levels over time and improved outcomes in both inpatients and outpatients with HF.20,26-29. These observational data have led to the hypothesis that serial measurements of natriuretic peptides may serve as a guide to the titration of chronic medical therapy— “biomarker-guided therapy”. Both BNP and NT-proBNP are widely clinically available and both markers have been used in previous trials of biomarker-guided therapy. We have selected NT-proBNP as the biomarker to be used for guiding therapy in the intervention arm of the GUIDE-IT study. The half-life of NT-proBNP is substantially longer than that of BNP (6 hours vs. 20 minutes), suggesting it is preferable for long-term therapeutic monitoring over time. For this reason, more prior studies have used NT-proBNP rather than BNP. NT-proBNP performed better in predicting long-term morbidity and mortality in a head-to-head comparison in Val-HeFT. Finally, the data supporting the validity of a specific natriuretic peptide target are stronger for NT-proBNP than for BNP. 3. STUDY DESIGN 3.1 Overview This study will be a multicenter, prospective, randomized, parallel control group, unblinded, 2-arm multicenter clinical trial comparing biomarker-guided therapy to usual care in patients with systolic HF at high risk for hospitalization or death. 3.2 Planned Number of Subjects and Centers The planned enrollment for the GUIDE-IT study is approximately 1,100 subjects at approximately 35 centers in North America. To maximize generalizability, centers outside of North America may be considered for participation if HF management is sufficiently similar to U.S. practice and appropriate use of guideline-based therapy can be verified. 3.3 Study Duration We anticipate the study duration will be 5 years: 6 months of start-up activities (i.e., finalize protocol, prepare study sites and contracts, receive site Institutional Review Board [IRB] approval), 36 months of active enrollment, 12 months of patient follow-up after the final patient is enrolled, and 6 months of study close-out, data analysis, and reporting of results.

7
4. STUDY POPULATION 4.1 Overview of Study Population The enrolled population will be the analysis population. The study population will be high-risk patients with systolic HF (left ventricular ejection fraction [LVEF] ≤ 40%). High-risk patients will be defined as follows: 4.2 Inclusion Criteria
Age ≥ 18 years Hospitalization for acute decompensated HF, manifest by Dyspnea at rest or on minimal exertion plus At least 1 sign of volume overload: Elevated jugular venous pulse Pulmonary rates Peripheral edema Congestion on chest x-ray For the purposes of qualification for the GUIDE-IT study, treatment in the Emergency
department or observation unit for signs and symptoms of heart failure with intravenous loop diuretics will qualify as a ‘hospitalization equivalent’ provided all other inclusion criteria are met
• Most recent documented LVEF to be ≤ 40% by any method within 12 months of randomization. This assessment must occur at least 12 weeks after any intervention likely to improve ejection fraction (e.g., cardiac resynchronization therapy, initiation of beta-blocker therapy, or revascularization).
• High risk heart failure as defined by the following criteria A Heart Failure Event in the prior 12 months, defined as any one of the
following: HF Hospitalization Treatment in the Emergency Department (or Equivalent) for Heart
Failure Outpatient treatment for heart failure with intravenous diuretics
AND NT-proBNP > 2000 pg/ml or BNP > 400 pg/ml at any time during the 30
days prior to randomization • NT-ProBNP > 2000 pg/mL at least once during index hospitalization • Willing to provide informed consent
4.3 Exclusion Criteria
Acute coronary syndrome (clinical diagnosis Cardiac resynchronization therapy (CRT) within prior 3 months or current plan to implant CRT
device Active myocarditis, Hypertrophic obstructive cardiomyopathy, pericarditis, or restrictive
cardiomyopathy Severe stenotic valvular disease
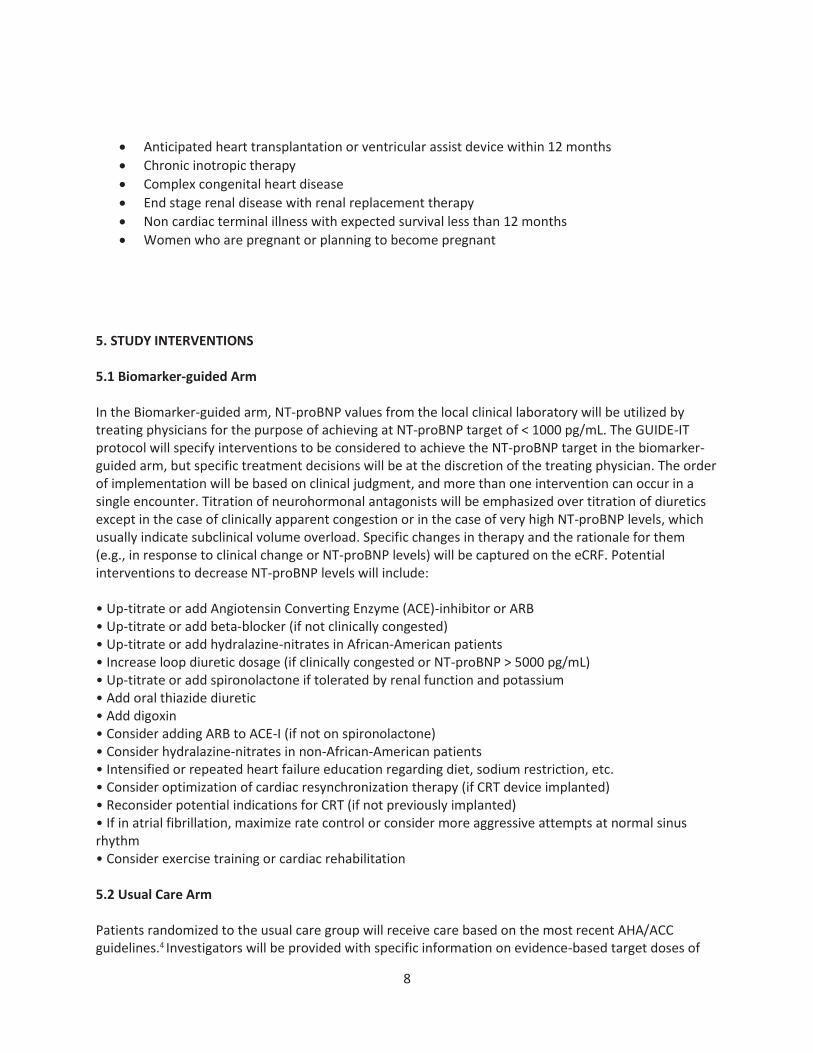
8
Anticipated heart transplantation or ventricular assist device within 12 months Chronic inotropic therapy Complex congenital heart disease End stage renal disease with renal replacement therapy Non cardiac terminal illness with expected survival less than 12 months Women who are pregnant or planning to become pregnant
5. STUDY INTERVENTIONS 5.1 Biomarker-guided Arm In the Biomarker-guided arm, NT-proBNP values from the local clinical laboratory will be utilized by treating physicians for the purpose of achieving at NT-proBNP target of < 1000 pg/mL. The GUIDE-IT protocol will specify interventions to be considered to achieve the NT-proBNP target in the biomarker-guided arm, but specific treatment decisions will be at the discretion of the treating physician. The order of implementation will be based on clinical judgment, and more than one intervention can occur in a single encounter. Titration of neurohormonal antagonists will be emphasized over titration of diuretics except in the case of clinically apparent congestion or in the case of very high NT-proBNP levels, which usually indicate subclinical volume overload. Specific changes in therapy and the rationale for them (e.g., in response to clinical change or NT-proBNP levels) will be captured on the eCRF. Potential interventions to decrease NT-proBNP levels will include: • Up-titrate or add Angiotensin Converting Enzyme (ACE)-inhibitor or ARB • Up-titrate or add beta-blocker (if not clinically congested) • Up-titrate or add hydralazine-nitrates in African-American patients • Increase loop diuretic dosage (if clinically congested or NT-proBNP > 5000 pg/mL) • Up-titrate or add spironolactone if tolerated by renal function and potassium • Add oral thiazide diuretic • Add digoxin • Consider adding ARB to ACE-I (if not on spironolactone) • Consider hydralazine-nitrates in non-African-American patients • Intensified or repeated heart failure education regarding diet, sodium restriction, etc. • Consider optimization of cardiac resynchronization therapy (if CRT device implanted) • Reconsider potential indications for CRT (if not previously implanted) • If in atrial fibrillation, maximize rate control or consider more aggressive attempts at normal sinus rhythm • Consider exercise training or cardiac rehabilitation 5.2 Usual Care Arm Patients randomized to the usual care group will receive care based on the most recent AHA/ACC guidelines.4 Investigators will be provided with specific information on evidence-based target doses of

9
neuro-hormonal antagonists (beta-blockers, ACE-inhibitors). Diuretics will be titrated based on clinical judgment of the treating physician. Routine assessment of natriuretic peptides will not be performed in the usual care group except for compelling medical reasons, consistent with current guidelines.4
6. STUDY PROCEDURES
A complete schedule of assessments throughout the study is given in Appendix A. 6.1 Screening Clinical site staff will screen patients in both the inpatient and outpatient setting to identify high risk patients with systolic heart failure. If identified during a heart failure hospitalization, patients will not be randomized until the time of hospital discharge. A screening log will be maintained at each site. Eligible patients will provide written informed consent prior to randomization. 6.2 Randomization Subjects who fulfill all the inclusion criteria and none of the exclusion criteria will be randomized in a 1:1 fashion using an interactive voice response system (IVRS) to either biomarker-guided therapy or usual care. The unit of randomization will be at the patient level rather than the site level. Treatment allocation will be conducted using a complete randomization scheme. At randomization, subjects will undergo a brief interval history and physical exam, cardiovascular (CV) medication history, local laboratory testing for renal function and electrolytes, assessment for adverse events, 6 minute walk test, HRQOL questionnaires, medical resource use and cost assessment, and core laboratory samples.
6.3 Study Visits
6.3.1 Baseline Baseline assessments will occur at the time of randomization and will include: • Focused physical examination • CV medication history • Serum creatinine, blood urea nitrogen (BUN), and electrolytes (local laboratory) • NT-proBNP (local laboratory) • Health Related QOL questionnaire (as described in 6.7) • 6 minute walk test • Biomarker and DNA collection for biorepository (as described in 6.4)
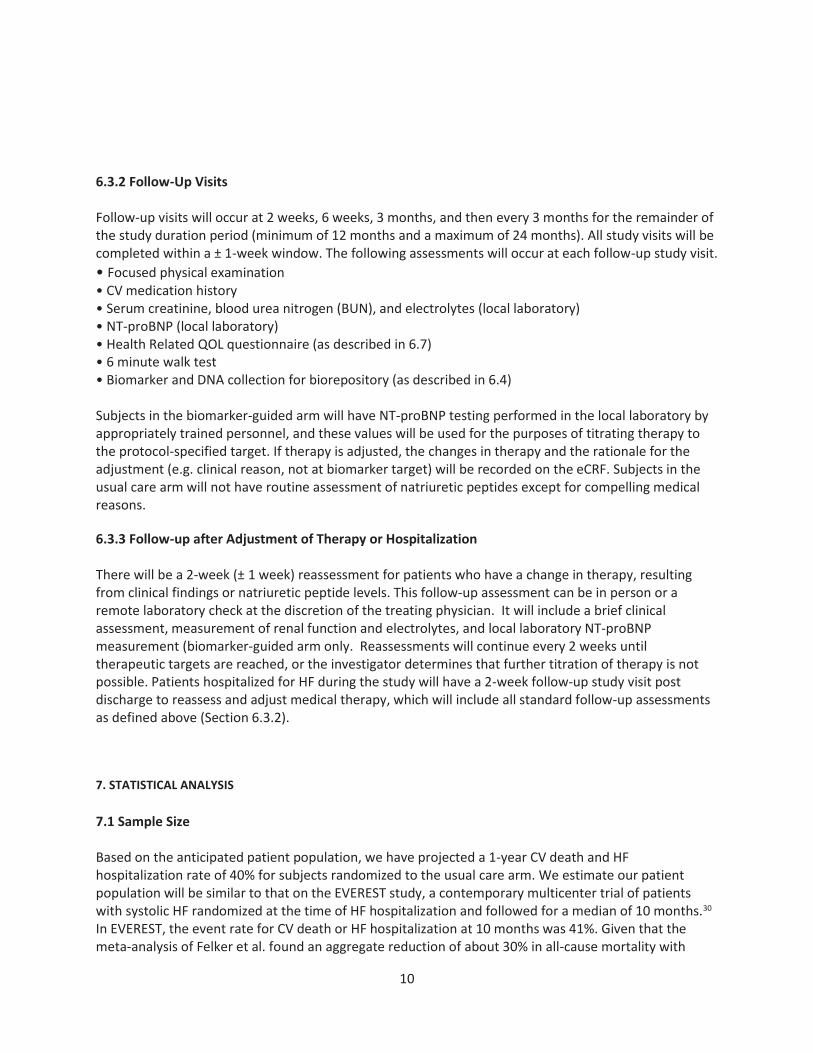
10
6.3.2 Follow-Up Visits Follow-up visits will occur at 2 weeks, 6 weeks, 3 months, and then every 3 months for the remainder of the study duration period (minimum of 12 months and a maximum of 24 months). All study visits will be completed within a ± 1-week window. The following assessments will occur at each follow-up study visit. • Focused physical examination • CV medication history • Serum creatinine, blood urea nitrogen (BUN), and electrolytes (local laboratory) • NT-proBNP (local laboratory) • Health Related QOL questionnaire (as described in 6.7) • 6 minute walk test • Biomarker and DNA collection for biorepository (as described in 6.4) Subjects in the biomarker-guided arm will have NT-proBNP testing performed in the local laboratory by appropriately trained personnel, and these values will be used for the purposes of titrating therapy to the protocol-specified target. If therapy is adjusted, the changes in therapy and the rationale for the adjustment (e.g. clinical reason, not at biomarker target) will be recorded on the eCRF. Subjects in the usual care arm will not have routine assessment of natriuretic peptides except for compelling medical reasons. 6.3.3 Follow-up after Adjustment of Therapy or Hospitalization There will be a 2-week (± 1 week) reassessment for patients who have a change in therapy, resulting from clinical findings or natriuretic peptide levels. This follow-up assessment can be in person or a remote laboratory check at the discretion of the treating physician. It will include a brief clinical assessment, measurement of renal function and electrolytes, and local laboratory NT-proBNP measurement (biomarker-guided arm only. Reassessments will continue every 2 weeks until therapeutic targets are reached, or the investigator determines that further titration of therapy is not possible. Patients hospitalized for HF during the study will have a 2-week follow-up study visit post discharge to reassess and adjust medical therapy, which will include all standard follow-up assessments as defined above (Section 6.3.2). 7. STATISTICAL ANALYSIS 7.1 Sample Size Based on the anticipated patient population, we have projected a 1-year CV death and HF hospitalization rate of 40% for subjects randomized to the usual care arm. We estimate our patient population will be similar to that on the EVEREST study, a contemporary multicenter trial of patients with systolic HF randomized at the time of HF hospitalization and followed for a median of 10 months.30
In EVEREST, the event rate for CV death or HF hospitalization at 10 months was 41%. Given that the meta-analysis of Felker et al. found an aggregate reduction of about 30% in all-cause mortality with

11
biomarker-guided therapy, the impact of biomarker-guided therapy can conservatively be expected to reduce the primary composite endpoint (which we expect to be more sensitive to the effects of the biomarker-guided strategy than all-cause mortality) by 20% (from 40% to 32% at 1 year). Based on the event rates for each arm discussed above, we have determined the sample size required to provide high power for detecting the postulated 20% relative risk reduction. As we recognize that the actual event rates and the outcome differences between the two testing strategies in GUIDE-IT may vary somewhat from these estimates, and we have determined the power of the study under several different combinations of enrollment rates, event rates and effect sizes. We have conducted the power analyses using simulation studies to mimic the key features of GUIDE-IT. As the primary treatment comparisons will be based on a time-to-event endpoint using the Cox proportional hazards model, we created 1,000 data sets under each condition, and analyzed them using the Cox regression model to estimate the power under a variety of assumptions about the enrollment rates, event rates and effect sizes (Table 2).
Table 2. Summary of the Power Simulations for the Primary Endpoint
Control Event Rate*
Biomarker-guided Event Rate*
Relative Event Rate Reduction
Enrollment Rate (per month)
Estimated Power (%)
Number of Primary Endpoint Events
Minimum follow-up (months)
Total Study Duration (month)**
40% 32% 20% 35 89.4 566 12 52 40% 34% 15% 35 67.1 579 12 52 35% 28% 20% 35 84.6 506 12 52 35% 29.75% 15% 35 57.7 518 12 52 45% 36% 20% 35 93.8 623 12 52 45% 38.25% 15% 35 76.3 637 12 52 40% 32% 20% 35 91.2 605 24 64 40% 34% 15% 35 69.6 618 24 64 35% 28% 20% 35 86.8 542 24 64 35% 29.75% 15% 35 58.9 555 24 64 45% 36% 20% 35 95.8 662 24 64 45% 38.25% 15% 35 77.2 677 24 64 40% 32% 20% 26.25 89.7 573 12 62 40% 34% 15% 26.25 67.3 586 12 62 35% 28% 20% 26.25 85.1 513 12 62 35% 29.75% 15% 26.25 57.8 525 12 62 45% 36% 20% 26.25 94.0 630 12 62 45% 38.25% 15% 26.25 76.2 644 12 62
*1-year event rate. **Duration from study award date to last patient in the last study visit—the assumed yearly rate of loss to follow-up was 4% and the yearly non-CV death rate was 4%. 7.2 Projected Enrollment Rate

12
We believe that once a site is activated, an enrollment rate of 1 patient per site per month is achievable. Once all sites are activated, the target enrollment for GUIDE-IT will be 35 patients per month. 7.3 Projected Event Rates In EVEREST, the event rate for CV death or HF hospitalization at 10 months was 41%. Based on a similar patient population, we have assumed a 1-year event rate with a 40% control arm, which we believe is a conservative estimate. Unlike EVEREST, GUIDE-IT will require elevated natriuretic peptide levels during the index hospitalization, a powerful marker of increased risk, suggesting GUIDE-IT will have a higher event rate than EVEREST. Power simulations were conducted varying this rate from 35% to 45%. Event times were created using randomly generated exponential variables. The non-CV death and the loss-to-follow-up rates were generated as independent exponential random variables with 1-year event rates of 4% for each variable. In the simulations, the primary outcome variable was censored if the non-CV death or loss-to-follow-up occurred first. The non-CV death rate was based on unpublished data from EVEREST. Drop-in and drop-out rates were assumed to be distributed uniformly in 5% of subjects over the 2-year follow-up. At the time of drop-in or drop-out, the hazard rate was switched to the rate for the other treatment group. 7.4 Anticipated Effect Size We planned the sample size to detect a relative reduction in the 1-year event rate of 0.20. The power simulations shown below also examine the power with 15% relative reductions. Simulations with relative event rate reductions greater than 25% typically resulted in power greater than 99%. Results are based on 1,000 simulated data sets in each scenario with a 2-sided Type I error rate of 0.05 (Table 2). The estimated power is based on the proportion of simulations using the Cox regression model Wald chi-square p-value < 0.05. It is expected that the final subject enrollment will be followed for 12 months resulting in follow-up times varying from 12 to 24 months. However, to illustrate the power increase of additional follow-up, we have examined scenarios with 24 months follow-up on all patients. Based on our best estimates for event rates and enrollment with a 20% reduction in events from a 1-year rate of 40% in the control group to 32% in the biomarker-guided group, we anticipate having 89.4% power with the proposed sample size of 1,100 subjects. With the same event and enrollment rates, we would have a slight increase in power to 91.2% if every subject was followed for 24 months. If per site enrollment is lower than we project at 1 patient per site per month and is closer to 0.75 patients per site per month, Table 1 shows that we can still achieve our target number of primary outcome events by extending the study duration by 10 months. Alternatively, we will have the option of adding more sites in order to maintain total study enrollment at 35 patients per month. Although GUIDE-IT has been powered for the primary endpoint of time-to-CV death or HF hospitalization, a key secondary endpoint is the time to all-cause mortality. The power for this endpoint was evaluated with simulations as described above. With an assumed 1-year all-cause mortality rate of 25% in the control group, we estimated the power at 86.0% and 96.3% to detect relative event rate reductions of 25% and 30%, respectively, which are consistent with the treatment effect seen in a recent meta-analysis of biomarker-guided therapy.

13
7.5 Power Calculations for Age Group by Treatment Interaction Two prior studies (TIME-CHF and BATTLESCARRED) stratified randomization by age (> or < 75) and pre-specified sub-group analysis based on age.31,33 Although these subgroups were small, the beneficial effects of biomarker guidance in both studies appeared to be primarily in patients < 75. Given that HF is primarily a disease of the elderly, whether there is a differential treatment effect based on age is of substantial clinical relevance and will be examined in GUIDE-IT. To determine the power to detect possible interactions by age, we have simulated data as described above. Additional parameters were added to define the proportion of the population above 75 years of age, and to define event rates that differ by age group. A binary variable was created to identify those patients in the biomarker-guided group and those 75 or more years of age. The results of the simulations are shown in Table 3. With a sample size of 1,100 patients, we have more than 99% power to detect large, qualitative interactions by age group. As expected, the power to detect quantitative interactions is not as great. If we assume 25% of patients are in the older age group, 40% vs. 30% 1-year event rates in the younger group, and 40% vs. 40% 1-year event rates in the older group, we will have 71.6% power to detect a statistically significant interaction at the 2-sided 0.05 level. In summary, our calculations suggest that a cohort of 1,100 patients will provide robust statistical power for detecting clinically relevant and realistic benefits of NT-proBNP-guided therapy for the primary and key secondary endpoints. Furthermore, this sample size estimate accounts for a combined 8% loss to follow-up or death due to non-CV causes and an allowance for 5% drop-in and drop-out. Table 3. Power Simulations for the Interaction between Treatment and Age Groups
Proportion of the population greater than 75 years old
Treatment difference in the younger cohort (control vs. biomarker-guided – 1 year rates)
Treatment difference in the older cohort (control vs. biomarker-guided – 1 year rates)
Estimated power to detect the interaction effect (%)
20% 40% vs. 30% 40% vs. 50% 99.8 25% 40% vs. 30% 40% vs. 50% 99.9 33.3% 40% vs. 30% 40% vs. 50% 99.9 20% 40% vs. 30% 40% vs. 42% 80.7 25% 40% vs. 30% 40% vs. 42% 88.9 33.3% 40% vs. 30% 40% vs. 42% 92.6 20% 40% vs. 30% 40% vs. 40% 66.2 25% 40% vs. 30% 40% vs. 40% 71.6 33.3% 40% vs. 30% 40% vs. 40% 80.7 20% 40% vs. 30% 40% vs. 38% 49.1 25% 40% vs. 30% 40% vs. 38% 54.4 33.3% 40% vs. 30% 40% vs. 38% 61.6
7.6 Sample Size Justification for Secondary Endpoints

14
In Figure 5, a set of power curves is presented to describe the power to detect treatment effects for secondary endpoints. These power calculations are based on the following assumptions: 2-sided Type I error rate of 0.05, a test statistic based on a 2-sample t-test, and sample sizes ranging from 350 to 550 subjects per treatment group. Mixed models will be used in the analysis of the longitudinal QOL data. However, calculations based on the 2-sample t-test provide a conservative approximation for the power to detect treatment differences. Assuming at least 350 subjects per treatment group, GUIDE-IT will have >90% power for detecting a treatment difference of ¼ standard deviation. For many of the QOL instruments being proposed for this study, a treatment effect size equal to ¼ of a standard deviation is a reasonable benchmark for a clinically meaningful change.
Figure 5. Power curves for secondary endpoints
8. EXTENT OF EXPOSURE 8.1 NT Pro-BNP Levels Summary statistics for NT Pro-BNP levels such as sample size, mean, standard deviation, median (25th,75th percentiles), minimum, maximum, will be provided for both baseline, per each post-baseline visit and at the end of the study (or last available lab value). Both the absolute value and % change-from-baseline values will be summarized by visit and last available lab value. Mixed model will be used to further examine the change from baseline. All the above summary statistics will be presented by treatment arms. 8.2 Therapy Adjustment Descriptive statistics will be provided for titration of therapy adjustment, rationale for adjustment and number of adjustment post baseline. Frequencies and percentage will be provided for therapy adjustment and rational of
00.10.20.30.40.50.60.70.80.9
1
0.05 0.1 0.15 0.2 0.25 0.3
Effect Size (sd)
Pow
er
n=350 n=400 n=450 n=500 n=550
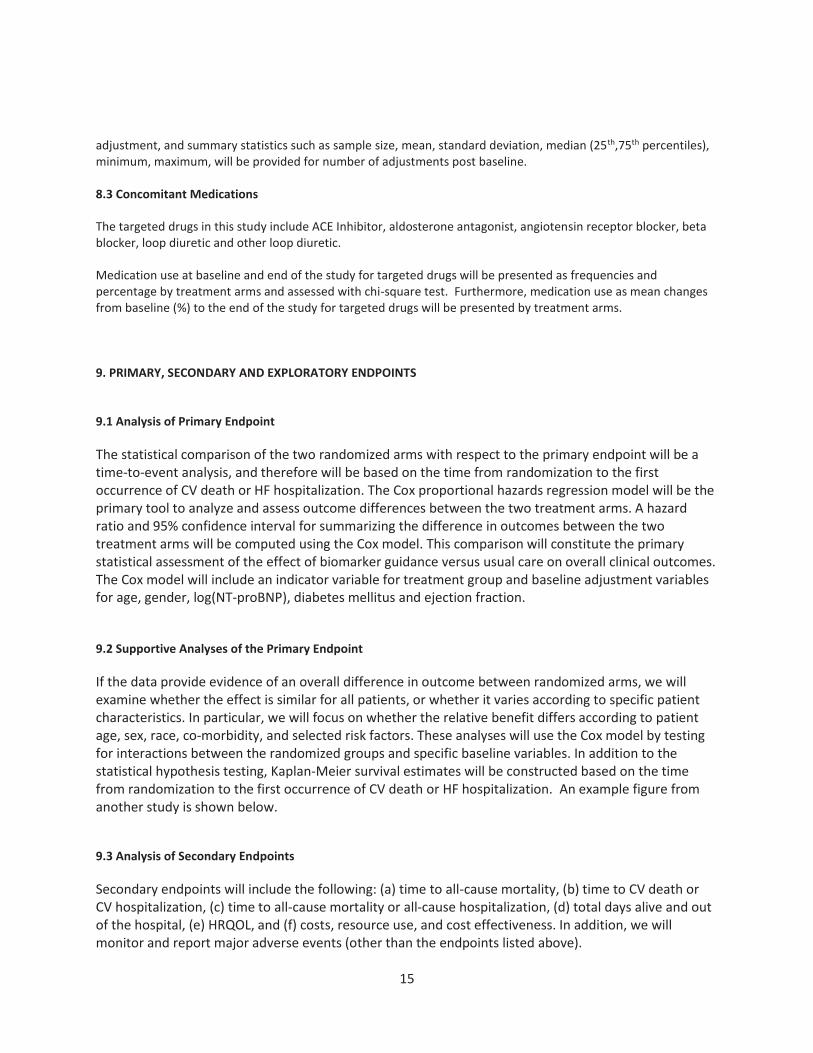
15
adjustment, and summary statistics such as sample size, mean, standard deviation, median (25th,75th percentiles), minimum, maximum, will be provided for number of adjustments post baseline. 8.3 Concomitant Medications The targeted drugs in this study include ACE Inhibitor, aldosterone antagonist, angiotensin receptor blocker, beta blocker, loop diuretic and other loop diuretic. Medication use at baseline and end of the study for targeted drugs will be presented as frequencies and percentage by treatment arms and assessed with chi-square test. Furthermore, medication use as mean changes from baseline (%) to the end of the study for targeted drugs will be presented by treatment arms. 9. PRIMARY, SECONDARY AND EXPLORATORY ENDPOINTS 9.1 Analysis of Primary Endpoint The statistical comparison of the two randomized arms with respect to the primary endpoint will be a time-to-event analysis, and therefore will be based on the time from randomization to the first occurrence of CV death or HF hospitalization. The Cox proportional hazards regression model will be the primary tool to analyze and assess outcome differences between the two treatment arms. A hazard ratio and 95% confidence interval for summarizing the difference in outcomes between the two treatment arms will be computed using the Cox model. This comparison will constitute the primary statistical assessment of the effect of biomarker guidance versus usual care on overall clinical outcomes. The Cox model will include an indicator variable for treatment group and baseline adjustment variables for age, gender, log(NT-proBNP), diabetes mellitus and ejection fraction. 9.2 Supportive Analyses of the Primary Endpoint If the data provide evidence of an overall difference in outcome between randomized arms, we will examine whether the effect is similar for all patients, or whether it varies according to specific patient characteristics. In particular, we will focus on whether the relative benefit differs according to patient age, sex, race, co-morbidity, and selected risk factors. These analyses will use the Cox model by testing for interactions between the randomized groups and specific baseline variables. In addition to the statistical hypothesis testing, Kaplan-Meier survival estimates will be constructed based on the time from randomization to the first occurrence of CV death or HF hospitalization. An example figure from another study is shown below.
9.3 Analysis of Secondary Endpoints Secondary endpoints will include the following: (a) time to all-cause mortality, (b) time to CV death or CV hospitalization, (c) time to all-cause mortality or all-cause hospitalization, (d) total days alive and out of the hospital, (e) HRQOL, and (f) costs, resource use, and cost effectiveness. In addition, we will monitor and report major adverse events (other than the endpoints listed above).
16
The analyses for the time-to-event secondary endpoints will be similar to those outlined for the primary endpoint using the time from randomization through the first occurrence of any component of a specific secondary endpoint (or censoring) as the response variable, and assessing group differences using the Cox proportional hazards model. The effect of the NT-proBNP-guided treatment strategy on these time-to-event secondary endpoints will be summarized using hazard ratios (with associated confidence intervals) computed from the Cox model. Kaplan-Meier curves will be constructed to display the cumulative event rates of the two treatment groups. For analysis of the total days alive and out of the hospital endpoint, we will apply the inverse probability weighted estimators of Bang and Tsiatis to account for the potential bias due to censored and incomplete data.31
9.4 Analysis of Exploratory Endpoints All heart failure hospitalizations including repeat hospitalizations, not just the first, will be analyzed. The Negative Binomial Regression Model for count data will be used to obtain an estimate of the effect of the NT-proBNP-guided treatment strategy on hospitalization. The Negative Binomial Regression Model accommodates the different probabilities for events across all individuals of the population. The distribution assumes that each patient has recurrent hospitalizations based on an individual-specific Poisson event rate and the Poisson rates vary according to a Gamma distribution. 32, 33, 34 9.5 Multiple Comparisons and Composite Endpoints With the primary hypothesis and the various secondary endpoints, there is a multiplicity of analyses to be performed and an increased probability that at least one of the comparisons could be "significant" by chance. There are adjustments (e.g., based on the Bonferroni inequality) that can be used to preserve the overall type I error level by adjusting for the multiplicity of secondary endpoints by requiring small significance levels for every comparison. We will be conservative in the interpretation of these analyses, taking into account the degree of significance, and looking for consistency across endpoints. Also, we have pre-specified the primary and secondary outcome variables to help avoid over-interpretation and to reduce the problems inherent with multiple testing. A related issue is the interpretation of composite endpoints in clinical trials. To understand the importance of the components of the primary endpoint, we will estimate the treatment effect and frequency of each component (CV mortality and HF hospitalization) separately. Based on the prior biomarker-guided studies in HF, we have pre-specified age (≥75 or < 75 years of age) as a key subgroup of interest. The examination of this subgroup will include a formal test of interaction with the Cox regression model. Hazard ratio plots with point estimates and 95% confidence intervals will be used to examine the consistency of the treatment effect across subgroups.
9.6 Analysis of Economic and Quality of Life Data For each of the QOL measures examined in this study, data analysis will proceed in several stages. Initially, we will provide simple descriptive and comparative analyses by intention-to-treat. A

17
nonparametric bootstrap will be used to estimate treatment differences with 95% confidence intervals (CI) and p-values. Since there is currently no consensus in the statistical literature about the best way to deal with the multiple comparisons problem arising from testing each individual scale at each time point separately, we propose two complementary approaches. First, we will pre-specify the overall summary score from the KCCQ and functional status using the Duke Activity Status Index as the primary QOL comparisons of interest and assign all other comparisons to a secondary (descriptive) status. Second, we will fit mixed models, which make use of all available QOL data at each study assessment point. Statistical power estimates for the KCCQ, based on data collected in the HF-ACTION trial demonstrate that we should have > 90% power to detect a ¼ standard deviation difference (about 5 points on a 0-100 scale) in the KCCQ overall score and in the DASI (about 4 points on a 0-58 scale). We expect refusal rates to be quite low overall. In a 2966-patient QOL substudy in GUSTO, we had a 1% refusal rate at each of three interviews. The rate of patient incapacity expected for GUIDE-IT is uncertain, but should be similarly low. Several important methodologic challenges must be considered in the analysis of QOL data: the effect of differential mortality in the treatment arms and the effect of missing data (from death, incapacity or loss to follow-up). Our approach to missing data is to minimize it as much as possible. If the primary study hypotheses are confirmed, analysis of QOL data may be complicated by the fact that the biomarker-guided strategy was more successful at keeping patients alive. Even a relatively small difference in mortality due to treatment may create a paradox in the QOL data such that the more effective therapy is associated with worse QOL (for example, if the patients with the worst QOL died in the usual care arm but were saved in the biomarker-guided arm.) We will address this problem by estimating the Survivor Average Causal Effects, which involves a counterfactual analysis to predict the QOL scores of interest assuming that the patient had not died or been otherwise unable to provide their own data. For the economic analyses, the primary statistical comparisons between the two treatment arms will be performed by intention-to-treat. A nonparametric bootstrap will be used to estimate treatment differences with 95% CI and p-values. Estimates and confidence limits around the observed cost differences can be created using several different approaches. In recent work, we have used bootstrap methods for this. Although our data analysis will not make parametric assumptions about the distributions of costs, we can approximate the precision of our estimates by assuming that costs follow a log-normal distribution. Previous studies suggest that this is a reasonable assumption. For data that are log normally distributed, the coefficient of variation (i.e., the standard deviation divided by the mean) remains constant, an observation that we have seen empirically across different studies and treatment arms. In fact, our experience has shown that the coefficient of variation is very close to 1 (i.e., the standard deviation is equal to the mean). Under the assumption of log normal distributions and CV=1, with > 500 patients (> 90%) with cost data per treatment arm, we will be able to estimate the difference in mean costs between treatments to within approximately 0.12 standard deviations based on the half-width (1.96 times the standard error) of the 95% confidence interval. This means, for example, if the mean cost per treatment arm was $10,000, then the 95% confidence interval for the treatment difference in cost would be the point estimate for the difference +/- $1,208. In order to provide a second (descriptive) perspective on cost differences for each strategy in GUIDE-IT, we will also directly measure major health care resource items used including hospital days (e.g., intensive care, step-down units, wards) and cardiac procedures (e.g., ICD, VAD placement,

18
catheterization, coronary revascularization, atrial fibrillation ablation) as well as selected smaller ticket items such as outpatient physician and emergency department visits. A basic set of resource data will be collected on the eCRF, and will be supplemented by the additional resource data that can be collected from the detailed hospital billing forms. To estimate the incremental cost effectiveness of the biomarker-guided approach relative to usual care, we will calculate a base case cost-effectiveness ratio that defines the incremental cost required to add an extra life year with the biomarker-guided strategy relative to usual care. A second series of analyses will calculate the corresponding cost-utility ratio, using utility data from the EQ-5D collected in the GUIDE-IT trial. These analyses will use the societal perspective and a lifetime time horizon so that the estimated incremental cost-effectiveness and cost-utility ratios can be compared with societal benchmarks. Where extrapolations from empirical data and other assumptions are required, they will be based, to the extent possible, on the empirical data from the GUIDE-IT trial and will be accompanied by appropriate examination of the effects of uncertainty using both stochastic methods and sensitivity analyses. For descriptive purposes, we will also calculate within-trial cost-effectiveness and cost-utility ratios, since they do not require any extrapolations. However, these within-trial ratios are limited due to their failure to account fully for long-term benefits and costs, and the absence of comparative benchmarks. At the time of analysis, costs will be adjusted to the most recent year for which the Producer Price Index has been published. Both costs and life expectancy will be discounted to present value at a 3% annual discount rate (with rates from 0 to 7% examined in sensitivity analyses). Since many of the patients will remain alive at the conclusion of the trial, a method is required for converting observed trial experience into the corresponding lifetime survival and cost figures needed for use in the incremental cost-effectiveness calculations. There are three general methods that we have previously used to make the necessary lifetime extrapolations called for in cost-effectiveness analysis: use of the trial data for extrapolation, use of secondary data sources to base the extrapolations upon, and use of Markov models. GUIDE-IT will provide a rich empirical data set involving up to 2 years of clinical outcome, cost, and utility data, with over 2,000 patient-years of follow-up information. We will use these data in age-based survival models to create estimates for each GUIDE-IT patient of life expectancy, quality-adjusted life expectancy and lifetime medical costs. The method, in brief, involves 5 basic steps. 1) Using Cox Proportional Hazards regression methodology for left-truncated and right-censored data, we model the hazard of death as a function of age, adjusting for additional prognostic factors through covariates. This model "adjusts for" age as the metric over which the hazard is computed, treats additional prognostic factors as covariates, and stratifies on treatment group (if necessary to satisfy the proportional hazards assumption). By estimating the hazard over the age metric (rather than over the time metric, as is traditionally done), we can produce data-based survival predictions through a much longer time period due to the broad representation of ages in our database. 2) This hazard relationship, which under proportional hazards is well estimated through the age range represented in our data, is used for prediction on a patient-by-patient basis. The predicted survival estimates for each patient are then combined with the empirical GUIDE-IT survival data and averaged over all the patients for both treatment groups. 3) Again using a Cox Proportional Hazards regression model, together with the post-HF hospitalization survival experience available in the GUIDE-IT data (and if necessary, secondary data sources available at the DCRI including HF-ACTION), we will estimate the long-term survival impact of a HF hospitalization, the non-fatal component of the study primary endpoint. This model will provide a quantitative measure of the increased relative risk

19
attributable to these non-fatal events for later incorporation in the individual patient predictions. 4) For the oldest age range, where the amount of empirical data may not be sufficient, we will use a Gompertz-based function for extrapolation. The estimated mean survival curves are integrated over a lifetime to obtain life expectancy for each treatment group. 5) The difference between the areas under each survival curve is computed to obtain the biomarker-guided arm incremental life expectancy. Uncertainty in cost-effectiveness estimates related to sampling variation will be quantified using non-parametric bootstrap techniques (1,000 samples with replacement with a cost-effectiveness ratio calculated for each sample) and expressed in three complementary formats. First, cost-effectiveness ratios arising from the bootstrap will be displayed on the cost-effectiveness plane to characterize the precision and magnitude of the estimates. Second, we will examine the net monetary benefit of the intervention, defined as the difference between the increase in effectiveness (valued using the willingness- to-pay threshold per unit of effectiveness), and the increase in cost. Net monetary benefit and associated confidence intervals will be displayed for a range of willingness-to-pay thresholds. Finally, we will plot the cost-effectiveness acceptability curve, which indicates the probability that that the intervention is cost effective (i.e., incremental net benefit > 0) for a range of willingness-to-pay thresholds. We will also perform sensitivity analyses to address uncertainty related to methodological assumptions regarding key parameters. If appropriate, bootstrap analyses will be repeated for alternative parameter values. It must be emphasized that although the general plan of our cost-effectiveness analyses can be specified prospectively, there is clearly an iterative quality to building successful cost-effectiveness models. 10. SAFETY 10.1 Adverse Events Frequencies and percentages will be provided for adverse events and serious adverse events by treatment in the following categories: symptomatic hypotension, symptomatic bradycardia, hyperkalemia, worsening renal function and other adverse event. The descriptive statistics will be provided for primary cause of the event: study procedure, primary disease under study, intercurrent illness, NT proBNP machine, concomitant medication. 10.2 Laboratory Data Laboratory results will be summarized by treatment as mean, standard deviation, median, 25th percentile, 75th percentile, minimum and maximum. This will include Sodium, Potassium, Bun, Creatinine, Total Cholesterol, Uric Acid, Hemoglobin, Hematocrit, Platelets, WBC, Lymphocytes (%). 10.3 Vital Signs and Physical Exam Vital signs and physical exam results will be summarized as percentages by treatment for categorical variables and as mean, standard deviation, median, 25th percentile, 75th percentile, minimum and maximum for continuous measures.

20
11. DSMB AND INTERIM ANALYSES For ethical reasons, an interim examination of key safety and endpoint data will be performed at regular intervals during the course of the trial. The primary objectives of these analyses will be to evaluate the accumulated data for high frequency of negative clinical outcomes in either of the two randomized arms. In addition, the interim monitoring will also involve a review of the control arm event rates, patient recruitment, compliance with the study protocol, status of data collection, and other factors that reflect the overall progress and integrity of the study. The results of the interim analyses and status reports will be carefully and confidentially reviewed by an NHLBI-appointed DSMB. It is anticipated that the DSMB will meet every 6-months to review the accumulating data. Prior to each meeting, the DCC will conduct any requested statistical analyses and prepare a summary report along with the following information: patient enrollment reports, rates of compliance with the assigned testing strategy, frequency of protocol violations, and description of SAEs (statistical comparisons of the randomized arms with respect to these SAEs will use chi-square or other appropriate 2-sample methods). The extracted data files and analysis programs for each DSMB report will be archived and maintained at the DCC for the life of the study. For futility monitoring, we will apply the inefficacy monitoring rule of Freidlin, Korn, and Gray35 to stop the trial if the biomarker-guided strategy is not beneficial. We propose to use the conservative boundary LIB0 along with a harm look at 25% of expected information. This approach will include 7 interim looks scheduled at roughly 25%, 40%, 50%, 60%, 70%, 80%, and 90%. With the proposed design, a total of 566 events are expected and the first interim review for futility and efficacy would be scheduled to occur after approximately 140 primary endpoint events have been observed. If the data suggested a benefit for the usual care arm with a p-value of <0.05, the Freidlin, Korn, and Gray approach would suggest stopping the trial at the 25% look. The second interim review would be scheduled after approximately 241 primary endpoint events have been observed. For the interim reviews at 40%, 50%, 60%, 70%, 80%, and 90%, the LIB0 conservative boundary would suggest stopping the trial for inefficacy if the biomarker-guided arm had a hazard ratio > 1.0 compared to usual-care arm. The Freidlin, Korn, and Gray approach will result in a trivial loss of power and requires no sample size adjustment. The DSMB will weigh any trade-offs between short-term versus long-term results. We propose to use the method of Haybittle and Peto as a guide in interpreting interim efficacy analyses.36,37 This procedure requires large critical values (Z=3, p≤0.001) for every assessment until the planned final analysis. Because of the conservatism throughout the trial, the critical value at the final analysis is conducted at the "nominal" critical value. The DSMB will weigh any trade-offs between short-term versus long-term results. The DSMB will play a valuable role in advising the study leadership on the relevance of advances in the diagnosis and treatment of patients with systolic HF. The DSMB would be asked to offer proper perspective on any therapeutic or diagnostic testing advances that may occur during the course of the trial. If protocol modifications are warranted, close consultation among the DSMB, the NHLBI staff and the study leadership will be required. A separate DSMB charter will outline the operating guidelines for the committee, and the protocol for evaluation of data—the charter will be created prior to patient randomization and agreed upon during the initial meeting of the DSMB. Minutes of all DSMB meetings will be prepared and distributed to committee members.

21
12. DSMB AND INTERIM ANALYSES The GUIDE-IT database is located in the Clinical Trials directory at the Duke Clinical Research Institute.

22
13. REFERENCES
1. Lloyd-Jones D, Adams R, Carnethon M, et al. Heart Disease and Stroke Statistics--2009 Update: A Report
From the American Heart Association Statistics Committee and Stroke Statistics Subcommittee. Circulation
2009;119:e21-181.
2. Lloyd-Jones DM, Larson MG, Leip EP, et al. Lifetime risk for developing congestive heart failure: the
Framingham Heart Study. Circulation 2002;106:3068-72.
3. Lindenfeld J, Albert NM, Boehmer J, et al. Executive Summary: HFSA 2010 Comprehensive Heart Failure
Practice Guideline. Journal of Cardiac Failure 2010;16:475-539.
4. Jessup M, Abraham WT, Casey DE, et al. 2009 focused update: ACCF/AHA Guidelines for the Diagnosis and
Management of Heart Failure in Adults: a report of the American College of Cardiology Foundation/American Heart
Association Task Force on Practice Guidelines: developed in collaboration with the International Society for Heart and
Lung Transplantation. Circulation 2009;119:1977-2016.
5. Lee DS, Mamdani MM, Austin PC, et al. Trends in heart failure outcomes and pharmacotherapy: 1992 to
2000. Am J Med 2004;116:581-9.
6. Johnson D, Jin Y, Quan H, Cujec B. Beta-blockers and angiotensin-converting enzyme inhibitors/receptor
blockers prescriptions after hospital discharge for heart failure are associated with decreased mortality in Alberta,
Canada. J Am Coll Cardiol 2003;42:1438-45.
7. Smith NL, Psaty BM, Pitt B, Garg R, Gottdiener JS, Heckbert SR. Temporal patterns in the medical treatment
of congestive heart failure with angiotensin-converting enzyme inhibitors in older adults, 1989 through 1995. Arch
Intern Med 1998;158:1074-80.

23
8. Stafford RS, Radley DC. The underutilization of cardiac medications of proven benefit, 1990 to 2002. J Am
Coll Cardiol 2003;41:56-61.
9. Whellan DJ, Hasselblad V, Peterson E, O'Connor CM, Schulman KA. Metaanalysis and review of heart failure
disease management randomized controlled clinical trials. American Heart Journal 2005;149:722-9.
10. Cleland JG, Louis AA, Rigby AS, Janssens U, Balk AH. Noninvasive home telemonitoring for patients with
heart failure at high risk of recurrent admission and death: the Trans-European Network-Home-Care Management
System (TEN-HMS) study. J Am Coll Cardiol 2005;45:1654-64.
11. Bourge RC, Abraham WT, Adamson PB, et al. Randomized Controlled Trial of an Implantable Continuous
Hemodynamic Monitor in Patients With Advanced Heart Failure: The COMPASS-HF Study. J Am Coll Cardiol
2008;51:1073-9.
12. Felker GM, Petersen JW, Mark DB. Natriuretic peptides in the diagnosis and management of heart failure.
CMAJ 2006;175:611-7.
13. deFilippi CR, Christenson RH, Gottdiener JS, Kop WJ, Seliger SL. Dynamic Cardiovascular Risk Assessment in
Elderly People: The Role of Repeated N-Terminal Pro-B-Type Natriuretic Peptide Testing. J Am Coll Cardiol
2010;55:441-50.
14. Morrow DA, de Lemos JA, Blazing MA, et al. Prognostic Value of Serial B-Type Natriuretic Peptide Testing
During Follow-up of Patients With Unstable Coronary Artery Disease. Jama 2005;294:2866-71.
15. Wang TJ, Larson MG, Levy D, et al. Plasma Natriuretic Peptide Levels and the Risk of Cardiovascular Events
and Death. N Engl J Med 2004;350:655-63.
16. Kragelund C, Gronning B, Kober L, Hildebrandt P, Steffensen R. N-Terminal Pro-B-Type Natriuretic Peptide
and Long-Term Mortality in Stable Coronary Heart Disease. N Engl J Med 2005;352:666-75.

24
17. Januzzi JL, Jr., Sakhuja R, O'Donoghue M, et al. Utility of amino-terminal pro-brain natriuretic peptide testing
for prediction of 1-year mortality in patients with dyspnea treated in the emergency department. Arch Intern Med
2006;166:315-20.
18. Fonarow GC, Peacock WF, Phillips CO, Givertz MM, Lopatin M. Admission B-Type Natriuretic Peptide Levels
and In-Hospital Mortality in Acute Decompensated Heart Failure. J Am Coll Cardiol 2007;49:1943-50.
19. Cleland JG, McMurray JJ, Kjekshus J, et al. Plasma concentration of amino-terminal pro-brain natriuretic
peptide in chronic heart failure: prediction of cardiovascular events and interaction with the effects of rosuvastatin: a
report from CORONA (Controlled Rosuvastatin Multinational Trial in Heart Failure). J Am Coll Cardiol 2009;54:1850-9.
20. Anand IS, Fisher LD, Chiang YT, et al. Changes in Brain Natriuretic Peptide and Norepinephrine Over Time and
Mortality and Morbidity in the Valsartan Heart Failure Trial (Val-HeFT). Circulation 2003;107:1278-83.
21. McKelvie RS, Yusuf S, Pericak D, et al. Comparison of Candesartan, Enalapril, and Their Combination in
Congestive Heart Failure : Randomized Evaluation of Strategies for Left Ventricular Dysfunction (RESOLVD) Pilot
Study: The RESOLVD Pilot Study Investigators. Circulation 1999;100:1056-64.
22. Latini R, Masson S, Anand I, et al. Effects of valsartan on circulating brain natriuretic peptide and
norepinephrine in symptomatic chronic heart failure: the Valsartan Heart Failure Trial (Val-HeFT). Circulation
2002;106:2454-8.
23. Frantz RP, Olson LJ, Grill D, et al. Carvedilol therapy is associated with a sustained decline in brain natriuretic
peptide levels in patients with congestive heart failure. Am Heart J 2005;149:541-7.
24. Tsutamoto T, Wada A, Maeda K, et al. Effect of spironolactone on plasma brain natriuretic peptide and left
ventricular remodeling in patients with congestive heart failure. J Am Coll Cardiol 2001;37:1228-33.

25
25. Fruhwald FM, Fahrleitner-Pammer A, Berger R, et al. Early and sustained effects of cardiac resynchronization
therapy on N-terminal pro-B-type natriuretic peptide in patients with moderate to severe heart failure and cardiac
dyssynchrony. Eur Heart J 2007;28:1592-7.
26. Logeart D, Thabut G, Jourdain P, et al. Predischarge B-type natriuretic peptide assay for identifying patients
at high risk of re-admission after decompensated heart failure. J Am Coll Cardiol 2004;43:635-41.
27. Bettencourt P, Azevedo A, Pimenta J, Frioes F, Ferreira S, Ferreira A. N-Terminal-Pro-Brain Natriuretic
Peptide Predicts Outcome After Hospital Discharge in Heart Failure Patients. Circulation 2004;110:2168-74.
28. Metra M, Nodari S, Parrinello G, et al. The role of plasma biomarkers in acute heart failure. Serial changes
and independent prognostic value of NT-proBNP and cardiac troponin-T. Eur J Heart Fail 2007;9:776-86.
29. Masson S, Latini R, Anand IS, et al. Prognostic Value of Changes in N-Terminal Pro-Brain Natriuretic Peptide
in Val-HeFT (Valsartan Heart Failure Trial). J Am Coll Cardiol 2008;52:997-1003.
30. Konstam MA, Gheorghiade M, Burnett JC, Jr., et al. Effects of Oral Tolvaptan in Patients Hospitalized for
Worsening Heart Failure: The EVEREST Outcome Trial. JAMA 2007;297:1319-31.
31. Bang H, Tsiatis A. Estimating medical costs with censored data. Biometrika 2000;87:329-43.
32. Greenwood M, Yule G.U. An inquiry into the nature of frequency distributions representative of multiple happenings with particular reference to the occurrence of multiple attacks of disease or of repeated accidents. J Roy Stat Soc. 1920;83:255-279. 33. Jahn-Eimermacher A. Comparison of the Andersen-Gill model with poisson and negative binomial regression on recurrent event data. Comput Stat Data An. 2008;52:4989-4997. 34. Rogers JK Eplerenone in patients with systolic heart failure and mild symptoms: analysis of repeat hospitalizations. Circulation. 2012:112: 1161-1179?.

26
35. Freidlin B, Korn EL, Gray R. A general inefficacy interim monitoring rule for randomized clinical trials. Clin
Trials 2010;7:197-208.
36. Haybittle JL. Repeated assessment of results in clinical trials of cancer treatment. Br J Radiol 1971;44:793-7.
37. Peto R, Pike MC, Armitage P, et al. Design and analysis of randomized clinical trials requiring prolonged
observation of each patient. I. Introduction and design. Br J Cancer 1976;34:585-612.

27
Appendix A. Schedule of Study Assessments
Screening Day 0 (Randomization)
2 wks (+ 1 week)
6 wks (+ 1 week)
3 mos (+ 1 week)
6 mos (+ 1 week)
9 mos (+ 1 week)
12 mos* (+ 1
week) Informed Consent X History and physical X X X X X X X X CV Medication History X X X X X X X X
Document rationale for changes in therapy
X X X X X X
6 minute walk X HRQOL X X X X Medical resource use and cost assessment X X X X X X X
Local lab NT-proBNP (standard of care group)
X X
Local lab NT-proBNP (guided only) X X X X X X X X
Cr, BUN, electrolytes (local lab) X X X X X X X X
Core lab plasma and serum samples X X X X X X X
Core lab DNA sample X Safety assessments X X X X X X *Patients will be followed for a minimum of 12 months up to a maximum of 24 months
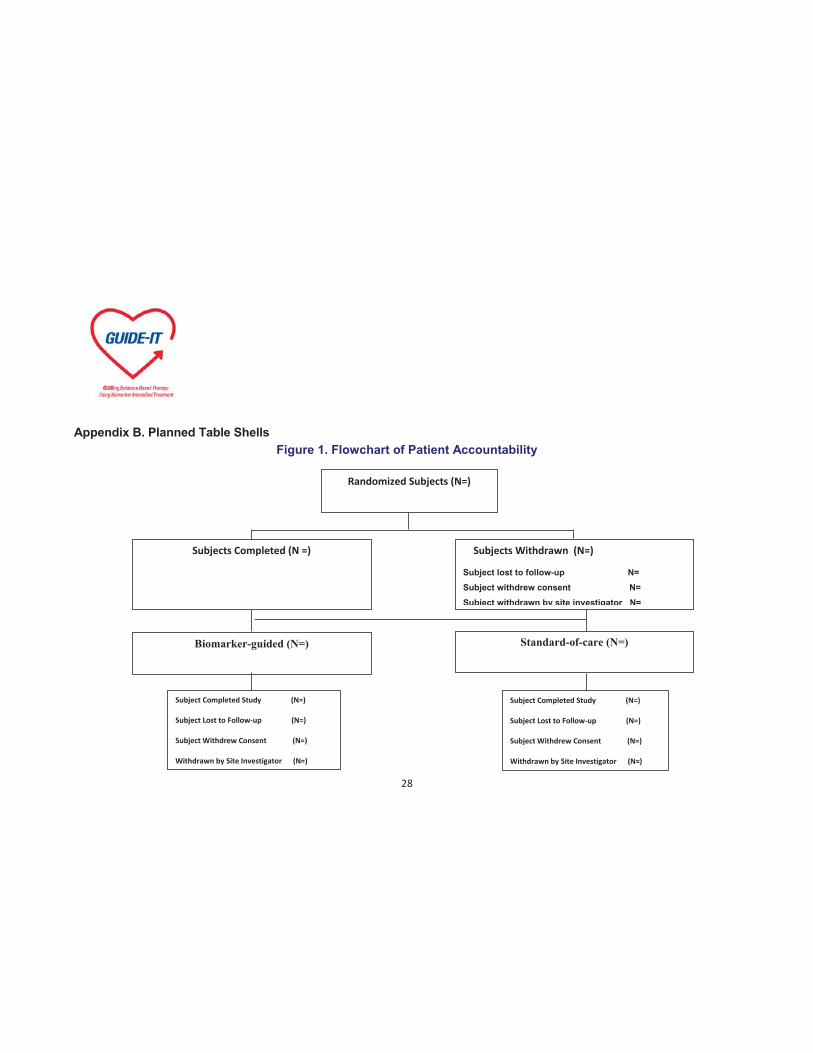
28
Appendix B. Planned Table Shells Figure 1. Flowchart of Patient Accountability
Randomized Subjects (N=)
Subjects Withdrawn (N=)
Subject lost to follow-up N= Subject withdrew consent N= Subject withdrawn by site investigator N=
Biomarker-guided (N=)
Standard-of-care (N=)
Subjects Completed (N =)
Subject Completed Study (N=)
Subject Lost to Follow-up (N=)
Subject Withdrew Consent (N=)
Withdrawn by Site Investigator (N=)
Subject Completed Study (N=)
Subject Lost to Follow-up (N=)
Subject Withdrew Consent (N=)
Withdrawn by Site Investigator (N=)
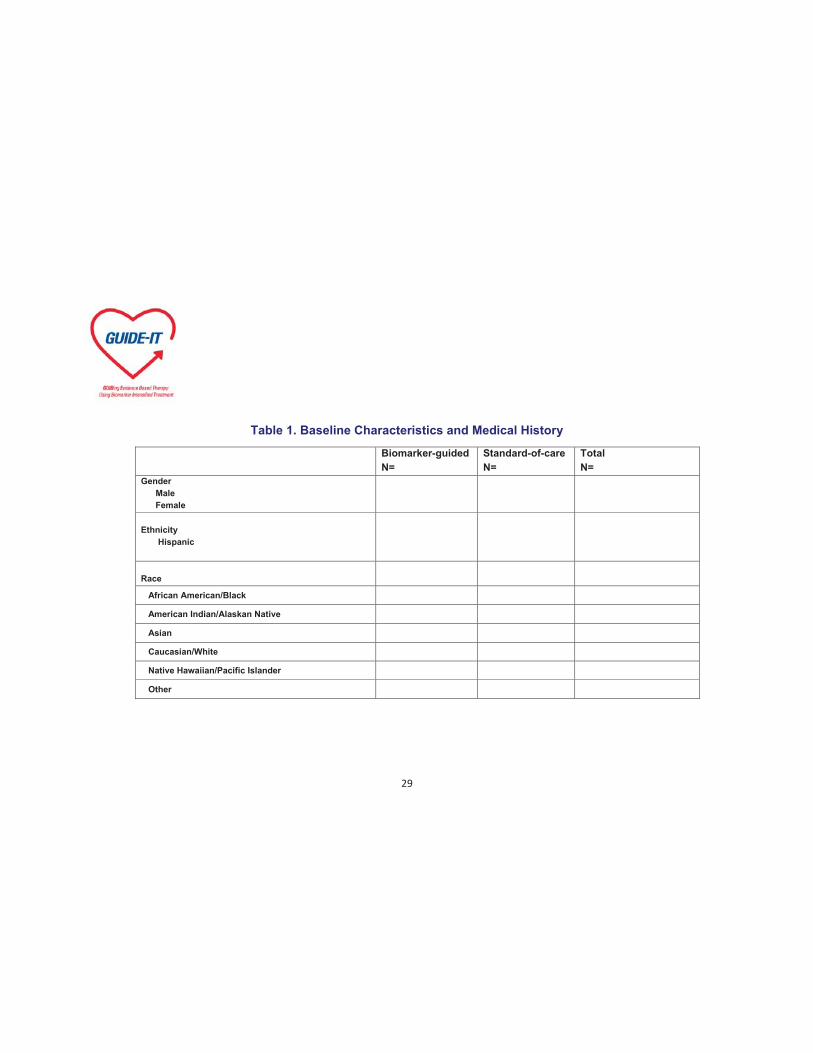
29
Table 1. Baseline Characteristics and Medical History
Biomarker-guided N=
Standard-of-care N=
Total N=
Gender Male Female
Ethnicity Hispanic
Race
African American/Black
American Indian/Alaskan Native
Asian
Caucasian/White
Native Hawaiian/Pacific Islander
Other

30
Table 1. Baseline Characteristics and Medical History (Continued)
Biomarker-guided N=
Standard-of-care N=
Total N=
Height (cm) N Mean (SD) Median 25th,75th Min, Max
Weight (kg) N Mean (SD) Median 25th,75th Min, Max
Etiology of Heart Failure Ischemic Non-ischemic Dilated/Idiopathic Hypertensive Valvular Other

31
Table 1. Baseline Characteristics and Medical History (Continued)
Biomarker-guided N=
Standard-of-care N=
Total N=
Duration of Heart Failure N Mean (SD) Median 25th,75th Min, Max
Hospitalization
Coronary Artery Disease
Prior Revascularization CABG PCI
Valve Surgery Aortic valve replacement Mitral valve replacement/Repair
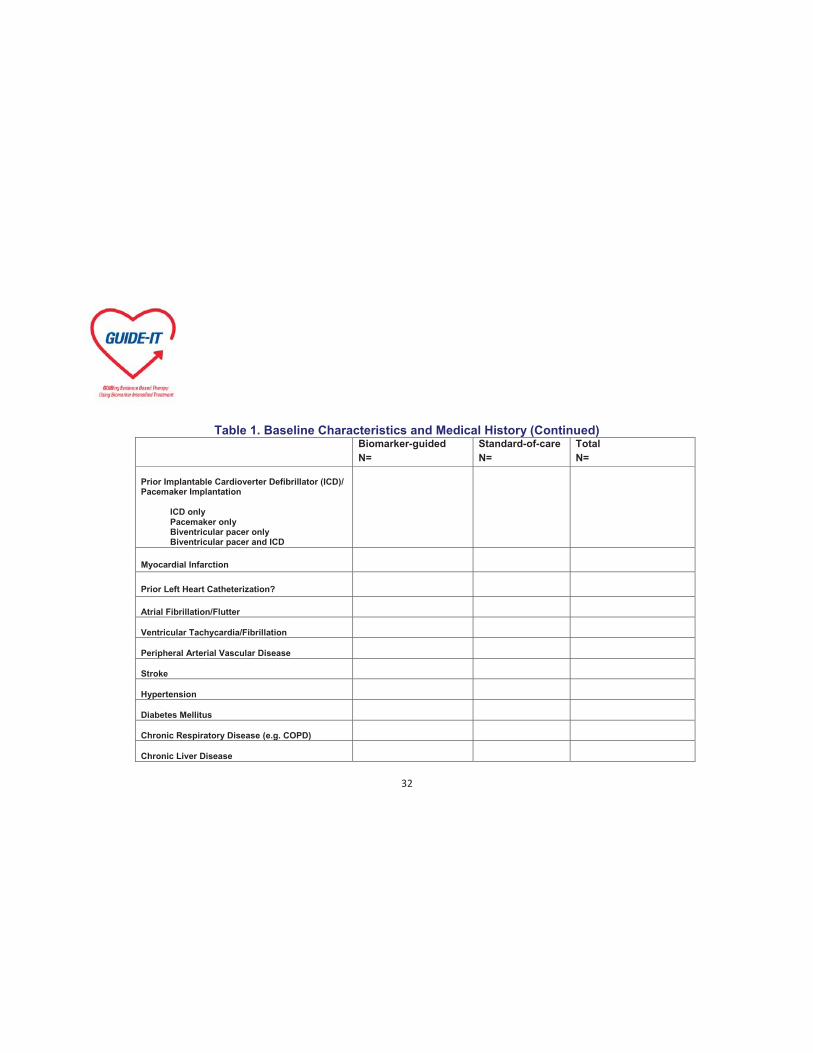
32
Table 1. Baseline Characteristics and Medical History (Continued) Biomarker-guided
N= Standard-of-care N=
Total N=
Prior Implantable Cardioverter Defibrillator (ICD)/ Pacemaker Implantation ICD only Pacemaker only Biventricular pacer only Biventricular pacer and ICD
Myocardial Infarction
Prior Left Heart Catheterization?
Atrial Fibrillation/Flutter
Ventricular Tachycardia/Fibrillation
Peripheral Arterial Vascular Disease
Stroke
Hypertension
Diabetes Mellitus
Chronic Respiratory Disease (e.g. COPD)
Chronic Liver Disease

33
Table 1. Baseline Characteristics and Medical History (Continued)
Biomarker-guided N=
Standard-of-care N=
Total N=
Cancer Within Past 5 Years Excluding Skin Cancer Cigarette Smoking
Alcohol Abuse
Depression Treated with Medications
Drug Abuse
Hyperlipidemia
Sleep Apnea
Renal Disease
Value of Most Recent LVEF (Enter description only if EF value unavailable) N Mean (SD) Median 25th,75th Min, Max Normal Mild dysfunction Moderate dysfunction Severe dysfunctio0n
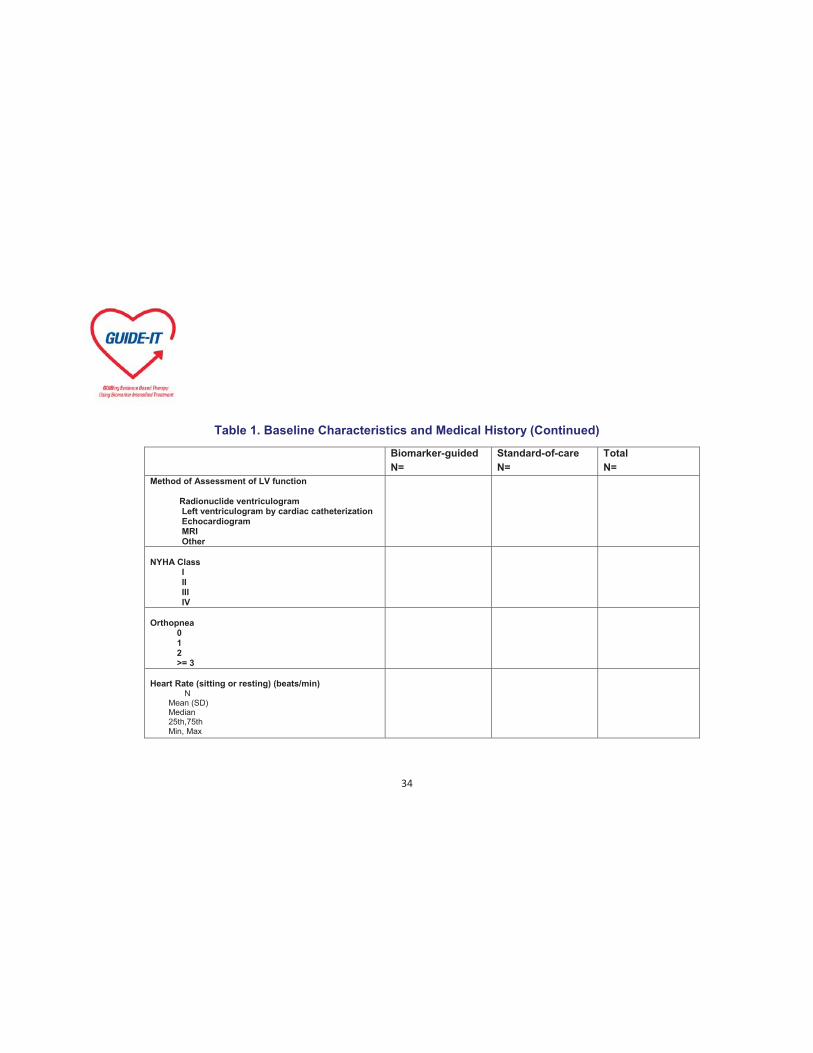
34
Table 1. Baseline Characteristics and Medical History (Continued)
Biomarker-guided N=
Standard-of-care N=
Total N=
Method of Assessment of LV function Radionuclide ventriculogram Left ventriculogram by cardiac catheterization Echocardiogram MRI Other
NYHA Class I II III IV Orthopnea 0 1 2 >= 3
Heart Rate (sitting or resting) (beats/min) N Mean (SD) Median 25th,75th Min, Max

35
Table 1. Baseline Characteristics and Medical History (Continued)
Biomarker-guided N=
Standard-of-care N=
Total N=
Blood Pressure (sitting or resting) (mmHg) Systolic N Mean (SD) Median 25th,75th Min, Max Diastolic N Mean (SD) Median 25th,75th Min, Max
Atrial Fibrillation or Atrial Flutter SpO2 (%) N Mean (SD) Median 25th,75th Min, Max
S3 Auscultation
Hepatomegaly

36
Table 1. Baseline Characteristics and Medical History (Continued)
Biomarker-guided N=
Standard-of-care N=
Total N=
Ascites Peripheral Edema Trace Moderate Severe Jugular Venous Pressure (cm) <8 8-12 13-16 >16 Rales <1/3 1/3-2/3 >2/3

37
Table 2. Death, HF Hospitalization, All-cause Mortality and Morbidity
Biomarker-guided N=
Standard-of-care N=
Total N=
CV Death or First Heart Failure Hospitalization nnn (%) Event Rate (%/yr) Hazard Ratio (Biomarker-guided/Standard-of-care)
95% CI for Hazard Ratio p-value
Only provide nnn (%) in this column
Death nnn (%) Event Rate (%/yr) Hazard Ratio (Biomarker-guided/Standard-of-care) 95% CI for Hazard Ratio p-value CV Death nnn (%) Event Rate (%/yr) Hazard Ratio (Biomarker-guided/Standard-of-care) 95% CI for Hazard Ratio p-value Non-CV Death Follow the above format
Only provide nnn (%) in this column
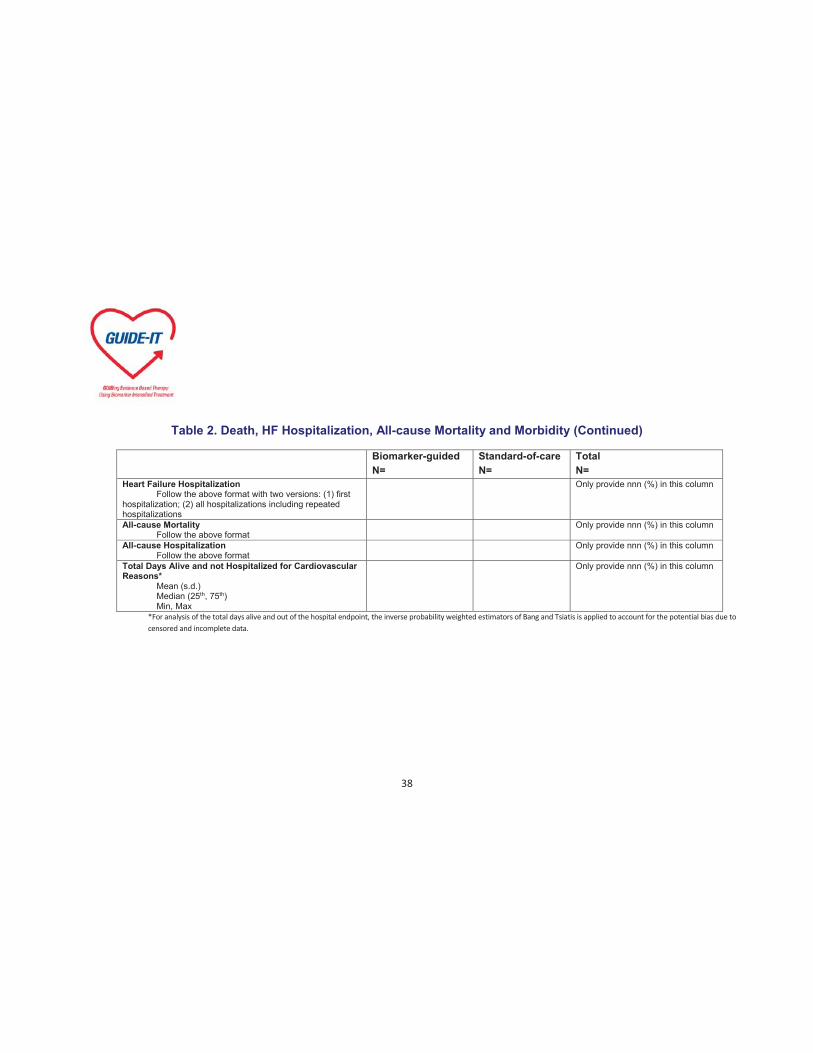
38
Table 2. Death, HF Hospitalization, All-cause Mortality and Morbidity (Continued)
Biomarker-guided N=
Standard-of-care N=
Total N=
Heart Failure Hospitalization Follow the above format with two versions: (1) first hospitalization; (2) all hospitalizations including repeated hospitalizations
Only provide nnn (%) in this column
All-cause Mortality Follow the above format
Only provide nnn (%) in this column
All-cause Hospitalization Follow the above format
Only provide nnn (%) in this column
Total Days Alive and not Hospitalized for Cardiovascular Reasons* Mean (s.d.) Median (25th, 75th) Min, Max
Only provide nnn (%) in this column
*For analysis of the total days alive and out of the hospital endpoint, the inverse probability weighted estimators of Bang and Tsiatis is applied to account for the potential bias due to censored and incomplete data.

39
Figure 2. KM Curve for Time to Cardiovascular Death or First HF Hospitalization by Treatment
Below is an example

40
Please note that we will report % of patients with event (converted from probability of event) instead of probability of event-free survival so the direction of the curve will be reversed.
Note: this example is from James L. Januzzi, Jr, MD, Shafiq U. Rehman, MD, et al. “Use of Amino-Terminal Pro-B-Type Natriuretic Peptide to Guide Outpatient Therapy of Patients with Chronic Left Ventricular Systolic Dysfunction”, Vol. 58, No. 18 2011, Journal of the American College of Cardiology.
Figure 3. KM Curve for Time to All-Cause Mortality by Treatment
Please follow the above format
Figure 4. KM Curve for Time to CV Death by Treatment
Please follow the above format
Figure 5. KM Curve for Time to First HF Hospitalization by Treatment
Please follow the above format

41
Table 3. Supportive Analyses of Primary Endpoint
Biomarker-guided number of events
(%/year)
Standard of Care number of events
(%/year)
Hazard Ratio (95% CI) P-value for
Interaction Primary Efficacy Outcome (n=XXX) Age Age > 75 Age < 75 Gender Female Male Race Asian Black or African American Native Hawaiian or Pacific Islander White/Caucasian Other Diabetes Yes No Atrial Fibrillation at Baseline Yes No
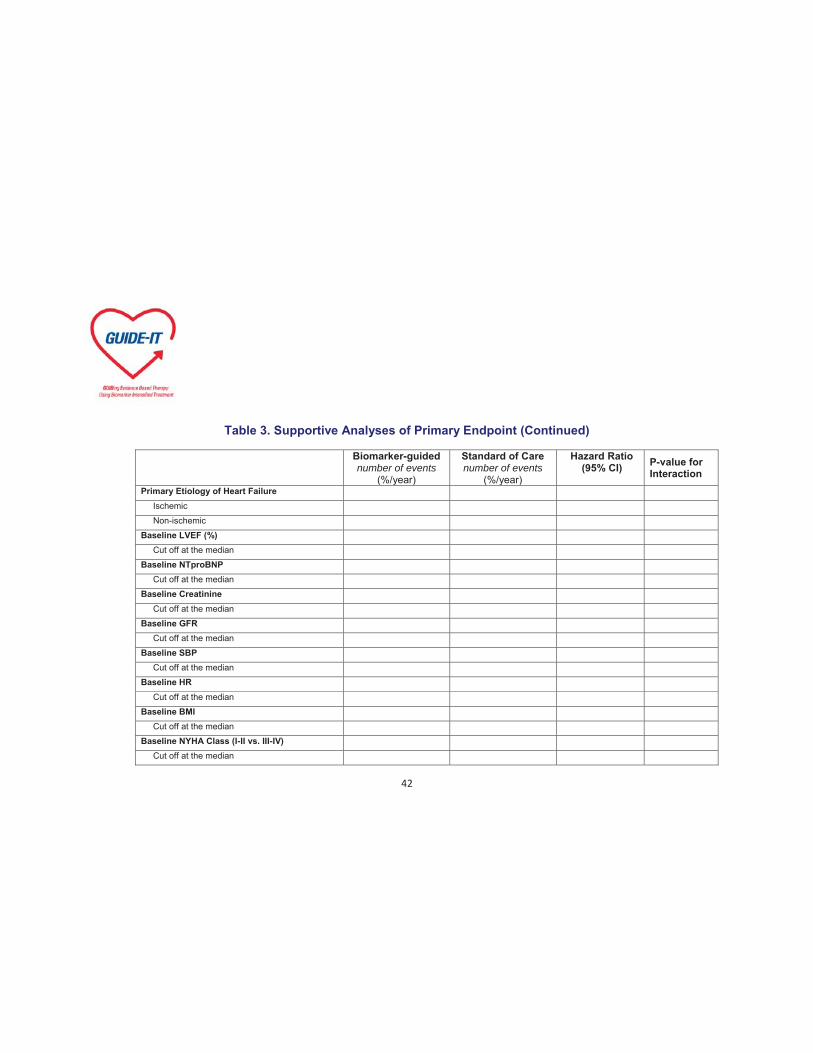
42
Table 3. Supportive Analyses of Primary Endpoint (Continued)
Biomarker-guided number of events
(%/year)
Standard of Care number of events
(%/year)
Hazard Ratio (95% CI) P-value for
Interaction Primary Etiology of Heart Failure Ischemic Non-ischemic Baseline LVEF (%) Cut off at the median Baseline NTproBNP Cut off at the median Baseline Creatinine Cut off at the median Baseline GFR Cut off at the median Baseline SBP Cut off at the median Baseline HR Cut off at the median Baseline BMI Cut off at the median Baseline NYHA Class (I-II vs. III-IV) Cut off at the median

43
Table 3. Supportive Analyses of Primary Endpoint (Continued)
Biomarker-guided number of events
(%/year)
Standard of Care number of events
(%/year)
Hazard Ratio (95% CI) P-value for
Interaction US vs. Canada US Canada

44
Figure 6. Supportive Analyses of Primary Endpoint – Forest Plot of Treatment and Demographic Characteristics
Note: This example is from a study coauthored by Renato Lopez, Sana Al-Khatib and Lars Wallentin, et al. published in Lancet, Oct. 2, 2012

45
Table 4a. Adverse Events During Therapy
Biomarker-guided N=
Standard-of-care N=
Total N=
Symptomatic Hypotension Symptomatic Bradycardia
Hyperkalemia
Worsening Renal Function
Other Adverse Event
Primary Cause of the Event Study procedure Primary disease under study Intercurrent illness NT proBNP machine Concomitant medication

46
Table 4b. Serious Adverse Events During Therapy
Biomarker-guided N=
Standard-of-care N=
Total N=
Symptomatic Hypotension
Symptomatic Bradycardia
Hyperkalemia
Worsening renal function
Other adverse event
Primary cause of the event Study procedure Primary disease under study Intercurrent illness NT proBNP machine Concomitant medication
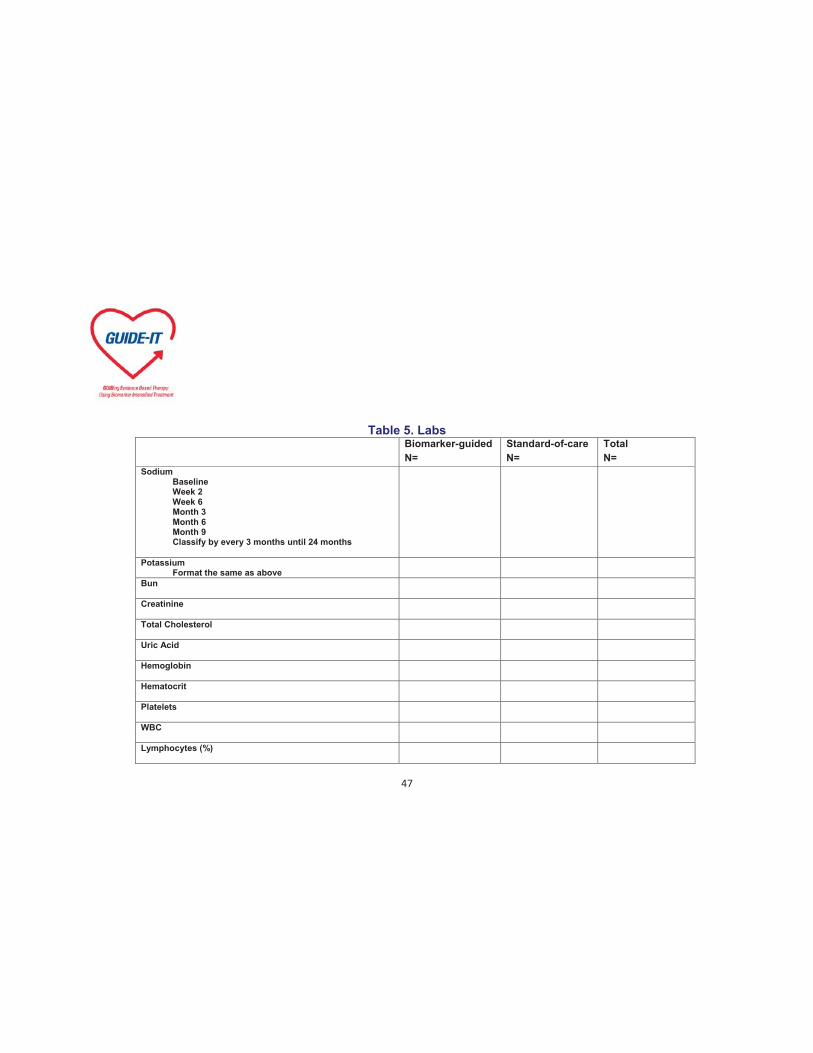
47
Table 5. Labs Biomarker-guided
N= Standard-of-care N=
Total N=
Sodium Baseline Week 2 Week 6 Month 3 Month 6 Month 9 Classify by every 3 months until 24 months
Potassium Format the same as above
Bun
Creatinine
Total Cholesterol
Uric Acid
Hemoglobin
Hematocrit
Platelets
WBC
Lymphocytes (%)

48
Table 6. Medication Use
Baseline
Last Visit
Mean Changes in Dosages During the Course of the Study
Biomarker-guided N=
Standard-of-care
N=
Biomarker-guided
N=
Standard-of-care N=
Biomarker-guided
N=
Standard-of-care N=
ACE Inhibitor
ARB
Beta Blocker
Digoxin
Hydralazine-nitrates
Loop diuretic
Mineralocorticoid receptor antagonist
Oral thiazide diuretic

49
Table 7. Adjustment of Concomitant Medication or Therapy All Patients
Week 2 Month 3 Month 6 Month 9 1 year Month 15 Month 18 Month 21 Two
Years Total
ACE Inhibitor
How was the therapy adjusted? Added Stopped Increased Decreased Switched to another agent in class
Rationale for the adjustment Decompensated HF Clinical indication without decompensated HF Decrease in NT-ProBNP Increase in NT-ProBNP Other investigator decision Side effects or intolerance Other
ARB (the same format as above)
Beta Blocker (the same format as above)

50
Table 7. Adjustment of Concomitant Medication or Therapy (Continued)
All Patients
Week 2 Month 3 Month 6 Month 9 1 year Month 15 Month 18 Month 21 Two Years
Total
Digoxin (the same format as above)
Hydralazine-nitrates (the same format as above)
Loop diuretic (the same format as above)
Mineralocorticoid receptor antagonist (the same format as above)
Oral thiazide diuretic (the same format as above)
Number of Adjustments

51
Table 7a. Adjustment of Concomitant Medication or Therapy Biomarker-guided
Week 2 Month 3 Month 6 Month 9 1 year Month 15 Month 18 Month 21 Two
Years Total
ACE Inhibitor
How was the therapy adjusted? Added Stopped Increased Decreased Switched to another agent in class
Rationale for the adjustment Decompensated HF Clinical indication without decompensated HF Decrease in NT-ProBNP Increase in NT-ProBNP Other investigator decision Side effects or intolerance Other
ARB (the same format as above)
Beta Blocker (the same format as above)
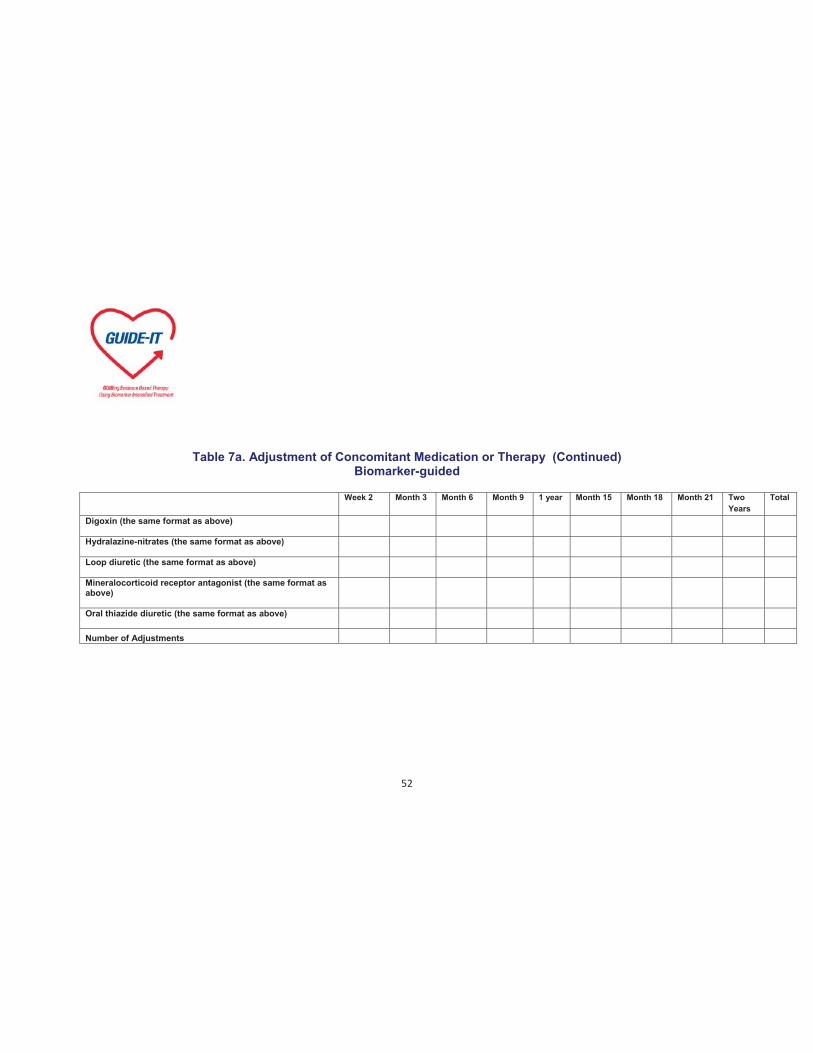
52
Table 7a. Adjustment of Concomitant Medication or Therapy (Continued) Biomarker-guided
Week 2 Month 3 Month 6 Month 9 1 year Month 15 Month 18 Month 21 Two
Years Total
Digoxin (the same format as above)
Hydralazine-nitrates (the same format as above)
Loop diuretic (the same format as above)
Mineralocorticoid receptor antagonist (the same format as above)
Oral thiazide diuretic (the same format as above)
Number of Adjustments

53
Table 7b. Adjustment of Concomitant Medication or Therapy Standard-of-care
Week 2 Month 3 Month 6 Month 9 1 year Month 15 Month 18 Month 21 Two Years
Total
ACE Inhibitor
How was the therapy adjusted? Added Stopped Increased Decreased Switched to another agent in class
Rationale for the adjustment Decompensated HF Clinical indication without decompensated HF Decrease in NT-ProBNP Increase in NT-ProBNP Other investigator decision Side effects or intolerance Other
ARB (the same format as above)
Beta Blocker (the same format as above)
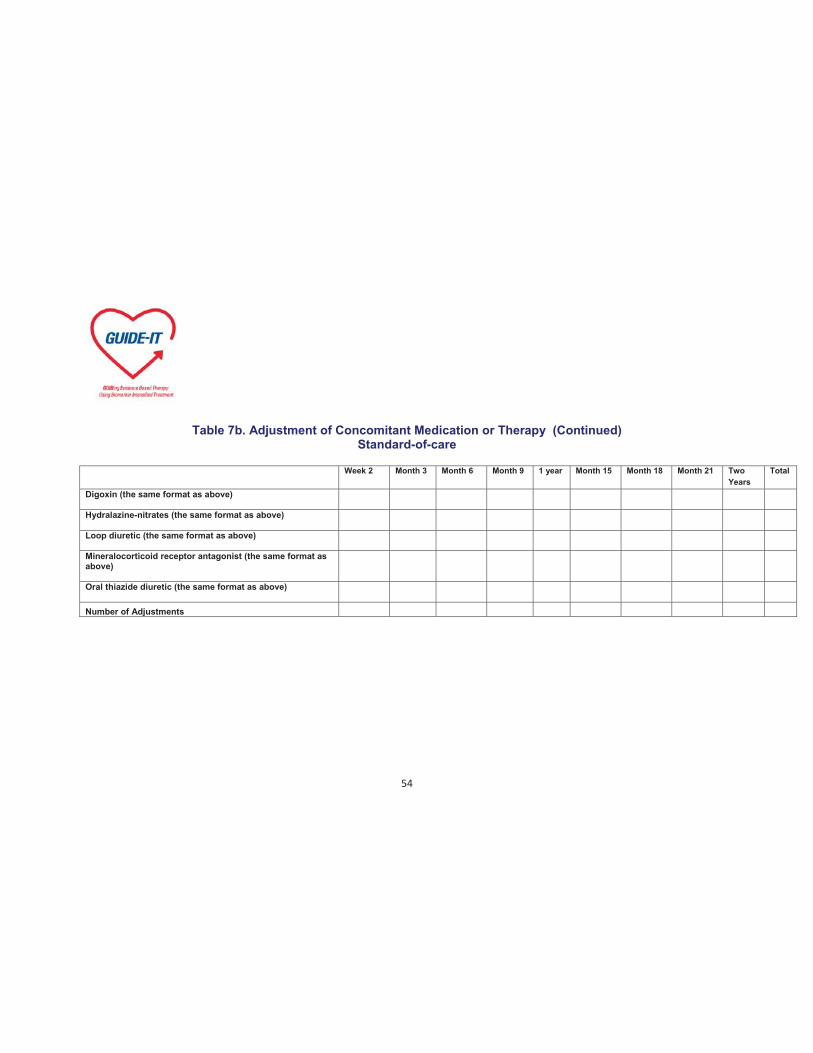
54
Table 7b. Adjustment of Concomitant Medication or Therapy (Continued) Standard-of-care
Week 2 Month 3 Month 6 Month 9 1 year Month 15 Month 18 Month 21 Two
Years Total
Digoxin (the same format as above)
Hydralazine-nitrates (the same format as above)
Loop diuretic (the same format as above)
Mineralocorticoid receptor antagonist (the same format as above)
Oral thiazide diuretic (the same format as above)
Number of Adjustments
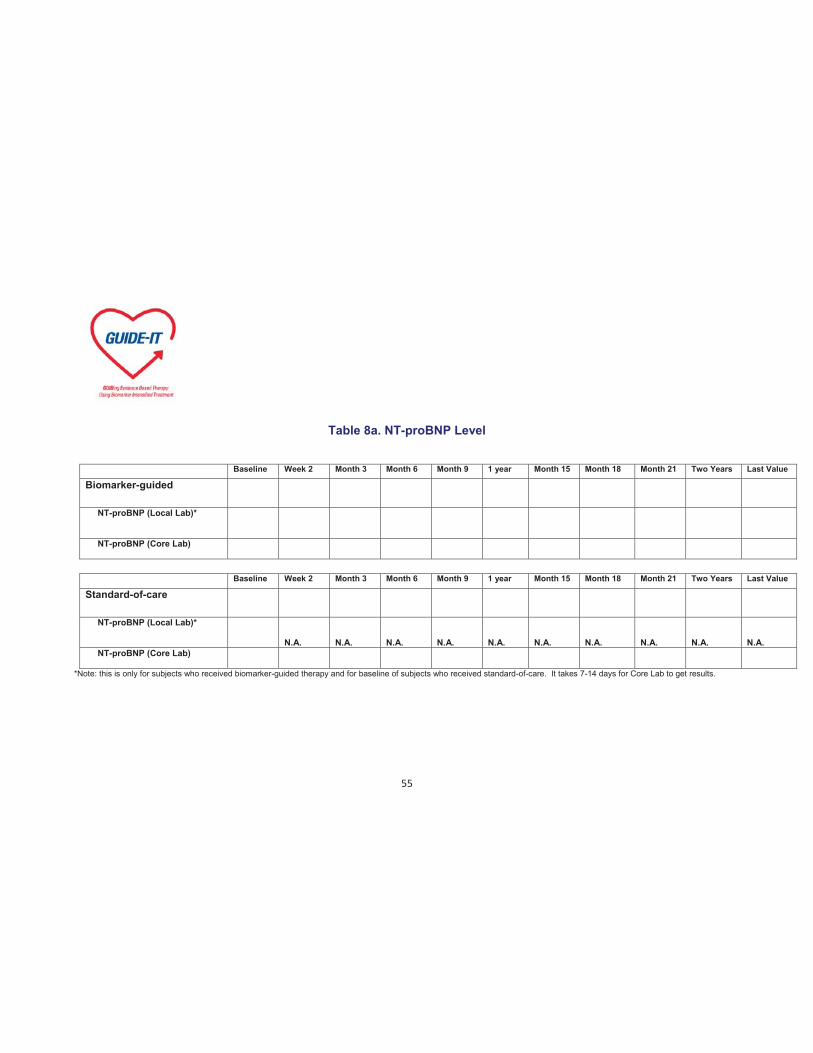
55
Table 8a. NT-proBNP Level
Baseline Week 2 Month 3 Month 6 Month 9 1 year Month 15 Month 18 Month 21 Two Years Last Value
Biomarker-guided
NT-proBNP (Local Lab)*
NT-proBNP (Core Lab)
Baseline Week 2 Month 3 Month 6 Month 9 1 year Month 15 Month 18 Month 21 Two Years Last Value
Standard-of-care
NT-proBNP (Local Lab)*
N.A. N.A. N.A.
N.A. N.A.
N.A.
N.A.
N.A.
N.A.
N.A.
NT-proBNP (Core Lab)
*Note: this is only for subjects who received biomarker-guided therapy and for baseline of subjects who received standard-of-care. It takes 7-14 days for Core Lab to get results.

56
Table 8b. Percent of Subjects with NT-proBNP Level < 1000 pg/mL by Treatment and Visit
Baseline Week 2 Month 3 Month 6 Month 9 1 year Month 15 Month 18 Month 21 Two Years Last Value
Biomarker-guided
NT-proBNP (Local Lab)* N/N (%)
N/N (%) N/N (%) N/N (%)
N/N (%) N/N (%) N/N (%) N/N (%)
N/N (%) N/N (%) N/N (%)
NT-proBNP (Core Lab) N/N (%)
N/N (%) N/N (%) N/N (%)
N/N (%) N/N (%) N/N (%) N/N (%)
N/N (%) N/N (%) N/N (%)
Baseline Week 2 Month 3 Month 6 Month 9 1 year Month 15 Month 18 Month 21 Two Years Last Value
Standard-of-care
NT-proBNP (Local Lab)* N/N (%)
N.A.
N.A.
N.A.
N.A.
N.A.
N.A.
N.A.
N.A.
N.A.
N.A.
NT-proBNP (Core Lab) N/N (%)
N/N (%) N/N (%) N/N (%)
N/N (%) N/N (%) N/N (%) N/N (%)
N/N (%) N/N (%) N/N (%)
*Note: this is only for subjects who received biomarker-guided therapy and for baseline of subjects who received standard-of-care. It takes 7-14 days for Core Lab to get results.

57
Table 9. Change of NT-proBNP Level Relative to Baseline
Week 2 Month 3 Month 6 Month 9 1 year Month 15 Month 18 Month 21 Two Years Last Value
Biomarker-guided
NT-proBNP (Local Lab)* Absolute Change % Change
NT-proBNP (Core Lab) Absolute change % Change
Standard-of-care
NT-proBNP (Local Lab)* Absolute change % Change
N.A. N.A. N.A.
N.A. N.A.
N.A. N.A. N.A.
N.A. N.A.
NT-proBNP (Core Lab) Absolute change % Change
*Note: this is only for subjects who received biomarker-guided therapy.
**Note: all the statistics in this table will be presented as mean (s.d), median (25th,75th), min and max.
58
Table 10. Mixed Model Estimates - NT-proBNP Level
Analysis Estimate Standard Error F-value P-value Time Points

59
Figure 7. Mean Absolute Values Over Time Please refer to example below
Figure 8. Mean Absolute Change Over Time
Figure 9. Mean % Change Over Time
Figure 10. Mean Predicted NT-proBNP Level Over Time

60
Tot
al A
E B
urde
n:
Mea
n Pr
edic
ted
Scor
es
6
7
8
9
10
11
12
13
14
Time PointBaseline Week 02 Week 04 Week 08 Week 12 Month 6 Month 9
Figure 6a. Baseline to Month 9, Predicted
Evaluable MITT

61
Figure 11. Correlation Between Local NT-proBNP Level and Core Lab NT-proBNP Please see example below
F ig u r e 3 a . A n t i - X a - L M W H a n d A p ix a b a n P la s m a C o n c e n t r a t io nA t 3 W e e k s
An
ti
-X
a-
LM
WH
(I
U/
mL
0
1
2
3
4
5
6
7
8
9
1 0
1 1
1 2
1 3
1 4
1 5
A p ix a b a n ( n g /m L )0 1 0 0 2 0 0 3 0 0 4 0 0 5 0 0 6 0 0 7 0 0 8 0 0 9 0 0 1 0 0 0


