Page 1
MEDRC Series of R&D Reports MEDRC Project: 16-DC-020
Study the Effect of Reeds Tissues on the
Adsorption of Heavy Metals and Bacteria from
Sewage Water
M. Sc. Thesis
Submitted By
Munjeda Tahseen Salman
Principal Investigator
Dr. Ahmad Abu-Obiad An-Najah National University
Middle East Desalination Research Center Muscat,
Sultanate of Oman
2017
Page 2
II
An-Najah National University
Faculty of Graduate Studies
Study the Effect of Reeds Tissues on the
Adsorption of Heavy Metals and
Bacteria from Sewage Water
By
Munjeda Tahseen Salman
Supervisor
Dr. Ahmad Abu-Obiad
Co-Supervisor
Dr. Raed Alkowni
This Thesis is Submitted in Partial Fulfillment of the Requirements for
the Degree of Master of Environmental Studies, Faculty of Graduate
Studies, An-Najah National University, Nablus - Palestine.
2017
Page 3
III
Study the Effect of Reeds Tissues on the Adsorption of
Heavy Metals and Bacteria from Sewage Water
By
Munjeda Tahseen Salman
This Thesis was defended successfully on / / 2017, and approved by:
Defense Committee Members Signature
1. Dr. Ahmad Abu-Obiad/ Supervisor …………
2. Dr. Raed Alkowni / Co-Supervisor …………
3. …………
4. …………
Page 4
IV
Dedication
All praise to Allah, Lord of creation, the most Merciful and
Compassionate, who blessed me with the ability to attain my task in this
research work.
I am highly thankful to my dear husband Wael Nassar, and my children
Mohammad, Amir, Luna and Sara for sacrificing their time and enjoyment
for my studies.
My greatest gratitude to my family, specially my father and mother,sisters
and brothers for their support and encouragement.
Acknowledgements
First of all, I am so grateful to Allah, Who gave me the patience and
strength to finish my thesis.
I want to express my gratitude to my supervisors, Dr. Ahmad Abu-Obiad
and Dr.Raed Alkowni, for their supervision, effort, and the time they spent
in correcting and commenting on my work until the last stage.
Thanks also to the technical staff at the Department of Chemistry at An-
Najah National University, especially. Mr. Nafeth Dwekat for his help,and
to all who helped and encouraged me in any way…
Page 5
V
االقرار
أنا الموقع أدناه مقدم الرسالة التي تحمل عنوان:
Study the Effect of Reeds Tissues on the Adsorption of Heavy
Metals and Bacteria from Sewage Water
أقر بأن ما اشتملت عليه هذه الرسالة انما هو نتاج جهدي الخاص, باستثناء ما تم االشارة اليه حيثما
, وأن هذه الرسالة ككل, أو أي جزء منها لم يقدم من قبل أي درجة أو بحث علمي أو بحثي لدى ورد
أي مؤسسة تعليمية أو بحثية أخرى.
Declaration
The work provided in this thesis, unless otherwise referenced, is the
researcher's own work, and has not been submitted elsewhere for any other
degree or qualification.
Student's name: :اسم الطالب
Signature: :التوقيع
Date: :التاريخ
Page 6
VI
List of Contents No. Contents Page
Dedication III
Acknowledgment IV
Declaration V
List of contents VI
List of tables VIII
List of figures X
Abstract XII
Chapter One: Introduction 1
1.1 Pollution by pathogenic bacteria 2
1.2 Source, Fate and Behavior of Microorganisms 3
1.3 Pollution by heavy metals 4
1.4 Source and behavior of heavy metals 5
1.4.1 Cadmium (II) 7
1.4.2 Copper(II) 8
1.4.3 Iron(III) 8
1.4.4 Lead(II) 9
1.4.5 Nickel (II) 9
1.5 Phragmites Australia characteristic 10
1.6 Phytofiltration 11
1.7 Objective 12
1.8 Novelty 13
1.9 Hypothesis 14
1.10 Previous studies 14
Chapter two: Methodology 14
2.1 Collection and treatment of biomass 16
2.2 Biological part experiment 17
2.2.1 Preparation sample for Antibacterial Activity 18
2.2.2 Preparation Media 18
2.2.3 Bacteria Preparation 19
2.3 Chemical part experiment 19
2.3.1 Preparation of the solution of metals 20
2.3.2 Preparation of stock solution of metals 20
2.3.3 Preparation of calibration curve 20
2.4 Metal quantification 20
2.5 The instruments 21
2.6 Studied Parameters 21
Page 7
VII
2.6.1 Effect of initial concentration 21
2.6.2 Competing study 21
2.6.3 Effect of contact time 22
2.6.4 Effect of PH 22
2.6.5 Effect of temperature 22
Chapter Three: Results and discussion 26
3.1 Results of biological part experiment. 27
3.2 Results of chemical part experiment. 27
3.2.1 Effect of initial metal ion concentration 27
3.2.2 Effect of competing ions 32
3.23 Effect contact time 34
3.2.4 Effect of PH 37
3.2.5 Effect of temperature 40
3.3 Adsorption isotherm of pb(II) 44
3.3.1 Freundlich model 44
3.3.2 Langmuir model 46
3.4 Adsorption thermodynamics 49
3.5 Rate order of the adsorption process 50
Conclusion 55
Recomendations 56
References 57
ب الملخص
Page 8
VIII
List of Tables No. Table Page
1 Classification of phragmites Australia 11
2 Effect of initial metal ion concentration(5)ppm on the
% removal by both Phragmites
27
3 Effect of initial metal ion concentration(10)ppm on
the % removal by both Phragmites
28
4 Effect of initial metal ion concentration(15)ppm on
the % removal by both phragmites 28
5 Effect of initial metal ion concentration(20)ppm on
the % removal by both phragmites 29
6 Effect of the presence of all metals on the percent
removal of each other by reed shoot. 30
7 Effect of contact time on the % removal of metals by
reed shoot. 33
8 Effect of pH on the % removal of metals by reed
shoot. 37
9 Effect of temperature on the % removal of metals by
reed shoot. 41
10 Application of Freundlich adsorption isotherm on the
% removal of pb by reed shoot.
42
11 Parameters and correlation coefficient of
Freundlich isotherm model for adsorption of
pb(II) onto reed shoot
43
12 Application of Langmuir adsorption isotherm on %
removal of pb by reed shoot.
44
13 Parameters and correlation coefficient of Langmuir
isotherm model for adsorption of pb(II) onto reed
shoot
45
14 The values of the thermodynamic of pb(II) adsorption
at various temperature
46
15 Parameters of thermodynamic for adsorption of
pb(II) onto reed shoot
47
16 Applying Pseudo first- order for pb(II) adsorption
onto reed shoot at 25ºC
48
17 18 Pseudo first - order parameters for pb(II) adsorption
onto reed shoot at 25ºC.
50
Page 9
IX
18 Applying Pseudo second- order for pb(II) adsorption
onto reed shoot at 25ºC.
50
19 Pseudo second- order parameters for pb(II)
adsorption onto reed shoot at 25ºC.
51
List of Figures No. Figure Page
1.2 Phragmites Australia (common reed) 17
2.2 Phragmites from sarra purification. 18
3.3 Effect of initial metal ion concentration on the %
removal of (Fe) metal by both phragmites
25
4.3 Effect of initial metal ion concentration on the %
removal of (Cd) metal by both phragmites
25
5.3 Effect of initial metal ion concentration on the %
removal of (Cu) metal by both phragmites
26
6.3 Effect of initial metal ion concentration on the %
removal of (Ni) metal by both phragmites
26
7.3 Effect of initial metal ion concentration on the %
removal of (Pb) metal by both phragmites
27
8.3 Effect of metal ions on the percent removal of each
other by shoot samples.
30
9.3 Effect of contact time on the % removal of (Fe) metal for shoot sample.
31
10.3 Effect of contact time on the % removal of (Cd)
metal for shoot sample.
32
11.3 Effect of contact time on the % removal of (Cu)
metal for shoot sample.
32
12.3 Effect of contact time on the % removal of (Ni) metal
for shoot sample.
33
13.3 Effect of contact time on the % removal of (Pb) metal
for shoot sample.
33
14.3 Effect of solution pH on adsorption of (Fe) metal ion
by reed shoot sample.
35
15.3 Effect of solution pH on adsorption of (Cd) metal ion
by reed shoot sample.
36
16.3 Effect of solution pH on adsorption of (Cu) metal ion
by reed shoot sample
36
17.3 Effect of solution pH on adsorption of (Ni) metal ion
by reed shoot sample
37
18.3 Effect of solution pH on adsorption of (Pb) metal ion
by reed shoot sample
37
19.3 Effect of temperature on the % removal of (Fe) metal 38
Page 10
X
by reed shoot sample
20.3 Effect of temperature on the % removal of (Cd) metal
by reed shoot sample
39
21.3 Effect of temperature on the % removal of (Cu) metal
by reed shoot sample
39
22.3 Effect of temperature on the % removal of (Ni) metal
by reed shoot sample
40
23.3 Effect of temperature on the % removal of (Pb) metal
by shoot sample
40
24.3 Applying Freundlich adsorption isotherm on the
adsorption of pb(II) on reed shoot.
43
25.3 Applying Langmuir adsorption isotherm on the
adsorption of pb(II) on reed shoot.
45
26.6 Aplot graph of lnKd vs. 1/T for pb(II), adsorption onto reed
shoot.
47
27.3 Pseudo first- order adsorption kinetics of pb(II)onto
shoot.
49
28.3 Pseudo second order adsorption kinetics of pb(II) onto reed
shoot.
50
Page 11
XI
List of Abbreviation Symbol Abbreviation
Co Concentration of pb(II) in the sample solution before treatment
(µg/L Ce Concentration of pb(II)in the sample solution after treatment
(µg/L) at equilibrium FAAS Flame atomic absorption spectroscopy (FAAS): is a spectro
analytical technique to determine quantity of chemical
elements using absorption of optical radiation by free atoms in
their gaseous state.
K1 The Lagergren’s first order rate constant
K2 The pseudo second order rate constant
Kd The distribution coefficient
KF Freundlich constant which is an approximate indicator of
adsorption capacity of the sorbent (mg/g (L/mg)1/n)
KL Langmuir isotherm constant (L/mg)
L leaves parts for reed common plant
LH leaves parts for Indian phragmites plant
n Dimensionless Freundlich constant giving an indication of
how favorable the adsorption process
Qe The amount of As(III) adsorbed per gram of the adsorbent
(mg/g)
Qm Maximum monolayer coverage capacity (mg/g)
Qt Amount of adsorbate per unit mass of adsorbent at time t (min)
R The gas constant (8.314 J/mol. K)
R roots parts for reed common plant RH roots parts for Indian phragmites plant R² regression coefficient
RL Dimensionless constant separation factor
t Time
S plant shoot parts for reed common
SH shoot parts for Indian phragmites plant
ΔG° Standard free Gibbs energy
ΔH° Standard enthalpy
ΔS° Standard entropy
Page 12
XII
Study the Effect of Reed Tissues on the Adsorption of Heavy Metals
and Bacteria from Sewage Water
By
Munjeda Tahseen Salman
Supervisor
Dr. Ahmad Abu-Obiad
Co-Supervisor
Dr. Raed Alkowni
Abstract
Phragmites Australia (reed common) and the other Phragmites from Sarra
purification (leaves, shoots and roots) adsorption potential to remove Fe,
Cd, Cu, Ni, and Pb from waste water and antibacterial activity were
studied.
Initial concentration of metal ion, the effect of the presence of other
competing ions, contact time, Ph, temperature, were also studied.
Adsorption isotherms were investigated.
The results showed that the maximum percent removal of metal ions was
at 20ppm concentration, the results for all metals were Fe (77,5%) by
Phragmitesr roots from Sarra (RH), Cd(71,2%) by reed leave(L), Cu
(88%)by reed shoot (S)and reed leaves(L), Ni(93%)by reed shoot(S), and
by reed shoot. Almost all ions for lead pb were removed (97, 3%).
The optimal conditions of adsorption for lead were studied and the results
showed that the highest percent removal of metal ions for Pb(II) was
optimum at the initial concentration of 20 mg/L, a temperature range of
Page 13
XIII
25 - 40 , and a contact time range of (10-30) minutes. Flame atomic
absorption spectrometry was used to flow equilibrium concentration of
metal ions in solution.
The results of the uptake of Pb (II) by reed shoot fit well with the
Freundlich adsorption isotherm. Freundlich adsorption isotherm was found
to be more applicable for the removal pb (II) The binding of metal ions
with shoot followed a second order kinetics. The values of Gibbs free
energy were also determined.
Page 14
1
Chapter One
Introduction
Page 15
2
Chapter One
Introduction
1. Introduction
Environmental pollution is the greatest challenge facing humankind today.
Water pollution is one of these greatest challenges, the removal of
pollutants from water and soil has been long researched in the fields of
environmental science and engineering in order to find ways of
eliminating this serious problem in both, the developed and developing
worlds.(Jadia and Fulekar, 2009; Lu et al., 2010).
Water pollution may include organic contaminants such as pathogenic
bacteria and inorganic contaminants such as heavy metals.
Heavy metals are among the contaminants in the environment. Almost all
human activities have produced heavy metals as the side effect beside the
natural activities. Transmissions of these contaminants from contaminated
areas into non- contaminated areas by dust or leachates through the soil and
spreading of heavy metals containing sewage sludge are examples of this
pollution towards contamination of the ecosystems (Gaur and Adholeya,
2004).
1.1. Pollution by pathogenic bacteria.
The pollution of water resources and related diseases by water-borne
pathogen contamination are the biggest concern regarding water quality
Page 16
3
throughout the world. For almost all types of ambient water
bodies, pathogen contamination is a serious issue, making its recognition
and understanding essential.
3.4 million People each year, mostly children, die from water-related
diseases, according to the World Health Organization (WHO) (WHO
[2014]). 4000 children, according to an assessment by the United Nations
Children’s Fund (UNICEF), die each day as a result of contaminated water
(UNICEF [2014]).The world Health Organization WHO ([2010]) reports that
lack of access to clean water for over 2.6 billion people is responsible for
about 2.2 million deaths annually, 1.4 million being children. Improving
water quality can minimize the global burden of disease approximately 4%
(Pramod et al., 2014).
The pathogens of particular interest, such as staphylococcus aureus,
pseudomonas aeruginosa, Escherichia coli, protesu mirabilis and
klebsiella sp have been selected in this project because they are considered
of great health significance (Dechesne, 2006).
1.2. Sources, Fate and Behavior of Microorganisms in Water
Water sewage overflow (CSO), and non-collective sewage systems lead to
the microbial contamination of water .this contamination is of fecal nature
either to humans or from manure spreading, pit stock overflow, from
domesticated animals or from wildlife. The discharges of water treatment
plants, decontamination stations, hospitals and industries into the natural
aquatic resources are the main sources of the microbial contamination of
Page 17
4
these resources and are considered as point sources. The correlation
between pathogen concentrations and urban activities is well documented
(Jung; 2014).
The abundance of pathogens in water depend on factors such as the
contamination level, the persistence of pathogens in water bodies,
biological reservoirs (including aquatic plants and sediments) and the
ability of pathogens to be transported (Dechesne, 2006). The Knowledge of
the widespread contamination of water resources necessitate an appraisal of
the effect on human of infection caused by pathogen.
The management practices of land use and the size of the watershed also
influence the survival of microorganisms (George, 2004)
Streams flowing through areas partly or fully covered with pastures are
more contaminated than those running through forests and cultivated areas.
(Jung, 2014).
1.3 . Pollution by heavy metals
Heavy metals are naturally occurring elements in the environment and
they have a specific gravity at least five times the specific gravity of water.
The term heavy metal refers to all the metals having density over (6). For
example, Cu – 8.93, Cd – 8.65 and Pb has density of 11.34. Therefore, the
term “heavy metal” has become interchangeable with toxic metal.
(Blaylock, 2000).
The official “term toxic” metal is more valid for the group of metals such
as Cd, Cu, and Pb. This is because some of them are essential within limits
Page 18
5
for humans, animals, plants and other living organisms, but in excess, they
prove to be toxic. The chronic exposure or quantity beyond permissible
level makes them toxic for humans and other organisms. (Blaylock,
2000).
This necessitates a demand the for sequestration of toxic heavy metal
.This is due to the fact that toxic heavy metals are not biodegradable over
time and this make their accumulation in the environment a threat to both,
human health and the environment.
1.4. Sources and behavior of toxic heavy metals
Mining operations and domestic waste water effluents containing large
quantities of trace metal elements from metabolic waste, detergents or pipe
corrosion are the main sources of toxic heavy metals (Csuros and Csuros,
2002).Other sources of high content of heavy metals are storm water
runoff, industrial wastes and discharges,and sanitary landfill (Csuros and
Csuros, 2002).Beside the natural activities, almost all human activities also
have made a potential contribution to the production of heavy metals as
side effects. (Gaur and Adholeya, 2004).
Many industrial activities, such as mining, processing minerals and
chemical industries, increase harmless and non-essential metal
concentration in the water tables in the surrounding regions of their
manufacturing plants (Ho and El-Khairy, 2009). Metalliferous soils can
contain high amounts of heavy and toxic metals (Gardea-Torresdey, 2003)
Page 19
6
Most metals in their metallic or zero valence state are insoluble. Sodium is
an exception which reacts with water some metal compounds can be
dissolved in water, which may be introduced to soil and thus transferd to
the food chains, since these metals are not degradable metabolically, their
accumulation in living tissues can cause serious health effects
The researcher has selected metals (Fe,Cu,Cd,Ni,Pb) which are commonly
found as pollutants in different habitats in the water tables of Palestine.
Pb, Cu and Cd are considered as heavy metals because they have the
characteristics of forming positive ions in the solution and each has a
density more than 5 gm/cm3. Each of these metals is discussed below in
terms of their properties, significance, and toxicity and effect on health.
1.4.1. Cadmium: Cd (II)
Cadmium is a metal silvery-white color, lustrous, soft, and ductile and has
a relatively high vapor pressure. It is divalent when it is in a free condition,
and moderately active similar to other stable metals (Csuros and Csuros,
2002).It is a rare metal and it is spread uniformly in the Earth's crust with
an average concentration of 0.15 to 0.2 mg/kg. (Naja and Volesky, 2009).
Cd is more soluble in the acid medium, increasing the acidity of the
solution will increase the dissolution of suspended or sediment bound
cadmium. Cd concentration in unpolluted fresh water is found to be less
than 0.001 mg/L and in seawater 0.00015 mg/L (Naja and Volesky, 2009).
Page 20
7
Main sources of Cd pollution are industrial and municipal wastes. Cd is
used in as a protective layer for other metals, in nickel – cadmium, silver–
cadmium or solar batteries, electroplating, paint pigments, plastics, and
many other uses. (Csuros and Csuros, 2002). Current Cd production in the
world is 20,000 tones; the use of Cd is growing at a current annual rate of 5
to 10%. (Bernard and Lauwerys, 1984, Naja and Volesky, 2009). Cd is
considered as a very toxic metal because it is not an essential nutrient for
animals or humans. Even if it is absorbed in very small quantities by the
body, it can cause severe high blood pressure, heart disease and can even
lead to death (Pan et al., 2010).
Page 21
8
1.4.2. Copper (II)
Cu is a high conductor of electricity. It is a corrosion resistant metal that is
reddish brown, malleable and ductile, (Csuros and Csuros, 2002). Cu is
mainly used in plumbing and electrical conductors because it is a high
conductor of electricity. In the presence of CO2, it oxidizes slowly in air
and its surface exhibits a green color due to a film of Cu2 (OH)2 CO3
(Flemming and Trevors, 1989). It usually exists in the +2 oxidation state.
CuO – copper (II) oxide which is black, can also exist in the +1 state
Cu2O – copper (I) oxide which is red .it is essential to life as small
amounts because it plays a major role in the enzyme function as a co-
enzyme, but in large amounts,it is toxic (Abel, 2002).
1.4.3. Iron (III)
Iron, is the second most common metal on Earth, and the most widely-
used. It forms most of the Earth's core, and is the fourth most common
element in the Earth's crust. Iron is the most metal uses, more than any
other metal because it is strong and cheap. It is used to make buildings,
bridges, and pipes.
Iron as a chemical reacts with most acids, like sulfuric acid, to
make ferrous sulfate , and reacts with air and water to from rust. There are
ferrous compounds and ferric compound: ferrous compounds where iron
has two electrons taken and ferric compounds: when iron has three
electrons taken. Ferrous compounds have iron in its +2oxidation state.
Page 22
9
Ferric compounds have iron in its +3 oxidation state. Iron compounds can
be black, brown, and yellow or green. (Wang et al., 2009).
Iron compounds are used for several things. Iron (II) chloride is used to
clean water. Iron (II) sulfate is used to reduce chromates in cement. Some
iron compounds are used in vitamins. Iron deficiency is the most
common nutritional deficiency in the world. Our bodies need iron to help
oxygen get to our muscles, but it is toxic when large amounts in the form of
too many iron pills are taken into the body. (Wang et al., 2009).
1.4.4. Lead (II)
Lead (Pb) is a soft, and bluish – grey color metal; it is one of the most
common heavy elements and also the most abundant. Pb can resist
corrosion and has a low melting point of 327° C. and have two
oxidation states, +2 and +4. The main sources of pollution of pb solid
and liquid sludge wastes that participate with more than half of the Pb
contamination in the environment, mainly through landfills. The other
grate pollutant of pb is exhaust fumes of cars which cause
atmospheric pollution (Naja and Volesky, 2009).
Lead pollution increased during the industrial age and this pollution
has risen rapidly since it was added to the gasoline fuel of vehicles
.Therefore we can say lead pollution is a typical example of
anthropogenic metal pollution. (Valavanidis and Vlachogianni, 2010).
Current Pb annual production in the ward is approx. 3 million tons, of
which 40% is consumed by electrical accumulators and batteries, 20%
Page 23
10
additives in gasoline, 12% in construction, 6% in cable coatings, 5%
in ammunition and 17% in diverse uses. However, there are many
countries have stopped lead additive usage in gasoline due to
environmental hazards (Naja and Volesky, 2009). Pb has many harm
effects on the health of human, it is toxic to the human nervous
system and children are more capable to its effects. By absorption
Lead can go to the central nervous system directly from the intestinal
tract (Abel, 2002; Naja and Volesky, 2009)
1.4.4. Nickel (II)
Nickel (II) chloride is the chemical compound NiCl2.The anhydrous salt is
yellow, but the more familiar hydrateNiCl2·6H2O is green. Nickel (II)
chloride, in various forms, is the most important source of nickel for
chemical synthesis. The nickel chlorides are deliquescent, absorbing
moisture from the air to form a solution. Nickel salts are carcinogenic.
Nickel (II) chloride is irritating upon ingestion, inhalation, skin contact, and
eye contact. Prolonged exposure to nickel and its compounds have been
shown to produce cancer. (Wang et al., 2009)
1.5. Phragmites australis characteristic
Kingdom Plantae
Phylum Magnoliophyta
Class Lilliopsida
Order Cypearales
Family Poaceae
Genus Phragmites
Species Austrail
Page 24
11
Table (1.1): Scientific classification of Phragmites australis (Lansdown,
2015).
Phragmites Australia (PA) plant, also known as common reed, is a
perennial plant which is widely used and has find great interest for
remediating soils and water polluted by multi-metals, due to its ability to
thrive with rapid growth and high yields in a wide range of adverse
conditions. Furthermore, the most common reed plant species, ‘Phragmites
australis’ (PA plants) can grow in natural or artificial conditions. (Khaled
Al Akeel, 2013)
These plants are found all over the world in various habitats and
conditions. These plants are known as common reed or ditch reed in
English and Qasab/ Ghaab in Saudi Arabian Arabic.
It is found in many counties in the world; North America, Europe, the
Middle East, Africa and Australia. It is generally found in low level coastal
plains or riparian areas. This plant can reach a length to 3.5 meters and
have the ability to move oxygen through its stems to the roots. The roots
can resist difficult conditions it can grow even in moist or water logged soil
conditions.(Khaled Al Akeel, 2013; Lansdown, 2015).
1.6. Phytofiltration
The bioremediation technology is the overall term, it is include
phytofiltration and phytoremediation. Bioremediation mean using
biological agents as bacteria or plants to remove or equalize contaminants
Page 25
12
in polluted water. )Gardea-Torresdey, 1996; Volesky, 2001).
Phytoremediation: a friendly (green) technology for the environment that
uses living plants to remove contaminants from the environment or
rendering them harmless (Berti and Cunningham, 2000; Salt et al., 1994).
Phytoremediation is the efficiency and cheap technology used to extract or
remove pollutants from contaminated soil and water.
phytofiltration; the use of dead or inactivated biomass to remove heavy
metals from contaminated water (Miller, 1996; Gardea-Torresdey et al.,
2004).Phytoremediation can be achieved by phytoextraction,
phytovolatization, phytodegradation, phytostabilization, and rhizofiltration.
Rhizofiltration:is the use of the plant roots as a filter to absorb pollutants,
mainly heavy metals, from waste water (Zhu et al., 1999; Dushenkov et
al., 1995). Phytoextraction: is the direct uptake of metals from soil into the
plant roots that translocate into the upper parts of plant to be harvested later
(Cluis, 2004). Phytodegradation, also called phytotransformation, is a
contaminant extermination process, it is a Phytoextraction mechanism, but
differs in that, after the contaminants are translocated in the aerial portions
of the plant, they are converted to a less toxic form, because the plant
produced enzymes to metabolize the contaminants (Singh and Labana,
2003). Phytostabilization: is the process by which plants stabilize the
contaminants in the soil to prevent the risk of their leaching in ground
water or spreading in the air that reducing their bioavailability in the
environment (Prasad and de Oliveira Freitas, 2003).
Page 26
13
Previous experiments have shown that the dead Biomass has a good ability
to bind toxic contaminants from waste water and the dead biomass shows
better properties than living organisms. It is not affected by high
concentrations of pollutants, and needs no maintenance, in contrast to
living organisms, which are affected by high concentrations of pollutants
and need nutritional supply (Gardea-Torresdey, et al., 1996).
The demand for new material that is more efficient, inexpensive,
biodegradable, and environmentally friendly, as the use of plant material
(phragmites australis) for the purification of toxic products in aqueous
effluents has received a significant credibility in recent years (Laidani et
al., 2010).
1.7. Objective
In this research, the objective is to study and determine the potential of
phragmites Australia plant which collected from Wadi Al Bathan and
compare it with the other plant of pragmites which was taken from sewage
purification plant in Sarra to remove Pb, cu, Ni, Cd and Fe from aqueous
solution, and to investigate the optimal conditions for phytofiltration e.g.,
temperature, ph, contact time of adsorption, concentration of metal ions,
and effect of other competing ions. The kinetics of the biosorption process
and the adsorption isotherms will be explored in this study, in addition to
the testing of anti-bacterial activity for the Phragmites Australia.
Page 27
14
1.8. Novelty
Many studies have studied the use of plants and their role in contaminated
water treatment ,but few of these researched the phragmites Australia and
no previous studies have examined the leaves, stems and roots of this plant
and their ability to adsorb toxic metals and compared the amount of
removal of toxic metals from wastewater.
This research studies the adsorption of Pb (II), Cu (II), Cd (II), Ni (II) and
Fe (III), by the leaves, stems and roots of phragmites Australia at optimum
batch conditions. More focus will be given to the shoot of Phragmites
Australia.
1.9. Hypothesis
This work was managed under the hypothesis that all leaves, stem and root
of Phragmites Australia are able to adsorb certain amounts of the heavy
metals Pb(II), Cu(II), Cd(II),Ni(II)and Fe(III)from their aqueous solutions.
1.10. Previous studies
One study investigated the accumulation of nutrients and heavy metals (Cr,
Ni, Cu and Zn) in Phragmites Australia and this study Confirmed that the
accumulation generally increased toward the end of the growing season.
(Bragatoa, 2006).
Page 28
15
Another study investigated the heavy metal bioaccumulation by the organs
of Phragmites Australis (common reed) and their potential use as
contamination indicators. This study shows that the toxic threshold was
exceeded by Cr in roots. (Bonanno and Giudice, 2010)
One of the studies found that the concentration of any one metal in the
different tissues was affected by the presence of other metals. That means
there are interactions between the metals and this affects their distribution
the in tissues of Phragmites Australis. (Judith and Weisa, 2004).
Demirezen and Aksoy (2004) found that Phragmites Australis is useful to
measure concentration of heavy metals such as Iron and Manganese and the
PA plants can be used as biological indications in the determination of
environmental pressures
Another study examined the removal of cadmium from polluted water
using decaying leaves the effects of type of leaves and of the concentration
of cadmium which was researched at An-Najah University in corporation
with Birzeit University, found that reed leaves are efficient for removing
cadmium from aqueous solution. (Sayrafi and Salim, 1996).
Page 29
16
Chapter Two
Methodology
Page 30
17
Chapter Two
Methodology
2.1 Collection and treatment of biomass
Phragmites Australia plant were collected from Wadi Al Bathan field.
Plants were removed from the soil and washed, and the roots were
separated from the stems and leaves. The other samples of phragmites
were collected from the sewage Purification plant from Sarra. Washed, and
the roots, stems, and leaves, were separated. All samples were oven dried
at 37C for one week. Then the leaves, root and stem of both plant samples
were crushed separately.
Page 31
18
Figure (1.2): Phragmites Australia (common reed)
Figure (2.2): Phragmites from purification plans in Sarra.
This was followed by two parts of the experiment: The biological part
which examined the antibacterial activity for both of two phragmites plants,
and the other part in which the chemicals were analyzed to the effects of
Page 32
19
both plants on the adsorption of Cu (II), Cd (II), Ni (II), Pb(II), and Fe(III)
metals.
2.2. The experiment of Biological part:
2.2.1. Preparing Sample for Antibacterial Activity.
The dried plant material was ground to a fine powder in a blender. A
measured amount (7gm) of dried powder from phragmites australia and
6gm from the other phragmites were soaked in 100cc of methanol in a
round bottom flask and put in a shaker at room temperature for 48 h.
Another measured quantity 7gm and 6gm of dried powder for both of
phragmites were soaked in100cc of distilled water in round bottom flask
and put in a shaker at room temperature for 48 h.
Extracts of methanol and water sample were filtered using a Buckner
funnel and Whatman No 1 filter paper. The filtrate of all of the samples
was put in centrifuge.
Then methanol samples were concentrated to dryness in autoclave at (121c)
until dry methanol extract was obtained. But the water samples were put in
freezer For the antibacterial test, samples of 50 mg from each plant extract
were taken with a concentration of 10% DMSO,which was prepared and
used for antibacterial analysis.
2.2.2. Preparation Media
Mueller-Hinton Agar was prepared for this test.
Page 33
20
Media powders (36g/L) were added to sterile distilled water. Then the
media were heated to boiling to dissolve the media completely. Then the
media were poured into sterile petri dishes which were sterilized by
autoclaving at 15lbs pressure (121c) for 15 minutes, and then lifted to be
dried before being used. Holes were made using heads of sterile glass
pipettes.
2.2.3. Bacteria preparation.
At least four morphologically similar colonies were taken from
Staphylococcus aureus, Pseudomonas aeruginosa, Escherichia coli,
Klebsiella sp bacteria with sterile loop and transferred into MHA. To affect
the performance of the test, the plates were incubated in the incubator for
48hours.
2.3 Chemical parte experiment:
2.3.1. The Preparation of solutions of metals
In this part, solution of the five metals (Pb, Cu, Cd, Ni, Fe) was prepared.
Pb(NO3)2 , unhydrous(zero H2O)(2.07 gm/L) ,Cu(NO3)2. 3H2O
(2.4gm/L),Fe(NO3)3.9H2O(4.03gm/L),Ni(NO3)2.6H2O(2.90gm/L),and(N
O3)2,unhydrous (2.36gm/L) were used to prepare 100 ppm of each metals
respectively.
2.3.2. The Preparation of stock solution of metals
Page 34
21
Stock solution from the solution of each metals Pb(NO3)2 ,
unhydrous(zeroH2O)(1.2ml),Cu(NO3)2.3H2O(3.96ml),Fe(NO3)3.9H2O(4.
487ml),(NiNO)2.6H2O(4.27ml), and Cd(NO3)2 unhydrous (4ml).were
used to prepare 50ppm in (500ml/L) of each metals.
Then from the stock solution of metals, four concentrations (5ppm, 10ppm,
15ppm, 20ppm).were diluted
2.3.3. The Preparation of standardization curves.
A new 50 ppm metal particle solution was arranged day by day by
progressive mitigations of the stock 500ml solution. At that point 5, 10, 15
and 20 ppm solution were set up by weakening 25, 50.75 and 100 ml
individually from the 50 ppm standard arrangement into 250 mL
volumetric vials. Deionized water was utilized as a clear. All volumetric
vials washed with 0.1 M HNO3 before being used. The concentration of
the metal particles was trailed by measuring the absorbance of the solution
by flame atomic absorption spectrometry (FAAS). A standardization curve
of absorbance versus concentration was formed at the time of investigation.
Alignment coefficient (R²) was no less than 0.999 for all investigations.
The instruments were washed with Deionized water prior and then
afterward the examination of each sample to avoid the contamination and a
different control of 20 ppm for each metal solution was perused for all
samples.
2.4. Metals quantification
Page 35
22
The percent removal of metal particle by biomass was calculated by
applying the equations:
Where is the underlying metal particle fixation, (mg/L), and is the last
particle fixation (mg/L) after the event biosorption.
2.5. The instruments
• (ICE 3000 SERIES, Thermo Scientific) Flame atomic absorption
spectrometer with acetylene-air flame was used for absorption
measurements.
• JENWAY (3510) pH Meter was used to measure pH.
• Shaker was used to mixing the samples.
• Incubator
Page 36
23
2.6. Studied parameters
2.6.1. Effect of concentration dose
Different concentrations solution (5, 10, 15, and 20 ppm) of all metals was
fit out from their stock solutions. For each concentration (30gm) of plant
samples (leaves, stems and roots) were filed in column and (500ml) of
Page 37
24
metal ion solution were added to it. Then the extracts were saved for metal
quantification.
2.6.2 The effect of competing test.
Pb(NO3)2anhydrous(zerH2O)(0.1ml),Cu(NO3)2.3H2O(0.35ml),Fe(NO3)3.
9H2O(0.36ml),Ni(NO3)2.6H2O(0.34ml),andCd(NO3)2anhydrous(1.78ml),
were used to prepare20ppm in a l00ml flask. (30gm) of plant samples
(leaves, stems and roots) were filed in column and (500ml) of metal ion
solution were added to it. Then the extracts were saved for metal
quantification, using Flame atomic absorptions spectrometer (FAAS).
2.6.3 The effect of contact time on shoot samples.
The effect of contact time on shoot samples at binding time intervals of
15,30,60,90 and120 minutes were studied. For each time interval, the shoot
samples were mixed with 20ppm metal ion solutions, and then the extracts
were saved for metal quantification using Flame atomic absorptions
spectrometer (FAAS).
2.6.4 The effect of pH on shoot samples.
The impact of pH was studied .The plants samples were regulated to pH
values (3 – 10) by either including 0.1 M HCl or 0.1 M NaOH for each
biomass sample,
Page 38
25
The stem samples were blended with (20ppm) metal particle solutions, and
then the extracts were saved for metal quantification, using Flame atomic
absorptions spectrometer (FAAS).
2.6.5 The Effect of temperature on shoot samples.
The effect of temperature on shoot samples was investigated at different
degrees of 15, 25, 40 Co, and 60 Co. For each temperature, the stems
samples were mixed with 20ppm metal ion solutions, and then the extracts
were saved for metal quantification using Flame atomic absorptions
spectrometer (FAAS).
Page 39
26
Chapter Three
Results and Discussion
Page 40
27
Chapter Three
Results and Discussion
3.1. Results of the experiment of the Biological part:
The results of all samples of antibacterial activity test came out negative.
This means that phragmites Australia and the other phragmites from Sarra
have not had the promised effect on the pathogenic bacteria.
3.2. Results of Chemical part experiment:
3.2.1. The Effect of initial concentration
The effect of initial metals, ions concentration on their removal are shown
in the figures(3 to 7) for all metals (Fe,Cd,Cu,Ni,Pb) respectively in both
phragmites biomasses. As seen, increasing the initial metal ion
concentration for all metals lead to an increase in the percent removal of
the metal ions by both plants. At low concentration, most metal ions were
not occupying, yet the available sites of biomassand. These sites will be
occupied by increasing the concentration of these ions. The sites will be
filled to saturation. More ions have more removal. The removal is
increased by increasing the concentration. (Sayrafi and Salim, 1996)
Page 41
28
In the 20ppm concentration, as can be seen in table (6) the percent removal
for pb metal by shoot sample of Australia phragmites is the highest
percent (97,3%) .
Figure (3): Effect of initial iron metal ions concentration on the % removal
by both phragmites.
Figure (4): Effect of initial cadmium metal ions concentration on the
%removal by both phragmites.
Page 42
29
Figure (5): Effect of initial copper metal ions concentration on the
%removal by both phragmites
.
Figure (6): Effect of initial nickel metal ion concentration on the %removal
by both phragmites
Page 43
30
Figure (7): Effect of initial lead metal ion concentration on the %removal
by both phragmites.
Table (2): Effect of (5) ppm metal ion concentration on the % removal of
metals by samples of leaves, stems and roots of both phragmites biomass,
natural pH values, 25 ºC.
concentration
5 (ppm)
% Removal
of Fe
% Removal
of Cd
% Removal
of Cu
% Removal
of Ni
% Removal
of Pb
L 14,5% 14,% 74,4% 78% 86,4%
LH 36% 9,5% 74,2% 32% 64%
R 16% 34% 69% 52% 86,6
RH 59,5% 38,8% 70,0% 44% 72%
S 16% 19,4% 85,4% 24% 90,1%
SH 50% 28,2% 70,8% 40% 76,2%
Page 44
31
Table (3): Effect of (10) ppm metal ion concentration on the % removal of
metals by samples leaves, stems and roots of both phragmites, natural pH
values, 25C.
concentration
10(ppm)
% Removal
of Fe
% Removal
of Cd
% Removal
of Cu
% Removal
of Ni
% Removal
of Pb
L 15% 24.5% 78,4% 80% 86,4%
LH 49% 22% 77,2% 42% 75%
R 32% 53% 73% 62% 86,6
RH 71,5% 52,8% 71,3% 44,5% 78,8%
S 18% 28,2% 86,2% 46% 93,3%
SH 53% 39,2% 74,0% 45% 82,2%
concentration
15 (ppm)
%
Removal
of Fe
%
Removal
of Cd
%
Removal
of Cu
%
Removal
of Ni
% Removal of Pb
L 17,3% 33,3% 83.2% 83,9% 84,9%
LH 52,9% 28% 78,2% 48% 79,5%
R 36,6% 66,9% 77% 62,6% 86,9
RH 74,6% 54,8% 72,3% 46% 80,8%
S 18,6% 33,6% 87,2% 50% 94,1%
SH 56% 51,32% 75,3% 47,3% 90,1%
Page 45
32
Table (4): Effect of (15) ppm metal ion concentration on the % removal of
metals by samples leaves, stems and roots of both phragmites biomass,
natural pH values, 30min., 25C
Table (5): Effect of (20) ppm metal ion concentration on the % removal of
metals by sample leaves, stems and roots of both phragmites biomass,
natural pH values, 30min., 25C.
As can be seen in tables (2-6) the shoot of phragmite, which was collected
from Wadi Al Bathan had the most percent of removal for pb and other
metals,showing the optimum condition (PH,tempreature and contact time)
of adsorption studied for shoot samples.
3.2.2. Effect of competing test
As we know, more than one substantial metal particle is brought about by
water contamination and the presence of the accumulation of many metals
concentration
20 (ppm)
%
Removal
of Fe
%
Removal
of Cd
%
Removal
of Cu
%
Removal
of Ni
% Removal of Pb
L 40,5% 71,2% 88% 87,6% 88,5%
LH 58,5% 29,5% 80% 52,5% 83,7%
R 37,4 % 69,8% 77,4% 75,5% 93,3
RH 77,5% 66% 84% 48% 83%
S 52% 57% 88% 93% 97%
SH 60,3% 70,7% 77,5% 52,5% 92%
Page 46
33
caused interferences between them. This impact on their connecting to
biomass when existing in similar solution, as can be seen in table (6) in the
presence of all metals (Fe,Ni,Cd.Cu,pb) the percent removal of Pb is the
best Pb>Cu>Fe>Ni>Cd.
Figure (8): Effect of metal ions on the percent removal of each other by
shoot samples. Pb>Cu>Fe>Ni>Cd
Metal at 20 ppm conc
% Removal
Fe 30%
Ni 15%
Cd 6,5%
Pb 93,5%
Table(6): Effect of the presence of all metals on the percent removal of
each other by reed shoot. (3mg/mL biomass, optimum pH values (for each
metal) 25ºC
Page 47
34
The impact of competing ions is appeared to be subject to the sorption
liking of the sorbent and the metal. The results show that the binding sites
on phragmites Australia shoot have higher affinity for pb compared to that
for other metals when they are mixed together.) (Sayrafi and Salim, 1996).
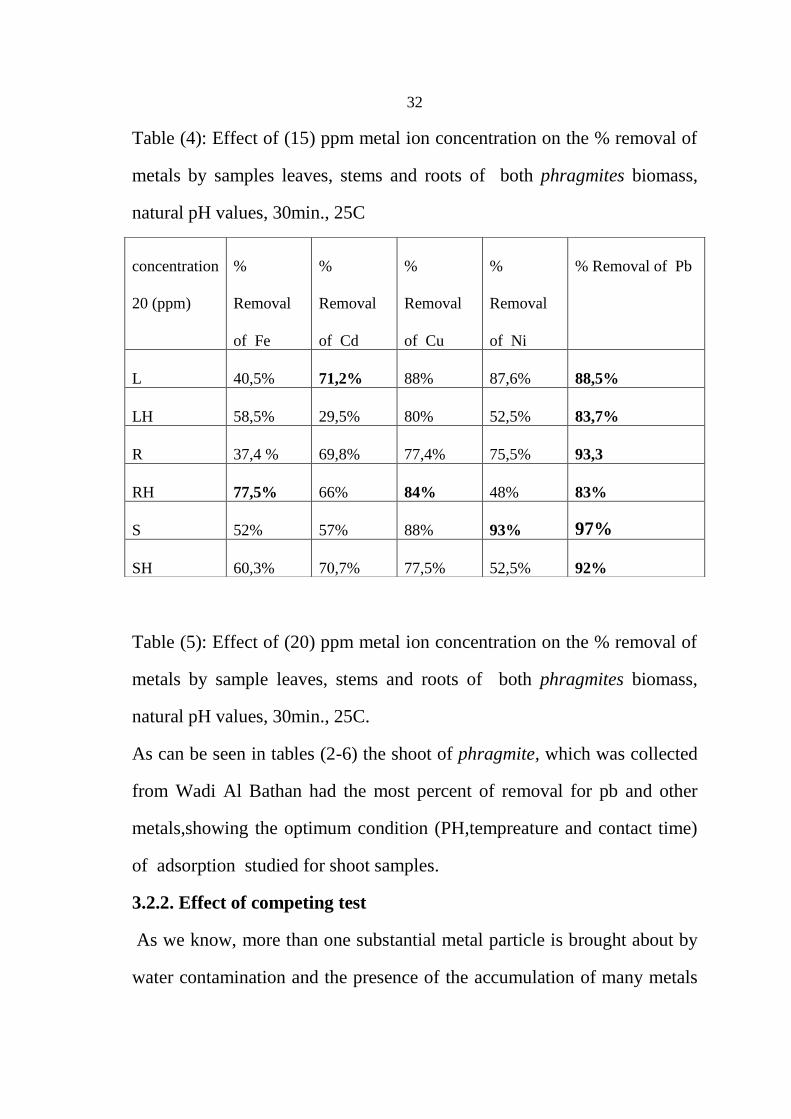
3.2.3. Effect of contact Time on reed shoots samples
A amongst the most imperative parameters that is considered for waste
water treatment applications is contact time Figures (9-13) show the
percent removal of metal ions by shoot samples of phragmites australia at
different contact times. The data is shown in tables (7).
Figure (9): Effect of contact time on the % removal of (Fe) metal for shoot
sample.
Page 48
35
Figure (10): Effect of contact time on the % removal of (cd) metal for stem
sample
Figure (11): Effect of contact time on the % removal of cu metal for stem
sample
Page 49
36
Figure (12): Effect of contact time on the % removal of Ni metal stem for
sample
Figure (13): Effect of contact time on the % removal of pb metal for stem
sample.
Time/min %Removal
of Fe
%Removal
of Cd
%Removal
of Cu
%Removal
of Ni
%Removal
of pb
15 86,3% 50% 44,4% 4,3% 86,5%
30 86,7% 90% 55% 6,5% 93,3%
Page 50
37
60 86,79% 90,3% 55,07% 5,4% 92,6%
90 86,8% 90,56 55,2% 5,45% 92,05%
120 87,0% 90,6% 55,5% 5,5% 91,90
Table (7): Effect of contact time on the % removal of metals by shoot
samples biomass, 20 ppm metal ion,PH 7, 25 ºC).
As can be seen from the tables above, results demonstrate that the percent
removal of metals is extensive at little contact times, until harmony is come
to after a specific time. At first, a lot of empty sites are accessible for
binding , however after a specific time (10 –30min), these destinations get
to be involved and soaked with metal particles, The rest of the destinations
are hard to be possessed as a result of the awful strengths that shape
between metal ions (Lu et al., 2009)
3.2.4. Effect of Solution pH
The pH of the solution has essential impact on sorption procedure as it
influences the charge on the surface of biomass in water solution. Studies
of the effect of solution pH were carried out in the pH range of 3.0 to 10.0.
Figures (14-18) shows the effect of solution pH on the amount of metal
ions adsorbed onto the shoots. From Figures 14 to 18, an increase in the
solution pH from 3.0 to 7.0 has increased the amount of metal ions (Fe,Cu,
Cd,Ni,Pb )adsorbed until pH7.0. The removal of ions was found to
decrease at pH 10.0. This can be clarified by the way that the concentration
of H particle was high at low pH. This brought about rivalry amongst H
and metal particles for dynamic locales on the surface of biosorbents. As
the solution pH expanded, the centralization of H particle in the
Page 51
38
arrangement diminished, bringing down the opposition of metal particle for
dynamic locales. (Yusoff and Kamari, 2014)
The ideal pH for adsorption of (Fe, Cu, Cd, Ni, Pb) was registered at
pH7.0. The reduction in removal at pH more than7.0 might be because of
solvation and hydrolysis of metal particle.
Figure (14): Effect of solution pH on adsorption of (Fe) metal ion by reed
shoot sample shoot sample
Page 52
39
Figure (16): Effect of solution pH on adsorption of (Cd) metal ion by reed
shoot sample.
Figure (15): Effect of solution pH on adsorption of (Cu) metal ion by reed
shoot sample.
Figure (17): Effect of solution pH on adsorption of (Ni) metal ion by reed
shoot sample
Page 53
40
Figure (18): Effect of solution pH on adsorption of (pb) metal ion by reed
shoot sample.
PH %Removal
of Fe
%Removal
of Cd
%Removal
of Cu
%Removal
of Ni
%Removal
of pb
3 20,6% 10% 30% 16,7% 76,41%
7 52% 47% 80% 93% 97,3%
10 41,39% 40,6% 71,49% 86,5% 40,6%
Table (8): Effect of PH on the % removal of metals by shoot sample
biomass, 20 ppm metal ion, 25C0
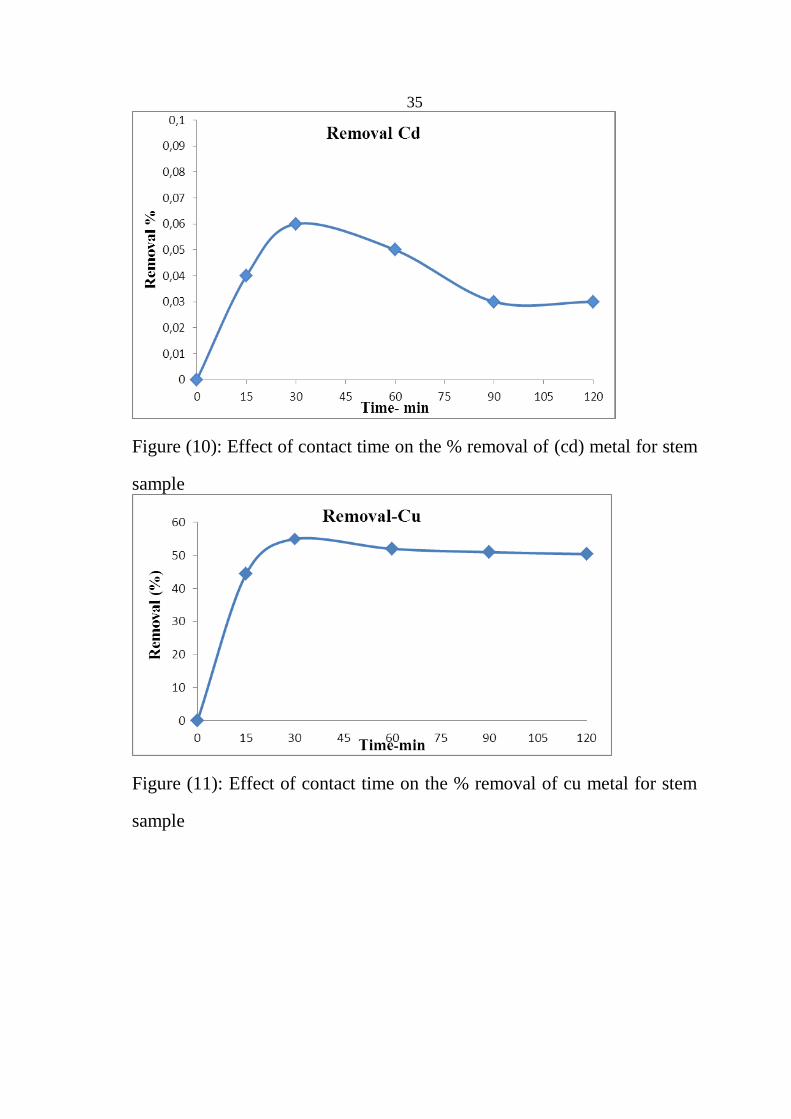
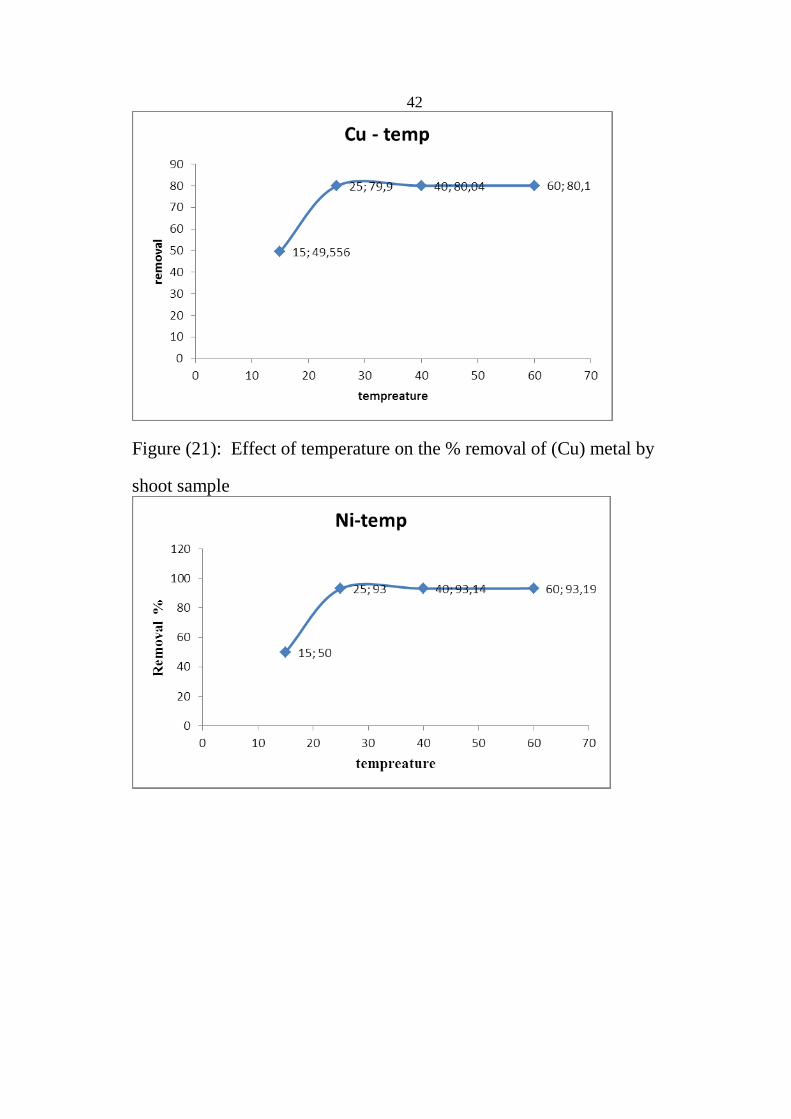
3.2.5. Effect of Temperature
Temperature is a very important parameter that has an effect on the
adsorption process, as can be seen in figures (19-23).
Page 54
41
Figure (19): Effect of temperature on the % removal of (Fe) metal by reed
shoot sample
Figure (20): Effect of temperature on the % removal of (Cd) metal by
shoot sample.
Page 55
42
Figure (21): Effect of temperature on the % removal of (Cu) metal by
shoot sample
Page 56
43
Figure (22): Effect of temperature on the % removal of (Ni) metal by
shoot sample.
Figure (23): Effect of temperature on the % removal of (Pb) metal by
shoot sample.
Tempreture %Removal
of Fe
%Removal
of Cd
%Removal
of Cu
%Removal
of Ni
%Removal
of pb
15 40,3% 15% 80,04% 50% 40
25 51,96% 49,97% 80,1% 93% 97,3%
40 52% 50% 68,75% 93,14% 97,34%
60 52,08% 50,12% 69,23% 93,19% 97,37%
Table (9): Effect of temperature on the % removal of metals by shoot
sample biomass, 20 ppm metal ion, PH (7)
Page 57
44
The rate of dissemination and spreading of metal particles on the external
layer and in the internal pores of biomass will rise by expanding
temperature. (Babarinde et al., 2006).
And as can be seen, the percent evacuation somewhat increase to breaking
point an incentive as the temperature increase. An expansion in temperature
brings about an expansion in portability of extensive metal particles, which
demonstrates that the adsorption process is endothermic. This induces to a
enormity impact inside the inner structure of biomass, that in this way,
induces the metal particles to penetrate further and increase the dynamic
essentialness of adsorbent particles, growing in the crash among adsorbent
and adsorbate iotas that results in overhauls the removal of metals from the
adsorbent surface (Guo et al., 2009).
3.3: Adsorption isotherm of pb (II).
Freundlich and Langmuir are two models used in studying the adsorption at
equilibrium that describes the characteristics of the adsorbent and the
ability in adsorption.
3.3.1: Freundlich Model:
It is an experimental connection between the concentrations of a solute on
the surface of an adsorbent to the concentration of the solute in the fluid
with which it is in contact. In 1909, Herbert Freundlich gave an expression
speaking to the isothermal variety of adsorption of an amount of gas
adsorbed by unit mass of strong adsorbent with weight (Mehdi and Mehdi,
2014).
Page 58
45
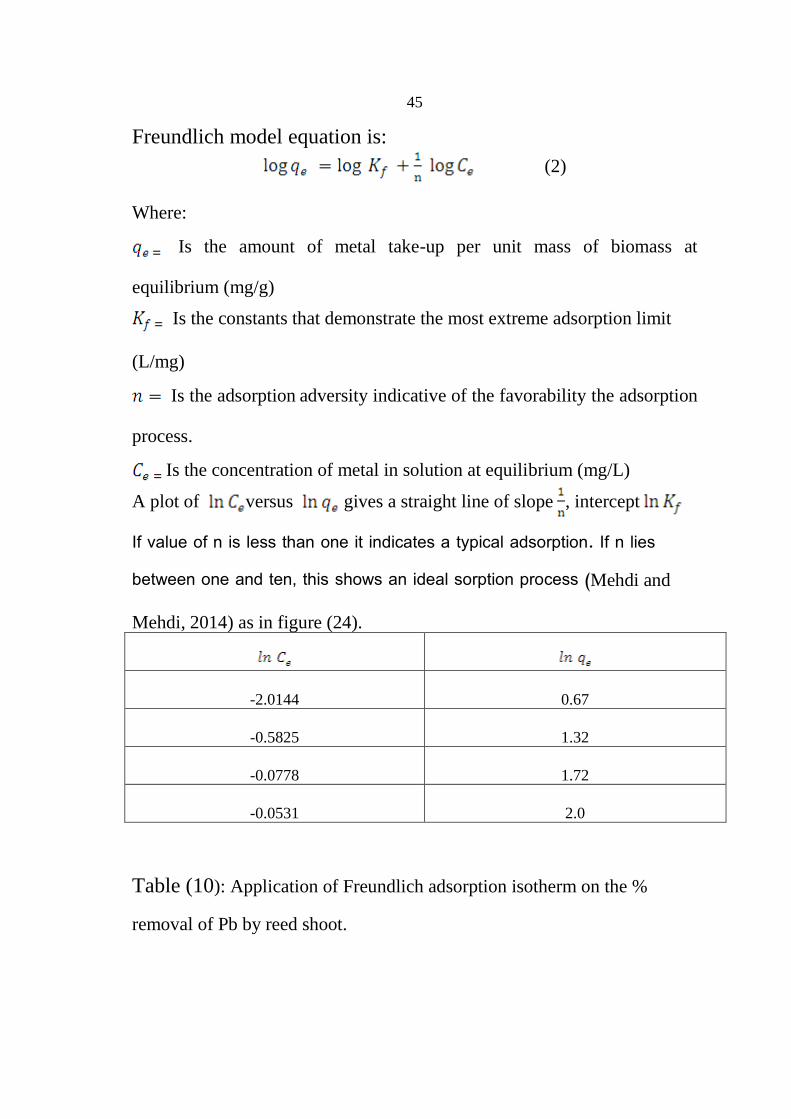
Freundlich model equation is:
(2)
Where:
Is the amount of metal take-up per unit mass of biomass at
equilibrium (mg/g)
Is the constants that demonstrate the most extreme adsorption limit
(L/mg)
Is the adsorption adversity indicative of the favorability the adsorption
process.
Is the concentration of metal in solution at equilibrium (mg/L)
A plot of versus gives a straight line of slope , intercept
If value of n is less than one it indicates a typical adsorption. If n lies between one and ten, this shows an ideal sorption process (Mehdi and
Mehdi, 2014) as in figure (24).
-2.0144 0.67
-0.5825 1.32
-0.0778 1.72
-0.0531 2.0
Table (10): Application of Freundlich adsorption isotherm on the %
removal of Pb by reed shoot.
Page 59
46
Figure (24): Aplot of lnce ves lnqe for applying Freundlich adsorption
isotherm on the adsorption of pb (II) on reed shoot.
The Parameters Freundlich isotherm model
Adsorbate Parameters
n KF=(mg∕g) R²
Reed
shoot
0.6075 1.646 1.8382 0.9264
Table (11): Parameters of Freundlich and correlation coefficient for
adsorption of pb (II) onto reed shoot.
From these values of n=1.646 > 1 and 1 ∕ n=0.6075, Freundlich
isotherm model shows that the sorption of pb (II) on reed shoot is
ideal and the R² value is 0.9264.
3.3.2: Langumir model:
This model proposes that a solitary adsorbate is adsorbed onto a
progression of proportional destinations on the surface of the
Page 60
47
solid. At the surface containing the adsorbing locales is a level
without any creases (expecting the surface is homogeneous).
Langumir equation:
(3)
Where:
Ce= the balance convergence of adsorbate (mg/L)
Qe= the measure of pb(II) adsorbed per gram of the adsorbent (mg/g)
Qm= most extreme monolayer scope limit (mg/g)
KL= Langmuir isotherm consistent (L/mg)
The estimations of Qm and KL were registered from the slope and intercept
of the Langmuir plot of Ce/Qe versus Ce. From Langmuir plots which is
appeared in Figure (24),the sum adsorbed for monolayer development
(Qm), Langmuir adsorption-desorption harmony steady (KL) and relapse
consistent (R2) were resolved and values are appeared in the table
underneath
Ce/
0.07 0.1334
0.125 0.56
0.15 0.92
0.16 0.95
Page 61
48
Table (12): Application of Langmuir adsorption isotherm on % removal of
pb by reed shoot.
Figure (25): Aplotof ce(mg/L)ves ce/qe(g/L) applying Langmuir adsorption
isotherm on the adsorption of pb (II) on reed shoot.
The parameters Langmuir isotherm model
Adsorbent Parameters
Qm(mg/g) KL=(L/mg) RL R²
Reed
shoot
0.834 0.0735 0.404 0.5995
Table (13): Parameters of Langmuir and correlation coefficient for
adsorption of pb(II) onto reed shoot .
From this data for adsorption of pb (II) on reed shoot the exploratory
outcomes were better fitted to the Freundlich condition
( as seen in figures 23 and 24 than the Langmuir
condition ( .
RL value can be calculated by the equation:
Page 62
49
(4)
Where Co is the maximum initial concentration of adsorbate (mg/L).
The estimation of RL shows the state of the isotherm to be either hard (RL
more than 1), straight (RL equal 1), great ( RL between 0and 1), or
irreversible (RL equal 0). The RL values between 0 and 1 show good
adsorption. The estimation of RL in the present examination was (0.404).
3.4: Adsorption thermodynamics
Adsorption thermodynamics were studied at various temperatures and
concentration to check conceivable adsorption systems, by utilizing
Van't Hoff plot according to equation
(5)
Where Kd is the thermodynamic balance consistant (L g-1).
The thermo chemical parameters ΔH and ΔS can be determined using
Van’t Hoff’s plot from plotting lnKd versus 1/T were ΔH=-R*slope and
ΔS=R*Intercept.
Ln kd 1/T
2.67 0.0034
1.9 0.0035
1.8 0.0032
2.0 0.003
Table (14): the values of the thermodynamic of pb(II) adsorption at various
temperature.
Page 63
50
Figure (26): the graph of lnKd versus 1/T for Pb (II) adsorption on (reed
shoot).
The outcome demonstrates that the enthalpy of adsorption H◦ was
−150.5kJ mol−1 and the entropy S◦ was 0.115 J mol−1 K−1. G◦ was
computed at different temperatures from the following equation:
(6)
Adsorbent Ho
(KJ/mol)
So
(J/mol.K)
Go
(KJ/mol)
289 K 308 K 318 K 328 K
Reed Shoot -150.5 0.115 -152.2 -153.3 -154.6 -157.4
Table (15): The parameters of the thermodynamic of pb(II) adsorption at
various temperatures.
3.5: Rate order of the adsorption process
The negative ∆Go values exhibit that the adsorption is unprompted, at these
temperatures. The negative estimations of ∆ H demonstrate an exothermic
Page 64
51
adsorption and demonstrate that the adsorption is ideal, at low temperature.
0n the other hand, the positive estimation of ∆S° prescribes that some
assistant changes occur on the adsorbent and the irregular movement at the
strong/liquid interface in the adsorption structure increment through the
adsorption system.
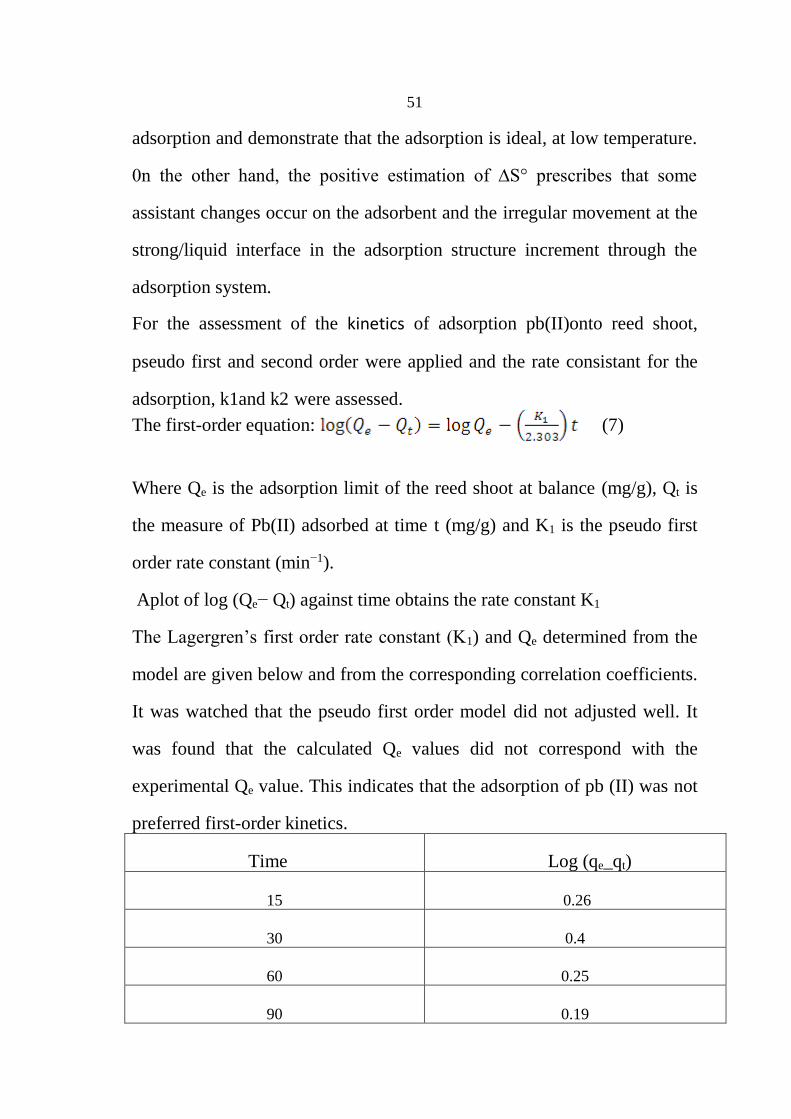
For the assessment of the kinetics of adsorption pb(II)onto reed shoot,
pseudo first and second order were applied and the rate consistant for the
adsorption, k1and k2 were assessed.
The first-order equation: (7)
Where Qe is the adsorption limit of the reed shoot at balance (mg/g), Qt is
the measure of Pb(II) adsorbed at time t (mg/g) and K1 is the pseudo first
order rate constant (min−1).
Aplot of log (Qe− Qt) against time obtains the rate constant K1
The Lagergren’s first order rate constant (K1) and Qe determined from the
model are given below and from the corresponding correlation coefficients.
It was watched that the pseudo first order model did not adjusted well. It
was found that the calculated Qe values did not correspond with the
experimental Qe value. This indicates that the adsorption of pb (II) was not
preferred first-order kinetics.
Time Log (qe_qt)
15 0.26
30 0.4
60 0.25
90 0.19
Page 65
52
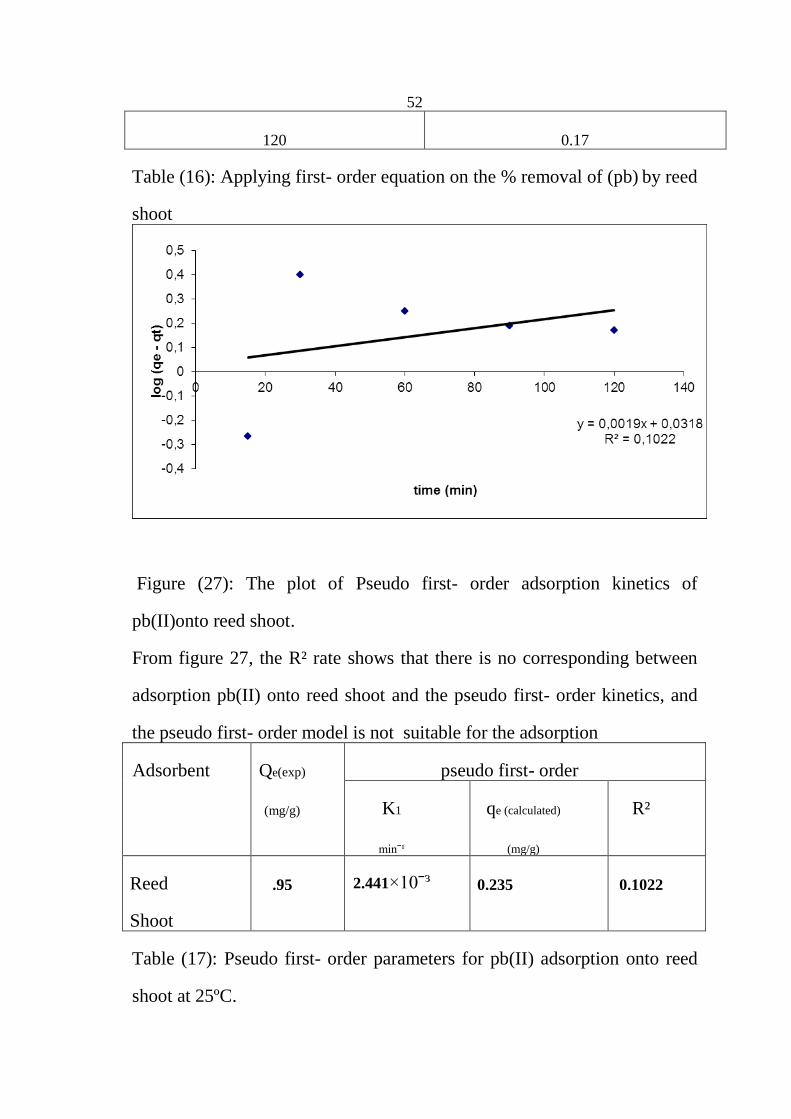
120 0.17
Table (16): Applying first- order equation on the % removal of (pb) by reed
shoot
Figure (27): The plot of Pseudo first- order adsorption kinetics of
pb(II)onto reed shoot.
From figure 27, the R² rate shows that there is no corresponding between
adsorption pb(II) onto reed shoot and the pseudo first- order kinetics, and
the pseudo first- order model is not suitable for the adsorption
Adsorbent Qe(exp)
(mg/g)
pseudo first- order
K1
minˉ¹
qe (calculated)
(mg/g)
R²
Reed
Shoot
.95 2.441×10ˉᶟ 0.235
0.1022
Table (17): Pseudo first- order parameters for pb(II) adsorption onto reed
shoot at 25ºC.
Page 66
53
The pseudo second order equation (8)
Where K2 is the pseudo second order rate constant (g mg−1min−1).
Pseudo second - order adsorption model for Pb(II) adsorption onto reed
shoot was applied and the rate constant for the adsorption K2 was
evaluated as shown in figure (28).
Time T/qt
15 5.35
30 22.4
60 40
90 56.6
120 74.0
Table (18): Applying second- order equation on the % removal of (pb) by
reed shoot.
Figure (28): plot of Pseudo second- order adsorption kinetics of pb(II)onto reed
shoot.
Page 67
54
Adsorbe qe (exp)
(mg/g)
pseudo second – order
K2
minˉ¹
qe
(calculated)
(mg/g)
R²
Reed
Shoot
0.95 6.9×10ˉᶟ 1.39 0.9881
Table (19): Pseudo second- order parameters for pb(II) adsorption onto
reed shoot at 25ºC.
As can be seen there is a harmonization between experimental and
calculated values for pseudo second order model. This means the
Pseudo second – order kinetic model accord, and it was appropriate for
the adsorption.
Page 68
55
Conclusion
These results show an efficient capability of Phragmites Australia and the
other type phragmites which from Sarra in removing all metals which were
studied in this work, and increasing the concentration of biomass leading
to an increase in the removal of metals by both plants, this study shows that
concentration (20 ppm) is the highest removal percentage.
As can be seen from results the phragmites Australia (common reed) is
more efficient, as it almost completely removed lead from the shoot
sample.
Adsorption parameters such as pH, initial concentration of metal ion,
temperature and contact time, have been to have an effect on the removal
of (Fe,Cu,Cd,Ni,Pb)The optimal percent removal of Pb ions by reed shoots
was 97,3%.The suitable conditions for binding of biomasses is at pH 7for
pb ions, initial concentration of 20 mg/L, temperature (25 -) and contact
time( 30 minutes).
The results of the uptake of Pb (II) by reed shoot fit well with the
Freundlich adsorption isotherm more than Langmuir adsorption
isotherm. And Pseudo second – order kinetic model fit better than
pseudo first order model.
Page 69
56
Recommendations
Findings in this thesis show that phragmites Australia
plants from Wadi Al Bathan can absorb multiple metals
more than the other phragmites which imports from other
country; hence it is recommended to utilize them for
pollution removal from water. And recommended to carry
out research in detail and find if this plant can be useful to
extract other metal than these metals studied in this
research.
Page 70
57
References
1. Abel, P. D., 2002, Water pollution biology, 2/e, London: Taylor and
Francis Acar, Y. B., Gale, R. J., Alshawabkeh, A. N., Marks, R. E.,
Puppala, S., Bricka, M., Parker, R., 1995, Electrokinetic remediation –
Basic and technology status, Journal Hazardous ,Matter, 40, 117 – 137
2. Adesola Babarinde, N.,A., Oyebamiji Babalola,J., Olalekan Sanni
S.,2007 Isotherm and thermodynamic studies of the biosorption of
Cd(II) from solution by maize leaf
3. Al, Akeel, k., 2013 emipircal investigation of water pollution Control
through use of Phragmites australis
4. . Bernard, A., and Lauwerys, R., 1984, Cadmium in human populations,
Experientia, 40, 143 – 152
5. Bernard, A., and Lauwerys, R., 1984, Cadmium in human populations,
Experientia, 40, 143 – 152
6. Berti, W., Cunningham, S. D., 2000. Phytostabilization of metals. IN
Raskin, I. & Ensley, B. D. (Eds.) Phytoremediation of toxic metals:
using plants to clean-up the environment. New York, John Wiley &
Sons.
7. Blaylock, M., J., and J., W., Huang. 2000, Phytoremediation of
ToxicMetals: Using Plants to Clean Up the Environment, John Wiley
and Sons Inc., New York, p. 53.
8. Bonanno, G., Guidice, R. L., 2010, Heavy Metal Bioaccumulation
by the Organs of Phragmites Australis (Common Reed) and Their
Potential Use as Contamination Indicators
Page 71
58
9. Bragatoa, C., Brixb, H., Malagolia, M., 2006, Accumulation of
nutrients andheavy metals in Phragmites australis (Cav.) Trin. ex
Steudel and Bolboschoenus maritimus(L.) Palla in a constructed
wetland of the Venice lagoon watershed Environmental Pollution
Volume 144, Issue 3, December 2006, Pages 967–975
10. Cluis, C., 2004. Junk-greedy Greens: phytoremediation as a New
Option for Soil Decontamination. BioTeach Journal, 2, 61-67.
11. Csuros, M., Csuros, C., 2002, Environmental sampling and analysis for
metals, London: Lewis publishers.
12. Dechesne, M.; Soyeux, E.; Loret, J.F.; Westrell, T.; Stenström, T.A.;
Gornik, V.; Koch C.; Exner, M.; Stanger, M.; Agutter, P.; 2006,
Pathogens in Source Water, Microbiological Risk Assessment: A
Scientific Basis for Managing Drinking Water Safety from Source to
Tap; Microrisk European Project: Nieuwegein, The Netherlands, pp. 1–
42.
13. Demirezen, D., Aksoy, A., 2004, Accumulation of heavy metals in
Typha angustifolia (L.) and Potamogeton pectinatus (L.) living in Sultan
Marsh (Kayseri, Turkey),Chemosphere, 56, 685 – 696
14. Flemming, C.A. and Trevors, J.T., 1989, Copper toxicity and chemistry
in the environment: a review, Water, Air, and Soil Pollution, 44, 143 –
158 following uptake by hybrid poplar trees. Int J Phytoremediation,
1999, 1, 139 – 51
15. Gardea-Torresdey, J. L., Cano-Aguilera, I., Webb, R., Tiemann, K. J.,
Gutierrez- Corona, F., 1996. Journal of Hazard Materials , 48, 171–180
Page 72
59
16. Gardea-Torresdey, J. L., 2003, Phytoremediation: Where does it stand
and where will it go?, Environmental Progress, 22, 1, A2 – A3 Editorial
17. Gaur,A., and Adholey,A., 2004, “Prospects of arbuscular mycorrhizal
fungi in phytoremediation of heavy metal contaminated soils,” Current
Science, vol. 86, no. 4, pp. 528–534.
18. George, I.; Anzil, A.; Servais, P. 2004, Quantification of fecal coliform
inputs to aquatic systems through soil leaching. Water Res. 38, 611–
618.
19. Gibbs, j., W., 1873, "A Method of Geometrical Representation of the
Thermodynamic Properties of Substances by Means of
Surfaces," Transactions of the Connecticut Academy of Arts and
Sciences 2, Dec. pp. 382-404 (quotation on p. 400
20. Hlavsa, M.C.; Roberts, V.A.; Anderson, A.R.; Hill, V.R.; Kahler, A.M.;
Orr, M.; Garrison, L.E.; Hicks, L.A.; Newton, A.; Hilborn, E.D.; et al.
2001 Surveillance for waterborne disease outbreaks and other health
events associated with drinking water—United States, 2007–2008.
MMWR Surveill. Summ. , 60, 1–32.
21. Ho,Y., El-khaiary, M. I., 2009, Metal research trends in the
environmental field, in Wang et al (eds) 2009 'Heavy metals in the
environment', London: CRC Press, Taylor and Francis Group
22. Jadia D, Chhotu and Fulekar, M.H.,2009, Phytoremediation of heavy
metals: Recent techniques. African Journal of Biotechnology, 8 (6):
921-928.10
Page 73
60
23. Judith, S., Weisa, T., Gloverb, P., Weis, 2004, Interactions of metals
affect their distribution in tissues of Phragmites australis Volume 131,
Issue 3, October 2004, Pages 409–41
24. jung, A.,V., Caan, P., Roig,B., Thomas, O., E., Baurès, E., Thomas,
M.,F., 2014, Review Microbial Contamination Detection in Water
Resources: Interest of Current Optical Methods, Trends and Needs in
the Context of Climate. 11, 4292-4310
25. Laidani, Y., Hanini, S., Henini, G., 2010. Valorization of Luffa for
Water Treatments Copper Chargers. Study of the Possibility of
Regeneration by Chemical Desorption. Oman, pp. 1.
26. Lansdown, R.V. 2015. Phragmites australis. The IUCN Red List of
Threatened Species e.T16449A79857020.
27. Lu, D., Cao, Q., Cao, X., Luo, F., 2009. Removal of Pb (II) using the
modified lawny grass, Mechanism, Kinetics, Equilibrium and
Thermodynamics studies. Journal Hazardous Materials, 166 (1): 239-
28. Mehdi, R., Mehdi, V., 2014, Langmuir, Freundlich and Temkin
Adsorption Isotherms of Propranolol on Multi-Wall Carbon Nanotube,
journal of modern drug discovery and drug delevary research.
29. Miller, R., 1996. Phytoremediation: Technology Overview report,
Ground Water Remediation Technologies Analysis Center.r, R., 1996.
Phytoremediation: Technology Overview report, Ground Water
Remediation Technologies Analysis Center.
Page 74
61
30. Naja, G. M., Volesky, B., 2009, Toxicity and sources of Pb, Cd, Hg,
Cr, As,, and Radionuclides in the environment, chapter 2 in Wang, L.
K., Chen, J. P., Hung, Y.
31. Pan, J., Plant, J. A., Voulvoulis, N., Oates, C. J., Ihlenfeld, C., 2010,
Cadmium levels in Europe: implications for human health, Environ
Geochem Health, 32, 1 – 12
32. Pramod, K.,Pandey, Philip, H.,Kass, Michelle, L., Soupir, S., Biswas,
and Vijay, P., Singh,2014, Contamination of water resources by
pathogenic bacteria. AMB Express. Jun 28. doi: 10.1186/s13568-014-
0051-x
33. Prasad, M. N. V., De oliveira freitas, H. M., 2003. Metal
hyperaccumulation in plants - Biodiversity prospecting for
phytoremediation technology. Electronic Journal of Biotechnology.
34. Salt, D. E., Kumar, P. B. A. N., Dushenkov, S., Raskin, I. 1994
Phytoremediation: A New Technology for the Environmental Cleanup
of Toxic Metals. International Symposium Research on Conservation
and Environmental Technology for Metallic Industry. Toronto, Canada.
35. Sayrafi,O., Salm, R., Sayrafi, S., A., 1996 ,Removal of cadium from
polluted water using decaying leaves-effects of type of leaves and of
concentration of cadium , j,Environ. Sci.Health, A31 (10), 2503-2513.
36. Singh, V., Labana, S., 2003. Phytoremediation: an overview of metallic
ion decontamination from soil. Appli. Microbiol. Biotechnol., 61, 405-
412.
Page 75
62
37. Tangahu,, B.,V., Sheikh Abdullah, S., R., H., Basri, H., Idris,
M., Anuar, N., Mukhlisin, M., 2011, Article ID 939161, 31 pages
Review Article International Journal of Chemical Engineering
38. Tsezos, M., Deutschmann, A. A., 1990. Journal of Chemical
Technology Biotechnology, 48, 29-39.
39. Valavanidis, A. And Vlachogianni. T. 2010, Metal pollution in
ecosystems: ecotoxicology studies and risk assessment in the marine
environment, Science advances on Environment, Toxicology and
Ecotoxicology issues, Available at www.chem-tox-ecotox
40. Volesky, B., 2001. Hydrometallurgy .59, 203–216.
41. Wang, L. K., Chen, J. P., Hung, Y., Shammas, N. K. (ed), 2009, Heavy
metals in the environment, Boca Raton: CRC Press
42. Yusoff, S., N., M., Kamari, A., Putra, W.P., Ishak, C.F., Mohamed, A.,
Hashim, N. and Md Isa, I.2014, Removal of Cu(II), Pb(II) and Zn(II)
Ions from Aqueous Solutions Using Selected Agricultural Wastes:
Adsorption and Characterization Studies. Journal of Environmental
Protection, 5, 289-300.
43. Zhu, Y. Z., Pilon-Smits, E. A. H., Tarun, A. S., Weber, S. U., Jouanin,
L., Terry, N., 1999 . Cadmium Tolerance and Accumulation in Indian
Mustard is Enhanced by Overexpressing g-Glutamylcysteine
Synthetase1. Plant Physiol., 121, 1169-1177.
Page 76
جامعة النجاح الوطنية كلية الدراسات العليا
دراسة تأثير نبات البوص على أمتصاص المعادن السامه ونشاط البكنيريا الموجوده في المياه الملوثة
إعداد منجدة تحسين ياسين سلمان
إشراف د.أحمد أبو عبيد
رائد الكونيد.
حصول على درجة الماجستير في العلوم البيئية بكلية قدمت هذه االطروحة استكماال لمتطلبات ال
فلسطين. -الدراسات العليا في جامعة النجاح الوطنية في نابلس 2017
Page 77
يريا الموجوده في نشاط البكتوعلى أمتصاص المعادن السامه دراسة تأثير نبات البوص على المياه الملوثة
إعدادمنجدة تحسين ياسين سلمان
إشرافبيدد.أحمد أبو ع
د. رائد الكوني
الملخصالمستخدم في محطه التنقيه في قرية في هدا البحث تم دراسة نبات البوص االسيوي والبوص
على امتصاص المعادن السامه الموجوده في المياه ما) اوراق وسيقان وجدور( وقدرتهصره في التأثيرعلى نشاط البكنيريا الموجوده فيها . ماالعادمه وعلى قدرته
وتم دراسة عده عوامل تؤثر على قدره امتصاص هدا النبات منها عامل تركيز المعادن المراد جود اكثر من معدن واحد في المياه وتاثيره على و امتصاصها من المياه العادمه وعامل
.المعادن االخرى وعامل الحراره ودرجة الحموضه للمياه العادمه واالمتصاص مع مرورالوقت المدروسين. في كال النباتين 20اظهرت النتائج ان افضل نسبه امتصاص كانت عند نركيز أمتصته جدور البوص 77:الحديد %وكانت أعلى النسب للمعادن في كال النباتين كما يلي
أمتصته اوراق وسيقان البوص 88امتصته اوراق البوص االسترالي،النحاس%71الكادميوم %على نسبه أامتصته سيقان البوص االسترالي والرصاص تم امتصاصه ب93االسترالي،النيكل%
لذلك تم دراسه امتصاص عنصر الرصاص ،يمن قبل سيقان البوص االسترال 97 وهي % .الحراراه ودرجه الحموضه والوقت تحت تأثيرظروف ومقاييس مختلفه متل
25(ودرجه حراره 20النتائج ان افضل ظروف امتصاص لرصاص هي عند تركيز) اظهرت وقد أتم متابعة تراكيز أيونات العناصر دقيقة،30الي 10( وبعد مرورو من 7مئويه ودرجه حموضه ) Fruendlich نظامالووجد ان باستخدام اللهب االمتصاص الذري باستخدام جهاز طيف
adsorption isotherm وقد تم تحديد رتبة التفاعل بين ،الرصاص إلزالة ايوناتاالفضل . ايونات العنصر والساق من الدرجة الثانيه