58
Wigan Retail and Leisure Study Wigan Metropolitan Borough Council July 2014 41374/02/PW/SMH/RHt Nathaniel Lichfield & Partners 3rd Floor One St James's Square Manchester M2 6DN

Wigan Retail and Leisure Study Wigan Metropolitan Borough Council July 2014
41374/02/PW/SMH/RHt
Nathaniel Lichfield & Partners 3rd Floor One St James's Square Manchester M2 6DN

This document is formatted for double sided printing. © Nathaniel Lichfield & Partners Ltd 2014. Trading as Nathaniel Lichfield & Partners. All Rights Reserved. Registered Office: 14 Regent's Wharf All Saints Street London N1 9RL All plans within this document produced by NLP are based upon Ordnance Survey mapping with the permission of Her Majesty’s Stationery Office. © Crown Copyright reserved. Licence number AL50684A
Wigan Retail and Leisure Study
6778763v4
Contents
1.0 Introduction 1
2.0 Retail and Commercial Leisure Trends 2
National Retail Trends ...................................................................................... 2
Leisure Trends ................................................................................................. 5
Commercial Leisure – Wigan Borough ............................................................. 6
Cinemas and Theatres ..................................................................................... 7
Health and Fitness Clubs ................................................................................. 8
Ten-pin Bowling ............................................................................................... 8
Bingo ............................................................................................................... 9
Indoor Play Centres ......................................................................................... 9
3.0 New Research: 2014 Surveys 10
Household Telephone Surveys ...................................................................... 10
In Street Surveys ........................................................................................... 11
4.0 In Street Surveys 12
5.0 Shopping Hierarchy and Retail Performance 19
The Borough and sub-Region ........................................................................ 19
Household Shopping Patterns ........................................................................ 20
Borough Shopping Patterns ........................................................................... 21
6.0 Assessment of Retail Needs 25
Methodology .................................................................................................. 25
Quantifying Capacity ...................................................................................... 27
Borough Quantitative Capacity ....................................................................... 28
Principal Town Centre - Wigan ....................................................................... 29
Main town centre - Leigh ................................................................................ 30
Main town centre - Ashton-in-Makerfield ........................................................ 32
Smaller town centres...................................................................................... 33
Atherton ......................................................................................................... 34
Golborne ........................................................................................................ 35
Hindley ........................................................................................................... 35
Pemberton ..................................................................................................... 37
Standish ......................................................................................................... 38
Tyldesley ........................................................................................................ 39
7.0 Change in Shopping Patterns: 2007 to 2014 41
Drawing Comparisons between different Research ........................................ 41
Borough-wide Shopping Patterns ................................................................... 41
Borough-wide Capacity 2014 – 2026 ............................................................. 42

:
6778763v4
8.0 Conclusions 48
Shopping Patterns 2014 ................................................................................. 48
Retail Capacity Assessment ........................................................................... 49
Meeting Shopping/Leisure Needs in Wigan Borough ..................................... 49
Leisure Assessment Conclusions ................................................................... 50
Retail Assessment Conclusions ..................................................................... 51

Wigan Retail and Leisure Study
6778763v4
Tables
Table 3.1 Study Area Survey Zones .............................................................................. 10
Table 3.2 Location and Quantity of In-Street Surveys .................................................... 11
Table 5.1 MHE Retail Ranking ....................................................................................... 20
Table 5.2 Convenience Retail Market Share in Wigan Borough (2014) .......................... 22
Table 5.3 Comparison Retail Market Share in Wigan Borough (2014) ........................... 23
Table 6.1 Quantitative capacity for additional convenience and comparison retail
floorspace - Wigan ......................................................................................... 29
Table 6.2 Survey derived turnover of main foodstores compared with expected trading
levels ............................................................................................................. 29
Table 6.3 Quantitative capacity for additional convenience and comparison retail
floorspace - Leigh .......................................................................................... 30
Table 6.4 Survey derived turnover of main foodstores compared with expected trading
levels - Leigh .................................................................................................. 31
Table 6.5 Quantitative capacity for additional convenience and comparison retail
floorspace - Ashton-in-Makerfield ................................................................... 32
Table 6.6 Survey derived turnover of main foodstores compared with expected trading
levels – Ashton-in-Makerfield ......................................................................... 32
Table 6.7 Survey derived turnover of main foodstores compared with expected trading
levels - smaller town centres .......................................................................... 33
Table 6.8 Quantitative capacity for additional convenience and comparison retail
floorspace - Atherton ...................................................................................... 34
Table 6.9 Quantitative capacity for additional convenience and comparison retail
floorspace - Golborne..................................................................................... 35
Table 6.10 Quantitative capacity for additional convenience and comparison retail
floorspace - Hindley ....................................................................................... 36
Table 6.11 Quantitative capacity for additional convenience and comparison retail
floorspace - Pemberton .................................................................................. 37
Table 6.12 Quantitative capacity for additional convenience and comparison retail
floorspace - Standish ..................................................................................... 38
Table 6.13 Quantitative capacity for additional convenience and comparison retail
floorspace - Tyldesley .................................................................................... 39
Table 8.1 Convenience Capacity by Centre ................................................................... 49
Table 8.2 Comparison Capacity by Centre .................................................................... 49

Wigan Retail and Leisure Study
6778763v4
Appendices
Appendix 1 CINeSCOPE North West Regional Focus
Appendix 2 Study Area Adopted
Appendix 3 Household Survey Results (RMG Clarity and NEMS Market Research)
Appendix 4 Economic Tables – Retail Capacity

Wigan Retail and Leisure Study
6778763v4 P1
1.0 Introduction
1.1 Wigan Metropolitan Borough Council (the Council) commissioned Nathaniel
Lichfield & Partners (NLP) to prepare a borough-wide retail and leisure study.
The study is required to assess the current convenience and comparison retail
and leisure offer and to quantify the need for new floorspace over the period
covered by the Wigan Local Plan Core Strategy (the Core Strategy), adopted
September 2013. It is undertaken having regard to the requirements set out in
the National Planning Policy Framework (NPPF) and the Planning Practice
Guidance. The study updates the evidence base, replacing the Wigan Borough
Retail and Leisure Study of 2007 (the 2007 study) and a subsequent 2009
Capacity Assessment Update (the 2009 update). This new study is written to
inform policy development and application across the borough.
1.2 This 2014 study:
1 assesses retail patterns and expenditure ‘leakage’ and quantifies the
performance of centres/destinations;
2 assesses the future need and capacity for retail floorspace in the
borough over the period to 2026;
3 considers whether current retail provision is meeting the demands of
borough residents and whether there is a need to increase competition
and/or influence the retail mix;
4 advises on how any identified quantitative and qualitative need for new
convenience and comparison retail floorspace might be best met over the
period to 2026;
5 advises on potential threats to the future retail health of the borough and
town centres;
6 includes a desk-based analysis of existing commercial leisure provision
and assesses potential future requirements;
7 compares commercial leisure provision in Wigan with provision in other
administrative areas that have the potential to divert leisure spending
away from Wigan Borough; and
8 provides a comparison with the findings of the 2007 study and 2009
update regarding performance of retail destinations across the borough,
the need and capacity for new retail floorspace and quality of leisure
provision.

Wigan Retail and Leisure Study
P2 6778763v4
2.0 Retail and Commercial Leisure Trends
National Retail Trends
2.1 The economic downturn is still having a significant impact on the retail sector.
A number of national operators have failed (e.g. Barratts, Blockbuster, Borders,
Clinton Cards, Comet, Firetrap, Game, Habitat, HMV, JJB Sports, Jessops, La
Senza, Land of Leather, MFI, Past Times, Peacocks and Woolworths), leaving
major voids within centres and retail parks. That said, and despite well-
documented concerns about a proliferation of non-retail uses, initiatives
including encouraging temporary/’pop-up’ businesses and the innovative use of
space have in some centres delivered positives from an increasing number of
voids.
2.2 Consolidation is also occurring. Argos recently announced the closure of a
significant number of shops in its portfolio. Many town centre development
schemes are delayed or abandoned. The demand from traditional retail
warehouse operators is also reduced. B&Q is in the process of reducing the
size of its ‘Warehouse’ format store, with the surplus floorspace being
promoted for occupation by foodstore operators including Morrisons and
Sainsbury’s. The B&Q Frith Street (Newtown) store is an example of this
planned consolidation.
2.3 Some of the main food store operators have seen a reduction in growth, with
planned schemes delayed or abandoned. The principal large foodstore
operators are developing fewer new stores, and those built-out tend to be of a
smaller scale than the superstore that typified development programmes of the
previous decade. Heightened popularity amongst consumers for the ‘deep
discount’ operators is resulting in the other principal operators focussing
attentions on competing in this budget sector.
2.4 Assessing future expenditure levels within this study needs to take into account
the effects of the economic downturn and the slow rate of recovery, particularly
in the short term. Careful consideration is needed to establish the appropriate
level of expenditure growth to be adopted over the Core Strategy period. This
study takes a long term view for the Core Strategy period recognising the
cyclical nature of expenditure growth. Trends in population growth, home
shopping/internet sales and growth in turnover efficiency also need to be
carefully considered and a balanced approach taken.
Expenditure Growth
2.5 Historic retail trends indicate that expenditure grows consistently in real terms,
generally following a cyclical growth trend. The underlying trend shows
consistent growth and is expected to continue in the future. However, the
recent economic downturn led to negative growth at its deepest point and a
recent trend of limited growth is expected to continue in the short term ahead
of upturn and recovery as part of the cyclical process.

Wigan Retail and Leisure Study
6778763v4 P3
2.6 In the past, expenditure growth fuelled growth in retail floorspace, including
major out-of-centre development in the 1980s and 1990s. The economic
downturn slowed growth considerably and a return to previous levels of growth
is unlikely to be achieved, at least in the short term. However, the underlying
trend over the medium and long term is expected to lead to a need for further
retail floorspace. NLP anticipates these national trends will be mirrored in
Wigan Borough.
New Forms of Retailing
2.7 New forms of retailing have emerged in recent years as an alternative to more
traditional high-street shopping. Home/electronic shopping has expanded
considerably with increasing growth in the use of personal
computers/tablets/mobile phones and the internet. Smart phone technology,
Apps, QR (Quick Response) codes, internet-connected glasses and other
technological advances are set to increase the proportion of shopping
transactions undertaken remotely. Trends within this sector will have
implications for retailing within Wigan Borough.
2.8 The growth in home computing, smart phone usage and interactive TV is likely
to lead to a growth in remote shopping and will have further effects on retailing
in the high street. Food retailers are developing and operating so-called ‘dark
stores’, from which goods are picked and delivered, but there is not any access
to the public.
2.9 Whilst online shopping has experienced rapid growth since the late 1990s, the
latest available data suggests it remains a limited proportion of total retail
expenditure. Recent trends suggest continued strong growth in this sector,
albeit there is still uncertainty about its longer-term prospects and the potential
effects on the high street. Experian Retail Planning Note 11 (September 2013)
states:
“Non-store retailing continues to grow rapidly, outpacing traditional forms of
spending. We retain our assumption that non-store retailing will increase at a
faster pace than total retail sales well into the long term. There were 52.7
million internet users in the UK (representing 84.1% of the population) in mid-
year 2012 according to Internet World Stats. So growth of the internet user
base will be less of a driver than in the past decade. But growth momentum will
be sustained as new technology such as browsing and purchasing through
mobile phones and the development of interactive TV shopping boost internet
retailing. We expect that the SFT market share will continue to increase over
the forecast period, although the pace of e-commerce growth will moderate
markedly after about 2020. Our forecast has the SFT share of total retail sales
reaching 17.4% by 2020 rising to 20% by the end of the 2020s.”
2.10 This study makes an allowance for future growth in e-tailing based on Experian
projections.
2.11 The implications on the demand for retail space are unclear. Some retailers
and particularly foodstores operate online sales from their traditional retail

Wigan Retail and Leisure Study
P4 6778763v4
premises. Growth in online sales may not always mean that there is a
reduction in the need for retail floorspace.
2.12 Given that internet shopping is likely to continue increasing in proportional
terms, despite uncertainties over the nature and magnitude of growth, this
assessment adopts relatively cautious growth projections for retail expenditure.
Retail Operators
2.13 In addition to new forms of retailing, operators have also responded to
changing customer requirements e.g. extended opening hours and Sunday
trading increasing significantly in the 1990s. Retailers have also responded to
stricter planning controls by changing their trading formats. Some major food
operators introduced smaller store formats capable of being accommodated
within town centres, such as the Morrison’s ‘M Local’, Tesco ‘Express’ and
‘Metro’, Sainsbury ‘Local’ and M&S ‘Simply Food’ formats. Asda has moved
into the smaller store market through the acquisition of Netto. Food operators
have also entered the local convenience store market, including Tesco
‘Express’ and M&S ‘Simply Food’ convenience stores linked to petrol filling
stations. The expansion of European discount food operators continues and at
rapid pace, building upon sustained growth in last decade. This trend is evident
in Wigan Borough, with Aldi and Lidl currently trading from 10 stores.
2.14 Foodstore operators have a rolling programme of store extensions and
reinvigoration, particularly Asda, Sainsbury’s and Tesco. Since 2012, Tesco in
particular has concentrated on refreshing its existing stores, rather than
pursuing new build. The main foodstore operators, faced with potential
saturation in the grocery market, attempted to increase the sale of non-food
products within their foodstores, including clothing and electrical goods. The
recent recession halted this trend, is now reversing it and is part of the reason
why consolidation and down-sizing are strategies being employed by the
foodstore operators.
2.15 Comparison retailers have also responded to recent market conditions. The
bulky goods retail warehouse sector has rationalised and operators have
scaled down store sizes, amidst a climate of mergers and failures. Other
traditional high street retailers, including Boots, Poundstretcher and TK Maxx,
have sought large out-of-centre stores. The charity shop sector has grown
steadily over the past 20 years and there is no sign that this trend will halt. The
discount comparison retail sector has also grown significantly in recent years
with major expansion from the likes of 99p Stores, B&M Bargains, Family
Bargains, Home Bargains, Poundland, Poundstretcher and Quality Save.
2.16 The economic downturn has had, and is likely to continue to have, an impact
on the retail sector; a sector that failed to protect itself properly against shifting
economic conditions. Within town centres, many high street multiple
comparison retailers have changed their format. High street national multiples
have increasingly sought larger modern shop units (over 200 sq. m) with an
increasing polarisation of activity into the larger regional and sub-regional
centres. The food operators have returned to town centre with their smaller

Wigan Retail and Leisure Study
6778763v4 P5
format convenience stores, and the growth in the charity and discount sectors
has led to a reoccupation of vacant floorspace. Short term, the pop-up shop
and permissive temporary change of use has the potential to reduce vacancy
rates and increase footfall. Longer term, retail to residential permitted
development rights and a single town centre use class are initiatives which
could bring about further change in the character of town centres.
Leisure Trends
2.17 The demand for commercial leisure facilities has increased significantly during
the last 25 years. The growth in the commercial leisure sector was particularly
strong during the late 1980s and again in the mid-1990s. Average household
expenditure on leisure services increased in real terms by 93% between 1984
and 1995 (source: Family Expenditure Survey), and by a further 48% between
1995 and 2005. The sector has experienced more limited growth since 2005.
Many analysts consider that the commercial leisure market has reached
saturation in some sub-sectors, such as bingo, large format multiplex cinemas
and tenpin bowling. The economic downturn since 2008 has curbed further
growth in leisure spending and this sector is an early casualty of reduced
disposable income, albeit the concept of the ‘staycation’ has delivered positive
repercussions for the domestic commercial leisure industry.
2.18 The mid-1990s saw the expansion of major leisure parks which are generally
anchored by a large multiplex cinema and offer other facilities such as ten-pin
bowling, bingo, nightclubs, health and fitness clubs, themed destination
restaurants, pub/restaurants, children’s nurseries and budget hotels.
Commercial leisure facilities have typically been located on the edge of town
centres or in out-of-centre locations, with good road access. Many leisure uses
have also emerged as part of or adjacent to retail warehouse parks. Robin
Park in Wigan Borough is an example of this.
2.19 The cinema market remains an important sector as this is often an anchor
leisure use and provides footfall for other uses. Operators such as City Screen,
Mainline Pictures and Reel Cinemas have opened new cinemas or taken over
small cinemas in recent years.
2.20 Digital projection has driven a trend towards development of cinemas with
fewer screens, and town centre locations are back in vogue. Town centre
cinemas tend to occupy a smaller footprint and are typically developed
alongside other commercial businesses, including cafés, bars and restaurants.
Eagles Meadow in Wrexham is a good example of a commercial development
scheme in a central area anchored by a cinema, as it the extension to intu
Potteries in Stoke-on-Trent. The planned redevelopment of the
Galleries/Marketgate shopping centre in Wigan town centre is following the
same trend.
2.21 In November 2012 Cineworld acquired the arthouse cinema chain
Picturehouse, which operates from 21 locations. The acquisition of
Picturehouse extended the Cineworld Group portfolio to over 120 venues. In
Wigan Retail and Leisure Study
P6 6778763v4
2013, Cineworld confirmed that it is on track to open a further 25 locations by
the end of 2017 with new picture houses opening in Glasgow, Gloucester and
Wembley by the end of 2013. In January 2014 Cineworld secured expansion
internationally, in Eastern Europe and Israel, when it purchased 100 multiplex
cinemas from the Cinema City International (CCI) portfolio.
2.22 Odeon is also continuing investment to improve and expand its estate, which
has recently included a new food and drink partnership, with Costa Coffee
opening outlets in cinema foyers. Cineworld has introduced Starbucks outlets
at a number of sites.
2.23 Vue has also identified further opportunities for multiplex cinemas in the UK,
with the intention to explore new acquisition opportunities.
2.24 Although the private health and fitness market has remained strong, it is the
no-contract, budget operators such as easyGym, Pure Gym and The Gym
Group that are currently seeking premises across the UK and continue to grow
rapidly. This is evidenced in Wigan where in 2012 Xerciseforless purchased a
15 year lease to operate from the former MFI retail warehouse on Chapel
Lane. DW Sports Fitness and Total Fitness also operate gym facilities in
Wigan. The economic downturn and squeeze on disposable income has had
an impact on established multiple operators, most notably Fitness First, which
was recently forced to close a number of outlets as a result of falling
membership revenues.
2.25 Since the late 1990s the high street has seen a significant increase in the
number of cafés, coffee shops and sandwich emporia. This includes the Caffé
Nero, Costa Coffee and Starbucks coffee shop chains and sandwich providers
Eat, Pret a Manger and Subway, alongside a growth in high-end independent
retailers. A 2012 report predicts that increased competition from brands such
as Harris and Hoole and Greggs Moment would lead to a 25% growth in coffee
shops over the next five years. Tesco entering the takeaway market with its
Tesco Express Food to Go chain will provide greater competition in this sector.
2.26 A trend for ‘posh’ fast food, started by the likes of Gourmet Burger Kitchen, has
extended into the independent sector and is delivering new vibrancy to some
high streets, but may be short-lived.
Commercial Leisure – Wigan Borough
2.27 NLP has completed a desk-based study of the commercial leisure uses in
Wigan Borough, setting this in context with provision in locations outside of the
borough that has the potential to divert expenditure away from facilities in
Wigan.
Catchment Potential
2.28 Commercial leisure facilities outside of ‘destination’ attractions attract the
majority of their trade from residents living within 20 minutes’ travel time.
Large leisure facilities which typically include an offer such as multiplex

Wigan Retail and Leisure Study
6778763v4 P7
cinema, ten-pin bowling, ice rink and family entertainment centre tend to be
developed as large out-of-centre leisure parks as they require a large
catchment population. That said, there is a marked trend away from out-of-
centre leisure facilities with cinema-led mixed use developments returning to
town centres on the back of advances in digital screening technology meaning
that a greater number of smaller cinemas can be operated efficiently.
2.29 The 2012 population of Wigan Borough is estimated at 317,800. The
catchment area for facilities in the borough is likely to extend beyond its
boundary and leisure facilities in neighbouring authority areas will also draw
residents of Wigan out of the borough for leisure activity. Middlebrook Retail
and Leisure Park has a cinema and bowling alley and is located fewer than 10
minutes from Aspull. The Trafford Centre with a range of leisure facilities is
within a 20 minute drive of Leigh.
2.30 The regional centres of Manchester and Liverpool offer extensive leisure
opportunities and will draw people out of Wigan Borough to use such facilities.
Cinemas and Theatres
2.31 Within the Wigan Borough boundary there are currently two multiplex cinemas.
Empire is located at Robin Park and there is a Cineworld in Leigh. Data from
the NLP VeNU1 database shows that the Empire cinema has 11 screens and
2,548 seats2 and that Cineworld has 7 screens and 1,3062. Opening of
Cineworld Leigh post-dates publication of the 2007 study, which identified
capacity for a new multiplex cinema in the borough. Proposals for
redevelopment of The Galleries/Marketgate in Wigan town centre include a
seven screen cinema3.
2.32 There are other multiplex cinemas within 20 minute drive from Wigan which
include an Odeon at the Trafford Centre, a Vue at Middlebrook Retail Park and
a Cineworld in St Helens.
2.33 Cineworld in Didsbury (Manchester) is the nearest cinema to Wigan Borough
with ‘D-Box’ chairs installed. The chair is designed to move and vibrate using
state of the art technology to introduce a new cinema experience. Enhanced
cinema experience may well attract residents of Wigan to travel beyond its
boundaries to access entertainment facilities.
2.34 Attached at Appendix 1 is NLP ‘CINeSCOPE’4 intelligence for the North West
region. The North West focus of the CINeSCOPE model maps the location and
scale of existing, committed and proposed cinema outlets, and using
population density data identifies potential ‘hotspots’ for future provision. Wigan
Borough is not identified as a hotspot, but the conclusions of CINeSCOPE
should be viewed in context with potential latent demand. The results of the
household surveys that inform this study identify that the Morrisons foodstore
1 NLP VeNU is a comprehensive living database of cinemas and screens
2 NLP Venu database
3 Planning application submitted June 2014
4 NLP CINeSCOPE is a cinema capacity model for UK locations informed by NLP Venu and demographic data and trends

Wigan Retail and Leisure Study
P8 6778763v4
in The Galleries shopping centre is used as a main-food shopping destination
and there is strong evidence to suggest that it attracts a high proportion walk-in
trade. The cinema at Robin Park is not realistically walkable from the town
centre and there is not a direct public transport link. This suggests that there
might be latent demand for cinema provision in the central area, where it is
accessible as a walk-in destination and by public transport.
2.35 Chorley is identified, and there is potential for new cinema provision in the
higher order Wigan town centre to address this identified shortfall in provision.
Capacity is also identified in Bolton and Oldham; two towns where
commitments exist.
2.36 Wigan Little Theatre, at the edge of Wigan town centre, stages traditional and
contemporary productions.
Health and Fitness Clubs
2.37 The 2007 study identifies 27 health and fitness clubs in the borough. The
study identifies that up to four additional health and fitness clubs could be
accommodated over the period to 2027.
2.38 The Wigan Life Centre including a 25 metres swimming pool and fitness suite
opened in 2011 on the site of the former Olympic pool.
2.39 The health and fitness clubs identified in the 2007 study are still operational.
The DW Sports and Fitness Club at Robin Park is the former JJB Health and
Fitness Club.
2.40 Since the 2007 study was published the Council has received a significant
number of planning applications proposing new health and fitness clubs in
Wigan, which have met with approval. Schemes include the provision of gyms,
dance studios and swimming pools with most health and fitness developments
contributing towards larger mixed-use proposals.
Ten-pin Bowling
2.41 In 2007 there were two ten-pin bowling alleys in Wigan: Leigh Superbowl at
Windermere Road; and AMF Bowling at Wallgate, Wigan. Leigh Superbowl
closed in 2010 and proposals have come forward for a change of use to non-
food retailing.
2.42 The 2007 study identified a lack of requirement for additional bowling lanes in
the borough, noting an oversupply in the sector; the closure of AMF bowling
substantiates this. The impact of the economic downturn on levels of
disposable income suggests that any capacity for growth in the ten-pin bowling
sector will be in the longer term.
2.43 Nationally, commentators have coined the term ‘Boutique bowling’ for the re-
invention of ten-pin bowling delivered alongside ‘posh’ fast food. ‘All Star
Lanes’ and ‘Dog Bowl’ in Manchester are examples of ‘Boutique bowling’
facilities. The pairing of these facilities with an upmarket food and drink offer

Wigan Retail and Leisure Study
6778763v4 P9
has given ten-pin bowling a makeover and a much needed twist to begin to re-
establishing its image in the leisure market.
Bingo
2.44 Consistent with the 2007 study, there are three large-format registered bingo
halls in Wigan Borough (BJs Bingo, Leigh, Gala, Crompton Street, Wigan and
Gala, Robin Park). The 2007 study identified capacity for up to five additional
bingo halls in the study area over the period to 2027 having regard to trend
based growth in patronage.
2.45 The 2007 study referred to the smoking ban as a key factor in stalling bingo
operators from bringing forward new sites. Since 2007 the Council has not
received any applications for new bingo facilities, extensions or improvements
which indicates a potential stagnation in this sector.
Indoor Play Centres
2.46 The 2007 study did not include a section commenting upon provision in Wigan
of indoor play centres. This perhaps reflects the limited number of such
facilities at the time. Since 2007 there has been a marked rise in the number of
such facilities nationally, which are seen as a key growth area in the
commercial leisure sector.
2.47 Originally indoor play centres were primarily provided as enticement to chain
operator family pub-restaurants but in recent years the independent operator
has started to dominate the industry. In Wigan there is a Wacky Warehouse
attached to the Red Robin Pub at Robin Park; this facility follows the more
traditional indoor play format as it is associated with a food and drink
establishment. Wigan also has Gioco play centre, Rumble Tumble, Bizee Kids
and Pipsqueaks play café which are all independent indoor play businesses.
2.48 The Council has seen a significant number of applications for indoor play
centres since 2007. This is consistent with the national trend which has seen
steady and sustained growth in this area of the leisure industry.

Wigan Retail and Leisure Study
P10 6778763v4
3.0 New Research: 2014 Surveys
Household Telephone Surveys
3.1 In March 2013 RMG Clarity conducted a household telephone survey to inform
a planning application for a foodstore proposal at Frith Street, Wigan5. RMG
Clarity conducted 1,000 telephone interviews across 11 of the 15 sub-zones
from the 2007 study, including two sub-zones in the West Lancashire
administrative area. In March 2014 NEMS market research carried out a
second telephone housing survey, conducting 400 telephone interviews across
the four sub-zones excluded from the RMG Clarity survey. The two household
surveys utilised the same questionnaire and their combined findings inform this
study. The plan at Appendix 2 illustrates the study area and the fifteen sub-
zones. Table 3.1 details the postcode sectors in each sub-zone.
Table 3.1 Study Area Survey Zones
Survey Zone Postcode Sector(s)
1.Wigan WN1 1, WN1 2, WN1 3,
WN3 4, WN3 5, WN 50, WN6 7
2.Pemberton WN3 6, WN5 7, WN5 8, WN5 9
3.Shevington WN6 8, WN 6 9
4.Standish WN6 0
5.Aspull WN2 1
6.Ince WN2 2
7.Hindley WN2 3, WN2 4
8.Platt Bridge WN2 5
9.Ashton-in-Makerfield WN4 0, WN4 8, WN4 9
10.Golborne WA 3/1, WA 3/2, WA 3/3
11.Leigh WN 7/1, WN 7/2, WN 7/3, WN 7/4, WN 7/5
12.Atherton M46/0, M46/9
13.Tyldesley M29/7, M29/8
14.Parbold and Wrightington WN8 0, WN8 7
15.Skelmersdale WN8 6, WN8 8, WN8 9
3.2 The study area and sub-zones used in this 2014 study are consistent with
those used in the 2007 study and 2009 update.
3.3 The new household survey questionnaires are similar to the household survey
questionnaire used with the survey that informs the 2007 study and the 2009
update. There is scope for an assessment of any material changes in shopping
patterns and a comparison is provided later in this report. Appendix 3 includes
the questionnaire and raw results of the household surveys. Commentary on
shopping patterns is provided in Section 4.0 and the results inform the capacity
assessments at Section 6.0.
5 Proposal by B&Q Plc/WM Morrison Supermarkets Plc for the subdivision and part occupation by a Morrisons store of the
existing B&Q Warehouse at Frith Street Wigan (Application Ref: A/14/78931)

Wigan Retail and Leisure Study
6778763v4 P11
In Street Surveys
3.4 In May 2014 the Community Engagement Team at the Council carried out 280
surveys across eight town centres in the borough. Golborne is the only centre
that the Council did not survey. Table 3.2 shows the number of surveys carried
out and how these were split geographically.
Table 3.2 Location and Quantity of In-Street Surveys
Town Centre Number of Surveys
Wigan 64
Leigh 36
Ashton-in-Makerfield 51
Atherton 20
Tyldesley 21
Standish 32
Hindley 12
Pemberton 44
Total 280
3.5 The surveys were all carried out Monday to Wednesday between the hours of
9.00am and 4.00pm. The timing of the survey work is likely to have excluded
some key groups, particularly individuals who work Monday to Friday or those
who use the town centres in the evening or at the weekend.
3.6 The in-street surveys undertaken can provide a broad understanding of retail
and leisure patterns but should be treated with caution and given limited weight
in plan making and the determination of planning applications due to the
constraints of the survey. A greater number of surveys undertaken at
weekends, evenings in addition to during the week would give a better
understanding of shopping and leisure trends would provide a more
representative sample for analysis.
3.7 Section 4.0 summarises the main findings of the in-street surveys.

Wigan Retail and Leisure Study
P12 6778763v4
4.0 In Street Surveys
Wigan
4.1 In total there were 64 surveys completed in Wigan town centre with 40 of these
people stating that Wigan was the closest town centre to where they live. The
greatest proportion of people surveyed in Wigan had arrived by car (27)
although a large number had travelled by bus (22) and most others arrived by
foot (10). Just two people used the train.
4.2 Those who drove used a variety of car parks and as such there was no car
park which stood out as the main parking destination for people visiting Wigan.
4.3 A large number of people surveyed had travelled fewer than 20 minutes
(70.3%) to get to Wigan town centre. Although the remainder (29.7%) had
travelled over 20 minutes which is more than any of the other centres in Wigan
Borough.
4.4 The most common reasons cited for visiting Wigan are for food and grocery
shopping (12) and clothes/shoe shopping (12). This was closely followed by
work/school/college (11) which might be over represented due to the timing of
the surveys. Nobody surveyed stated that their main purpose for visiting Wigan
was for bulky goods shopping, or to visit the market.
4.5 Of those surveyed 60.9% planned to stay for fewer than two hours with 10.9%
intending to stay all day. Although this does not specify whether they are
staying all day for shopping, leisure or work.
4.6 Interestingly 54.7% of people surveyed said that they visit the town centre
much more frequently than they did five years ago. There were 19 people
(29.7%) who visit about the same. Therefore just 15.6% of people visit less
frequently or stated they didn’t visit five years ago. This would indicate that
Wigan has become a town centre visited with a greater frequency now than
was the case five years ago. This mirrors a general trend of a return to
shopping activity being undertaken with a greater frequency.
4.7 There were a significant number of people who said that they did not seek out
sport/fitness activities (73.8%). However, of those who did 69% visited Wigan
at least once a week with 19% identified destinations elsewhere as providing
for their nightlife activities.
4.8 In terms of entertainment 36 (62.1%) of people surveyed did not participate in
this activity. Of the 22 people who did there were 11 who visited Wigan less
than fortnightly and four who visited elsewhere.
4.9 There were 11 people who visited Wigan town centre for nightlife. There was
no dominant frequency of visits to the town centre for this purpose and just two
people visited elsewhere.

Wigan Retail and Leisure Study
6778763v4 P13
4.10 It is of note that those who stated they visited elsewhere may well be visiting
another centre within Wigan Borough, although this level of detail is not
captured by the surveys.
4.11 People who stated that they visited elsewhere were asked why. Many didn’t
know but the main reason across all activities was that there were better
alternatives elsewhere. No one suggested that Wigan town centre was
unattractive for sport, entertainment or nightlife. Only three said fear of crime
made them go elsewhere.
4.12 Very few people stated that they visited Wigan town centre in the evening at
all. 88.9% of people surveyed said they didn’t visit Wigan in the evening for
sport or fitness. Of those who did visit for sport, entertainment or nightlife, the
frequency of visits is low. Of those who did visit the town centre in the evening
just 14.5% stayed for over four hours.
4.13 When compared to other centres Wigan fairs quite well on most criteria.
However a small number of people did state that Wigan is worse or much
worse than other centres across all categories. Entertainment, evening and
night time safety as well as car parking prices were most commonly identified
as poor.
4.14 When asked what improvements they would make to Wigan town centre
respondents’ top suggestions were free car parking (24), more places to eat
(21) and more high quality retailers (15). Only one person suggested improved
accessibility for pedestrians.
Leigh
4.15 There were 36 surveys undertaken in Leigh. Leigh was noted as the nearest
town centre to the greatest proportion of respondents’ homes. The majority of
people travelled to the town by bus (13), with 12 arriving by car and seven by
foot.
4.16 Spinning Gate Shopping Centre was identified by the greatest proportion of
shoppers using a car park, with 46.7% of all people visiting the town centre by
car parking there. Of those surveyed, 19.4% travelled over 20 minutes and the
rest took less time to get to Leigh.
4.17 The main reason for visiting the centre was for food and grocery shopping (18)
with very few visits for other purposes. The majority of people in Leigh town
centre planned to spend fewer than two hours there (86.1%) with no-one
intending to spend the full day. Only 2.9% of all respondents said they typically
spent over four hours in the town centre.
4.18 Only one person stated that they visit the town centre less frequently than 5
years ago with everyone else visiting the same amount or more frequently.
4.19 Very few people visit Leigh town centre during the day for sport (2),
entertainment (7) and nightlife (2). Most people said they did not do these
activities at all with only one person saying that they go elsewhere for nightlife.

Wigan Retail and Leisure Study
P14 6778763v4
4.20 During the evening only one person visited Leigh town centre for sport, two
people visited for entertainment and two for nightlife. Of all the people
surveyed, 33 people didn’t do any of the activities.
4.21 15 people said that the choice of shops was worse than in other centres and
12 thought the quality of shops was worse. Other factors fared better with the
range of services and accessibility by public transport performing well.
4.22 The respondents suggested a range of improvements that they wanted to see
in Leigh. More specialist shops and free car parking were the most frequently
offered although just nine people suggested each of these improvements.
Ashton-in-Makerfield
4.23 There were 51 people surveyed in Ashton-in-Makerfield with the majority of
visitors living nearest to Ashton-in-Makerfield than any other centre. The most
common mode of transport to access Ashton-in-Makerfield was car (17) with
13 travelling by foot and 10 coming as a passenger in a car. Of those who
drove the majority parked in the Gerrard Centre/Co-op car park (15).
4.24 Very few people travelled over 20 minutes to get to Ashton-in-Makerfield
(3.9%) with everyone else travelling for no longer than twenty minutes and the
majority of people (66.7%) travelling fewer than 15 minutes.
4.25 The most frequently occurring reason for visiting Ashton-in-Makerfield was for
food and grocery shopping (20) followed by a large number of people visiting
the market (18). Other common reasons include clothes and shoe shopping,
using the bank or post office as well as visiting the library. No one surveyed
was in Ashton-in-Makerfield for work, school or college.
4.26 Very few people said they visit Ashton-in-Makerfield for sport, entertainment or
nightlife. There were 10 respondents who stated that they visited elsewhere for
sport, entertainment and nightlife. The main reason for this was that there were
better alternatives in other centres. It is not specified whether these other
centres are within Wigan Borough.
4.27 There were five respondents that said they typically spend more than four
hours in Ashton-in-Makerfield centre in the evening but the greatest proportion
(25) did not visit in the evening at all.
4.28 Ashton-in-Makerfield was described as worse or much worse than other
centres on a large number of criteria. The main weaknesses were identified as
the choice and quality of shops, the range and choice of pubs and restaurants
and the shopping environment. Car parking provision and prices both
performed well. The most commonly made suggestions for improvement were
more specialist shops and more places to eat.

Wigan Retail and Leisure Study
6778763v4 P15
Atherton
4.29 There were 20 people that completed the survey in Atherton and 86.7% said
Atherton was their nearest centre to home. The majority walked (11) and six
travelled by car to get to Atherton. No one cycled.
4.30 Everyone interviewed travelled for fewer than 15 minutes to get to Atherton
with only two people taking more than 10 minutes.
4.31 The main reasons for visiting the town centre were food and grocery shopping
or visiting the bank or post office. No one said that they visited the centre for
any form of comparison retail goods shopping or any social or leisure activities.
The majority of people (70%) spent less than an hour in the centre.
4.32 There were three people who said they visited the centre less frequently than
was the case five years ago, whilst the remainder visited the centre the same
or more frequently.
4.33 No one said they visited the centre for entertainment during the day, one
person visited for sport and two people came for nightlife. Respondents who
said they went elsewhere said it was because there were not enough facilities
in Atherton. This trend was the same in the evening with people citing that
there were not enough facilities as the main reason they didn’t visit Atherton.
4.34 Respondents ranked Atherton as broadly comparable with other centres. In
terms of improvement, the most commonly offered suggestions were higher
quality retailers, more specialist shops and more leisure activities.
Tyldesley
4.35 21 people in Tyldesley completed the survey with the majority stating Tyldesley
to be nearer to home than any other centre. The most frequently used modes
of travel were car and by foot with two people arriving by bike.
4.36 The majority of people travelled for fewer than 10 minutes (61.9%) with no one
travelling over 15 minutes. Most people were visiting the centre for food and
grocery shopping with a lesser number intending to use a bank or post office or
visit a chemist.
4.37 No one intended to stay for more than two hours with 47.6% people staying for
fewer than 30 minutes.
4.38 There were six (28.6%) people who visited less frequently than five years ago.
4.39 Most people either didn’t participate in sport, entertainment or nightlife activities
or chose alternate centres. The main reason cited for visiting elsewhere was
that other centres had better facilities; although five people did say they visit
Tyldesley at least fortnightly. This trend was similar in the evening with people
visiting elsewhere due to better facilities.
4.40 Tyldesley was considered to be about the same as other centres across the
criteria queried, although eight people considered the quality and choice and

Wigan Retail and Leisure Study
P16 6778763v4
shops to be worse than other centres. At least one respondent considered the
centre to be worse or much worse than other centres on all criteria. The most
frequently cited improvement suggested was more specialist shops although
there was encouragement for a broad range of other improvements.
Standish
4.41 There were 32 people surveyed in Standish with the majority identifying
Standish as the nearest town centre to their home. Most of the respondents
travelled by foot (18), with 12 travelling by car and one using a bike. The Co-
operative car park was cited by the greatest number of interviewees as the
favoured place to park.
4.42 Most people travelled for fewer than 20 minutes although 12.5% of
respondents had travelled over 20 minutes. The main reason for visiting the
centre was for food and grocery shopping as well as using the bank. No one
was visiting for comparison retail goods shopping and just one person cited
social or leisure activities.
4.43 One person said they were visiting for the day and two said half a day. The
majority were planning to spend fewer than 30 minutes (23).
4.44 Interestingly no one said they visited Standish less frequently than five years
ago.
4.45 There were nine respondents who visited Standish in the day for social activity,
seven who visited for entertainment and one who visited for sport. Many didn’t
participate in these activities at all. There were slightly more people visiting
Standish in the evening than in the day for sport, entertainment and nightlife.
Most people who visit in the evening spend fewer than two hours in the centre.
4.46 The responses to the quality of Standish compared with other centres was
finely balanced between those that considered it to be worse and those that
considered it to be better. There were 12 respondents that said car parking
provision and leisure facilities were worse than other centres. Day time safety
and car parking prices were considered to be better. The most commonly
identified potential improvement was reducing traffic congestion (17).
Hindley
4.47 There were 12 people surveyed in Hindley and all of these lived nearer to
Hindley than any other centre. The majority of people travelled by foot (8). Of
those who drove the most commonly cited car park used was Tesco. No one
travelled over 20 minutes and most people travelled for fewer than five
minutes.
4.48 The sole reason for visiting the centre was for food and grocery shopping with
no other reasons cited other than one respondent visiting a bank/post office.
No one intended to spend more than two hours with 50% of people spending
fewer than 30 minutes.
Wigan Retail and Leisure Study
6778763v4 P17
4.49 A third of people said they visit less frequently than they did five years ago.
Only one person visited the centre during the day for entertainment. People
who visited elsewhere did so given the availability of alternative destinations.
4.50 Five people considered evening and night time safety to be worse than in other
centres. Hindley was otherwise considered about the same as other centres.
More quality retailers was the most commonly mentioned improvement
suggested by respondents.
Pemberton
4.51 There were 44 people surveyed in Pemberton and the majority lived nearest to
Pemberton. There were 19 people who travelled by car and 17 who came on
foot. The most commonly cited car park was Church Street (8) with a greater
proportion of people parking on street (14). Most respondents (84.1%) spent
fewer than 10 minutes travelling to the centre.
4.52 The main reasons for travelling to the centre were for food and grocery
shopping as well as visiting a bank/post office. The greatest proportion of
people were spending up to two hours in the centre although three people
intended to spend all day. Just five people visited the centre less frequently
than they did five years ago.
4.53 Most respondents visited elsewhere for sport, entertainment and nightlife due
to the level and quality of provision in Pemberton. There were seven people
who visited the centre in the day for entertainment and six who visited for this
purpose in the evening. It was most common to spend fewer than two hours in
the centre for these activities.
4.54 Pemberton was identified as being worse or much worse than other centres for
entertainment and leisure facilities. There were 18 people who said the centre
was much worse than other centres for leisure facilities. The main
improvements suggested were more shops and more leisure activities.
Summary
4.55 Overall those surveyed in each centre were there because they lived closest to
that centre than any other. The most commonly identified form of transport was
car although a significant number of people travelled on foot or by bus. There
were very few people who had travelled by bike or train.
4.56 Outside of Wigan and Leigh very few people travelled to the centre for
purposes other than food and grocery shopping. The majority of people
travelled for fewer than 15 minutes (73.6%) and intended to stay in the centre
for fewer than two hours (84.7%).
4.57 Most people said they visited the centre they were in at least as frequently or
more frequently than five years ago (73.4%).
4.58 A significant proportion of people visit elsewhere for sports, entertainment or
nightlife activities and the main reason for this is the quality and lack of facilities
Wigan Retail and Leisure Study
P18 6778763v4
in the centres themselves. Of all respondents 56.4% don’t visit centres in the
evening at all.
4.59 The choice and quality of shops across the centres were cited the most as
worse than other centres. In contrast, range of services, cleanliness and
accessibility by public transport were considered better. The most commonly
cited potential improvements identified were more specialist shops, more
quality retailers and reducing traffic congestion.

Wigan Retail and Leisure Study
6778763v4 P19
5.0 Shopping Hierarchy and Retail Performance
The Borough and sub-Region
5.1 Wigan Borough is located within Greater Manchester and borders the
administrative areas of Bolton, Salford, St Helens, Warrington, West
Lancashire and Chorley.
5.2 Wigan is the largest town in Wigan Borough and is one of the major sub-
regional town centres within Greater Manchester. Wigan is designated in the
Core Strategy as a Principal Town Centre. Wigan provides a wide range of
shopping, service, leisure, business and public administration facilities that
meet the day-to-day needs of borough residents. The town has a good mix of
convenience and comparison retailers albeit the comparison retail offer is
impacted by proximity to the sub-regional centres of Liverpool and Manchester
and the Trafford Centre. Robin Park located outside of Wigan town centre also
attracts a significant proportion of comparison retail shopping from residents of
the borough.
5.3 Leigh is the second largest town in the borough and has a generous and varied
retail convenience offer alongside a more limited range of comparison retailers
and service uses. The Core Strategy designates Leigh as a Main Town Centre.
The principal role of the town centre is to serve residents of Leigh area and the
wider south-eastern part of the borough.
5.4 The other designated Main Town Centre in the borough is Ashton-in-
Makerfield. Whilst Ashton in Makerfield does not have as comprehensive an
offer as the larger centres of Wigan and Leigh, it does have a range of
independent retailers alongside businesses meeting essential everyday
shopping needs and providing access to services.
5.5 There are six smaller town centres in Wigan Borough and a number of local
centres, designated in the Core Strategy. The six town centres are Atherton,
Golborne, Hindley, Pemberton, Standish and Tyldesley. The smaller town
centres offer every-day retail goods and services and are geared towards
meeting day-to-day convenience retail goods needs.
5.6 The network of local centres perform a primarily top up shopping role alongside
food a drink offers spanning Class A3 to A5.
5.7 Management Horizon Europe’s (MHE) UK Shopping Index 2008 ranks retail
centres across the country. The MHE index rank for town centres in Wigan
Borough and competing centres in other administrative areas is shown in Table
5.1 below.

Wigan Retail and Leisure Study
P20 6778763v4
Table 5.1 MHE Retail Ranking
Centre Rank (2008) Rank (2003/04) Change Classification
��������� � � � ��������
�������� �� �� � ��������
�������� �� �� � ������ �����
������ ��� � � ���� ����
!��� ��� �� "� �� �� �����
#����� ��� ��� �� �� �����
#�� �"� ��� �� ��$ � �����
������ ��� ���� ��� ��� �����������
������ �� ��� ���� �� ��� �����������
���� �������������� � !��� !�� �!�� � ����
Source: Management Horizons Europe Shopping Index (2008)
5.8 The MHE score does not necessarily reflect the overall size of the town centre
or the number of shops, but the presence of national multiples and the relative
draw and importance that stores have. Each centre is given a weighted score
which takes account of its provision of multiple retailers and anchor store
strengths. For example, anchor department stores such as John Lewis or
Debenhams receive a higher score (10) than other multiple operators such as
H&M (3) in order to reflect their major influence on non-food shopping patterns.
5.9 A location which has stronger retailers who attract more visitors to the centre
and have a greater influence on shopping patterns will receive a higher score
than those that do not. Towns with a greater number of independent shops
may have a low MHE score in relation to their overall size because of the
weight that is given to national multiple retailers and their influence on
shopping patterns.
5.10 MHE ranks Wigan as the main centre in Wigan Borough and 60th of all centres
in the UK. Wigan is below Manchester, Liverpool and Southport but above
Warrington, Bolton and Bury. Wigan has climbed the rankings over the period
since 2003/04 and the opening of The Grand Arcade in 2007 will most likely
have elevated Wigan still further above its 2008 position; The Rock opening in
Bury is likely to have had the same effect. Leigh is identified as a Major District
centre and is ranked 314th nationally with other centres in the borough ranking
much lower; Atherton (1018th) and Ashton-in-Makerfield (1247th). This reflects
the hierarchy of the centres in Wigan and the relative importance of Wigan as
the principal town centre in the borough.
Household Shopping Patterns
5.11 A plan of the study area adopted is included at Appendix 2. The study area is
postcode sector based and as such does not follow administrative boundaries
precisely. The study area is split into 15 sub-zones with 12 that approximate
well to the boundary of Wigan Borough. Zones 14 and 15 are in West
Lancashire and the boundary between West Lancashire and Wigan divides
Zone 3 into two parts.

Wigan Retail and Leisure Study
6778763v4 P21
5.12 It is typical for convenience retail habits to result in shoppers utilising a number
of destinations for such purposes. The household surveys reflect this by asking
residents their primary main food and primary top-up convenience retail
shopping destinations. The NLP analysis of the household survey assumes
that 70% of available consumer expenditure is directed to main food shopping
and 30% is directed towards top up shopping. This split is informed by
Experian demographic information and local retail characteristics.
5.13 There is not a set formula for splitting convenience retail expenditure by main
and top-up food shopping but the NLP approach is robust and reflective of
standard practice in the completion of retail and town centre studies. The
analysis of the household telephone surveys excludes ‘internet’/’mail-order’
responses and ‘don’t know’/’don’t buy’ answers except where, in the primary
main-food sector, internet spending on food goods is apportioned to stores
based upon proximity to home address and the fascia identified by those
interviewed.
5.14 The comparison retail spending power of the study area is split amongst six
categories of goods. The division of comparison retail goods spending power
is:
• Clothing and Footwear – 25%
• Electrical Appliances – 16%
• Furniture – 12%
• DIY – 11%
• Health and Beauty – 11%; and
• Recreation (Books, CDs and Toys) – 25%
5.15 In common with the convenience retail goods assessment, there is not a set
formula for splitting expenditure amongst different categories of comparison
retail goods. NLP considers that its approach is robust and consistent with
standard practice, as the proportion of expenditure directed to different
categories of goods is informed by Experian demographic information.
5.16 The analysis below is based upon interviewees’ responses to detailed
questioning about: main food and top up food shopping; and comparison
shopping across the six categories of comparison retail goods.
5.17 The economic tables at Appendix 4 combine the main-food and top-up
shopping patterns, to arrive at overall convenience shopping patterns in the
study area. The same approach is adopted for the comparison retail sector,
where shopping patterns across the six categories of goods are combined to
provide an overall picture of comparison shopping patterns.
Borough Shopping Patterns
5.18 Zones 14 and 15 are outside of the administrative boundary of Wigan Borough
and Zone 3 is part within and part outside of the borough. The more populated
part of Zone 3 is within Wigan Borough and it is reasonably included within an

Wigan Retail and Leisure Study
P22 6778763v4
assessment of borough-wide performance. The retail shopping patterns below
exclude the findings for Zone 14 and 15 to record retention within the borough.
Later analysis of performance across retail destinations in the borough
includes all zones within the study area.
Convenience Retail Shopping Patterns
5.19 Table 5.2 sets out market shares in the convenience retail sector at 2014.
Table 5.2 Convenience Retail Market Share in Wigan Borough (2014)
Centre Market Share (%)
Ashton in Makerfield 2.8
Atherton 3.5
Golborne 0.4
Hindley 4.2
Leigh 5.1
Outside Leigh Defined Town Centre 16.6
Pemberton 0.9
Standish 1.0
Tyldesley 2.6
Wigan 5.9
Outside Wigan Defined Town Centre 6.2
Other Destinations in Wigan Borough 41.7
Wigan Borough Total 91.0
Leakage 9.0
Source: RMG Clarity Household Survey March 2013 / NEMs Household Survey March 2014
5.20 The 91% retention of convenience retail expenditure within Wigan Borough is
very strong.
5.21 Destinations in and around the defined Leigh Town Centre6 are visited by the
greatest proportion of borough residents for convenience retail shopping
(21.7%). This includes destinations in the defined Town Centre6, Lidl and
Tesco stores at the edge of this defined area (at Spinning Jenny Way) and out-
of-centre destinations at Atherleigh Way.
5.22 Destinations in and around the defined Wigan Town Centre6 attract a
significant proportion of convenience retail shopping trips in the borough
(12.1%)7.
5.23 Asda Robin Park attracts 11.9% of convenience retail expenditure generated in
the borough8.
5.24 The market shares of Golborne (0.4%), Pemberton (0.9%) and Standish
(1.0%) are very low. The level of expenditure retention broadly reflects size of
centre with the exception of expenditure retained at destinations within and
outside of the defined Leigh Town Centre6 which is particularly pronounced
6 2006 UDP defined Town Centre
7 Destinations in an around Wigan town centre includes Tesco at Central Park Way
8 Asda Robin Park is included in Table 5.2 under ‘Other Destinations in Wigan Borough’
Wigan Retail and Leisure Study
6778763v4 P23
(21.7%). This is due to the abundance foodstores in this area which include
Aldi, Asda, Lidl, Marks and Spencer, Morrisons, Sainsbury’s and Tesco.
5.25 Convenience retail expenditure retention in Wigan Borough (main food and
top-up) is highest in Zone 1 Wigan (99.6%) and Zone 11 Leigh (99.2%). The
majority of expenditure generated by residents of Wigan Borough (55.0%) is
directed to free-standing stores outside of defined town centres9 including
those at Central Park Way, Robin Park and Marus Bridge in Wigan, Makerfield
Way in Ince and Atherleigh Way/Spinning Jenny Way in Leigh.
5.26 The proportion of convenience retail expenditure retained across sub-zones
that make up Wigan Borough is consistently high, indicating its residents are
well provided for in the food retail sector. The patterns recorded in those zones
that are outside of the borough suggest that convenience retail stores in the
borough draw limited convenience retail expenditure from beyond the
administrative boundary.
Comparison Retail Shopping Patterns
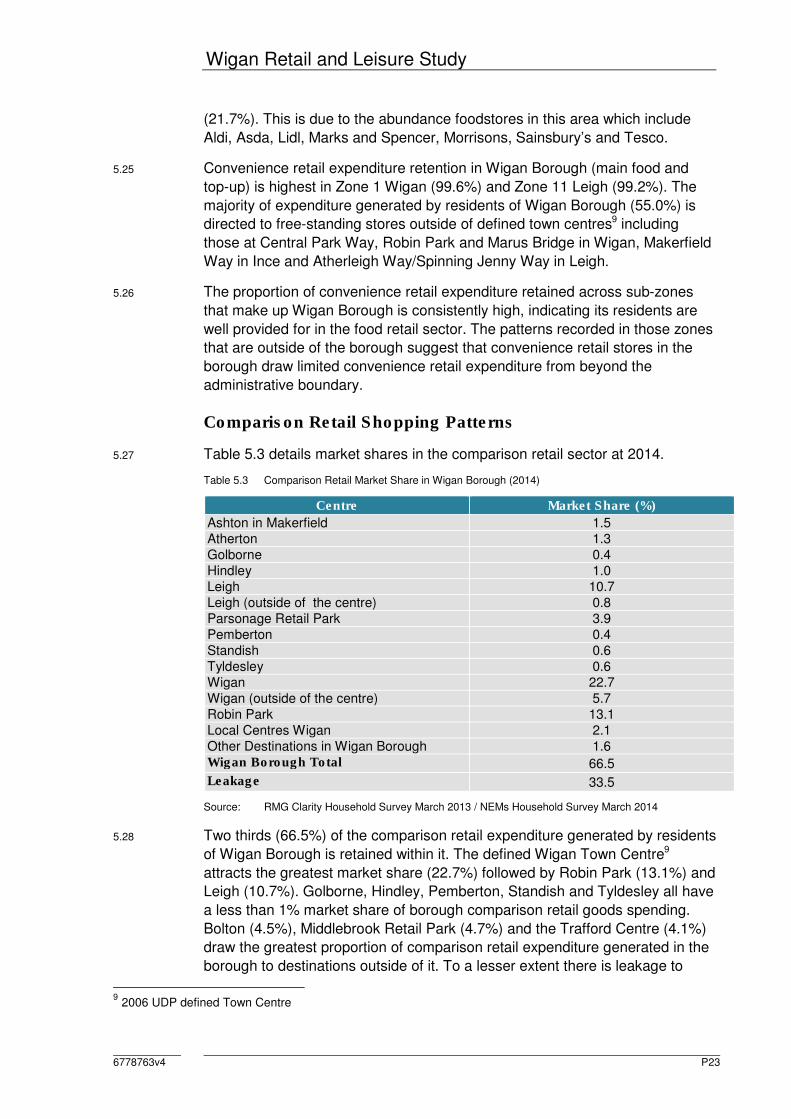
5.27 Table 5.3 details market shares in the comparison retail sector at 2014.
Table 5.3 Comparison Retail Market Share in Wigan Borough (2014)
Centre Market Share (%)
Ashton in Makerfield 1.5
Atherton 1.3
Golborne 0.4
Hindley 1.0
Leigh 10.7
Leigh (outside of the centre) 0.8
Parsonage Retail Park 3.9
Pemberton 0.4
Standish 0.6
Tyldesley 0.6
Wigan 22.7
Wigan (outside of the centre) 5.7
Robin Park 13.1
Local Centres Wigan 2.1
Other Destinations in Wigan Borough 1.6 Wigan Borough Total 66.5
Leakage 33.5
Source: RMG Clarity Household Survey March 2013 / NEMs Household Survey March 2014
5.28 Two thirds (66.5%) of the comparison retail expenditure generated by residents
of Wigan Borough is retained within it. The defined Wigan Town Centre9
attracts the greatest market share (22.7%) followed by Robin Park (13.1%) and
Leigh (10.7%). Golborne, Hindley, Pemberton, Standish and Tyldesley all have
a less than 1% market share of borough comparison retail goods spending.
Bolton (4.5%), Middlebrook Retail Park (4.7%) and the Trafford Centre (4.1%)
draw the greatest proportion of comparison retail expenditure generated in the
borough to destinations outside of it. To a lesser extent there is leakage to
9 2006 UDP defined Town Centre

Wigan Retail and Leisure Study
P24 6778763v4
Manchester, Warrington (including Gemini Retail Park), Liverpool and
Southport.
5.29 The proximity of Bolton and Middlebrook Retail Park to the eastern part of
Wigan Borough and the offer of these destinations are the likely contributing
factors to expenditure leaking from the borough. Middlebrook attracts a
significant proportion of expenditure from residents in the Atherton and Leigh
sub-zones which is some 10 to 15 kilometres travelling distance and less
distance for some residents than a journey to Wigan town centre. A significant
proportion of expenditure from the Tyldesley area is attracted to the Trafford
Centre. Whilst there is a significant leakage of expenditure to destinations
outside of the borough, the outflows of expenditure are not necessarily
demonstrative of unsustainable patterns of shopping.
5.30 The greatest retention of comparison retail expenditure is in the Wigan
(82.8%), Ince (72.9%) and Shevington (72.3%) areas. The lowest proportion of
comparison retail expenditure retained by the borough is from the Golborne
area (49.9%). Warrington accounts for the majority of the leakage from the
Golborne area, which is again relatively accessible compared with higher-order
destinations within Wigan Borough.

Wigan Retail and Leisure Study
6778763v4 P25
6.0 Assessment of Retail Needs
Methodology
Population and Expenditure Data
6.1 The market shares recorded by the RMG clarity and NEMS household surveys
are applied to the most up-to-date population and expenditure data to assess
current trading patterns and retail capacity at 201410 and project forward
capacity for additional retail floorspace to 2019, 2024 and 2026.
6.2 The 2011 Census is used to derive base population data and is consistent with
typical approaches adopted in the writing of retail studies and previous
iterations of the retail study. Population for the period 2011-2021 is projected
forward having regard to the 2011-based Sub-National Population projections
[SNPP] for Wigan (sub-zones 1, 2 and 4-13), West Lancashire (sub-zones 14
and 15) and a combination of both administrative areas for zone 3 with a 75%
weighting in favour of Wigan. Post 2021, an annual growth rate is applied
having regard to 2010-based sub-national population projections.
Commitments
6.3 The assessment of retail need in this section of the study does not take
account existing commitments. Commitments that come forward will reduce
the overall capacity for new floorspace.
6.4 The Council has granted planning permission recently for two foodstore
schemes at Standish. A scheme at Preston Road, Standish is for a foodstore
of 2,984 sq. m (gross convenience retail floorspace). The other retail scheme
granted planning permission recently relates to a site at High Street, Standish
and a foodstore of 2,340 sq. m (gross).
6.5 At June 2014, under consideration were proposals for a reduction in floorspace
at the Leigh Tesco store and the sub-division of a B&Q Warehouse store at
Frith Street, Newtown, to allow for part of the floorspace to be occupied by a
Morrisons foodstore.
Constant Market Share Approach
6.6 A constant market share approach is adopted with two exceptions. From 2015
onwards, allowance is made for the Sainsbury’s store at Atherleigh Way
trading at 65% of company average levels. Sainsbury’s opened its extended
store in December 2012, and it is reasonable to assume that it will take two
years for a settled pattern of trading to be established. Such adjustment of
shopping patterns will often set a new/reconfigured store at a company
average trading levels from two years into its operation. In this instance a more
10
Capacity at 2014 in the convenience retail sector only and comparison retail floorspace taken to be trading at equilibrium at 2014

Wigan Retail and Leisure Study
P26 6778763v4
realistic expected level of performance is adopted given the level of
competition in the Leigh convenience retail market.
6.7 In December 2013, Marks and Spencer opened a Simply Food fascia store
adjacent to the extended Sainsbury’s. The retail capacity assessment makes
allowance for this store trading at company average performance from 2015
onwards. The different approach adopted is justified by the different (top-up)
shopping market that the store competes in, in contrast with Sainsbury’s
competing for main-food sales with large-format Asda, Morrisons and Tesco
stores.
Capacity Attributable to Out-of-Centre Floorspace
6.8 Adopting a constant market share approach means that a significant proportion
of capacity is calculated as attributable to out-of-centre floorspace. The NPPF
and Planning Practice Guidance advocate a town centre first approach to
accommodating new retail floorspace and, to be consistent with this, this study
transfers to the nearest appropriately sized town centre any capacity generated
that is attributable to out-of-centre retail floorspace.
Expenditure Leakage
6.9 Leakage of expenditure from a locality, and the potential for new floorspace to
enact a claw-back of this, can be indicative of additional capacity. This has
potential relevance to Wigan Borough in the comparison retail sector; retention
of convenience retail goods expenditure is very high and unlikely to be
elevated further. It is not for a borough-wide retail study to give consideration to
claw-back and the implications of this on capacity. A retail assessment
submitted with any planning application proposing new retail floorspace outside
of the borough town centres11 would be expected to consider the potential for a
claw back of expenditure and the implications this has on trade diversion and
the likely impact of a proposed development.
Floorspace Efficiencies
6.10 An allowance is made for the turnover of existing comparison retail floorspace
increasing its performance by 1.8% per annum, as a result of the more efficient
use of floorspace. 1.8% is a more modest rate of floorspace efficiency than
was adopted commonly prior to the beginning of the economic downturn in
2008 and the reserved approach is a reflection of continued economic
uncertainty in the retail sector. This continued uncertainty over future
improvements in trading performance is also the reasoning behind the
adoption in the convenience retail capacity assessment of zero growth in
floorspace efficiencies over the period to 2026.
11
Where the level of floorspace proposed justifies the LPA requiring that a retail assessment is submitted

Wigan Retail and Leisure Study
6778763v4 P27
Quantifying Capacity
6.11 Set out below is a summary of the convenience and comparison retail capacity
assessments included at Appendix 4. The capacity assessments are by town,
for the Principal Town Centre Wigan, the Main Town Centres of Leigh and
Ashton-in-Makerfield and the smaller town centres of Atherton, Golborne,
Hindley, Pemberton, Standish and Tyldesley.
6.12 Capacity is calculated for each centre by dividing the expenditure capacity
generated by a typical sales density. The full schedule of capacity calculations
is at Table 12 and Table 19 of Appendix 4. The sales densities adopted reflect
the varying scales and format of retailing that is likely to be attracted to each
centre. In the convenience retail sector, £10,000/sq. m is adopted for Wigan
and Leigh, with £8,000/sq. m adopted for the other defined centres considered.
In the comparison retail sector, £5,000/sq. m is adopted for Wigan and Leigh,
with £3,500/sq. m adopted for the other defined centres considered.
6.13 Capacity is presented as a net sales area, as it is this figure that is relevant to
retail impact assessments required by the NPPF. The gross floorspace of retail
developments will always be greater than the net trading area, but the ratio
between net and gross floorspace varies greatly. The net sales area in a
corner shop might be up to 90% of the gross, whereas the equivalent figure for
a large format foodstore might be as little as 60%. For these reasons, it is
robust for a retail assessment to present floorspace capacity as a net figure.
6.14 There are references in the following section to convenience retail floorspace
trading at above or below expected levels. The convenience retail assessment
which follows compares the survey derived turnover of main foodstore
destinations with expected (benchmark) turnover levels. The expected turnover
of a convenience retail destination is the turnover that it would achieve were it
to trade at company average (for named foodstores) or typical (for other
floorspace) sales densities. Comparing survey derived turnover with
benchmark turnover for convenience retail floorspace gives an indication as to
whether destinations are trading above or below what might be expected.
Floorspace data to inform this benchmark assessment is derived from a
number of sources including previous retail studies, Experian GOAD and
planning application data.
6.15 In the comparison retail sector, it is assumed that the 2014 survey-derived
performance of floorspace in the borough is its benchmark position. The
comparison retail capacity assessment at Table 19 of Appendix 4 adopts an
approach whereby existing floorspace within the borough will increases its
benchmark turnover in real terms from 2014 to 2026 at a growth rate of 1.8%
per annum. Trends indicate that comparison retailers historically will achieve
some growth in trading efficiency. This is a function of spending growing at
faster rates than new floorspace provision and the ability of retailers to absorb
real increases in their costs by increasing their turnover to floorspace ratio.

Wigan Retail and Leisure Study
P28 6778763v4
Borough Quantitative Capacity
Convenience Retail Goods
6.16 Growth in the convenience retail goods spending power of the adopted study
area is £34.5m to 2019, £79.0m to 2024 and £98.2 to 2026 (Table 3a at
Appendix 4).
6.17 The NLP capacity assessment follows an accepted methodology of applying
available retail expenditure pro-rata to the market shares of destinations12. It is
also appropriate to take into account the performance of existing retail
floorspace, compared with expected levels of performance. In circumstances
where existing floorspace is assessed to be underperforming, it is appropriate
for organic growth in spending to be first absorbed by this underperforming
floorspace. Conversely, where existing floorspace is assessed to be
performing above expected levels, this can add to the identified capacity for
new retail floorspace.
Comparison Retail Goods
6.18 Growth in comparison retail goods spending power of the adopted study area
is £138.1m to 2019, £336.3m to 2024 and £429.2m to 2026 (Table 3b at
Appendix 4).
6.19 The approach that NLP adopts in the calculation of comparison retail capacity
is consistent with the approach adopted in the convenience retail sector, with
the exception of the assumption that comparison retail floorspace at 2014 is
trading at a level that is consistent with what might be expected. It is not
feasible to ‘benchmark’ the expected turnover of comparison retail floorspace
in town centres given the number of trading fascias and particularly when there
is a high proportion of independent retailers.
12
Save for the adjustments made in respect of the Sainsbury’s and Marks and Spencer stores in Leigh
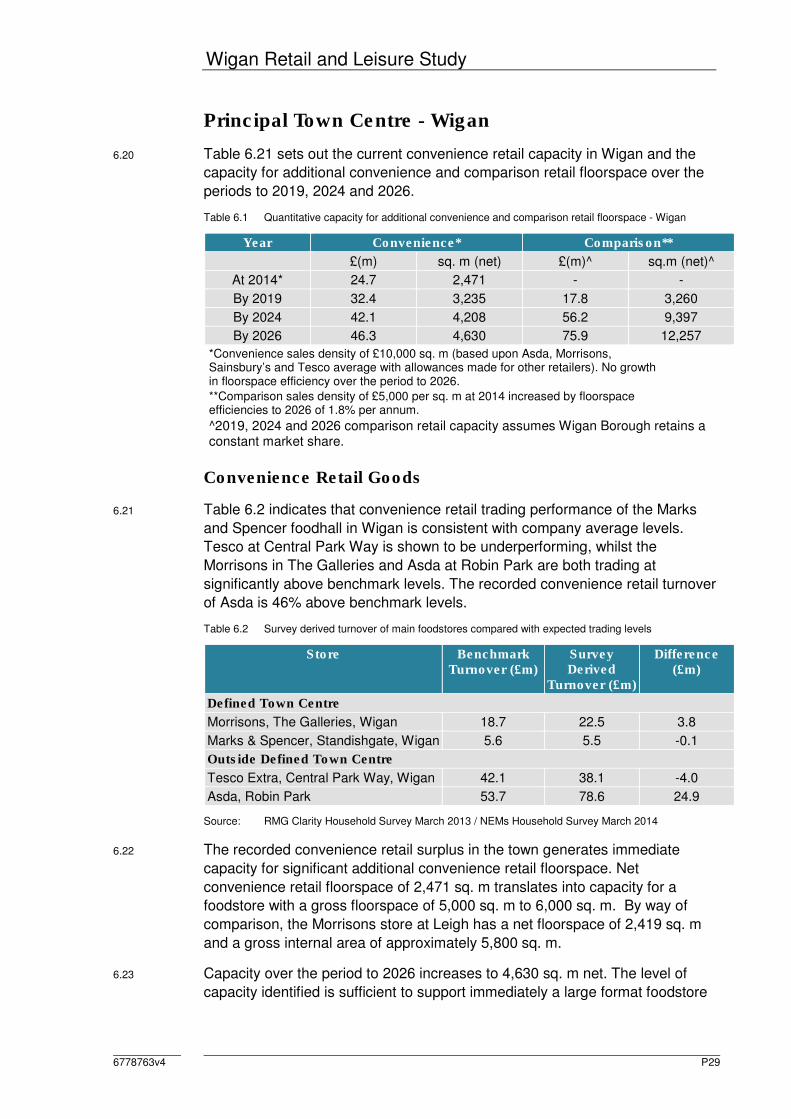
Wigan Retail and Leisure Study
6778763v4 P29
Principal Town Centre - Wigan
6.20 Table 6.21 sets out the current convenience retail capacity in Wigan and the
capacity for additional convenience and comparison retail floorspace over the
periods to 2019, 2024 and 2026.
Table 6.1 Quantitative capacity for additional convenience and comparison retail floorspace - Wigan
Year Convenience* Comparison**
£(m) sq. m (net) £(m)^ sq.m (net)^
At 2014* 24.7 2,471 - -
By 2019 32.4 3,235 17.8 3,260
By 2024 42.1 4,208 56.2 9,397
By 2026 46.3 4,630 75.9 12,257
*Convenience sales density of £10,000 sq. m (based upon Asda, Morrisons, Sainsbury’s and Tesco average with allowances made for other retailers). No growth in floorspace efficiency over the period to 2026.
**Comparison sales density of £5,000 per sq. m at 2014 increased by floorspace efficiencies to 2026 of 1.8% per annum.
^2019, 2024 and 2026 comparison retail capacity assumes Wigan Borough retains a constant market share.
Convenience Retail Goods
6.21 Table 6.2 indicates that convenience retail trading performance of the Marks
and Spencer foodhall in Wigan is consistent with company average levels.
Tesco at Central Park Way is shown to be underperforming, whilst the
Morrisons in The Galleries and Asda at Robin Park are both trading at
significantly above benchmark levels. The recorded convenience retail turnover
of Asda is 46% above benchmark levels.
Table 6.2 Survey derived turnover of main foodstores compared with expected trading levels
Store Benchmark Turnover (£m)
Survey Derived
Turnover (£m)
Difference (£m)
Defined Town Centre
Morrisons, The Galleries, Wigan 18.7 22.5 3.8
Marks & Spencer, Standishgate, Wigan 5.6 5.5 -0.1
Outside Defined Town Centre
Tesco Extra, Central Park Way, Wigan 42.1 38.1 -4.0
Asda, Robin Park 53.7 78.6 24.9
Source: RMG Clarity Household Survey March 2013 / NEMs Household Survey March 2014
6.22 The recorded convenience retail surplus in the town generates immediate
capacity for significant additional convenience retail floorspace. Net
convenience retail floorspace of 2,471 sq. m translates into capacity for a
foodstore with a gross floorspace of 5,000 sq. m to 6,000 sq. m. By way of
comparison, the Morrisons store at Leigh has a net floorspace of 2,419 sq. m
and a gross internal area of approximately 5,800 sq. m.
6.23 Capacity over the period to 2026 increases to 4,630 sq. m net. The level of
capacity identified is sufficient to support immediately a large format foodstore

Wigan Retail and Leisure Study
P30 6778763v4
(superstore format) capable of performing a bulk food shopping role. On the
basis of such a foodstore development coming forward, the residual floorspace
capacity identified in the longer term would be sufficient to support a medium-
sized foodstore with a net sales area of 1,000 to 1,500 sq. m. Again, to provide
context, the size of such a foodstore would likely come from a spectrum
encompassing Aldi/Lidl format foodstores up to a store with a sales area
equivalent to the Wigan town centre Morrisons store.
Comparison Retail Goods
6.24 Table 14 at Appendix 4 summarises the current comparison retail performance
of destinations in Wigan Borough. As it is assumed that destinations in Wigan
are trading at expected levels at 2014, it is year-on-year growth in comparison
retail spending that accounts for capacity over the period to 2026.
6.25 Capacity for 3,260 sq. m (net) of additional comparison retail goods floorspace
is identified by 2019, increasing to 9,397 sq. m by 2024. The additional
capacity identified in the long term to 2026 (12,257 sq. m) is significant and
would enable a sizeable extension to the comparison retail offer of the town
centre.
6.26 High street retailers are seeking increasingly larger units and NLP advises that
the Council considers encouraging the development of a small number of
larger units to accommodate the requirements of key national multiples and
ensure that the town centre continues to be competitive in the sub-region and
against retail park floorspace. Redevelopment and reconfiguration of The
Galleries shopping centre provides an opportunity to deliver larger units to
meet retailer demands, although uplift in floorspace is unlikely to reach the
capacity identified beyond 2019.
Main town centre - Leigh
6.27 Table 6.3 sets out the current convenience retail capacity in Leigh and the
capacity for additional convenience and comparison retail floorspace over the
periods to 2019, 2024 and 2026.
Table 6.3 Quantitative capacity for additional convenience and comparison retail floorspace - Leigh
Year Convenience* Comparison**
£(m) sq. m (net) £(m)^ sq.m (net)^
At 2014* - - - -
By 2019 - - 6.5 5,466
By 2024 - - 20.5 5,977
By 2026 - - 27.7 6,194
*Convenience sales density of £10,000 sq. m (based upon Asda, Morrisons, Sainsbury’s and Tesco foodstore average reduced to reflect presence of Lidl and Aldi with allowances made for other retailers). No growth in floorspace efficiency over the period to 2026.
**Comparison sales density of £5,000 per sq. m at 2014 increased by floorspace efficiencies to 2026 of 1.8% per annum.
^2019, 2024 and 2026 comparison retail capacity assumes Wigan Borough retains a constant market share.

Wigan Retail and Leisure Study
6778763v4 P31
Convenience Retail Goods
6.28 Table 6.4 indicates that in Leigh existing convenience retail floorspace is
trading at significantly below expected levels. This provides clear evidence that
Leigh is already over-provided for in terms of convenience retail floorspace and
as the table above illustrates, there is not any capacity for additional
convenience retail floorspace over the period covered by the Core Strategy.
Table 6.4 Survey derived turnover of main foodstores compared with expected trading levels - Leigh
Store Benchmark Turnover
(£m)
Survey Derived
Turnover (£m)
Difference (£m)
Defined Town Centre
Aldi, King Street, Leigh (c.200m from PSA) 9.1 13.1 4.0
Asda, Windermere Road, Leigh (c.300m from PSA) 7.5 5.7 -1.8
Iceland, Bradshawgate, Leigh 4.5 3.5 -2.0
Outside Defined Town Centre
Asda, Atherleigh Way, Leigh 46.0 50.6 4.6
Morrisons, Atherleigh Way, Leigh, Greater Manchester 30.6 18.2 -11.8
Sainsbury's, Atherleigh Way, Leigh 54.0 14.4 -39.6
Marks & Spencer, Atherleigh Way, Leigh 8.2 - -
Tesco Extra, Spinning Jenny Way, Leigh, Manchester 46.1 19.7 -26.4
Lidl, Spinning Jenny Way, Leigh 1.8 2.8 1.0
Source: RMG Clarity Household Survey March 2013 / NEMs Household Survey March 2014
6.29 Existing convenience retail stores in the town have the capacity to absorb pro-
rata growth in convenience expenditure over the period to 2026 without the
need for additional floorspace. The extent of the existing convenience offer
(Leigh has Aldi, Asda (x2), Lidl, Morrisons, Sainsbury’s and Tesco stores), is
more than is required to satisfy the convenience retail shopping needs of
residents living in the east of the borough. The fact that in early 2014 Tesco
submitted an application to seek alternative use for part of the floorspace within
its store is indicative that this part of the borough is over provided for.
Comparison Retail Goods
6.30 Capacity for additional comparison retail floorspace in Leigh in the short term
to 2019 is 1,192 sq. m. Over the long term this capacity increases to 4,470
sq.m.
6.31 The capacity identified is of a scale sufficient to support the development of
significant additional comparison retail floorspace. Consistent with the advice
for Wigan town centre, NLP recommends that the Council seeks to encourage
the development of modern large-format retail units within the central area. The
objective should be to encourage new fascias to the town centre, with the aim
of increasing the performance of Leigh in the local retail hierarchy and allowing
it to compete more effectively with out-of-centre retail destinations.
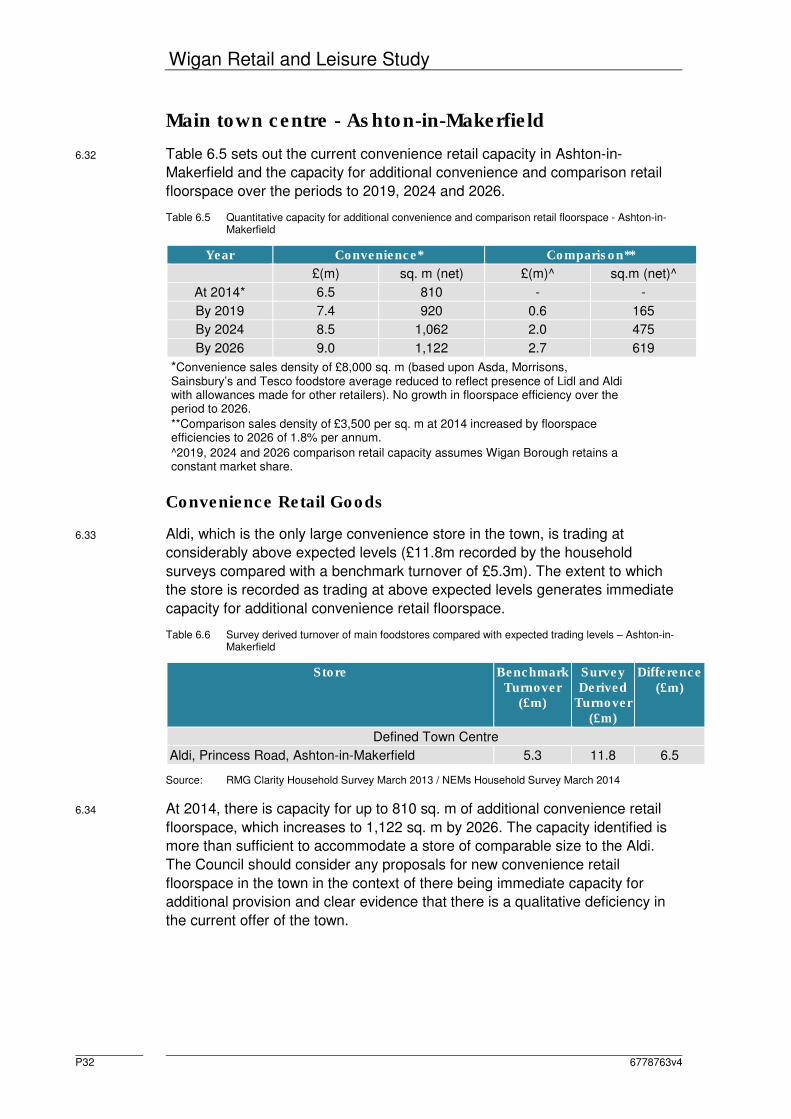
Wigan Retail and Leisure Study
P32 6778763v4
Main town centre - Ashton-in-Makerfield
6.32 Table 6.5 sets out the current convenience retail capacity in Ashton-in-
Makerfield and the capacity for additional convenience and comparison retail
floorspace over the periods to 2019, 2024 and 2026.
Table 6.5 Quantitative capacity for additional convenience and comparison retail floorspace - Ashton-in-Makerfield
Year Convenience* Comparison**
£(m) sq. m (net) £(m)^ sq.m (net)^
At 2014* 6.5 810 - -
By 2019 7.4 920 0.6 165
By 2024 8.5 1,062 2.0 475
By 2026 9.0 1,122 2.7 619
*Convenience sales density of £8,000 sq. m (based upon Asda, Morrisons, Sainsbury’s and Tesco foodstore average reduced to reflect presence of Lidl and Aldi with allowances made for other retailers). No growth in floorspace efficiency over the period to 2026.
**Comparison sales density of £3,500 per sq. m at 2014 increased by floorspace efficiencies to 2026 of 1.8% per annum.
^2019, 2024 and 2026 comparison retail capacity assumes Wigan Borough retains a constant market share.
Convenience Retail Goods
6.33 Aldi, which is the only large convenience store in the town, is trading at
considerably above expected levels (£11.8m recorded by the household
surveys compared with a benchmark turnover of £5.3m). The extent to which
the store is recorded as trading at above expected levels generates immediate
capacity for additional convenience retail floorspace.
Table 6.6 Survey derived turnover of main foodstores compared with expected trading levels – Ashton-in-Makerfield
Store Benchmark Turnover
(£m)
Survey Derived
Turnover (£m)
Difference (£m)
Defined Town Centre
Aldi, Princess Road, Ashton-in-Makerfield 5.3 11.8 6.5
Source: RMG Clarity Household Survey March 2013 / NEMs Household Survey March 2014
6.34 At 2014, there is capacity for up to 810 sq. m of additional convenience retail
floorspace, which increases to 1,122 sq. m by 2026. The capacity identified is
more than sufficient to accommodate a store of comparable size to the Aldi.
The Council should consider any proposals for new convenience retail
floorspace in the town in the context of there being immediate capacity for
additional provision and clear evidence that there is a qualitative deficiency in
the current offer of the town.

Wigan Retail and Leisure Study
6778763v4 P33
Comparison Retail Goods
6.35 There is limited capacity for additional comparison floorspace in the short term.
Capacity is projected to increase to 619 sq. m over the period to 2026, which
would allow for limited expansion of the retail offer in the town. Expansion in
the comparison retail offer of Ashton-in-Makerfield is important if the town is to
consolidate its position as the second main town centre in the borough in a tier
below principal town centre Wigan.
Smaller town centres
6.36 Table 6.7 compares the (expected) benchmark and survey derived
convenience retail turnover of stores within the six smaller town centres in the
borough in order to identify which destinations are trading at, below or above
expected levels.
Table 6.7 Survey derived turnover of main foodstores compared with expected trading levels - smaller town centres
Centre Store Benchmark Turnover (£m)
Survey Derived
Turnover (£m)
Difference (£m)
Defined Town Centre
Atherton Tesco, Crab Tree Lane 15.3 18.6 3.3
Golborne Lidl, High Street 1.9 2.8 0.9
Hindley Tesco Extra, Cross Street 22.8 25.2 2.4
Pemberton Tesco Express, Ormskirk Road 2.3 3.3 1.0
Standish Co-op, Pole Street 6.9 4.9 -2.0
Tyldesley Aldi, Castle Street 4.6 15.2 10.6
Outside Defined Town Centre
Atherton Asda, Bolton Road 10.1 3.1 -7.0
Golborne Asda, Edge Green Lane 22.3 30.4 7.9
Hindley Asda, Ladies Lane 7.0 6.6 -0.4
Standish Lidl, Preston Road/Avondale Road 3.2 4.7 1.5
Tyldesley Morrisons, Shuttle Street 18.3 12.7 -5.6
All Stores*
Atherton 25.4 21.7 -3.7
Golborne 25.2 33.2 8.0
Hindley 29.8 31.8 2.1
Pemberton 2.3 3.3 1.0
Standish 10.1 9.6 -0.5
Tyldesley 22.9 27.9 5.1 Source: RMG Clarity Household Survey March 2013 / NEMs Household Survey March 2014 *All stores includes other destinations not listed in the schedule of specific stores

Wigan Retail and Leisure Study
P34 6778763v4
Atherton
6.37 Table 6.8 sets out the current convenience retail capacity in Atherton and the
capacity for additional convenience and comparison retail floorspace over the
periods to 2019, 2024 and 2026.
Table 6.8 Quantitative capacity for additional convenience and comparison retail floorspace - Atherton
Year Convenience* Comparison**
£(m) sq. m (net) £(m)^ sq.m (net)^
At 2014* - - - -
By 2019 - - 0.6 148
By 2024 - - 1.8 426
By 2026 - - 2.4 555
*Convenience sales density of £8,000 sq. m (based upon Asda, Morrisons, Sainsbury’s and Tesco average with allowances made for other retailers). No growth in floorspace efficiency over the period to 2026.
**Comparison sales density of £3,500 per sq. m at 2014 increased by floorspace efficiencies to 2026 of 1.8% per annum.
^2019, 2024 and 2026 comparison retail capacity assumes Wigan Borough retains a constant market share.
Convenience Retail Goods
6.38 Asda and Tesco operate stores in Atherton. Whilst the household survey
identifies the Tesco store to be trading at above expected levels, the turnover
recorded for the Asda store is significantly below company average
performance level. The combined performance of these two stores results in a
position where there is not any capacity for additional convenience retail
floorspace in Atherton over the plan period. Based upon the findings of the
household survey, the Asda store at Bolton Road has the capacity to absorb
pro-rata growth in convenience retail expenditure. That said, the scope for
Asda to accommodate growth in expenditure should not stymie the
development of convenience retail floorspace in the centre of Atherton. It does
however provide clear guidance that there is not any capacity for additional
retail floorspace outside of the central area.
Comparison Retail Goods
6.39 There is limited quantitative capacity for additional comparison retail goods
floorspace in Atherton town centre, with growth in spending generating scope
for 555 sq. m net of additional floorspace over the long term to 2026. Satisfying
the capacity identified for additional retail floorspace provides an opportunity
for improvement in the town centre offer and the Atherton commercial property
stock. This may be best addressed by an extension to existing floorspace or
uplift in floorspace as part of a reinvigoration of existing buildings.
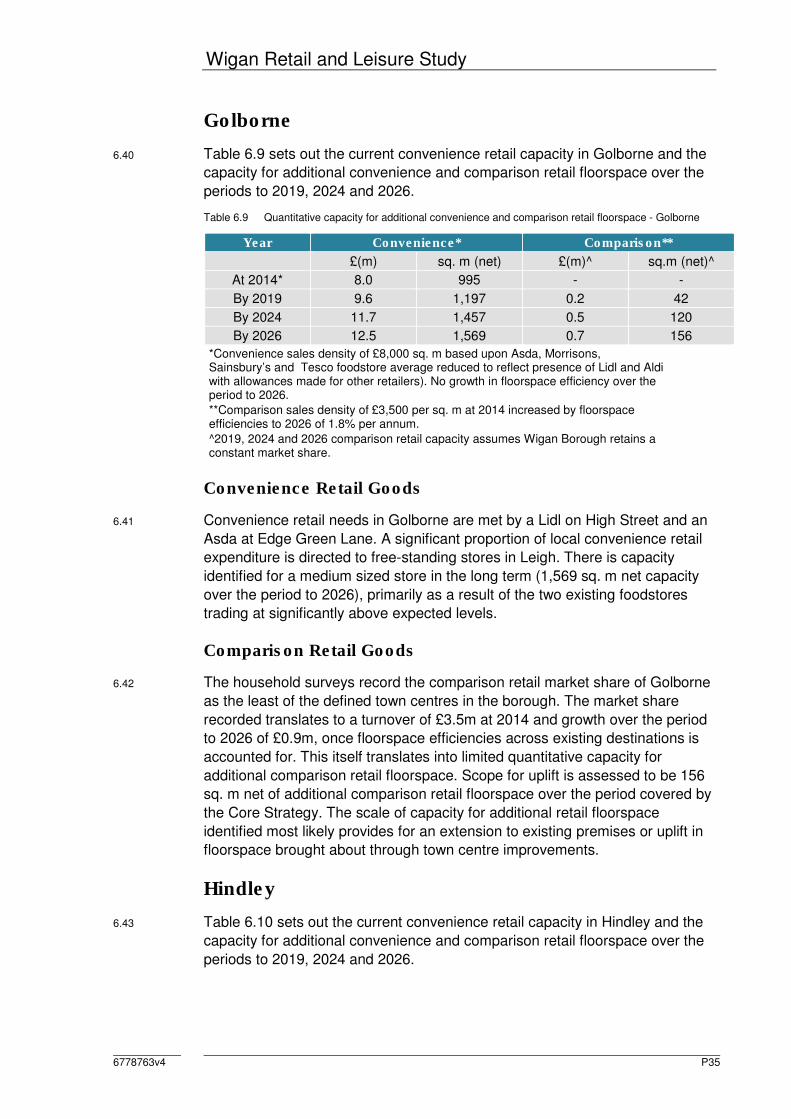
Wigan Retail and Leisure Study
6778763v4 P35
Golborne
6.40 Table 6.9 sets out the current convenience retail capacity in Golborne and the
capacity for additional convenience and comparison retail floorspace over the
periods to 2019, 2024 and 2026.
Table 6.9 Quantitative capacity for additional convenience and comparison retail floorspace - Golborne
Year Convenience* Comparison**
£(m) sq. m (net) £(m)^ sq.m (net)^
At 2014* 8.0 995 - -
By 2019 9.6 1,197 0.2 42
By 2024 11.7 1,457 0.5 120
By 2026 12.5 1,569 0.7 156
*Convenience sales density of £8,000 sq. m based upon Asda, Morrisons, Sainsbury’s and Tesco foodstore average reduced to reflect presence of Lidl and Aldi with allowances made for other retailers). No growth in floorspace efficiency over the period to 2026.
**Comparison sales density of £3,500 per sq. m at 2014 increased by floorspace efficiencies to 2026 of 1.8% per annum.
^2019, 2024 and 2026 comparison retail capacity assumes Wigan Borough retains a constant market share.
Convenience Retail Goods
6.41 Convenience retail needs in Golborne are met by a Lidl on High Street and an
Asda at Edge Green Lane. A significant proportion of local convenience retail
expenditure is directed to free-standing stores in Leigh. There is capacity
identified for a medium sized store in the long term (1,569 sq. m net capacity
over the period to 2026), primarily as a result of the two existing foodstores
trading at significantly above expected levels.
Comparison Retail Goods
6.42 The household surveys record the comparison retail market share of Golborne
as the least of the defined town centres in the borough. The market share
recorded translates to a turnover of £3.5m at 2014 and growth over the period
to 2026 of £0.9m, once floorspace efficiencies across existing destinations is
accounted for. This itself translates into limited quantitative capacity for
additional comparison retail floorspace. Scope for uplift is assessed to be 156
sq. m net of additional comparison retail floorspace over the period covered by
the Core Strategy. The scale of capacity for additional retail floorspace
identified most likely provides for an extension to existing premises or uplift in
floorspace brought about through town centre improvements.
Hindley
6.43 Table 6.10 sets out the current convenience retail capacity in Hindley and the
capacity for additional convenience and comparison retail floorspace over the
periods to 2019, 2024 and 2026.

Wigan Retail and Leisure Study
P36 6778763v4
Table 6.10 Quantitative capacity for additional convenience and comparison retail floorspace - Hindley
Year Convenience* Comparison**
£(m) sq. m (net) £(m)^ sq.m (net)^
At 2014* 2.1 257 - -
By 2019 3.7 462 0.4 108
By 2024 5.8 726 1.3 312
By 2026 6.7 839 1.8 405
*Convenience sales density of £8,000 sq. m based upon Asda, Morrisons, Sainsbury’s and Tesco foodstore average reduced to reflect presence of Lidl and Aldi with allowances made for other retailers). No growth in floorspace efficiency over the period to 2026.
**Comparison sales density of £3,500 per sq. m at 2014 increased by floorspace efficiencies to 2026 of 1.8% per annum.
^2019, 2024 and 2026 comparison retail capacity assumes Wigan Borough retains a constant market share.
Convenience Retail Goods
6.44 Convenience retail provision in Hindley comprises a Tesco Extra at Cross
Street and a small Asda store (former Netto) at Ladies Lane. The great
majority of convenience retail expenditure from the Hindley area is directed to
the Tesco. The household survey suggests that the Tesco stores trades at
marginally above expected levels, and that the Asda store underperforms
slightly against a benchmark position. The result is limited capacity for
additional convenience retail floorspace in Hindley over the period to 2026. The
retail capacity assessment at Appendix 4 details that, over the course of the
period covered by the Core Strategy, there is scope for 839 sq. m of additional
convenience retail floorspace. This is sufficient capacity in the longer term for a
small-scale standalone supermarket, but could also be absorbed by extension
of floorspace at existing retail destinations.
Comparison Retail Goods
6.45 The retail capacity indicates that the current comparison retail turnover of
Golborne is some £9.2m. Amongst the smaller town centres in the borough,
this places Golborne second behind Ashton-in-Makerfield in terms of
comparison retail expenditure attracted from the study area. Despite this, the
anticipated limited growth in comparison retail expenditure over the course of
the period covered by the Core Strategy (pro-rata to existing market share)
means that there is limited quantitative capacity for additional comparison retail
floorspace in Hindley town centre. The retail capacity assessment charts that
growth in retail expenditure directed to Hindley will result in capacity for 405 sq.
m net of additional floorspace over the period to 2026. This quantum of
capacity will provide for a series of high-street format units or an extension to
existing units.

Wigan Retail and Leisure Study
6778763v4 P37
Pemberton
6.46 Table 6.11 sets out the current convenience retail capacity in Pemberton and
the capacity for additional convenience and comparison retail floorspace over
the periods to 2019, 2024 and 2026.
Table 6.11 Quantitative capacity for additional convenience and comparison retail floorspace - Pemberton
Year Convenience* Comparison**
£(m) sq. m (net) £(m)^ sq.m (net)^
At 2014* 1.0 122 - -
By 2019 1.3 158 0.2 43
By 2024 1.6 205 0.5 124
By 2026 1.8 225 0.7 162
*Convenience sales density of £8,000 sq. m based upon Asda, Morrisons, Sainsbury’s and Tesco foodstore average reduced to reflect presence of Lidl and Aldi with allowances made for other retailers). No growth in floorspace efficiency over the period to 2026.
**Comparison sales density of £3,500 per sq. m at 2014 increased by floorspace efficiencies to 2026 of 1.8% per annum.
^2019, 2024 and 2026 comparison retail capacity assumes Wigan Borough retains a constant market share.
Convenience Retail Goods
6.47 There is a limited convenience retail offer in Pemberton, which includes a
Tesco Express store on Ormskirk Road. The survey derived turnover of the
Tesco Express store (£3.3m) is in excess of benchmark performance. A Co-
operative store at Church Street, Orrell attracts £4.9m of locally generated
convenience retail expenditure, but over 50% is attracting to free standing
stores in the Wigan area with the Robin Park Asda attracting over a third of all
spending from the Billinge, Orrell, Pemberton and Winstanley areas. The fact
that the Tesco Express is trading beyond expected levels means that there is
demonstrable capacity for additional convenience retail floorspace, which is set
to grow over the period to 2026 to 225 sq. m. Capacity of this magnitude is
sufficient to support an additional local needs foodstore. Proximity to Asda at
Robin Park and a lack of sites for large format foodstore development means
that it is very unlikely that Pemberton will increase its market share materially
in the convenience retail sector.
Comparison Retail Goods
6.48 At £3.7m, the recorded comparison retail turnover of Pemberton is the second
lowest of the smaller town centres; above only Golborne which is recorded as
having a comparison retail turnover of £3.5m. The household survey findings
suggest that defined Wigan Town Centre and Robin Park attract over 50% of
the comparison retail expenditure generated in the Billinge, Orrell, Pemberton
and Winstanley area. The current performance of Pemberton in the
comparison retail sector means that there is limited quantitative capacity for
additional retail floorspace over the period to 2026, with potential pegged at
fewer than 200 sq. m in the long term. The capacity identified does not provide
scope for significant expansion of the retail offer in Pemberton, but this must be

Wigan Retail and Leisure Study
P38 6778763v4
set in context with proximity to other destinations with greater commercial
attraction and the likely impact that this has on commercial interest in
additional floorspace provision in the centre.
Standish
6.49 Table 6.12 sets out the current convenience retail capacity in Standish and the
capacity for additional convenience and comparison retail floorspace over the
periods to 2019, 2024 and 2026.
Table 6.12 Quantitative capacity for additional convenience and comparison retail floorspace - Standish
Year Convenience* Comparison**
£(m) sq. m (net) £(m)^ sq.m (net)^
At 2014* - - - -
By 2019 0.1 12 0.2 65
By 2024 0.8 100 0.8 186
By 2026 1.1 138 1.1 242
*Convenience sales density of £8,000 sq. m (based upon Asda, Morrisons, Sainsbury’s and Tesco foodstore average reduced to reflect presence of Lidl and Aldi with allowances made for other retailers). No growth in floorspace efficiency over the period to 2026.
**Comparison sales density of £3,500 per sq. m at 2014 increased by floorspace efficiencies to 2026 of 1.8% per annum.
^2019, 2024 and 2026 comparison retail capacity assumes Wigan Borough retains a constant market share.
Convenience Retail Goods
6.50 There is a Co-operative foodstore at the heart of Standish centre, and a Lidl
store to the north of the centre on Preston Road. About a fifth of local
convenience retail expenditure is retained in the town centre, and the Lidl store
increases the retention of local expenditure to a third. The majority of
convenience retail expenditure generated locally is directed to destinations in
Wigan and the free-standing Asda and Tesco stores in the main. Analysis of
the retail capacity assessment suggests that the Lidl store is trading at above
expected levels whereas the Co-operative store is under performing when
compared with expected benchmark performance.
6.51 The trading performance of existing stores means that there is not any
immediate capacity for new convenience retail floorspace in Standish. Table 12
at Appendix 4 shows a small amount of capacity at 2019, which increases to
138 sq. m by 2026. The level of capacity identified only really provides scope
for an extension to existing provision or a small scale ‘top-up’ store in Standish.
Should either of the commitments for new foodstores in Standish come
forward, this will absorb the capacity identified and dependent upon the nature
and scale of any floorspace developed could arrest the outflow of expenditure
to Wigan.
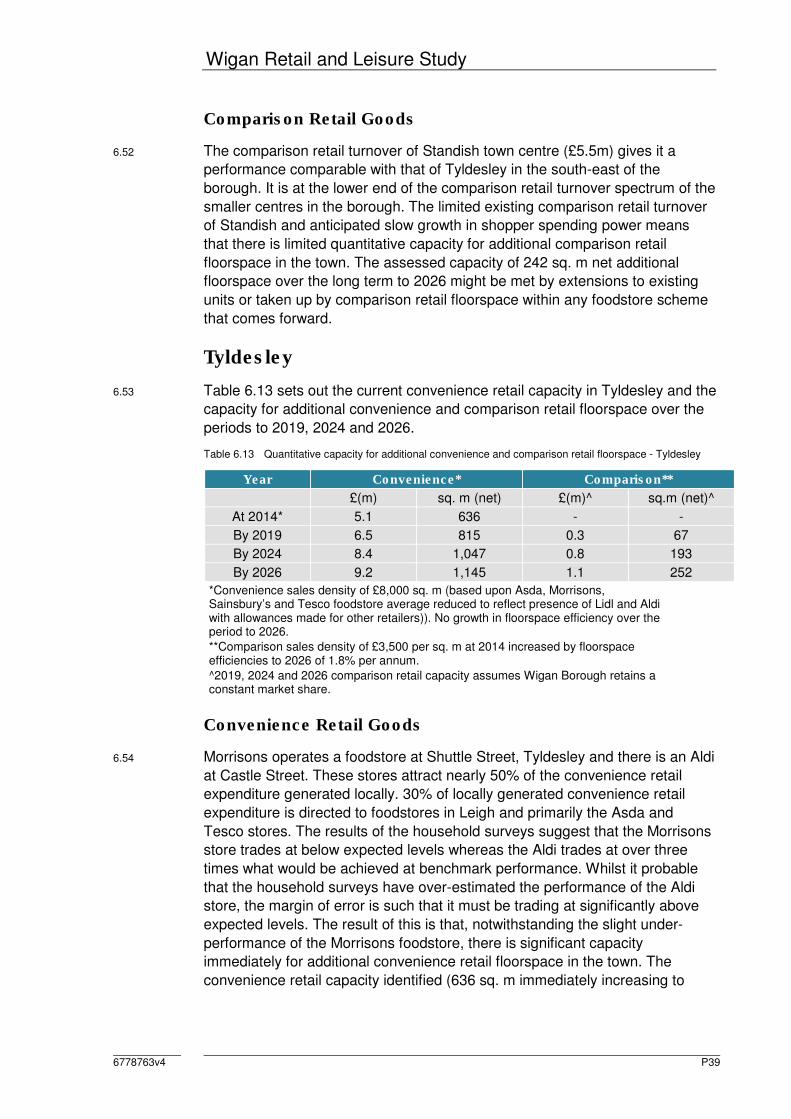
Wigan Retail and Leisure Study
6778763v4 P39
Comparison Retail Goods
6.52 The comparison retail turnover of Standish town centre (£5.5m) gives it a
performance comparable with that of Tyldesley in the south-east of the
borough. It is at the lower end of the comparison retail turnover spectrum of the
smaller centres in the borough. The limited existing comparison retail turnover
of Standish and anticipated slow growth in shopper spending power means
that there is limited quantitative capacity for additional comparison retail
floorspace in the town. The assessed capacity of 242 sq. m net additional
floorspace over the long term to 2026 might be met by extensions to existing
units or taken up by comparison retail floorspace within any foodstore scheme
that comes forward.
Tyldesley
6.53 Table 6.13 sets out the current convenience retail capacity in Tyldesley and the
capacity for additional convenience and comparison retail floorspace over the
periods to 2019, 2024 and 2026.
Table 6.13 Quantitative capacity for additional convenience and comparison retail floorspace - Tyldesley
Year Convenience* Comparison**
£(m) sq. m (net) £(m)^ sq.m (net)^
At 2014* 5.1 636 - -
By 2019 6.5 815 0.3 67
By 2024 8.4 1,047 0.8 193
By 2026 9.2 1,145 1.1 252
*Convenience sales density of £8,000 sq. m (based upon Asda, Morrisons, Sainsbury’s and Tesco foodstore average reduced to reflect presence of Lidl and Aldi with allowances made for other retailers)). No growth in floorspace efficiency over the period to 2026.
**Comparison sales density of £3,500 per sq. m at 2014 increased by floorspace efficiencies to 2026 of 1.8% per annum.
^2019, 2024 and 2026 comparison retail capacity assumes Wigan Borough retains a constant market share.
Convenience Retail Goods
6.54 Morrisons operates a foodstore at Shuttle Street, Tyldesley and there is an Aldi
at Castle Street. These stores attract nearly 50% of the convenience retail
expenditure generated locally. 30% of locally generated convenience retail
expenditure is directed to foodstores in Leigh and primarily the Asda and
Tesco stores. The results of the household surveys suggest that the Morrisons
store trades at below expected levels whereas the Aldi trades at over three
times what would be achieved at benchmark performance. Whilst it probable
that the household surveys have over-estimated the performance of the Aldi
store, the margin of error is such that it must be trading at significantly above
expected levels. The result of this is that, notwithstanding the slight under-
performance of the Morrisons foodstore, there is significant capacity
immediately for additional convenience retail floorspace in the town. The
convenience retail capacity identified (636 sq. m immediately increasing to

Wigan Retail and Leisure Study
P40 6778763v4
1,145 sq. m by 2026) is sufficient to support a third medium sized foodstore in
the town.
Comparison Retail Goods
6.55 Tyldesley is at the lower end of the spectrum of comparison retail turnover,
amongst the smaller town centres across the borough. Tyldesley attracts 6% of
comparison retail expenditure generated locally, whilst over 50% is directed to
Leigh or out of the borough to Bolton and the Trafford Centre. The
performance of Tyldesley in the comparison retail sector means that, in
adopting a constant market share approach, there is limited quantitative
capacity for additional comparison retail floorspace in the town centre. Growth
in spending power without any increase in market share will generate capacity
for 252 sq. m net of additional floorspace over the Core Strategy period to
2026. This level of capacity is sufficient to support additional high-street shop
units in the town centre, but not any substantial floorspace addition to the
current stock.

Wigan Retail and Leisure Study
6778763v4 P41
7.0 Change in Shopping Patterns: 2007 to 2014
Drawing Comparisons between different Research
7.1 Caution needs to be exercised in drawing comparisons between the findings of
the 2007 empirical research and the 2014 study, given that there is always a
margin of error in the undertaking of household shopper surveys and in this
instance there are methodological differences including in questions asked as
part of the empirical research. Conclusions over broad patterns can be drawn,
including which centres are shown to be stronger or weaker in the convenience
and comparison retail sectors now when compared with seven years ago.
Borough-wide Shopping Patterns
7.2 The current retention rate of convenience retail expenditure generated in the
borough (91%) is very strong and is demonstrative of strong representation
from most of the leading national supermarket chains. The 2007 household
study recorded a retention rate of 90%13, which suggests that the attraction of
destinations within the borough relative to destinations outside of its boundary
has remained constant. The market share of Wigan town centre has increased
marginally but remains below 6%. Free-standing foodstores continue to
dominate, albeit borough-wide market share at the Robin Park Asda has
reduced from 14% to 12%. Free-standing foodstores in Leigh continue to
account for 16%-17% of convenience retail expenditure generated in the
borough, despite the significantly greater floorspace now developed.
7.3 The two-thirds retention of comparison retail expenditure within the borough,
as recorded by this study is also healthy, and compares favourably with the
59% retention rate recorded by the 2007 study. The new empirical research
suggests that it is the smaller centres in the borough that have contributed to
the upturn in comparison retail market share. Whilst there is not any conclusive
evidence from the new household surveys of why, the delivery of new
foodstores in the borough (Tesco, Hindley for example) with associated
comparison retail will increase the attractiveness of smaller centres for
comparison retail shopping as will expansion amongst discount comparison
retail fascias (Quality Save, Ashton-in-Makerfield, for example).
7.4 Grand Arcade Wigan opened in 2007 and the market share of Wigan town
centre has remained at a level comparable with the 24% recorded in 2007.
7.5 Whilst some caution needs to be exercised in drawing direct comparisons
between the two datasets, the broad indication is that the opening of Grand
Arcade has resulted in Wigan town centre maintaining its market share during
a period of heightened competition for retail expenditure. Grand Arcade has
raised the profile of Wigan town centre, and increases its ability to compete
with other principal centres in the sub-regional centre (such as Bolton), the
13
NLP has excluded Zone 14 and Zone 15 from its analysis of the 2007, to achieve consistency with the 2014 analysis

Wigan Retail and Leisure Study
P42 6778763v4
regional centres of Liverpool and Manchester and the out-of-town Trafford
Centre.
7.6 Following its former owners entering administration, new owners of The
Galleries shopping centre are looking to reconfigure it, and the Marketgate
area of the shopping centre, as a retail and leisure destination. The
reinvigoration of The Galleries to provide commercial floorspace in the
configuration required by retail and leisure operators has the potential to
increase the retail market share of Wigan town centre as its wider attraction
provides further reason for shoppers to choose it as a destination above other
options available within the borough and the wider sub-region.
7.7 The new empirical research shows that the borough-wide comparison retail
market share of Leigh town centre has reduced marginally from around 12% to
less than 11%.
7.8 The overall picture is that growth in retention of comparison retail expenditure
in the borough is driven by a general upturn in the market share of the smaller
town centres. Whilst, again, this must be treated with a degree of caution, it
does suggest that a greater proportion of Wigan Borough residents are
choosing to shop locally for comparison retail purchases.
Borough-wide Capacity 2014 – 2026
7.9 Considering convenience retail capacity borough-wide would suggest that
there is not any theoretical need for additional floorspace at 2014, and not until
beyond 2024. Over-supply of retail floorspace in Leigh negates any capacity
identified elsewhere in the borough, until towards the end of the Core Strategy
period. This position is only theoretical as the convenience retail market in the
borough does not function as a single entity, and over-supply in Leigh should
not prohibit need elsewhere in the borough being met through the delivery of
new floorspace. Convenience retail capacity across the borough is greatest in
the Ashton-in-Makerfield, Golborne, Tyldesley and Wigan areas.
7.10 Caution needs to be exercised in drawing comparisons between capacity in
2007 and capacity now, given methodological differences and the fact that a
different price base is used. That said, general commentary on relative
capacity positions can be made.
7.11 The convenience retail expenditure surplus identified in Wigan (£24.7m at
2014) is broadly consistent with the £23.2m identified at 2009, in the 2009
update. This implies a sustained trading at above expected levels in the Wigan
area, and at Asda Robin Park in the main. A divergence between the 2009 and
2014 capacity assessments occurs once expenditure capacity is projected
forward, and this is a direct result of the approach adopted by NLP in its
assessment of future needs; an approach which aligns with the recent
economic climate and the expected economic conditions moving forward. The
NLP assessment identifies surplus convenience retail expenditure in Wigan of
£46.3m by 2026 whereas the surplus in the 2009 update reaches £87.8m by
2027. NLP considers that its more cautious approach is justified given the

Wigan Retail and Leisure Study
6778763v4 P43
economic downturn over the period from 2008 and a continued lack of
confidence in the food retail industry.
7.12 The more cautious findings for Wigan are reflected across the borough, in
terms of long term capacity. A key difference is the immediate capacity shown
for additional convenience retail floorspace in the Ashton-in-Makerfield and
Tyldesley areas, which contrasts with zero capacity shown in the 2009 update.
7.13 The more cautious approach adopted by NLP is evident again in the
comparison retail sector. The Wigan area surplus at 2019 (£17.8m) is
significantly less the £34.3m shown in the 2009 update for the five-year time
frame to 2014. The long term surplus the Wigan area (£75.9m in 2026) is
significantly less than the long term surplus (to 2027) of £349.6m identified in
the 2009 update. Again, the NLP approach is considered to be more robust
given economic trading conditions in the retail sector in the period since 2008.
The approach adopted by NLP is consistent across the borough and hence the
capacity identified for all town centres is significantly less than that set out in
the 2009 Capacity Assessment Update.
Wigan
7.14 A comparison of the retail evidence base from 2001 and 2007 shows that the
comparison retail market share of Wigan town centre declined considerably
over this period. The latest empirical research suggests that the market share
of Wigan town centre has plateaued over the period since 2007. The
development of Grand Arcade (23,063 sq. m net of commercial floorspace) is
the obvious reason for the decline in market share having been arrested,
meaning that Wigan town centre has maintained its market share during a
period of heightened competition brought about by economic down turn and
recession. Redevelopment of the Galleries/Marketgate area of the shopping
centre provides further opportunity to build upon the attractiveness of Wigan to
borough residents as a comparison retail shopping destination.
7.15 The town centre continues to play a limited role in meeting convenience retail
shopping needs, being subordinate to free-standing foodstores on the outskirts
of town and further afield.
7.16 A recalibration of growth rates adopted in the convenience and comparison
retail sectors means that, as a general rule, capacity is much reduced from that
set out in the 2007 study and its 2009 update. The 2014 empirical research
suggests a current under-supply of convenience retail floorspace in the Wigan
area and scope for significant additional convenience retail floorspace. The
position at 2014 is consistent with the position on immediate requirements for
Wigan detailed in the 2009 update. In the longer term, convenience retail
capacity grows at a much steadier rate.
7.17 Capacity in the comparison retail sector (12,257 sq. m over the period to 2026)
is more now than is recorded by the 2009 update figures. This suggests that
new floorspace in the principal centre within the borough, over the Core
Strategy period, will not be on the same scale as Grand Arcade and ought to

Wigan Retail and Leisure Study
P44 6778763v4
be focussed upon reinvigoration and extension of existing stock rather than
major intervention to deliver significant new floorspace.
Leigh
7.18 Leigh has maintained second place in the hierarchy of borough retail centres,
The latest empirical research suggests that the comparison retail market share
of the town centre has declined marginally, and the arrival of new convenience
retail floorspace out-of-centre (Morrisons foodstore and replacement
Sainsbury’s store) has assisted in maintaining the convenience retail market
share of the wider town.
7.19 In 2009, convenience retail floorspace in Leigh was reported to be trading at
above expected levels. This study has identified that stores in Leigh are trading
at significantly below expected levels and this most likely results directly from a
significant increase in local competition since the undertaking of the previous
household survey in 2007. This means that there is not any capacity for
additional convenience retail floorspace over the Core Strategy period to 2026.
The capacity identified at 2009 is met and exceeded. If anything, Leigh is likely
to witness a consolidation in its convenience retail floorspace, and this is most
likely to be consolidation amongst floorspace in out-of-centre locations.
7.20 In the comparison retail sector, capacity of 4,470 sq. m over the Core Strategy
period is significantly less than the 20,000 sq. m plus capacity identified in the
previous study for the period to 2027. There is scope for growth in the
comparison retail sector of Leigh, and whilst this will not be on the scale for
which capacity was identified in 2009, it is important that measured growth in
the town centre retail stock is planned for. Growth is necessary if the town is to
maintain its position in the local hierarchy and compete more effectively with
higher order destinations in the sub-region.
Ashton-in- Makerfield
7.21 In 2007 Ashton-in-Makerfield was perceived to be a poor quality retail
destination. The 2009 update found existing convenience retail floorspace to
be trading at significantly below expected levels, and hence did not identify any
capacity for additional convenience retail floorspace. The trend in the
convenience retail sector is reversed, market share is up and this study has
identified capacity for new convenience retail floorspace in the town. The
borough-wide market share of the town in the comparison retail sector has
increased significantly, and whilst capacity is reduced, as a result of the more
cautious approach adopted in this assessment, there remains capacity for over
5,000 sq. m net of additional comparison retail floorspace during the Core
Strategy period.
Atherton
7.22 The 2009 update found retail floorspace in Atherton, and most notably Tesco
at Crabtree Lane, to be trading at significantly above expected levels. Whilst

Wigan Retail and Leisure Study
6778763v4 P45
the Tesco continues to trade at above expected levels, this is now less
pronounced and the switch in fascia from Netto to Asda at Bolton Road
suggests that this floorspace is now trading at significantly below expected
levels. The net result is that the capacity assessment informing this study does
not identify any scope for additional convenience retail floorspace over the
period covered by the Core Strategy.
7.23 There is capacity for limited additional comparison retail floorspace in Atherton
in the short term, increasing slightly in the longer term. The capacity identified
is less than the capacity identified at 2009, consistent with the more cautious
approach adopted by NLP in completing the capacity assessment which
informs this study.
Golborne
7.24 The Asda and Lidl stores in Golborne trade at significantly above expected
levels, leading to surplus capacity for new floorspace. Had Sainsbury’s built-out
the commitment at the Millingford Industrial Estate, this capacity would most
likely have been absorbed. The fact that this floorspace has not come forward
results in immediate capacity for 995 sq. m additional convenience retail
floorspace rising to 1,569 sq. m by 2026. The level of capacity identified is less
than that included in the 2009 update and would be accounted for by the
Millingford Industrial Estate scheme coming forward, If it does not come
forward, then the Council should look favourably on other proposals that come
forward for additional convenience retail floorspace in the town.
7.25 The 2009 update identified limited capacity for additional comparison retail
floorspace; in the region of 1,000 sq. m in the longer term. The retail capacity
assessment underpinning this study suggests that the comparison retail market
share of Golborne has reduced over the seven years to 2014, which combined
with a more measured consideration of expected growth means that capacity is
much reduced.
Hindley
7.26 The 2009 update did not identify any convenience retail capacity in Hindley
until 2019, due to stores trading at below expected levels. The empirical
research informing this study suggests a better performance amongst existing
convenience retail floorspace in the town, and immediate capacity some 250
sq.m. This is shown to increase steadily and reach in the medium term a level
which is comparable with the capacity identified in the 2009 update.
7.27 The market share of Hindley in the comparison retail sector remains at about
1.0% and the 405 sq. m capacity identified over the period to 2026 is
significantly less than that identified in 2009.
Pemberton
7.28 The 2014 capacity assessment identified very limited capacity for additional
convenience retail floorspace in Pemberton. This is consistent with the
Wigan Retail and Leisure Study
P46 6778763v4
conclusion in 2009 that convenience retail floorspace in Pemberton traded at
slightly in excess of expected levels.
7.29 The borough-wide market share of Pemberton in the comparison retail sector
is shown to have reduced over the period since 2007. This, combined with the
more realistic rates of expenditure growth adopted in this study, means that the
capacity identified currently (up to 162 sq. m) is significantly less than the 2009
update assessed.
7.30 In both the convenience and comparison retail sectors, there is limited scope
for growth in the offer of Pemberton without the town centre realising an
increase in its market share within the borough.
Standish
7.31 The 2009 update identifies very limited capacity for additional comparison retail
floorspace over the period to 2027 and capacity in the convenience retail
sector only after 2019 due to under-performance of existing convenience retail
floorspace. In the comparison retail sector, 2019 assessed capacity is
comparable with the 2014 position from the 2009 update. Despite adoption of a
lower growth rate for retail expenditure, the 2014 study records an improved
performance for Standish in the comparison retail sector and this in-turn
generates capacity for floorspace uplift. In the convenience retail sector,
existing floorspace is still shown to be trading at below expected levels, which
means that there is not capacity until 2019 and thereafter the scope for new
retail floorspace is limited.
7.32 There are two commitments for additional convenience retail floorspace in
Standish. Whilst the convenience retail floorspace of the commitments
exceeds the convenience retail capacity identified, these schemes have the
potential to add to the quality of the offer in Standish and increase the market
share of the town. This retail capacity exercise is undertaken on a constant
market share basis. Significant additional retail floorspace has the potential to
enact an increase in market share. Whilst it is for those proposing new retail
floorspace to put forward any case for increase in market share, there is clear
potential for such an increase to occur in Standish if one or other of the
foodstore commitments comes forward.
Tyldesley
7.33 The market share of Tyldesley in the comparison retail sector is shown to have
increased over the seven years to 2014. The borough-wide market share
remains less than 1.0% though, which means capacity going forward when
adopting a constant market share approach is only some 250 sq. m over the
period to 2026. This is significantly less than the capacity identified in the 2009
update, as a result of the lower projected growth in retail spending. This study
has identified some capacity for additional convenience retail floorspace in
Tyldesley, sufficient to support a small to medium sized convenience retail
store in the long term, which contrasts with the findings of the 2009 update.
The 2009 updated assessed existing convenience retail floorspace in

Wigan Retail and Leisure Study
6778763v4 P47
Tyldesley to be trading at below expected levels, to an extent where it
modelled no additional capacity over the period to 2027.
Wigan Retail and Leisure Study
P48 6778763v4
8.0 Conclusions
8.1 Wigan Metropolitan Borough Council commissioned Nathaniel Lichfield &
Partners (NLP) to prepare a borough-wide retail and leisure study. The study is
required to assess the current convenience and comparison retail and leisure
offer and to quantify the need for new floorspace. The study updates the
development plan evidence base replacing the 2007 study and subsequent
2009 update. This study is written to inform policy development and application
across the borough.
8.2 The study is informed by two telephone surveys of 1,400 residents total in a
survey area covering Wigan Borough and extending west into neighbouring
West Lancashire. The empirical research is supplemented by desk-based
research and analysis carried out by NLP.
8.3 The study considers the quantitative need for additional retail floorspace,
informed by the results of the household telephone surveys, and compares the
results to previous findings in the 2007 study and 2009 update.
Shopping Patterns 2014
8.4 The retention of convenience retail shopping expenditure in the borough is very
healthy at 91%, which is consistent with the position recorded by the 2007
study. Leigh attracts the greatest proportion of convenience retail expenditure
generated in the borough (21.7%) albeit the majority of this expenditure
(16.6%) is directed to larger format foodstores outside the main shopping area.
The market share of stores within and at the edge of Wigan town centre
(12.1%) is comparable with the market share of Asda Robin Park (11.9%).
Hindley (with a market share of 4.2%) provides a subordinate convenience
retail role at the centre of the borough.
8.5 Destinations across Wigan Borough retain 66% of the comparison retail
expenditure generated within it, which is an increase on the 59% recorded by
the empirical research informing the 2007 study. Whilst Wigan continues to
attract the greatest proportion of borough-wide comparison retail spending
(22.7%), this does not show any material change on the position in 2007. The
market shares of Robin Park (13.1%) and Leigh (10.7%) represent a
regression when compared with their market shares in 2007. The overall
conclusion is that it is the smaller centres which have contributed to an
increase in the proportion of comparison retail expenditure retained within the
borough, and particularly Ashton-in-Makerfield for which is recorded an
increase in market share from just over 1.0% to 4.5%. The introduction of new
larger foodstores (with comparison retail sales) and growth in the discount
comparison retail sector may be part of the explanation of why the comparison
retail market share of the smaller town centres has increased.

Wigan Retail and Leisure Study
6778763v4 P49
8.6 Bolton, Middlebrook Retail Park, Trafford Centre and Manchester are the
principal recipient destinations to which comparison retail expenditure from the
borough is leaked; collectively accounting for a market share of over 20%.
Retail Capacity Assessment
8.7 The retail capacity assessment assumes a constant market share, projecting
forward shopping patterns recorded by the 2013 RMG Clarity household
survey and the 2014 NEMS household survey. The quantitative assessment of
the potential capacity for new retail floorspace suggests that there is scope for
new convenience and comparison retail floorspace in most parts of Wigan
borough.
8.8 Table 8.1 and Table 8.2 summarise the capacity for additional convenience
and comparison retail floorspace for the defined town centres in Wigan
Borough. Capacity beyond 2019 should be viewed with caution as there is little
certainty over long term economic performance and prosperity.
Table 8.1 Convenience Capacity by Centre
Centre Convenience Capacity
At 2014 At 2019 At 2024 At 2028
Wigan 2,471 3,235 4,208 4,630
Leigh - - - -
Ashton-in-Makerfield 810 920 1,062 1,122
Atherton - - - -
Golborne 995 1,197 1,457 1,569
Hindley 257 462 726 839
Pemberton 122 158 205 225
Standish - 12 100 138
Tyldesley 636 815 1,047 1,145
Table 8.2 Comparison Capacity by Centre
Centre Comparison Capacity
At 2014 At 2019 At 2024 At 2028
Wigan - 3,260 9,397 12,257
Leigh - 1,192 3,436 4,470
Ashton-in-Makerfield - 165 475 619
Atherton - 148 426 555
Golborne - 42 120 156
Hindley - 108 312 405
Pemberton - 43 124 162
Standish - 65 186 242
Tyldesley - 67 193 252
Meeting Shopping/Leisure Needs in Wigan Borough
8.9 The NPPF states that local planning authorities should assess the quantitative
and qualitative needs for land or floorspace for retail development over their

Wigan Retail and Leisure Study
P50 6778763v4
development plan period. When planning for growth in their town centres,
LPAs should allocate a range of suitable sites to meet the scale and type of
retail development needed. It is important that the needs for retail and other
main town centre uses are met in full and not compromised by limited site
availability.
8.10 The adopted Core Strategy promotes retail development where a proposal
promotes the prosperity of the borough. It directs retail development to existing
town centres.
8.11 As set out above, the retail capacity assessment assumes that the market
share and role of Wigan, Leigh, Ashton-in-Makerfield and the smaller town
centres will remain unchanged in the future. Whilst this study is primarily a
quantitative capacity update and does not address the vitality and viability of
town centres, it is important to make reference to benefits derived from
qualitative improvements in retail and leisure provision. If a proposal for retail
or leisure development comes forward and that proposal exceeds the capacity
projections set out in Table 8.1 and Table 8.2, this does not necessarily mean
the proposal should be refused planning permission. Retail capacity is an
important consideration in the context of retail trade diversion and retail impact,
but it is also import to place this in context with whether a proposed
development is consistent with the role, character and catchment area of the
town or area it is intended to serve. It is important that such a qualitative
consideration sits alongside a consideration of whether a proposal is justified in
terms of the NPPF sequential approach and impact tests.
8.12 It is unlikely that the proportion of convenience retail expenditure generated
and retained in the borough will increase, but additional retail floorspace in
town centres across Wigan Borough could claw-back comparison retail
expenditure that is currently directed to locations outside of the borough.
8.13 The implications of major retail development in centres surrounding the
borough should also be monitored, with consideration given to the effect that
such proposals may have on the demand for additional retail floorspace in
Wigan.
Leisure Assessment Conclusions
8.14 This update of the evidence base focusses upon quantitative retail capacity,
but includes a qualitative assessment of commercial leisure provision. The
population of the borough (c. 317,800) provides a sizeable catchment
population for commercial leisure provision, and the draw of facilities within the
borough extends beyond the administrative boundary. Leisure attractions
elsewhere in Greater Manchester (and notably Middlebrook – which is 10
minutes’ drive from Aspull – and the Trafford Centre – which is 20 minutes’
drive from Leigh) will divert spending of Wigan Borough residents.
8.15 The NLP CINeSCOPE analysis of cinema provision concludes that there is not
any capacity for additional cinema provision in Wigan Borough. Empire at
Robin Park and Cineworld in Leigh are sufficient to meeting the needs of
Wigan Retail and Leisure Study
6778763v4 P51
cinemagoing residents of Wigan Borough. That said, there is the potential for a
new cinema in Wigan town centre to meet latent demand for a centrally located
facility that is accessible as a walk-in destination and by public transport. The
CINeSCOPE analysis also identifies potential capacity for additional provision
in the Chorley area, and it is possible that this market would be served by
additional provision in Wigan. The development plan does not need to make
specific provision for new cinema facilities, but proposals that come forward in
central areas and particularly to the north of the borough (in Wigan) could
assist in meeting unmet demand.
8.16 The health and fitness sector in Wigan has shown sustained growth, although
mirroring national trends this has tended to be in the budget/no contract market
rather than in the previously successful contract market. In common with
planning for cinema development, there is not any need for the development
plan to make specific provision for growth in this sector. The ten-pin bowling
market has witnessed decline, and a rise in ‘boutique bowling’ destinations is
so far restricted to higher order centres including Liverpool and Manchester.
8.17 The Bingo market has stagnated, and may well be the result of sustained
pressure from growth in on-line gambling and the continued effects on a ban
on smoking in buildings. There is not any requirement for the development plan
to include specific provision for new bingo halls within the borough.
8.18 This report includes commentary on indoor play centres, which is a growth
sector in the leisure industry and increasingly coming forward as part of mixed-
use developments. In common with other sectors of the commercial leisure
market, the development plan need not make specific provision for indoor play
centres but the local planning authority should be minded of the potential for
such uses to come forward.
Retail Assessment Conclusions
Wigan
8.19 Wigan is the largest settlement in Wigan Borough and is the principal town
centre as well as the main retail destination. It is one of the major sub-regional
town centres within Greater Manchester. Wigan provides a wide range of
shopping, service, leisure, business and public administration facilities that
meet the day-to-day needs of residents. The town has a good mix of
convenience and comparison goods retailers but the comparison retail goods
offer is impacted upon by proximity to the higher order centres of Liverpool and
Manchester and the offer of the Trafford Centre. Robin Park located outside of
Wigan town centre is also a big draw to residents of the borough.
8.20 There is capacity identified for both convenience and comparison retail
floorspace in Wigan. The Council should consider encouraging additional
comparison retail floorspace to be provided in units with larger modern formats
to meet contemporary requirements of high street retail operators, whilst
remaining appropriate to the scale of the town.

Wigan Retail and Leisure Study
P52 6778763v4
Leigh
8.21 Leigh is the second largest town in the borough and is a main town centre
subordinate only to Wigan. Leigh has a generous and varied convenience offer
for its size and a smaller number of comparison retailers and service uses that
serve residents of Leigh and areas in the south east of the borough.
8.22 Leigh has sufficient existing convenience retail floorspace to absorb growth in
convenience retail expenditure as it increases over the Core Strategy period.
There is scope for additional comparison retail floorspace in Leigh, and its
delivery will be important to ensure that the town maintains its role in the local
retail hierarchy and competes more effectively with higher order centres in the
sub-region. In the longer-term, capacity identified could give rise to a sizeable
extension to Leigh town centre.
Ashton-in-Makerfield
8.23 The third largest and another main town in the borough is Ashton-in-
Makerfield. Although it does not have as comprehensive an offer as the larger
centres of Wigan and Leigh, Ashton-in-Makerfield is an important retail centre
meeting the shopping needs and services of residents living in the south of the
borough.
8.24 There is capacity identified for both additional convenience and comparison
floorspace in Ashton-in-Makerfield which would assist with cementing its
position as one of three main town centres in the borough.
Smaller town centres
8.25 There are six other smaller town centres in Wigan Borough, and a series of
local centres. The six defined smaller town centres offer every-day goods and
services and offer a well-established network of convenience retail provision.
8.26 Based upon the constant market share approach, there is limited capacity for
additional comparison floorspace within these towns, albeit there is scope for
satisfying an under provision of convenience retail floorspace in Golborne and
Tyldesley. The 2014 study serves to demonstrate once again the dominance of
the larger centres in the borough and the attraction to residents of Wigan
Borough of nearby higher order centres and destinations.


