Page 1
AC 2011-1110: STUDYING IDEATION IN ENGINEERING DESIGN
Patrick W Pace, The University of Texas at AustinKristin L. Wood, The University of Texas, AustinJohn J Wood, U.S. Air Force Academy
Dr. John J. Wood is currently an Associate Professor of Engineering Mechanics at the United StatesAir Force Academy. Dr. Wood completed his Ph.D. in Mechanical Engineering at Colorado State Uni-versity in the design and empirical analysis of compliant systems. He received his M.S. in MechanicalEngineering at Wright State University and his B.S. in Aeronautical Engineering from Embry-RiddleAeronautical University in 1984. Dr. Wood joined the faculty at the United States Air Force Academy in1994 while serving on active duty in the U.S. Air Force. After completing his Ph.D. in 2002, he returnedto the Air Force Academy where he has been on the faculty ever since. The current focus of Dr. Wood’sresearch is the continued development of empirical testing methods using similitude-based approaches.This approach provides significant potential for increasing the efficiency of the design process througha reduction in required full-scale testing and an expansion of the projected performance profiles usingempirically-based prediction techniques. Dr. Wood’s research also includes the development of micro airvehicle systems using innovative conceptual design techniques for current technology implementations,as well as futuristic projections, applied in the framework of a senior capstone design course.
Daniel D. Jensen, U.S. Air Force Academy
DANIEL D. JENSEN Dr. Jensen received his B.S. in Mechanical Engineering, M.S. in EngineeringMechanics and Ph.D. in Aerospace Engineering Science from the Univ. of CO at Boulder. His industrialexperience includes Texas Instruments (mechanical design), Naval Research Labs (computational dynam-ics), NASA Langley funded post doc (finite elements), consulting at Lockheed and Lawrence BerkeleyNational Labs (computational mechanics) MSC Software Corporation (educational multimedia develop-ment) and Creo Consulting (Mechanical Engineering Consulting). He taught at Univ. of the Pacific for4 years and is currently a Professor in the Department of Engineering Mechanics at the U. S. Air ForceAcademy. He has published approximately 100 technical publications and generated approximately 2million dollars of research finding. His current research interests include development of new designmethodologies as well as methods for improving engineering education.
c©American Society for Engineering Education, 2011
Page 2
Studying Ideation in Engineering Design Education: Application to Highly
Mobile Robots
Introduction
Developing innovative ideas as part of engineering design can be limited by the field of
technology and the engineer’s or design team’s understanding of the field. Without sufficient
understanding of an emerging technical field, ideation may be hampered by reinventing the
proverbial wheel or by a lack of knowledge of the underlying physical principles and state of
technology. When starting to solve design problems, designers may not fully benefit from
ideation methods alone due to problems such as design fixation [1-6]. Pursuing flawed designs
or designs that will underperform existing solutions may likewise occur from the lack of
understanding of the field.
Existing research examines supplementing the ideation process as well, such as seeking
and using analogies, fostering creativity and examining transformation principals in order to
achieve greater innovation [7-30]. These mentioned studies cover important topics and are
shown to assist designers achieve improved innovation.
The engineering education research presented here seeks to develop a tool and methodology
intended to strengthen a designer’s or design team’s understanding of a field and relevant
technologies in order to foster creative and innovative solutions. A relevant finding in the
psychological literature is that individuals who acquire experience with classes of information
and procedures tend to represent them in relatively large, holistic “chunks” in memory,
organized by deep functional and relational principles [31-33]. Many researchers have argued
that this ability to “chunk” underlies expertise and skill acquisition [34,35]. However, if the task
at hand requires the individual to perceive or represent information in novel ways, e.g., to
stimulate creative ideation in design, representation of that information in chunks might become
a barrier to success, particularly if processing of component parts of the information chunks
helps with re-representation [36-38].
To accomplish the goal of this research in the context of these findings, first a thorough
search must be performed to collect all possible information in a technical field. Data is
consolidated in an electronic spreadsheet programmed to ease data management and provide the
Page 3
ability to efficiently analyze design solutions. Critical metrics for the given application are
generated and comparative results are plotted. Analysis of the plotted information may lead to
understanding existing trends, identifying voids where opportunities exist to expand the design
space, as well as general insights into the field leading to more beneficial concept generation
sessions and effective use of concept selection tools.
The effectiveness of the stated design methodology and tool are investigated for the problem
domain of developing a mobile cave and tunnel exploration type robot. Senior cadets from the
U.S. Air Force Academy (USAFA) perform concept generation sessions before and after
utilizing the presented tool to understand the existing technology, where the results are examined
to determine the impact and utility of the tool in design and as part of engineering design
curricula. A second experiment is also conducted with graduate students from The University of
Texas (UT) at Austin to further analyze the effectiveness of the tool on quantity and quality of
the concepts generated. These experiments aim to demonstrate that state-of-technology design
tools provide an effective foundation and platform for designers to generate a larger quantity of
concepts, with higher quality and novelty. There exist significant implications on engineering
design education from this process. For example, the systematic mapping of the state-of-the-art
in a field is an important learning objective and skill to be nurtured in our engineering students as
they explore and solve design problems.
Background
Techniques to foster creativity have long been researched. One of the most popular methods
is Osborn’s brainstorming [39] though hundreds now exist [40]. Another pioneering technique is
Brainsketching, attributed to Rohrbach [41]. Both these techniques aim to aid individuals or
groups to generate the largest quantity of ideas so that solutions may be pulled from as large a
solution space as possible, which is crucial to the designer as the quantity of initial solutions to a
problem is correlated to the success of a product [42]. In addition to the fundamental ideation
methods, much study has been focused on how to properly administer and supplement ideation.
One large area of research is the use of analogies to increase innovation [7,43,44]. Analogies
allow connections to be drawn that are otherwise much harder to generate, thus, understanding
the psychology behind how persons conceive analogous solutions is beneficial. More specific
approaches to supplementing ideation have been examined as well, such as utilizing
transformational design principals to increase innovation [45]. The research at hand seeks to
understand the influence of a thorough examination of a particular product field on the ideation
process. Namely, understanding where current technologies perform, in general and relative to
each other, as well as identifying insights, gaps in technologies, and current technological
limitations allows designers to see opportunity for new combinations of existing solutions, new
applications, or otherwise positively affect ideation.
Page 4
Development of Design Tool and Methodology
Application to Highly Mobile Robotics
In order to test the proposed methodology of systematically collecting and reviewing existing
technology in a field, the proposed methodology is applied to solving a robotic design problem.
Among the many uses of robotic systems, there is an increasing demand for them to both
increase accessibility as well as remove humans from hazardous or toxic environments or
situations. Often applications require robotic systems to possess high traversing mobility. Such
applications include search and rescue robots for manmade and natural disasters, intelligence
reconnaissance and surveillance (ISR), and exploration (terrestrial or extraterrestrial). These
environments provide for challenging mechanical designs for the robotic systems, often with
conflicting objectives. Low mass is desirable for portability as well as lower energy
consumption, thus lower energy storage requirements which is often a limiting factor. Size may
also influence portability, where smaller is desirable but may negatively affect the maximum
obstacle size a robot can surmount. This application is thought to serve as a practical, interesting
and challenging area, ripe with opportunity for innovation, making it an ideal test bed for the
methodology validation. A summary of the derived performance requirements for such
applications follows, which sets the goals for participants to try to meet during the validation
processes.
Design Problem
The specific design problem presented to the participants deals with the design of a robot to
explore an underground cavity such as a cave or tunnel. The access to the cavity will be through
a bore hole, roughly 8 inches in diameter. Once in the tunnel, the robot must traverse up to 450
yards along the tunnel, be able to negotiate rubble, rocks, water and mud. Expectedly the most
challenging requirement is for the device to negotiate a two foot shear ledge as well as traverse
across a two foot crevice. The robot should also be able to return to the point of insertion for
retraction to the surface. Additional requirements include a payload carrying capacity (volume)
of 4in x 4in x 5in, use a minimum amount of energy and have a low mass to both aid portability
and energy consumption.
Empirical Study and Search Techniques
The proposed methodology requires the collection of data for a particular field best
accomplished through an empirical study of the field. A summary of the research methodology
is shown in Figure 1. Advantages of studying the current state of robotics include minimizing
the duplication of previously established technology and identifying gaps in current technology
that is yet to be explored. The study of exploration type robotic systems begins by obtaining data
from multiple sources including databases of professional societies such as ASME and IEEE and
their respective journals and conferences, other scientific journals such as Elsevier, as well as
robot manufacturers. Additionally, contacting research organizations seeking initial or additional
data helps expand the knowledgebase. Querying the sources to obtain relevant results was done
by searching the following categories and keywords: robots and robotic systems relating to ISR,
Page 5
search and rescue, defense applications such as room clearing and perimeter monitoring, obstacle
capability and avoidance, climbing, stair climbing, jumping, hopping, and mobility.
Interchanging the keywords allows for a larger quantity of search results. For example, results
are increased by searching each database for “hopping OR robot”, “hopping robot” and similar
searches and combinations for the remaining keywords: climbing, jumping, search and rescue
etc. Typically, the first 100-200 hits are scanned manually for relevance to the problem, and the
relevant articles saved for review. Due to obtaining a large amount of information, it became
necessary to systematically record the gathered information in a useful means, which lead to the
development of an electronic repository.
Figure 1 – Research methodology process
Repository Creation
From the results, a software based repository of information is built which aides in the
analysis of the information [46,47]. The repository includes information such as dates, people
and places involved with the work, the enabling mobility technology and the robot performance
specifications. Additions to the repository continue with the discovery of new information or
when researchers or developers release new information.
Contents
On reviewing the field, the repository holds data from approximately 70 robotic platforms and
consists of the data mentioned above as well as ten raw performance metrics for each device
(where available) as well and another twenty derived metrics useful for comparison. Robotic
systems consist of locomotive technologies and obstacle negotiating technologies. The existing
design space explored results in a collection of robots spanning one legged hopping robots to six
wheeled all terrain systems, as well as combustion powered jumping to using momentum to
Page 6
assist climbing. The repository includes a number of plots as they allow for the visual
comparison of particular metrics in order to assess the data and gain insights into the field, and
will be discussed below. After the creation of several plots, it became clear that organizing the
data into two main categories is beneficial: the locomotive technology and obstacle negotiating
technology. Allowing for the separation of this information suits the review of metrics that are
linked more directly to one metric over the other. For example, desiring to review energy
consumption while traversing would apply to the locomotive technology while one would
conversely be concerned with the particular obstacle negotiating technology to review how high
an obstacle robotic system’s technology can surmount. These two main categories consist of 6
and 16 various technology subcategories, respectively.
The subcategories represent the range of technologies discovered, and therefore, the
technologies available for comparison and analysis; they are shown in Table 1. Pictures of the
devices are shown in Appendix A to help visualize the type of system comprising each group and
to understand what a particular technology is, such as the wheg which can best be described as
multiple rotating legs but easier to understand visually. Firstly, it is necessary to note that in
some instances, the locomotive technology doubles as the obstacle negotiating technology. This
is because most locomotive technologies have an inherent ability to surmount obstacles up to a
limit. In the case for wheels, the limit would be the radius, for legs or for whegs it may be one
half to twice the height of the leg or wheg, for example. The locomotive technologies are the
technology a system utilizes for traversing and are self explanatory. Tracked robots are those
that use a tread system, similar to a tank, the snake subcategory is for systems that mimic snakes
in appearance and motion, VTOL represents vertical takeoff and landing systems (such as a
helicopter), thrust devices utilize thrust for locomotion and/or obstacle negotiation, buoyant
systems separate systems that are buoyant in air. Systems that have portions that expand, such as
a telescoping portion, are categorized together; segmented systems have multiple segments,
which may rotate, but if they are able to separate further or closer to each other it would be
labeled an expanding technology. Springs and pneumatics systems use either a spring and/or
spring with linkages or a pneumatic system, respectively, as an energy system to surmount
obstacles. The grasp category is for technologies that can grasp in order to assist surmounting
obstacles, whether by hooking or grabbing as such with a human hand. The adhesion category
houses systems that adhere to a surface to surmount obstacles; similarly vacuum systems use
suction. Van der Waals systems use the said force in order to overcome obstacles, such as
natural or synthetic materials mimicking gecko’s feet.
Page 7
Table 1 - List of Technologies Captured in Repository
Locomotive
Technologies
Obstacle Negotiation
Technologies
Wheel Wheel
Wheg Wheg
Leg Leg
Track Track
Snake Snake
Thrust VTOL
Thrust
Buoyancy
Expand
Segment
Spring
Pneumatic
Grasp
Adhesion
Van der Waals
Vacuum
Metrics
As mentioned above, the repository holds approximately ten metrics representing raw
collected data as well as twenty representing derived values based on raw data, such as the cross
sectional diagonal length or power to weight ratios. The majority of the listed metrics relate
strongly to the counter tunnel robotics scenario, however, to broaden the applicability of the
research as well as for potential future use, commonly reported data is also collected, such as the
maximum speed of the robots which is not critical for the research on hand. Not all data sources
provide information for all 10 raw metrics, but all available information is recorded when
reviewing a particular robotic system. Recording the mobility metrics is critical in order to later
compare the relative performance of the technologies and a list of the metrics collected and
derived is shown in Table 2.
Initially, one approach considered to increase the value of the metric comparisons is to
normalize the metrics. For the given research problem, simply having a high payload capacity,
large obstacle height capability or low power requirements is not sufficient to guarantee an
acceptable level of performance. For example, even if a particular design overcomes tall
obstacles, it is not of use given the specific requirements unless it also has a small cross sectional
diagonal. Again, the ability to carry a large payload mass may not be useful if the system itself
has a very large mass. Therefore, the goal is to seek systems or technologies that perform
relatively well as a ratio of their metrics, such as a high obstacle height to cross sectional
diagonal ratio. Though utilizing normalized metric is a sound idea, due to holes in the collected
data plotting normalized metrics against one another may reduce the information on the charts as
well as making interpretation of the information ambiguous and difficult to understand. Working
around the lack of plots utilizing normalized metrics is accomplished by examining additional
plots that would have otherwise been condensed to a single plot. For example, only one chart is
Page 8
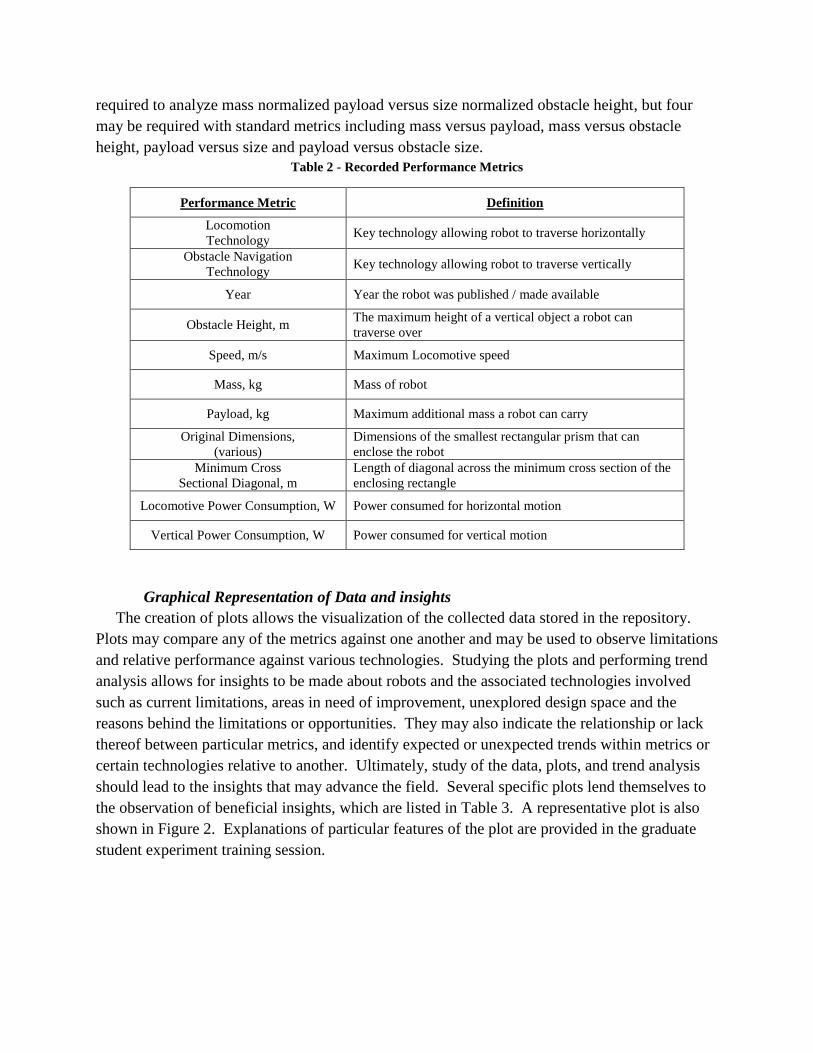
required to analyze mass normalized payload versus size normalized obstacle height, but four
may be required with standard metrics including mass versus payload, mass versus obstacle
height, payload versus size and payload versus obstacle size.
Table 2 - Recorded Performance Metrics
Performance Metric Definition
Locomotion
Technology Key technology allowing robot to traverse horizontally
Obstacle Navigation
Technology Key technology allowing robot to traverse vertically
Year Year the robot was published / made available
Obstacle Height, m The maximum height of a vertical object a robot can
traverse over
Speed, m/s Maximum Locomotive speed
Mass, kg Mass of robot
Payload, kg Maximum additional mass a robot can carry
Original Dimensions,
(various)
Dimensions of the smallest rectangular prism that can
enclose the robot
Minimum Cross
Sectional Diagonal, m
Length of diagonal across the minimum cross section of the
enclosing rectangle
Locomotive Power Consumption, W Power consumed for horizontal motion
Vertical Power Consumption, W Power consumed for vertical motion
Graphical Representation of Data and insights
The creation of plots allows the visualization of the collected data stored in the repository.
Plots may compare any of the metrics against one another and may be used to observe limitations
and relative performance against various technologies. Studying the plots and performing trend
analysis allows for insights to be made about robots and the associated technologies involved
such as current limitations, areas in need of improvement, unexplored design space and the
reasons behind the limitations or opportunities. They may also indicate the relationship or lack
thereof between particular metrics, and identify expected or unexpected trends within metrics or
certain technologies relative to another. Ultimately, study of the data, plots, and trend analysis
should lead to the insights that may advance the field. Several specific plots lend themselves to
the observation of beneficial insights, which are listed in Table 3. A representative plot is also
shown in Figure 2. Explanations of particular features of the plot are provided in the graduate
student experiment training session.
Page 9
Table 3 – Plots and Gained Insights
Plot Insights
Obstacle Height Vs.
Minimum Diagonal
1. Springs produce high obstacle height to size ratios, but limited to small
designs
2. Pneumatics designs can be independent of robot size, i.e. large and small
design can be made to surmount large obstacles
3. Wheels and tracks have small increases in obstacle height capability with
increase in size
4. Some Segmented designs can be made to have high obstacle height to size
ratios
5. Wheels / Whegs / Tracks require additional or complementary technology to
surmount relatively large obstacles
Obstacle Height vs.
Mass
1. Thrust, Springs, Pneumatics have high height to mass ratios, i.e. can get a
given mass over taller obstacle than other technologies
2. Segmenting can result in >2x higher obstacle/mass ratios
3. Legs have low obstacle height to mass ratios
4. Springs are not currently suitable for larger mass applications
Obstacle Height vs.
Vertical Power
Consumption
1. Instantaneous power can be reduced by spreading work over time
2. Thrust based designs have large power requirements
Payload vs. Mass
1. Springs have very low payload capacity - innovation required
2. Tracked vehicles have large payload capacities
3. Legged designs have high payload to weight ratios
4. Trust designs have low payload to weight ratios - innovation required
Locomotive Power
vs. Mass
1. Tracks use locomotive energy efficiently
2. Whegs are highly dependent on design, but can be efficient
Page 10
Figure 2 – Representative Plot for Training Sessions
Validation of Design Methodology
Graduate Student Experiment
Hypothesis
The expectation is that when a designer follows the developed methodology in order to
understand the relevant technologies, observe the trends and existing design space, and analyze
general relative positions of the technologies against critical design metrics, she/he will be able
to generate a larger quantity of solutions, be more likely to combine technologies in new ways or
otherwise generate novel solutions, and by understanding practical limitations, will generate
higher quality solutions.
Participants
The participants for the experiment are master’s and doctorate students from UT Austin. All
participants have previously been exposed to design engineering concepts either in their course
work and/or their research. In particular, most participants will have previous experience with
mind mapping and the C-Sketch methods. The experiment is conducted during three one hour
sessions with one week between sessions. To encourage participation, a light dinner is provided
during each session.
Experimental Method
An experiment is conducted to compare the impact on designers who are exposed to the
design tool and methodology. A group of twelve designers is assembled and given a design
Page 11
problem to solve over the course of three sessions. The first session collects solutions that
participants form without exposure to the design tool and methodology, the second session
familiarizes participants with the design tool and methodology and the third session collects the
impact the design tool and methodology has made on the group. For the first session, all
participants perform a mind mapping session [48] in the same room so that there is a common
starting knowledge of potential design solutions. After the mind mapping session, the group is
split into two groups and participants will meet only with their respective group for the
remainder of the experiment. During the next portion of the first session, the individual groups
perform an initial C-sketch session [49-51] intended to serve as the baseline performance
expectation. The second session requires thirty minutes and consists of informing the groups of
the design methodology to be evaluated and training them in its use. Groups are given a one
week break before rejoining for the third session to perform another C-sketch session to capture
the impact the design methodology has had on the participants. The performance of the groups
will be determined through examining and comparing the results of each group’s first C-Sketch
results to their final C-Sketch results.
Procedure
First Session – Combined
For the first session all participants meet together for an introduction to the design problem
and to perform a mind mapping session. The facilitator describes the design problem to the
participants and distributes a figure (Figure 3) to each participant to help solidify the
requirements of the design problem. The facilitator leads the group into identifying all possible
technologies available to solve the design problem through populating the mind map. To reduce
the amount of time the mind mapping session requires, but to allow the participants to ponder
solutions, a partially completed mind map will be distributed on a sheet of letter paper (Figure 4).
The facilitator will then lead the group and encourage ideas to be added to the mind map; when
an idea is suggested by a member, the facilitator will interpret the idea and suggest the location
for all participants to write down the idea or solution on their copy. These activities will be
completed in the first twenty minutes of the session and are intended to form a common
knowledge base for all participants. The group then divides into two individual groups for the
first C-Sketch sessions. The group is split by each participant taking a sheet of butcher paper
from a back table in the room randomly labeled with either “A” or “B”. Before breaking the
assembly into the individual groups, the facilitator reviews the rules for the C-Sketching
sessions, which will be identical for both sessions and are: (1) criticism is not allowed, (2) “wild
ideas” are welcomed, (3) build off each others’ ideas; similar rules to Osborn’s brainstorming
[40,39].
Page 12
Figure 3 - Figure Depicting the Design Problem
Figure 4 – Partially Completed Mind Map Distributed to Participants
Page 13
First Session – C-Sketch
After establishing the two groups and they move into different rooms, the first C-Sketch
session begins. Short annotations to help clarify a concept will be an allowed variation to the C-
Sketch method. To ensure participants understand the level of detail as well as the overall
expectation of the session, a printout of a model C-Sketch session will be distributed to each
participant. Butcher paper will be provided as well as flow ink pens for the participants to sketch
their ideas. Additionally, each participant will have a unique color pen to ease tracking the
origin of ideas as well as separating original concepts from addition. The session is run as
follows: participants are given 12 minutes total to sketch their three original concepts. The
sheets of butch paper will then be rotated 5 times, with 6 minutes per rotation for participants to
add onto the original concepts. The facilitator collects all the materials at the conclusion of each
session.
Second Session – Training
The second session aims to help the participants understand the technological field and equip
them with both tools and an approach intended to increase their quantity, novelty, and quality of
solutions. The training session is designed to take half an hour to complete and includes four
main focuses.
Training Sessions and Materials
As the methodology consists largely of examining the collected robotic performance
information, it is crucial to present the information in a manner that is intuitive to understand as
well as accurately represent the relative performance of competing technologies as well as the
voids in the design space. Plots were created with several features to ease the interpretation of
the information. Trends identified on the plots show where a technology would likely lie across
the design space. Trends are shown on the plots as solid lines for R2 values greater than 0.75,
and as red dashed lines for lesser R2 values in order to indicate their unreliability; however, they
are included to indicate the likely trend. Ovals highlight instances where the expected trend was
broken. Highlighting the trend breaking technologies is meant to illustrate that novel solutions
usually break trends, and are due to new combinations of technologies or redesigns of existing
technologies. Lastly, arrows along the axis indicate which direction along the axis represents
increasing performance. A representative plot was shown previously in Figure 2. Additionally,
including photos of each technology category is meant to help participants visually solidify the
nature of each category since the written labels may be difficult to accurately interpret (see
Appendix A).
The first five minutes are used to reiterate the design problem along with encouraging the
participants to find innovative solutions, mentioning design conflicts found in the design
problem and introducing participants to the proposed design methodology. The emphasis on
innovation is to help stimulate original thought among the participants, but is also true of the
design problem as no known solution fulfills the requirements of the design problem to an
Page 14
acceptable level. Mentioning key design conflicts is done to help participants seek innovative
ideas to solving the conflicts when plots are reviewed. The conflicts include two size conflicts,
as well as energy conflict. The first size conflict is that the robot must surmount vertical
obstacles and crevices up to three times higher or wider than the allowable maximum cross
section diagonal of the robot. The second size conflict is that when the payload is placed in the
bore hole, there is little room for supporting structure to be placed around the payload. Lastly,
there is a conflict with the energy requirements. Maximum service or deployment time requires
an increasing amount of energy storage which means an increasing amount of mass. However,
decreasing the mass of the robot will reduce power requirements and increase the deployments
time. It is also mentioned that increasing the efficiency of the device is crucial in order to reduce
power requirements and therefore increase deployment time. Toward the end of the five minute
introduction, the proposed design methodology is briefly described.
The second focus of the training takes ten minutes and is meant to review the collected data
relevant to the design problem and serve as an introduction to the plots. Participants are
introduced to each of the five plots, reasoning for their inclusion, and the use and distinction of
log and linear scale. Next, participants are asked to seek certain information found on the charts
to increase familiarity. As the trainer and participants review the included plots, questions are
presented to the audience for them to ponder and verbally respond. The questions mainly center
on asking the participants to review the plots and identify which technologies perform well or
poorly against certain metrics, and about apparent limitations of certain technologies.
For the third focus, also ten minutes in duration, the participants are introduced to how the
methodology and training materials are intended to be used to increase the quantity, novelty and
quality of solutions to the design problem. The two main techniques discussed are seeking
combinations of technologies from the data and combining personal knowledge or intuition with
the data to form new ideas. The third focus is concluded with an example to show how the data
may be applied to a practical problem. In order to showcase how combinations of technologies
often results in innovation and in expanding the design space, exemplar combinations are
discussed. These exemplar designs include an urban hopper that uses combustion to fill a
pneumatic cylinder rather than a compressed gas, a device that utilizes ducted fans to fly over
objects using short bursts of energy, and a track-snake hybrid that uses multiple segments to
mimic snake-like motion, but utilizes tracks to drive eliminating the difficult control previously
synonymous with snake like devices. Next, it is pointed out that including personal knowledge
and intuition can be very helpful in interpreting apparent trends as not all trends are necessarily
correct. It is also mentioned that there are holes in the data, and some technologies may be
misrepresented or completely absent due to lack of data. By imagining where missing data may
lie, or where a particular technology trend should lie, it may be possible to spark new ideas. To
conclude the third focus, participants are given the following design problem and challenged to
seek solutions using the plots and proposed method. The design problem is to seek combinations
of technologies (presented or intuitive) that would make for a good bug squishing device which
must be capable of jumping over walls as well as carrying a payload of insecticide. It is
Page 15
explained that extra mass is beneficial to ease squishing, and the environment in which it is to be
used will have an uneven floor with walls or dividers that the device must overcome.
Participants are encouraged to view charts relating mass to obstacle height capability and
payload capacity to obstacle height capability in order to find combinations of technologies that
would suit the design need.
The last focus is a five minute conclusion to highlight what is expected of the participants
regarding the use of the tool for the third session and key points of the training. Participants are
encouraged again to seek combinations of technologies shown on the chart as well as personal
knowledge of shown or unrepresented technologies in order to form new solutions to the design
problem. Additionally, participants are instructed to seek these combinations or new ideas
instead of repeating ideas they recall from the first C-Sketch session on the second C-sketch, but
that it is allowed to reuse an idea from the first session if they think of a way to alter or modify
the idea in a way that significantly increases the performance of that idea.
Third Session – Final Mind Map and C-Sketch
The format of the third session is much like the first, but the groups are separated for the
entire third session. There is a 20 minute mind mapping session for each individual group,
followed by a 40 minute C-Sketch session with a 12 minute initial sketching period, and 6
minute rotations. A scan of the final mind map from the first session is printed and distributed
on legal size paper to give participants more room to record new ideas. Participants are again led
by a facilitator and are encouraged to completely verbally explore the design space. The
facilitator again interprets the vocalized solutions and suggests a location for the participants to
write the suggestion on their mind map. Upon conclusion of the mind mapping session, the
groups perform the final C-Sketching session. Materials are then collected and analyzed by the
primary researcher.
Evaluation of Results
Metrics
In order to interpret the results and determine the effectiveness of the design tool and
methodology, the solutions are quantified in regards to quantity, quality, and novelty. Analysis
techniques are similar to Lindsey’s adaptation of several methods as previously developed my
Shaw. [51,52].
Quantity
Measuring the quantity of ideas serves as a useful means to determine the tool and
methodology’s effectiveness as the quantity of unique solutions has been shown to be crucial in
the success of product development [42]. Defining the total number of single ideas based off
hand drawn sketches can be a difficult task to standardize. Utilizing a method adapted from
Shah et al. [49] by Linsey et al. [40] allows for the quantity to be defined. The rules for defining
a single idea are summarized in Table 4. Prior to evaluating the C-Sketches for quantity, a
function list is generated, and, in general, the number of functions a given concept fulfills
Page 16
represents the number of ideas that the concept represents. The list may be modified as
reviewing the concepts may lead to a more comprehensive list then initially created.
Table 4 – Rules for Counting Single Ideas
1. An idea solves one or more functions in the functional basis
2. The same idea (or component) being used in multiple places counts as one idea
3. Each idea counts as only a single idea even when solving more than one function
4. New Combinations of already-counted ideas are counted in a separate measure
5. Categories of ideas only count as ideas when no subordinates are given*
6. Ideas count even if they are not needed or cause systems not to function
7. Ideas must be shown and not implied
8. When an idea reframes the problem, they are placed in a category called “Problem Reframing”
These ideas may not address the problem but meet higher level customer needs
a. These ideas do not typically fit a defined function well
b. They must add a function to the system
c. They count as an idea if they produce a product different than the original customer needs
*If a general pulley and a timing pulley are given, it counts as one idea as one is a sub-type of the other
Comparing the quantity of ideas the teams produce before and after exposure to the methodology
indicates whether or not the method has a positive impact on the participant’s ideation process.
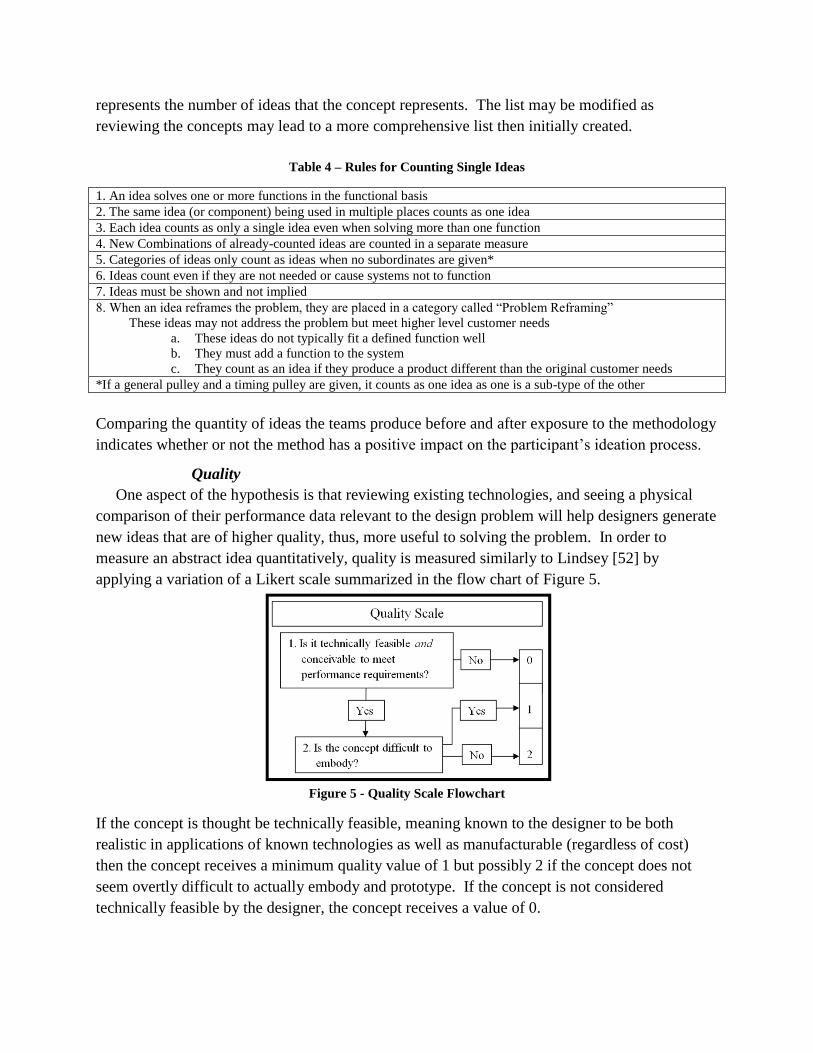
Quality
One aspect of the hypothesis is that reviewing existing technologies, and seeing a physical
comparison of their performance data relevant to the design problem will help designers generate
new ideas that are of higher quality, thus, more useful to solving the problem. In order to
measure an abstract idea quantitatively, quality is measured similarly to Lindsey [52] by
applying a variation of a Likert scale summarized in the flow chart of Figure 5.
Figure 5 - Quality Scale Flowchart
If the concept is thought be technically feasible, meaning known to the designer to be both
realistic in applications of known technologies as well as manufacturable (regardless of cost)
then the concept receives a minimum quality value of 1 but possibly 2 if the concept does not
seem overtly difficult to actually embody and prototype. If the concept is not considered
technically feasible by the designer, the concept receives a value of 0.
Page 17
Novelty
Often the trend breaking and high performing solutions are unique solutions, so another
metric chosen to evaluate the effectiveness of the design tool and methodology is Novelty.
Novelty is measured as a function of variety. As in Linsey’s work [52], the variety is calculated
by having a rater group similar solutions into bins, the more a group spans the total number of
bins with their concepts, the higher variety score they receive. Calculating the novelty is done by
applying Equation 1 which is Jansson and Smith’s measure of originality [1]. Novelty scores are
calculated for each bin in which a concept lies, and averaged for each team and session.
ConceptsofNumberTotal
ConceptsSimilarofNumberfrequencyNovelty
___
___11 Equation 1
For this work, the total number of concepts will be the number of bins created when all concepts
from both C-Sketch sessions and both teams are sorted and grouped; doing this is meant to create
the largest design space for the relatively small experimental population. The number of similar
concepts is the number of bins the concepts from a particular session form. To evaluate whether
novelty increased or decreased as a result of the exposure to the design methodology, the novelty
value for a team’s third C-Sketch session will be compared to each team’s first C-sketch novelty
value.
Cadet Exposure
Presentation of Design Tool
Cadet exposure to the design methodology follows an initial 6-3-5 concept generation
technique to generate solutions to the robotics problem. Presentation to the Cadets serves to
evaluate if detailed knowledge of the field, presented in graphical format to ease comparison of
technologies and the design space, can increase the number of solutions as well as the quality of
solutions. Cadets were given instruction to the use of the trends and insights from the data were
discussed.
Cadet Use of Design Tool
When the tool was implemented, cadets had previously generated over 100 solutions. The
first use of the tool was for the various technologies represented in the tool to be reviewed by
groups of cadets. Each group reported on their respective findings and discussed what they
thought would be beneficial to solve the design problem, and from these discussions the cadets
discussed ideas that they would be interested in pursuing. Cadets also used the tool to research
and expand on initial concept generation ideas by circulating existing sketched design solutions
and adding new ideas which had resulted from reviewing the tool data. Using appropriate plots,
cadets ranked technologies based on mobility capability by using tool data. The ranking served
to rate existing conceptual solutions and assist in concept selection.
Page 18
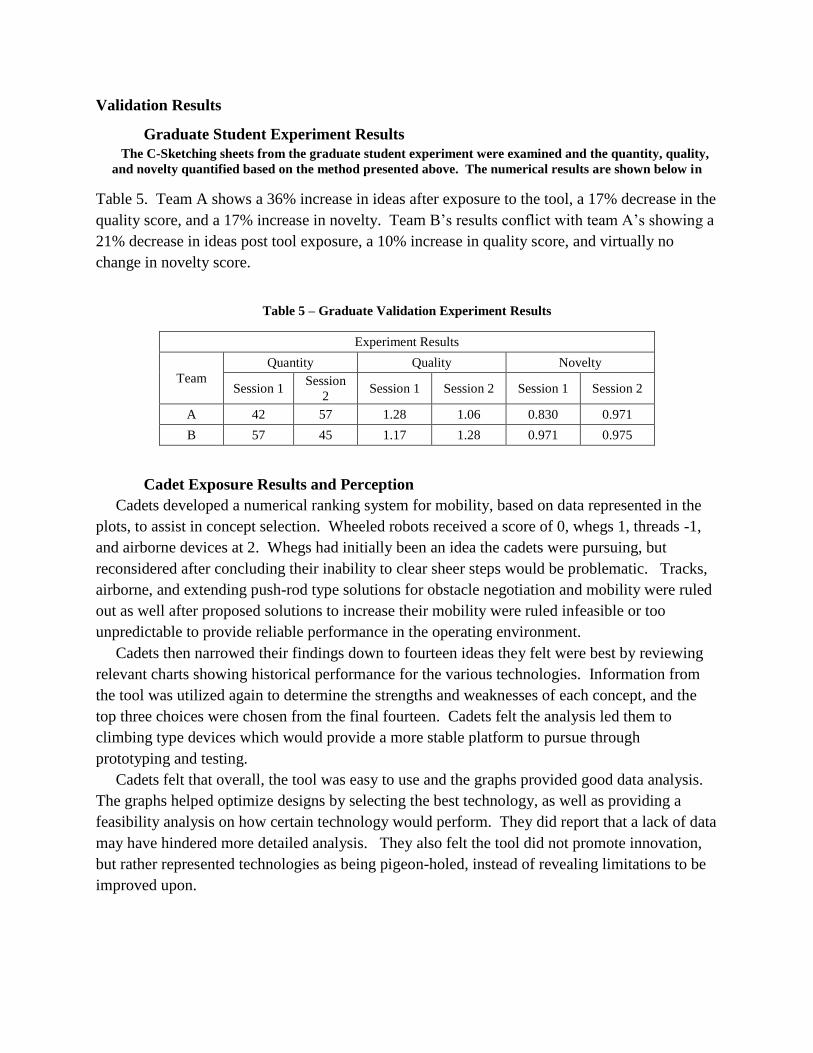
Validation Results
Graduate Student Experiment Results
The C-Sketching sheets from the graduate student experiment were examined and the quantity, quality,
and novelty quantified based on the method presented above. The numerical results are shown below in
Table 5. Team A shows a 36% increase in ideas after exposure to the tool, a 17% decrease in the
quality score, and a 17% increase in novelty. Team B’s results conflict with team A’s showing a
21% decrease in ideas post tool exposure, a 10% increase in quality score, and virtually no
change in novelty score.
Table 5 – Graduate Validation Experiment Results
Experiment Results
Team
Quantity Quality Novelty
Session 1 Session
2 Session 1 Session 2 Session 1 Session 2
A 42 57 1.28 1.06 0.830 0.971
B 57 45 1.17 1.28 0.971 0.975
Cadet Exposure Results and Perception
Cadets developed a numerical ranking system for mobility, based on data represented in the
plots, to assist in concept selection. Wheeled robots received a score of 0, whegs 1, threads -1,
and airborne devices at 2. Whegs had initially been an idea the cadets were pursuing, but
reconsidered after concluding their inability to clear sheer steps would be problematic. Tracks,
airborne, and extending push-rod type solutions for obstacle negotiation and mobility were ruled
out as well after proposed solutions to increase their mobility were ruled infeasible or too
unpredictable to provide reliable performance in the operating environment.
Cadets then narrowed their findings down to fourteen ideas they felt were best by reviewing
relevant charts showing historical performance for the various technologies. Information from
the tool was utilized again to determine the strengths and weaknesses of each concept, and the
top three choices were chosen from the final fourteen. Cadets felt the analysis led them to
climbing type devices which would provide a more stable platform to pursue through
prototyping and testing.
Cadets felt that overall, the tool was easy to use and the graphs provided good data analysis.
The graphs helped optimize designs by selecting the best technology, as well as providing a
feasibility analysis on how certain technology would perform. They did report that a lack of data
may have hindered more detailed analysis. They also felt the tool did not promote innovation,
but rather represented technologies as being pigeon-holed, instead of revealing limitations to be
improved upon.
Page 19
Discussion and Conclusion
Graduate Study
Results from the experiment are mixed as quantity and quality are shown to both increase and
decrease with exposure to the design methodology. Group A shows that exposure may lead to an
increase in novelty, but group B demonstrates that it is also possible to produce good novelty
without exposure. Several additional conclusions are drawn upon further non-quantitative
analysis completed to help interpretation of the results. Since quantity only considers non-
redundant ideas, the average ideas per sheet including redundancies is calculated in order to
determine if exposure increases combinations of identical ideas on various concepts, or
potentially more hybrid concepts. This was not found to be the case as the quantity of ideas per
sheet follows the same trend as quantity of ideas. The number of ideas unique to the first and
second C-Sketch sessions was also evaluated. Combining results from both teams and both
sessions, there are 120 total ideas. Of these total 120 ideas, 31 relate to session 1 and 38 to
session 2, and 51 were shared between both sessions meaning they are likely independent of the
design tool. It is noteworthy that the majority of the unique ideas related to the 2nd session were
refinements made to existing ideas in order to make them more feasible; this does not mean the
concept as a whole increased in feasibility, however. For example, 10 of the 38 unique ideas
were various refinements of the idea to transport or creating a portable bridge or ladder to
traverse obstacles. It is difficult to attribute the refinements to exposure to the tool, idea loitering
time, or other sources. The cause of a decrease in quality in team A was evaluated as well. It is
concluded that the cause of the decrease is due to the complexity of ideas increasing in the 2nd
session, thereby containing more concepts that earn a “1” quality score instead of “2” because
they become considered difficult to embody, but not necessarily decreasing the likelihood the
concept could lead to a successful product.
Most notable is the result on quantity. Lindsey shows that the number of ideas generated
drastically reduces over time by tracking the generation of ideas during 6-3-5 sessions [40]. The
effect of the proposed methodology on increasing the quantity of ideas and likelihood of success
is very positive in that participants were able to match their number ideas in the second session,
after exposure to the methodology. This strongly suggests that the methodology was successful
in spurring a new surge of ideas to the same design problem, where typically, participants would
be exhausted of ideas following a 6-3-5 session.
Cadet Work
Cadets found the tool to be useful as a means to compare and rank concepts to aid selection
for further work, as well as bringing additional ideas to existing concepts after reviewing the
field. However, the tool was not received as intended, as an aid to encourage innovation. This
perception highlights the need for a more strategic approach to presenting a particular group with
both the method and tool. Collected data can certainly show limitations for existing technology,
as well as holes in the design space that will, if explored and filled, present breakthroughs for the
current state of technology. However, the presented methodology may need considerable
Page 20
refinement to help serve as the connection between identifying the limitations and gaps and
recognizing feasible solutions.
Future Work
A greater population of participants is necessary in order to verify or counter the results that
have been observed and discussed so that the results would be more statistically significant and
less ambiguous as to whether the particular method of reviewing the technical data of a field
helps the ideation process. Further, there are a number of factors whose influence are difficult to
isolate. One large unknown is if having the design problem linger in participants minds for one
week or more influences results as well as the presentation of new data. One way this unknown
may be controlled in the evaluation of the design tool would be to utilize a control group who
does not receive the tool data and training but has similar C-Sketch sessions as the groups who
receive the training. This would allow for the observation of the effect time has on solving a
design problem with respect to the mentioned metrics. Inter rater reliability analysis will also be
conducted on existing and future data sets to provide a higher level of confidence in the results.
Additionally, the way in which the information in the electronic database is presented as well
as the intricacies of the mateerials and presentation used in both training and introduction to the
design problem can easily fixate or lead the participants and if a greater population will be
utilized to examine the methodology these variables should be standardized and monitored
closely. Also, for future experiments, it is preferable to eliminate the partially completed mind
map and, instead, have participants generate a complete mind map from a clean slate. Lastly, as
with any human science experiment, effects such as social loafing, and personality dynamics,
such as participants feeling they are performing better or worse than actuality [53,54], may be
beneficial to monitor.
Appendix A
Photographs of representative technologies
Row 1 – Segmented tracked robot / Legged robot
Row 2 – Legged spring hopper / Whegged spring hopper
Page 21
Row 3 – Thrust robot (VTOL) / Pneumatic wheeled hopper
Row 4 – Miniature whegged robot / Snake-track hybrid robot
Row 5 - Segmented tracked robot / Whegged robot / 2 wheeled robot
Acknowledgements
This work is made possible through support from Mr Brian Skibba (AFRL/RXQ, Tyndall
AFB FL), Dr. Robert Hastie (DTRA, Eglin AFB FL), the Cullen Endowed Professorship in
Engineering, The University of Texas at Austin and the Department of Engineering Mechanics at
the U.S. Air Force Academy. Any opinions, findings, or recommendations are those of the
authors and do not necessarily reflect the views of the sponsors.
References
[1] Jansson D. G., and Smith S. M., 1991, “Design fixation,” Design Studies, 12(1), pp. 3–11.
[2] Adamson R., 1952, “Functional fixedness as related to problem solving: A repetition of
three experiments,” Journal of Experimental Psychology, 44(4), pp. 288–291.
[3] Maier N. R., 1931, “Reasoning in humans. II. The solution of a problem and its appearance
in consciousness,” Journal of Comparative Psychology (1921), 12(2), pp. 181–194.
[4] M. Perttula, and P. Sipila, 2007, “The idea exposure paradigm in design idea generation,”
Journal of Engineering Design, 18(1), pp. 93–102.
[5] Moss J., Kotovsky K., and Cagan J., 2007, “The influence of open goals on the acquisition
of problem-relevant information,” Journal of Experimental Psychology: Learning, Memory,
Page 22
and Cognition, 33(5), pp. 876–891.
[6] Linsey J. S., Tseng I., Fu K., Cagan J., Wood K. L., and Schunn C., 2010, “A Study of
Design Fixation, Its Mitigation and Perception in Engineering Design Faculty,” Journal of
Mechanical Design, 132, p. 041003.
[7] Linsey J., Wood K., and Markman A., 2008, “Increasing Innovation: Presentation and
Evaluation of the Wordtree Design-by-Analogy Method,” Proceedings of the ASME
IDETC Design Theory and Methodology Conference.
[8] Christensen B. T., and Schunn C. D., 2007, “The relationship of analogical distance to
analogical function and preinventive structure: The case of engineering design,” Memory &
Cognition, 35(1), pp. 29-38.
[9] Linsey J., Wood K., and Markman A., 2008, “Modality and representation in analogy,”
Artificial Intelligence for Engineering Design, Analysis and Manufacturing, 22(2), pp. 85–
100.
[10] Schunn C. D., and Dunbar K., 1996, “Priming, analogy, and awareness in complex
reasoning,” Memory and Cognition, 24, pp. 271–284.
[11] Ward T. B., Smith S. M., and Vaid J. E., 1997, Creative thought: An investigation of
conceptual structures and processes, American Psychological Association.
[12] Eckert C., Stacey M., and Earl C., 2005, “References to past designs,” Studying designers,
5(2005), pp. 3–21.
[13] McAdams D. A., and Wood K. L., 2002, “A quantitative similarity metric for design-by-
analogy,” Journal of Mechanical Design, 124, p. 173.
[14] Nagel R. L., Midha P. A., Tinsley A., Stone R. B., McAdams D. A., and Shu L. H., 2008,
“Exploring the Use of Functional Models in Biomimetic Conceptual Design,” Journal of
Mechanical Design, 130(12).
[15] Chiu I., and Shu L. H., 2007, “Biomimetic design through natural language analysis to
facilitate cross-domain information retrieval,” AI EDAM, 21(01), pp. 45–59.
[16] Hacco E., and Shu L. H., 2002, “Biomimetic concept generation applied to design for
remanufacture,” Proceedings of the ASME Design Engineering Technical Conference, pp.
239–246.
[17] Hey J., Linsey J., Agogino A. M., and Wood K. L., 2008, “Analogies and metaphors in
creative design,” International Journal of Engineering Education, 24(2), p. 283.
[18] Goel A. K., 2002, “Design, analogy, and creativity,” IEEE Expert, 12(3), pp. 62–70.
[19] Casakin H., and Goldschmidt G., 1999, “Expertise and the use of visual analogy:
Implications for design education,” Design Studies, 20(2), pp. 153–175.
[20] Leclercq P., and Heylighen A., 2002, “5, 8 analogies per hour,” Artificial Intelligence in
Design'02, pp. 285–303.
[21] Markman A. B., Wood K. L., Linsey J. S., Murphy J. T., and Laux J. P., 2009, “Supporting
Innovation by Promoting Analogical Reasoning,” Tools for Innovation, 1(9), pp. 85–104.
[22] Gentner D., 1983, “Structure-mapping: A theoretical framework for analogy,” Cognitive
science, 7(2), pp. 155–170.
[23] Gentner D., and Markman A. B., 1998, “Structure mapping in analogy and similarity,”
Mind Readings: Introductory Selections on Cognitive Science, pp. 127-156.
[24] Dahl D. W., and Moreau P., 2002, “The influence and value of analogical thinking during
new product ideation,” Journal of Marketing Research, 39(1), pp. 47–60.
[25] Wilson J. O., Rosen D., Nelson B. A., and Yen J., 2010, “The effects of biological
examples in idea generation,” Design Studies, 31(2), pp. 169–186.
Page 23
[26] Gick M. L., and Holyoak K. J., 1980, “Analogical problem solving,” Cognitive Psychology,
12, pp. 306-355.
[27] Dunbar K., 1997, “How scientists think: On-line creativity and conceptual change in
science,” Creative thought: An investigation of conceptual structures and processes, pp.
461–493.
[28] Weisberg R. W., 2009, “On "Out-Of-The-Box" Thinking in Creativity,” Tools for
innovation, pp. 23-47.
[29] Purcell A. T., and Gero J. S., 1992, “Effects of examples on the results of a design activity,”
Knowledge-Based Systems, 5(1), pp. 82–91.
[30] Stroble J., Watkins S., and Stone R., 2009, “Biology-inspired sensor design,” Potentials,
IEEE, 28(6), pp. 19–24.
[31] Chase W. G., and Simon H. A., 1973, “The mind's eye in chess,” Visual Information
Processing. New York Academic Press.
[32] Chi M. T., Feltovich P. J., and Glaser R., 1981, “Categorization and representation of
physics problems by experts and novices,” Cognitive science, 5(2), pp. 121–152.
[33] Chi M. T., and Koeske R. D., 1983, “Network representation of a child's dinosaur
knowledge,” Developmental Psychology, 19(1), pp. 29–39.
[34] Newell A., 1994, Unified theories of cognition, Harvard Univiversity Press.
[35] Anderson J. R., and Schunn C. D., 2000, “Implications of the ACT-R Learning Theory: No
Magic Bullets,” Advances in Instructional Psychology, Volume 5: Educational Design and
Cognitive Science, pp. 1-33.
[36] Kaplan C. A., and Simon H. A., 1990, “In search of insight,” Cognitive psychology, 22(3),
pp. 374–419.
[37] Ohlsson S., 1992, “Information-processing explanations of insight and related phenomena,”
Advances in the psychology of thinking, 1, pp. 1–44.
[38] Knoblich G., Ohlsson S., Haider H., and Rhenius D., 1999, “Constraint relaxation and
chunk decomposition in insight problem solving,” Learning, Memory, 25(6), pp. 1534–
1555.
[39] Osborn A. F., 1957, Applied imagination: principles and procedures of creative thinking,
Scribner.
[40] Linsey J. S., Green M. G., Murphy J. T., Wood K. L., and Markman A. B., 2005,
“Collaborating to success: An experimental study of group idea generation techniques,”
ASME Design Theory and Methodology Conference.
[41] Rohrbach B., 1969, “Kreativ nach Regeln - Methode 635, eine neue Technik zum Losen
von Problemen,” Absatzwirtschaft, 12, pp. 73-75.
[42] Ulrich K. T., and Eppinger S. D., 2004, Product design and development, McGraw-
Hill/Irwin.
[43] McKoy F. L., Vargas-Hernández N., Summers J. D., and Shah J. J., 2001, “Influence of
design representation on effectiveness of idea generation,” ASME 2001 Design
Engineering Technical Conferences and Computers and Information in Engineering
Conference.
[44] Jensen D., Weaver J., Wood K., Linsey J., and Wood J., 2009, “Techniques to Enhance
Concept Generation and Develop Creativity,” American Society for Engineering
Education.
[45] Singh V., Skiles S. M., Krager J. E., Wood K. L., Jensen D., and Sierakowski R., 2009,
“Innovations in Design through Transformation: A Fundamental Study of
Page 24
tRaNsFoRmAtIoN Principles,” Journal of Mechanical Design, 131.
[46] Bohm M., Vucovich J., and Stone R., 2005, “Capturing creativity: Using a design
repository to drive concept innovation,” Proceedings of DETC 2005.
[47] Bohm M. R., Stone R. B., and Szykman S., 2005, “Enhancing virtual product
representations for advanced design repository systems,” Journal of Computing and
Information Science in Engineering, 5, p. 360.
[48] Otto K. N., and Wood K. L., 2001, Product design: techniques in reverse engineering and
new product development, Prentice Hall.
[49] Shah J. J., Kulkarni S. V., and Vargas-Hernandez N., 2000, “Evaluation of idea generation
methods for conceptual design: effectiveness metrics and design of experiments,” Journal
of Mechanical Design, 122, p. 377.
[50] Shah J., “Experimental investigation of progressive idea generation techniques in
engineering design,” Proc. of the ASME DETC’98, pp. 13–16.
[51] Shah J. J., Smith S. M., and Vargas-Hernandez N., 2003, “Metrics for measuring ideation
effectiveness,” Design Studies, 24(2), pp. 111–134.
[52] Linsey J. S., 2007, “Design-by-Analogy and Representation in Innovative Engineering
Concept Generation,” University of Texas Libraries.
[53] Pauhus P. B., Dzindolet M. T., Poletes G., and Camacho L. M., 1993, “Perception of
performance in group brainstorming: The illusion of group productivity,” Personality and
Social Psychology Bulletin, 19(1), pp. 78-89.
[54] Paulus P. B., and Yang H. C., 2000, “Idea generation in groups: A basis for creativity in
organizations,” Organizational Behavior and Human Decision Processes, 82(1), pp. 76–87.