Proceedings of Conference: Air Conditioning and the Low Carbon Cooling Challenge, Cumberland Lodge, Windsor, UK, 27-29 July 2008. London: Network for Comfort and Energy Use in Buildings. http://nceub.org.uk Studying the adaptive comfort approach within a hot dry climate: A case study in educational buildings in the Egyptian climate. Amgad Farghal and Andreas Wagner Division of Building Physics and Technical Building Services University of Karlsruhe, Englerstra e 7, D – 76131 Karlsruhe, Germany Mail: [email protected]Abstract In order to conduct two class-three field studies, for the comparison of measurements and subjective votes on thermal comfort in three educational buildings, under Egyptian climatic conditions, a preliminary investigation was carried out in November 2007. The buildings chosen for this study are located in the Greater Cairo Region in Egypt. Physical measurements as well as subjective responses related to the environmental perception in the buildings were collected. This phase was an early preparation for the field study required referred to as the pre-stage. Actions taken to facilitate the organization of the actual field studies will be discussed in details. In addition, the modification to the questionnaire design, the thermal insulation (clo) value, language and semantics adjustments done to accommodate cultural discrepancies according to the Egyptian context, will be explained as well. Keywords Field study, questionnaire design, non western thermal insulation (clo) values, comfort semantics, cultural discrepancies. Introduction Experiments in climate chambers depending on heat balance models were the base of thermal comfort standards till recently. Although they were originated to support HVAC controlled buildings, they were used across both naturally ventilated and mechanically controlled buildings [1] . The standards were then further developed to include an introduction of the concept of adaptation with a separate method for naturally ventilated buildings. In the new ASHRAE standard 55, dealing with thermal comfort in indoor environments for a range of metabolic rates from 1.0 to 1.3 met (58.15 to 75.6 W/m 2 ), a range of acceptable operative temperature (18˚C to 31˚C) are related to the mean monthly outdoor temperature ranging from (10˚C to 34˚C). This relation could be used to predict the comfortable environments in hot climates, but to the limits of the model [2] . More field experiments are required to extend the limits of this model. Objectives of the field study The main field experiment has four objectives: (1) To observe and specify the different thermal environments within each building, in order to investigate their thermal characteristics in the hot season; (2) To determine the comfortable temperatures and the acceptable environments as indicated by the occupants and to investigate the effect of different indoor thermal environments within and between spaces on the occupants’ comfort and satisfaction as well; (3) To characterize the main physical and psychological factors influencing thermal comfort and perception, and to quantify the effect of the indoor/outdoor
Transcript
Proceedings of Conference: Air Conditioning and the Low Carbon Cooling Challenge, Cumberland Lodge, Windsor, UK, 27-29 July 2008. London: Network for Comfort and Energy Use in Buildings. http://nceub.org.uk
Studying the adaptive comfort approach within a hot dry climate: A case study in educational buildings in the Egyptian climate. Amgad Farghal and Andreas Wagner Division of Building Physics and Technical Building Services University of Karlsruhe, Englerstra
�e 7, D – 76131 Karlsruhe, Germany
Mail: [email protected] Abstract In order to conduct two class-three field studies, for the comparison of measurements and subjective votes on thermal comfort in three educational buildings, under Egyptian climatic conditions, a preliminary investigation was carried out in November 2007. The buildings chosen for this study are located in the Greater Cairo Region in Egypt. Physical measurements as well as subjective responses related to the environmental perception in the buildings were collected. This phase was an early preparation for the field study required referred to as the pre-stage. Actions taken to facilitate the organization of the actual field studies will be discussed in details. In addition, the modification to the questionnaire design, the thermal insulation (clo) value, language and semantics adjustments done to accommodate cultural discrepancies according to the Egyptian context, will be explained as well. Keywords Field study, questionnaire design, non western thermal insulation (clo) values, comfort semantics, cultural discrepancies. Introduction Experiments in climate chambers depending on heat balance models were the base of thermal comfort standards till recently. Although they were originated to support HVAC controlled buildings, they were used across both naturally ventilated and mechanically controlled buildings [1]. The standards were then further developed to include an introduction of the concept of adaptation with a separate method for naturally ventilated buildings. In the new ASHRAE standard 55, dealing with thermal comfort in indoor environments for a range of metabolic rates from 1.0 to 1.3 met (58.15 to 75.6 W/m2), a range of acceptable operative temperature (18˚C to 31˚C) are related to the mean monthly outdoor temperature ranging from (10˚C to 34˚C). This relation could be used to predict the comfortable environments in hot climates, but to the limits of the model [2]. More field experiments are required to extend the limits of this model.
Objectives of the field study The main field experiment has four objectives: (1) To observe and specify the different thermal environments within each building, in order to investigate their thermal characteristics in the hot season; (2) To determine the comfortable temperatures and the acceptable environments as indicated by the occupants and to investigate the effect of different indoor thermal environments within and between spaces on the occupants’ comfort and satisfaction as well; (3) To characterize the main physical and psychological factors influencing thermal comfort and perception, and to quantify the effect of the indoor/outdoor
environments on the characteristics of these factors; (4) To compare the results obtained with the current models resulting from previous comfort studies.
The original field study will mainly be concerned with data collection by distributing questionnaires while simultaneously monitoring the indoor thermal environment of the examined spaces. A pre-stage was done to assure the success of the field study in achieving its objectives. The pre-stage included obtaining data concerning three main issues: (1) The design of the selected buildings; (2) The indication of their thermal profiles; (3) The questionnaire design and testing. Figure (1) shows the methodology planned for the field experiment.
Figure (1): Methodology planned for the field experiment.
The pre-stage of the field study In the pre-stage phase four main steps were carried out: (1) Ascertaining participation of the selected buildings and obtaining related data as well as communicating with the universities' managers to introduce the research team, aim, methodology and the benefit from their contribution, in this study, to both parties; (2) Visiting the different buildings where the field study was carried out; (3) Investigating the indoor thermal profile of the targeted spaces; (4) Designing and examining the questionnaire.
The selected buildings and their description Two of the buildings examined are part of Cairo University and Ain Shams University campuses. The two naturally ventilated buildings using ceiling fans represented the governmental educational buildings in Greater Cairo Region. The third building is part of the Arab Academy for Science, Technology and Maritime Transport (AAST) – the Cairo Campus. It represents a private organization within the same geographical zone which uses air conditions. The Architectural Departments in all the former buildings were the focus of the study.
In Cairo University, the Architectural Department building has four floors with an area of 2225 m2 each. The study focused on the main halls with an area of 1085 m2 each where studios and drawing sections are held, as well as the lecture halls with an area of 239 m2
each. Figure 2 shows a typical floor plan of the Architecture Department in Cairo University. In Ain Shams University, the Architectural Department has two floors with an area of 1850 m2 to serve the department's needs. The examined spaces included drawing halls with an area between 610 and 915 m2 as well as lecture halls of 135 m2. Figure 3 shows a typical floor plan of the Architecture Department in Ain Shams University. In AAST, the College of Engineering has one main building where spaces are allocated to serve the department's needs. Within the building, there are four floors with an area of 2500 m2 each. The examined spaces included drawing halls of about 252 m2 each and lecture rooms of about 65 m2 each.
Figure 2: A typical floor plan of the Architecture Department in Cairo University.
Figure 3: A typical floor plan of the Architecture Department in Ain Shams University. Investigating the indoor thermal profile of the targeted spaces and calibrating the measuring tools that were used The indoor thermal profiles of the targeted spaces were monitored. A preliminary study of the spaces was made in each building in order to specify the characteristics of the indoor thermal environment. During November 2007, the spaces were monitored using the same instruments that will be used in the field study together with an internal weather station obtained from the Housing and Building Research Center (HBRC) of Egypt, for a minimum of three days during working hours of the respective departments included in this study.
The aim of this step was to decide where to place the measuring instruments in the real study to cover the critical zones within the spaces. Physical measurements of the spaces were examined together with the data collected from a paper-based survey filled by the subjects at the end of their classes. Air temperature and relative humidity were measured using data loggers (HOBO of the company Onset) and, on some days of the survey, a Nomad portable
weather station (Casella) was used to verify the data from the data loggers as a method of calibration. Moreover, the ten data loggers used were calibrated with each other to point out the differences between their records; the differences did not exceed 0.5 degree for temperature and 5% for relative humidity as shown in Figure (6). The data loggers measurement range for temperature as specified by the manufacturing company is -20° to 70°C, (accuracy: ±0.4°@ 25°C), and for relative humidity 25% to 95% RH, (accuracy: ±3.5% over the whole range). Using the Nomad portable weather station revealed that the difference between the air temperature and the radiant air temperature did not exceed one degree Celsius. This justified considering the air temperature measured by the data loggers as the operative temperature, as operative temperature is approximated by the simple average of the air temperature and mean radiant temperature. In addition, the measurements showed that the air velocity didn’ t exceed 0.06 m/sec in all the spaces even when using ceiling fans and that was why the air velocity was not measured in the main field study. The data loggers were distributed over the whole space and were placed on the working plane with a stand to adjust their heights to the same level as the students’ heads as shown in Figure (4).).
Figure (5): The data Loggers distributed over the whole space and their heights adjusted to
the level of the students' heads.
Figure (6): The upper graph shows the temperature monitored by the data loggers over five hours with a maximum difference of 0.4˚C. The lower graph shows the monitored relative humidity over the same period with differences not exceeding 5%.
Questionnaire design and examination A cover page was designed to introduce the research team, to explain the aim of the study and to provide instructions on how to complete the questionnaire. It described how "confidentiality” was guaranteed and provided contacts for further communication with the respondents.
The questionnaire design followed several steps starting with the compilation of a six-page first draft. The target of the questionnaire was to obtain information about the respondents’ expectations and experiences before their entry to the building, their comfort votes for the
time of the survey, their psychological perception of the degree of freedom available, and the physical actions done to accommodate themselves to the indoor climate.
The draft measured the experiences and expectations and included questions to assess the psychological adaptation. They were asked about their daily routine focusing on the usage of air conditioning and heaters at their homes as well as the type of transportation used to get to the university to grasp a little about the norms of thermal quality they were accustomed to. In addition, the respondents were asked about their expectations of the outdoor climate on the day of the survey, together with their expectations regarding the indoor climate of the space where the survey was to take place.
The thermal preference was assessed using a five-point scale which was preferable to a three-point scale, because it helped to make the respondents’ answers more precise and gave the occupants a wider scale for selection. A question assessing the acceptance of the thermal environment was also directly introduced, with only two answers provided, “acceptable or unacceptable” to get an exact answer about the acceptability of the thermal environment. Similar questions assessing the air velocity, humidity and air quality were introduced.
The second part of the questionnaire assessed physical adaptation, through questions measuring available options for the occupants to change their indoor climate, and their degree of satisfaction with the perceived degree of freedom in changing their indoor environment.
A question assessing the degree of satisfaction was answered on a six-point scale that differentiated between being satisfied or not, there was no intermediate neutral point, the respondent was either "satisfied" or "unsatisfied" on three different levels.
Other questions were related to environmental adaptation i.e. opening/closing windows and doors, etc. and personal adaptation i.e. changing clothes, drinking and eating. The respondent was required to specify his/her place within the space using a cross mark on a sketch of the plan. The main entrance to the place was clearly indicated to facilitate recognition of the sketch layout to the respondent.
After designing the questionnaire, the draft was tested to ensure its readability and comprehensibility, including the clarity of the semantics used in forming the questionnaire, as it was mainly adapted from other questionnaires that were formed in other languages. Questionnaires used previously in other field studies influenced the design of the questionnaire adopted in this study [3]. This test also helped in determining the average time needed to brief the respondents about it and the time required by them to actually fill it out. These were essential issues in order to allow for any modifications before the real study.
Questionnaire language and semantics The traditional language for comfort questionnaires is English, and translation to other languages is not easy as the terms used may have different meanings than the ones used in the English Language questionnaire [4]. In order to overcome such issues and to examine the clarity of semantics, the questionnaire was tested in Karlsruhe on five people whose mother tongue was Arabic, the native language in Egypt. In comfort votes, semantic differential scales are the most popular and are highly-recommended. This type of scaling allows for easy conversion of the results into interval numerical scales. The thermal sensation was assessed using a seven-point scale which is in line with the common practice of many psychological scales. Besides, it is the most common in this field, which means that it will be easily compared to the results of other field studies in this area of research [5].
Some of the semantics were not understood correctly, starting by the heading, the word “ time” was sometimes answered as the time consumed to fill in the questionnaire, so it will be modified to “ time of filling the questionnaire” .
In the case of assessing thermal sensation the seven point scale, 3=very warm, 2=warm, 1=slightly warm, 0=neutral, -1=slightly cool, -2=cool and -3 very cool was used. The semantics used differed from that in the ASHRAE scale to facilitate translation to the Arabic language.
In particular, the scale is different in the naming of the two extreme values compared to ASHRAE. The word “hot” and “cold” were avoided, and semantics expressing the levels of being cool or warm were used instead as it was easier in translation to choose such a system of progression. The Arabic language doesn’ t contain two different words for cool versus cold or for warm versus hot, which made it more practical to use the semantics for slightly cool, cool and very cool as well as using slightly warm, warm and very warm.
Clothing and clo value Social customs and cultural needs together with seasonal pattern of outdoor weather conditions are the main factors affecting the type of ensembles and garments worn by people throughout their lives. The database adopted in the ISO 9920 (2007) lack values corresponding to items of clothing used in Egypt especially the exact values for the veil (Hijab) and Abaya. Even a study concerning the clothing area factors of typical Arabian Gulf ensembles did not provide these values. The veil is mainly made of a large variety of fabrics and colors used as an Islamic head cover to conceal female hair. The Abaya is a traditional silk or wool loose cloak, reflecting the female religious belief, covering the whole body except for the face, palms of hands and toes [6].
Egyptian female clothing consists basically of three types of attires: (1) Islamic attire (Abaya); (2) Conservative traditional attire (long dress with long sleeve); (3) Western style attire (jeans and blouse). Another piece of clothing that is not included in the standards is a body-hugging long-sleeved top very widely known in Egypt as a "body" usually worn by females under clothes to hide any visible body parts.
Another shortage in the available resources was the clo value of flip-flop slippers. Although the study was conducted during winter, some of the males reported wearing flip-flops; it’s popular summer footwear, on hot days.
Results of the pre-stage study The results could be generally divided into two parts: (1) Results used to modify the questionnaire design; (2) Results from the field study settings. Regarding results used to modify the questionnaire design, it was very obvious that the questionnaire was too long as it required from ten to fifteen minutes to fill, while the students’ breaks between lectures were around twenty minutes. These results made us make the questionnaire shorter starting with the cover page. We decided not to distribute it and verbally stated that it was available for those respondents who were interested in more information. Moreover, some of the questions were excluded e.g. the first and second questions inquiring about general use of heaters and air conditioning at home. Questions assessing the air quality, the description of the air quality within the space and air velocity were omitted as there was not a measured reference quantity for these parameters. The questions inquiring about physical adaptation and methods of controlling the space were replaced by the researcher’s observation during his presence in the place where the subjects were attending their lectures. The list concerning the clo value was
modified to include items such as the veil, Abaya and body. Also the list included flip-flops and other sports foot-wear common in the Egyptian culture.
The second part of the results was about the field study setting. It showed that the population selected could represent only architectural students, and could not be generalized to describe other prototypes of buildings. It also showed that a transverse survey sampling could be used in the field study. Referring to the objectives of the study, the aim was to have a general overview of typical situations found within the selected buildings which will be achieved by a transverse survey. The longitudinal sampling surveys are recommended for thermal comfort studies especially if the research objectives are an in-depth study of the mechanism of thermal comfort and adaptive behavior over time. Use of the transverse survey ensured the contribution of a majority of subjects representing the occupants of each building, and eliminated any individual sampling bias risks, that could be found as a result of using a longitudinal survey. In addition, this allowed a large number of surveyed persons to provide their votes which increased the accuracy of the outcome while minimizing the disruption to the lives of the subjects. That type of survey had been previously used while conducting thermal comfort field surveys [6].
The time required and instrumentation needed to be able to use a longitudinal survey is outside the scope of this study. The recommended minimum number for a transverse survey is 100 subjects, so this number was the minimum required number of subjects in each building [5].
The role of time in conducting the survey was as important as the subject sampling, because the selection of time reflected the experience of the subjects at the period of filling the questionnaire as well as the dynamic relationship between the subjects and their thermal environments. Three strategies will govern the time selection in the field study. The first is the time of year, where the hot season will be selected to present the summer conditions within the whole year, according to the calendar of educational buildings, the months of March, April and May will portray summer.
The second strategy was the days of the week selected; humans expressing their relationship to their thermal environment are affected by their experience of conditions over the previous period. This shows that the response of the subjects during the time of the survey was influenced by their thermal experiences in the past [5]. Sundays, Tuesdays and Wednesdays will be the selected days for the study. Days following holidays, e.g. Saturdays are excluded in order to avoid any bias in the data obtained. Also Mondays and Thursdays are excluded as some of the students fast on these days which mean that they do not eat or drink during daytime. Each building will be generally surveyed for four days per month over a period of three months with a total of twelve days.
The third strategy will be the choice of time during the survey day itself. Three intervals of time during the working hours will be considered in the survey, the intervals will be as follows: (1) from 10 to 12 in the morning; (2) from 12 to 2 at noon; (3) from 2 to 4 in the afternoon which resemble the end of the working day. Before 10 a.m., most of the students won’ t have spent a complete hour in the building under study as it is too early in the morning. Group-administered questionnaires will be distributed to students 10 minutes after the end of the classes conducted in the spaces allocated for lectures and studios, which will guarantee that the occupants spent at least one hour within the space prior to their voting. In other places as libraries and cafeterias, the subjects will be asked to vote after spending at least 30 minutes in the space.
After deciding on the former strategies, it is time to define a strategy to deal with the duration of the survey in the same building. It is decided that the survey would not extend more than one day per week. The time required to fill the questionnaire by each subject will be minimized as much as possible.
The indoor thermal environment was simultaneously measured during the distribution of the questionnaire, the respondents were asked to start filling the questionnaire only if they had spent a minimum of three quarters of an hour in the space. The measurements taken characterized the environment including measuring air temperature, relative humidity and relating them to comfort assessments. In each place, air handling units were identified and the distribution of the measuring tools followed the critical zones of the surveyed room. The use of data loggers had the advantage of allowing the measurements to take place every 5 minutes on a daily basis together with the advantage of having very little intrusion and interference. The distribution of measuring tools took place at the beginning of the lectures. The choice for placing the tools followed a careful selection criterion such as locating tools near windows and doors, in solid corners and the centre of the room and considering the level of the workplace. This was to ensure the accurate measuring of the conditions in each space in general. Equipment was placed in a number of places on a horizontal plane at a vertical height of about 0.6 meter when the subjects were sitting, and at a height of 1.1 meter when they were standing. One of these points was at the centre of the room and the others were distributed according to the previous criteria taking into consideration the actual distribution of the students within the space [7].
Metrological data collected at the local weather station of Cairo were obtained together with measurements of the external outdoor air temperature in each of the surveyed buildings by placing one of the Hobos in the external environment, so that any extreme differences due to the micro climatic conditions and urban heating were detected.
After collecting the completed questionnaires, data was organized at the end of each day, and the data sets were managed on a daily basis in order to be matched to the data obtained from the data loggers. Statistical analysis was used as the most common method of examining data obtained from field studies, where the comfort votes were treated as the dependant variable and the environmental parameters as the independent variables [5]. The data obtained from this study were analyzed statistically using the SPSS “Statistical Package for Social Science” statistical program.
Results of questionnaires and measurements The pre-stage study was carried out in three educational buildings, Ain Shams University and Cairo University buildings which are naturally ventilated while the building occupied by the College of Engineering at AAST Cairo campus depends on a mechanical system composed of split air conditions for ventilation. The pre-sage study was carried out in November 2007, over a period of twelve days, resulting in a total number of 787 questionnaires available for statistical evaluation. Table (1) shows the distribution of the participants’ sex within the participating buildings.
Table (1): Distribution of participants' sex among the different buildings.
Gender Building Name
Male Female
Total
Cairo 126 128 254
Ain Shams 130 246 376
AAST 92 48 140
Total 348 422 770
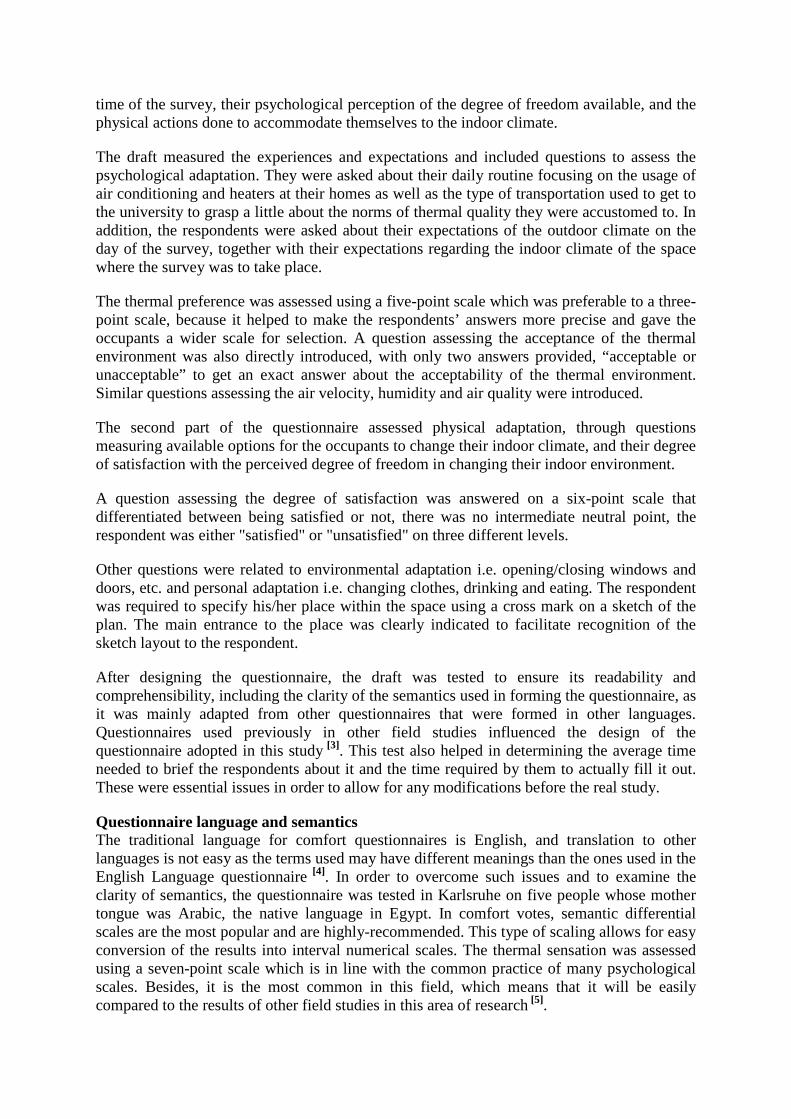
Table (2) shows the frequencies of different thermal sensations subject to each building, the numbers reveal that 87% and 88% of the participants in Cairo University and AAST voted for thermal sensations varying from slightly warm to slightly cool, which is considered in the comfort range, while only 68% in the Ain Shams University building voted for the same range of sensations.
In Figure (7) the votes for thermal sensation were given subject to the indoor operative temperature in the three buildings, the votes for “ just right” in Ain Shams University and AAST covered a wider range than in Cairo University, it almost covered a range of 4 K in the operative indoor temperature, including temperatures above 26˚C. The votes for “slightly warm” in Cairo University building (18% of the votes in the building) covered a range from 25˚C to 32˚C. In addition, the figure shows that temperature range for thermal sensation “warm and very warm” were higher in the Cairo University building than in the other two buildings.
Table (2): Different thermal sensations subject to the three buildings
Thermal Sensation Building Name
Very warm
Warm Slightly warm
Neutral Slightly cool
Cool Very cool
Total
Cairo 6 21 47 149 33 6 0 262
Ain Shams 8 29 76 185 73 10 0 381
AAST 2 7 26 74 26 8 0 143
.
Figure (7): Box plots of votes of thermal sensation against the operative indoor temperature in the three buildings. The lines in the boxes represent the median values, the colored boxes cover the mean 50% of the values and the thin lines show the whole range of all values. The small circles indicate outliers.
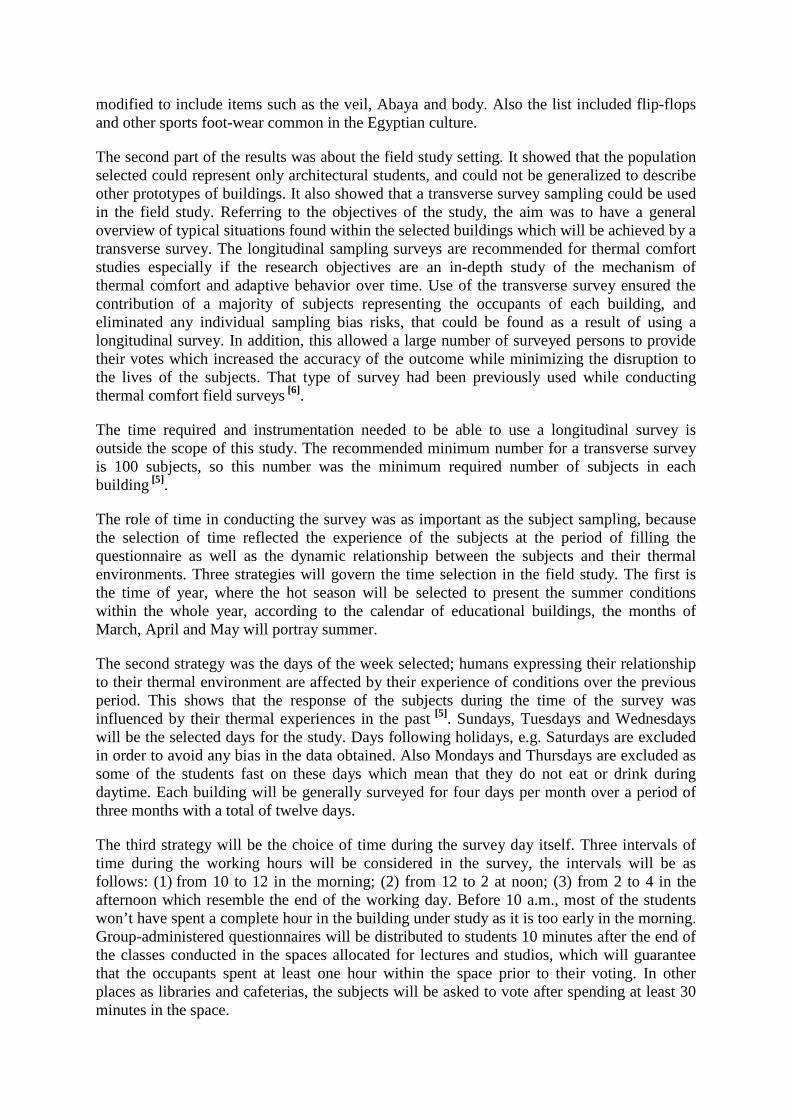
The regression of thermal sensation on the indoor ambient temperature of the naturally ventilated buildings is given in Figure 7, the linear regression equation derived from the comfort vote and ambient indoor temperatures gives:
Thermal sensation = 0.178 Tin - 4.363 (eqn.1) Where Tin stands for ambient indoor temperature. From equation 1 the neutral temperature is equal to 24.5 ˚C , the range of acceptable indoor temperatures could be derived from the regression model (eqn.1), in order to be compared to the acceptable comfort zone band implemented in the new ASHRAE Standard 55. The range of temperature corresponding with 90% and 80% acceptability, could be inferred from the thermal sensation votes, using the relationship between group mean thermal sensation vote and thermal dissatisfaction (i.e., the classic PMV-PPD curve), Table 3 shows the corresponding value of ambient indoor temperatures after applying the ± 0.5, ± 0.85 criteria to equation 1. The comfort zone widths result in a mean comfort zone band of 5.62 ˚C for 90% acceptability, and 9.55 ˚C for the 80% acceptability. Compared to the ASHRAE Standard 55 the comfort zone band of the ±0.5 thermal sensation is wider by 0.62 ˚C, while that of the ± 0.85 thermal sensation is wider by 2.55 ˚C.
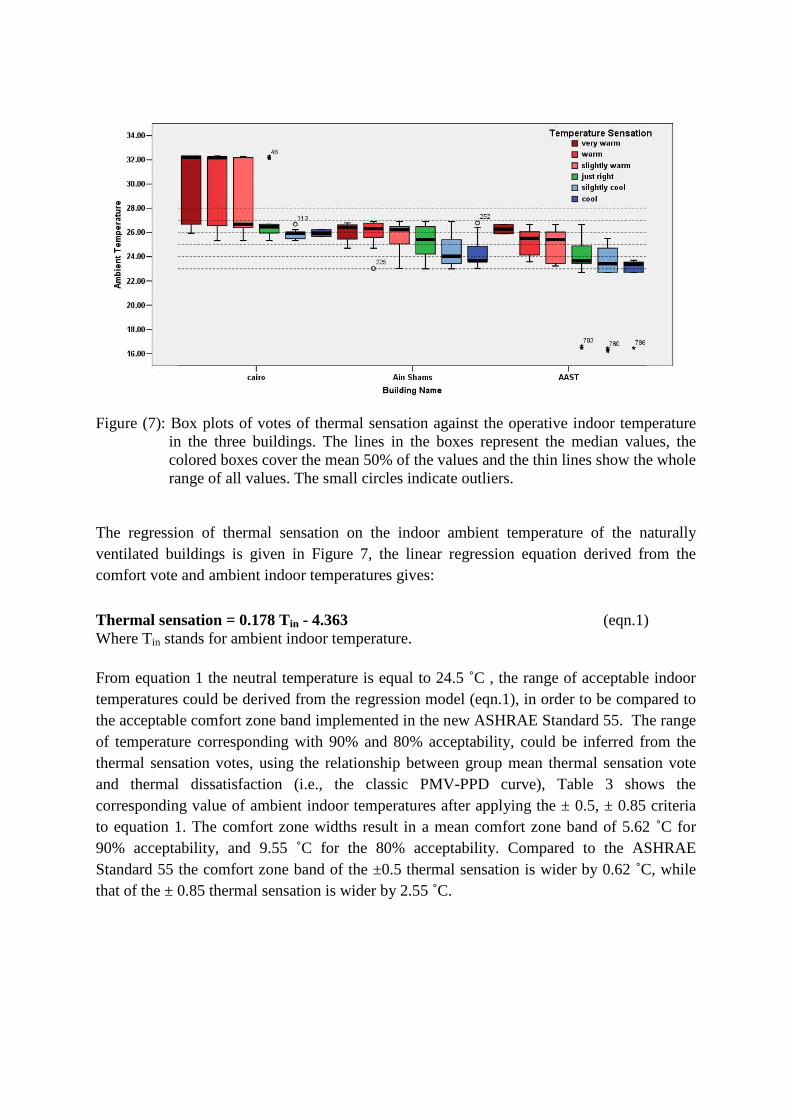
Table 3: The indoor ambient temperature corresponding to the ± 0.5 thermal sensation (90% acceptability) and ±0.85 thermal sensation (80% acceptability).
Thermal sensation Corresponding Ambient indoor temperature
+0.5 27.32 ˚C
-0.5 21.70 ˚C
+0.85 29.29 ˚C
-0.85 19.74 ˚C
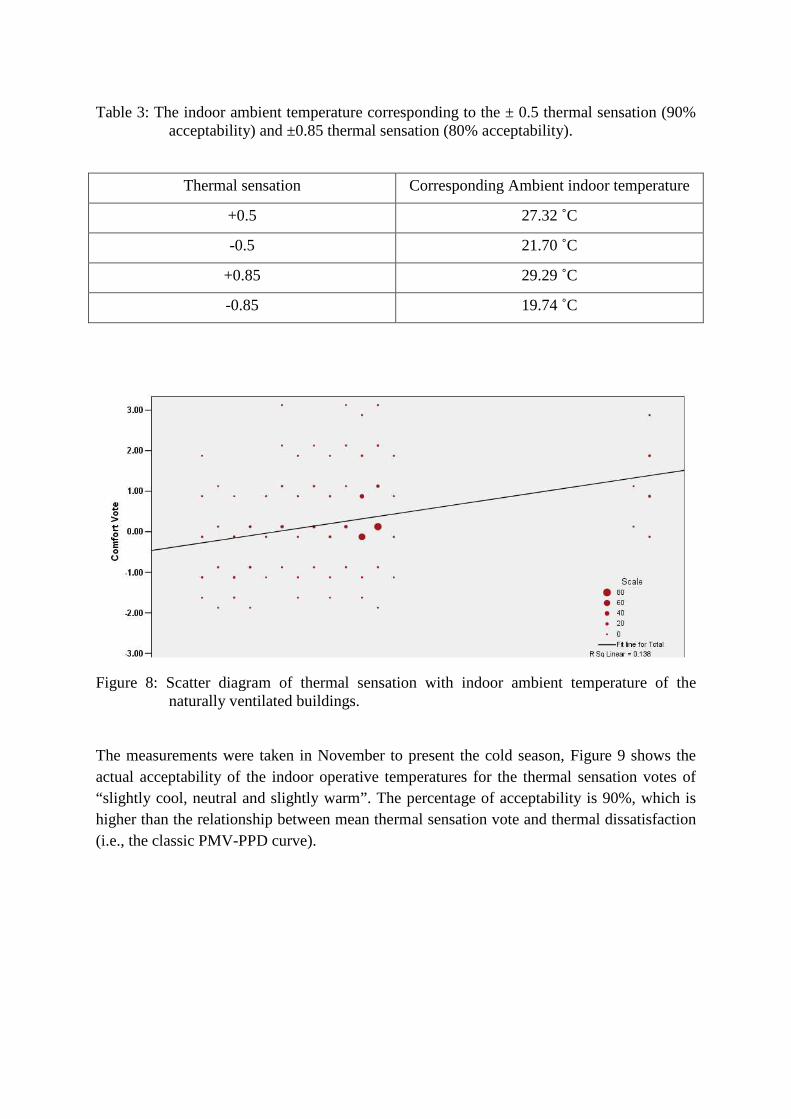
The measurements were taken in November to present the cold season, Figure 9 shows the actual acceptability of the indoor operative temperatures for the thermal sensation votes of “slightly cool, neutral and slightly warm”. The percentage of acceptability is 90%, which is higher than the relationship between mean thermal sensation vote and thermal dissatisfaction (i.e., the classic PMV-PPD curve).
Figure 8: Scatter diagram of thermal sensation with indoor ambient temperature of the naturally ventilated buildings.
Figure 9: The percentage of acceptability for the indoor operative temperature corresponding to the votes of the three mid points of the thermal sensation scale "slightly cool, neutral and slightly warm".
Figure 10 shows the indoor ambient temperatures against the outdoor air temperature for the thermal sensations of “slightly cool, just right and slightly warm” of the naturally ventilated buildings. The three sensations are presenting the middle points of the thermal sensation scale, and are considered here to present the range of acceptable temperatures. The regression of the indoor ambient temperature on the outdoor temperature of the acceptable conditions in the naturally ventilated buildings is given in Figure 10, the linear regression equation derived from the acceptable indoor temperatures (Tin) and the outdoor temperatures (Tout) gives:
Tin = 0.902 Tout + 3.521 (eqn.2)
The linear regression equation derived from the comfortable indoor temperatures T in, com.
(corresponding to thermal sensation “0”= neutral) and the outdoor temperatures (Tout) gives:
Tin,com. = 0.859 Tout + 4.59 (eqn.3)
The new ASHRAE standard 55 proposal for the adaptive comfort standard (ACS), relies on the regression of optimum comfort temperature Tcomf, on the mean monthly outdoor temperature Ta,out , that gives:
T comf. = 0.31 Ta,out + 17.8 (eqn.4)
A mean comfort zone band of 5 ˚C for 90% acceptability, and 7 ˚C for 80% acceptability, is applied within the standard (ACS) [8], calculating the comfort zone band of the 90% acceptability according to equation 3, and combining the outcome of the two equations 3 and 4, result in the graph shown in Figure 11. The outcome show the limits according to the ASHRAE standard 55 in blue lines for 90% acceptability, with the outcome from equation 3 for a 90% acceptability drafted with the red lines. Most of the points coincide together within the graph. The slope resulting from equation 3 is steeper than that resulting from equation 4
standing for the standards. This suggests that the occurrence of adaptation of respondents to their thermal environment is more than what is set in the standard.
Figure 10: The ranges of indoor ambient temperature subject to the ranges of outdoor air temperature for the votes of an accepted indoor ambient temperature.
Figure 11: The blue limits are acceptable operative temperature ranges for naturally conditioned spaces according to the ASHRAE standard 55 – 2004, together with the red limits present the measured temperatures for the votes of an accepted indoor operative temperature, the two vertical black lines present the range of outdoor air temperature
Acknowledgements The study is funded by the Arab Academy of Science, Technology and Maritime Transport (AAST), Egypt.
References 1. G.S. Brager, R.J. de Dear (1998): Thermal adaptation in the built environment: A
literature review. Energy and Buildings,. 27 : 83-96. 2. B.W. Olesen, G.S. Brager (2004): A better way to predict comfort: The new ASHRAE
standard 55-2004, ASHRAE Journal, August. 3. A. Wagner, E. Gossauer, C. Moosmann, Th. Gropp, R. Leonhart (2007): Thermal
Comfort and Workplace Occupant Satisfaction. Results of Field Studies in German Low Energy Office Buildings, Energy and Buildings, 39 (7) : 758-769.
4. A. Pitts (2007): The Language and Semantics of Thermal Comfort, Proceedings of Windsor 2007, U.K.
5. F. Nicol (1993): Thermal Comfort, A Handbook for Field Studies toward an Adaptive Model, University of East London.
6. F.F. Al-Ajmi, D.L. Loveday, K.H. Bedwell, G. Havenith (2008): Thermal insulation and clothing area factors of typical Arabian Gulf clothing ensembles for males and females: Measurements using thermal manikins. Applied Ergonomics, 39 : 407–414.
7. C. Benton, F. Bauman, M. Fountain (1990): A field measurement system for the study of thermal comfort. ASHRAE Transactions, 96 : 11.
8. G.S. Brager, R.J. de Dear (2001): Climate, Comfort, and Natural Ventilation. A new adaptive comfort standard for ASHRAE Standard 55. Proceedings of Windsor 2001, U.K.