AL-QADISIYAH JOURNAL FOR ENGINEERING SCIENCES Vol. 10, No. 4 ISSN: 1998-4456 Page 468 Copyright 2017 Al-Qadisiyah Journal For Engineering Sciences. All rights reserved. STUDYING THE PERFORMANCE OF A HYDROTREATING PROCESS FOR A MIXTURE OF GAS OIL AND LIGHTER FRACTIONS Mohammad F. Abid, Department of Chemical Engineering, University of Technology, Baghdad, Iraq. E-mail: [email protected]Waleed H. Abohameed, Department of Chemical Engineering, University of Technology, Baghdad, Iraq. E-mail: [email protected]Shakir M. Ahmed, SCOP, Ministry of Oil, Baghdad, Iraq. E-mail: [email protected]Salah M. Ali, Petroleum Research and Development Center, Ministry of Oil, Baghdad, Iraq. E-mail: [email protected]Saad Kareem Ibrahim, Petroleum Research and Development Center, Ministry of Oil, Baghdad, Iraq. E-mail: [email protected]Received on 29 August 2017 Accepted on 31 October 2017 Published on 15 January 2018 DOI: 10.30772/qjes.v10i4.494 Abstract: In the present study the applicability of hydrodesulfurization of a mixture of crude oil fractions (e.g., naphtha, kerosene, and gas oil ) in a single hydrotreating reactor packed with NiCoMo/Al2O3 under various operating parameters such as temperature (310-370 oC), pressure (40-55 bars), weight hour space velocity (1.2 to 3.6 h-1), and hydrogen-to- liquid hydrocarbon ratio (150-300 vol/vol). Experimental results showed that temperature and pressure have a positive effect on process performance while weight hour space velocity gives a different trend. The optimum value of (H2/Hydrocarbon) ratio was found experimentally to be 200 vol/vol after which the increase in this ratio cause
Transcript
AL-QADISIYAH JOURNAL FOR ENGINEERING SCIENCES
Vol. 10, No. 4
ISSN: 1998-4456
Page 468 Copyright 2017 Al-Qadisiyah Journal For Engineering Sciences. All rights reserved.
STUDYING THE PERFORMANCE OF A HYDROTREATING PROCESS FOR A MIXTURE OF GAS OIL AND LIGHTER
FRACTIONS
Mohammad F. Abid,
Department of Chemical Engineering, University of Technology, Baghdad, Iraq.
Received on 29 August 2017 Accepted on 31 October 2017 Published on 15 January 2018
DOI: 10.30772/qjes.v10i4.494
Abstract: In the present study the applicability of hydrodesulfurization of a mixture of crude oil fractions (e.g., naphtha, kerosene, and gas oil ) in a single hydrotreating reactor packed with NiCoMo/Al2O3 under various operating parameters such as temperature (310-370 oC), pressure (40-55 bars), weight hour space velocity (1.2 to 3.6 h-1), and hydrogen-to- liquid hydrocarbon ratio (150-300 vol/vol). Experimental results showed that temperature and pressure have a positive effect on process performance while weight hour space velocity gives a different trend. The optimum value of (H2/Hydrocarbon) ratio was found experimentally to be 200 vol/vol after which the increase in this ratio cause
Page 469 Copyright 2017 Al-Qadisiyah Journal For Engineering Sciences. All rights reserved.
reduction in HDS% because decrease in contact between H2 gas and Hydrocarbon in reactor. Results showed that the best conditions (350 oC, 50 bars, 1.2 h-1, and 200 vol/vol) in which gave the hydrotreating (HDS) efficiency of 95.8%.The results confirmed the applicability of the NiCoMo/Al2O3 catalyst for HDS reaction of a mixture of middle distillate (e.g., naphtha, kerosene, and gas oil). It was found that at higher pressure and temperature (i.e., T> 350 oC; P> 50 bars) a thermodynamic equilibrium was established. As observed, there is a 1.6% reduction in gas oil less than that of the conventional method. However, kerosene, heavy naphtha, and light naphtha undergo increases of 0.6%, 0.75%, and 2.75% respectively over these from conventional method. These results reveal that the quantity of fractions is almost the same for both methods. As it can be observed, that measured properties of the oil fractions produced by the proposed method are almost the same as those produced by conventional method. However, specific gravity (sp.gr) of the oil cuts produced by present study (i.e. sp.gr of kerosene, heavy naphtha, and light naphtha 0.785, 0.728, 0.655 respectively) is somewhat less than sp.gr of the same fractions produced by conventional methods (i.e. sp.gr of kerosene, heavy naphtha, and light naphtha 0.788, 0.738, 0.65 respectively), which gives a clear indication of properties improvement of these fractions. Experimental results confirmed the applicability of the proposed method for HDS of a mixture of Iraqi middle distillates (i.e., naphtha, kerosene, and gas oil) simultaneously in a single fixed bed reactor.
Keywords: hydrotreating, Mixture of crude oil fractions, NiCoMo/Al2O3 catayst
NOMENCLATURE
API American Petroleum Institute
EP End Point of boiling point, oC
GOL Gas Oil and Light fraction
HDS Hydrodesulfurization
HDT Hydrotreating
HN Heavy Naphtha
HTR Hydrotreating Reactor
IBP Initial Boiling Point, oC
MHC Mild Hydrocracking
LN Light Naphtha
LPG liquefied petroleum gas
LGO Light Gas Oil
P Pressure, bar
PR&D Petroleum research & development
RCR Reduced Crude Oil
Sf weight content of sulfur in feed
AL-QADISIYAH JOURNAL FOR ENGINEERING SCIENCES
Vol. 10, No. 4
ISSN: 1998-4456
Page 470 Copyright 2017 Al-Qadisiyah Journal For Engineering Sciences. All rights reserved.
Sp weight content of sulfur in product
Sp.gr Specific gravity of oil
T Temperature, oC
WHSV Weight Hour Space Velocity, h-1
INTRODUCTION
In a modern petroleum refinery, the HDT process includes a complex and sophisticated system due to
a large number of reactors, vessels, controlling system with different operating variables (temperatures,
pressure, LHSV and H2 to oil ratio) for each reactor. Many technical problems have evolved from this
sophisticated system. Furthermore, high fixed capital cost is usually invested in this complex system.
Simplification of such system is one of the main goals of all engineers of the field. Published data on HDT of
a mixture of middle distillates in one time in a single HDT reactor are scarce.
Crude oil is complex mixture of various hydrocarbon compounds with different heteroatoms such as S, N2, O2 and some metals (Ni and V). Marketplace requests for different crude oil products are high. The typical consumption of different fuels (i.e. Gasoline, Kerosene, Jet fuels, etc.) is equal to 40-50% of crude oil consumption and the worldwide consumption will rise in the next years so, it is necessary to growth distillate production at high quality. To meet these challenges, a lot of efforts have been committed and a number of oil upgrading machineries have been developed by leading petroleum research institutions. Catalytic hydroprocessing seems to be a promising technology for upgrading of heavy oils (SPEIGHT,2010).
(Heinrich and Kasztelan 2001) analyzed various fractions, of a crude oil originally having a 1.2 wt.% sulfur, for sulfur content. They indicated that sulfur compounds tend to concentrate in the heavier fractions of oil, as shown in Table (1).
Table (1): Distribution of sulphur compounds in the various fractions of a crude oil originally having a 1.2% content in weight of sulphur (Heinrich and Kasztelan, 2001).
Wt. (%) Mercaptans Sulphides Thiophenes Benzo thiophenes and Heavy Sulphides
Gasoline 70-180 0.02 50 50 traces --
Kerosene 160-240 0.2 25 25 35 15
Gas oil 230-350 0.9 15 15 35 35
Vacuum gas oil
350-550 1.8 5 5 30 55
residue >550 2.9 Traces Traces 10 90
The influence of sulfur content on the performance of CoMo/Al2O3 hydrotreating catalyst was inspected by (Rana et al., 2004) using different model reactants in a batch reactor at 4 MPa and 340
oC. The
effect of sulfur (0–2 wt.%) content was studied by varying the loadings of DBT. Authors indicated opposite effects of the produced H2S on selectivity. A slurry batch reactor was utilized by (Deng et al. 2010) to study HDS of diesel fuel at different operating conditions (Pressure = 3-5 MPa, Temperature = 320- 360
oC, and
hydrogen flow rate up to 2.8 L * min-1
). The catalyst used was NiMo/Al2O3 with loading 4-23 wt.%. The authors concluded that the reaction rate increased as temperature, pressure, and flow of hydrogen. The catalyst loading was found to have a positive effect on reaction rate.
(Farag ,2012) investigated the catalytic performances of unsupported catalysts of the hydrodesulfurization process for sulfur removal from gas oil and compared the result with the result that obtain from a supported catalyst. The hydrodesulfurization reactions were carried out in a batch reactor when the temperature and pressure equal to 340 °C and 3 MPa, respectively. Authors reported that the
Page 471 Copyright 2017 Al-Qadisiyah Journal For Engineering Sciences. All rights reserved.
unsupported catalyst operate at high activity and the sulfur reduce into less than 10 ppm (Liu and Zou 2013) studied experimentally the influence of aromatics addition on the hydrotreating (HDT) of oil residue. Authors reported that the addition of aromatics enhanced the removal of heteroatoms and metals from oil residue. Ferreria et al. (2014) investigated the effect of different feeds of crude oil (Arabian Light, Buzurgan, and Ural) on the reactions of hydrodesulfurization (HDS) and hydrodemetalization (HDM) under industrial conditions using commercial catalysts. Authors reported that properties of the feed have pronounced effect on the HDT efficiency. CoNiMo catalysts with various content of promoters were used by (Klimov et al., 2016) for hydrodesulfurization of gas oil. Temperature equal to 390
oC and pressure equal to 90 bars were used to
investigate the optimum proportions of active metals in the catalyst. Abid et al. (2017) studied the influence of N- species on hydrodesulfurization activity of SRHN loaded with C4H4S compound, as a sulfidation agent, over CoMo/γ-Al2O3 in a fixed bed reactor at variable operating parameters (e.g., T= 593- 653 K, P= 20-35bar, weigh hour space velocity = 2.5-5 h
-1, and (H2/oil) ratio = 60 vol/vol. with various concentrations of
carbazole and pyridine. Authors reported that conversion of sulfur increases as T and P increased. However the image of sulfur conversion with weight hour space velocity was different. Authors revealed that HDS efficiency was raised up in the following sequence: mixture of cabazole and pyridine < pyridine < carbazole.
Hydrotratment configuration of middle distillates in a modern petroleum refinery is characterized by severe operating conditions and sophisticated system which lead to high fixed and operating costs. Simplification of such system was the goal of every process and design engineers. Literature on hydrotrating of a mixture of middle distillates in a single hydrotrating reactor is scarce.
In present work the proposed HDT process could be simplified as gas oil and lighter fractions (naphtha and kerosene); these mixture volumetric quantities, as have been present in crude oil. The gas oil and lighter fractions are hydrodesulfurization all at once in one HRT reactor to reach the sulfur specification of each oil fractions. next HDS process, the reaction product is further separation into LPG, light naphtha, heavy naphtha, kerosene, and gas oil. Thus the expected benefits from the proposed HDT method is the reduction of number of HDT reactors from three to one with their utilities (i.e., feeding and intermediate vessels, pumps, control systems, and systems used for heating, cooling, and purging). Consequently, the fixed capital cost, and operational cost will be reduced.
The highest objective of present study to investigate the feasibility of hydrodesulfurization of a mixture of middle distillate (e.g., naphtha, kerosene, and gas oil) in a single hydrotrating reactor under various operating parameters (e.g., temperature, pressure, liquid flow rate, and (H2/oil) ratio. study for the quality and productivity of products was conducted a comparison between the proposed method and conventional one for HDS of middle distillates obtained from Al-Daura refinery/ Baghdad.
1. MATRIALS AND METHODS
1.1. MATERIALS
The commercial catalyst used was CoNiMo/γ-Al2O3 whose properties are listed in Table (2). It was supplied from Al_Daura refinery/Baghdad. Gas oil and lighter fractions (mixture of Naphtha, Kerosene, and gas oil) was used as a real feed in all experiments for the HDS process was supplied from Al_Daura Refinery. Gas oil and lighter fractions were obtained as one cut after separation of LPG and residue from Basra medium crude oil at the atmospheric distillation column, Al-Dora refinery. The main properties of the feedstock (i.e. Gas oil and lighter fraction) used in this work is listed in Table (3). H2 gas (99.9 vol%) and N2
(99 vol%) gas were purchased from (Al_Mansoor Co., Iraq).
Table (2): Specification of Catalyst.
Chemical specifications Units Value
MoO3 wt. % 17
CoO wt. % 2.7
NiO wt. % 0.9
Al2O3 wt. % Balance
AL-QADISIYAH JOURNAL FOR ENGINEERING SCIENCES
Vol. 10, No. 4
ISSN: 1998-4456
Page 472 Copyright 2017 Al-Qadisiyah Journal For Engineering Sciences. All rights reserved.
Physical specifications
Surface area m2/g 160
Pore volume cm3/g 0.43
Bulk density kg/m3 750
Mean particle diameter Mm 1.6
Shape Extradite
Table (3): Feedstock properties (i.e., gas oil and lighter fractions).
Properties Specification
Initial boiling point 30◦C
End boiling point 330◦C
API 45.37
Specific gravity 0.80
Density at 15 ◦C 0.80 gm./cm
3
Sulfur content 4341 ppm
Distillate boiling point range ◦C Vol.%
Light naphtha B.P range (30-122)◦C 14.5 Vol.%
Heavy naphtha B.P range (80-180)◦C 24 Vol.%
Kerosene B.P range (142-242)◦C 25 Vol.%
Gas oil B.P range (200-322)◦C 36.5 Vol.%
1.2. EXPERIMENTAL SETUP
The hydrotreating experimental apparatus which has been located at the Petroleum Research and Development Center, seen in Figure (1), including a cylindrical reactor (I.D. = 17.5 x L=160 mm) made of stainless steel and heated by box shape electrical heater. The system have been also provided with indicators to measure the temperature of inlet liquid feed, inlet gas, reaction chamber, and heating mantel of reactor. Middle distillates (i.e., gas oil and lighter fractions) were mixed in volumetric proportions, as have been produced from the atmospheric distillation unit of crude oil, and injected into the top of reactor by a dosing pump. The liquid middle distillates feed was preheated by an electric heater and mixed co-currently with hydrogen gas before it introduced into the top of reactor. The effluent from the bottom of reactor was sent to a cooler where reaction products condensed then sent to a high-pressure separator to separate gases (e.g., unreacted H2, NH3, and H2S) from liquid product which accumulated in a product tank and distillated in fractionation column to light naphtha, heavy naphtha, kerosene, and gas oil. The liquid feed and hydrogen gas were measured via calibrated digital flow meters installed on the feeding lines.
AL-QADISIYAH JOURNAL FOR ENGINEERING SCIENCES
Vol. 10, No. 4
ISSN: 1998-4456
Page 473 Copyright 2017 Al-Qadisiyah Journal For Engineering Sciences. All rights reserved.
Figure (1): Schematic of the HDS setup.
1.3. EXPERIMENTAL PROCEDURE
The experimental procedure of this work was carried out in the following sequence:
•Drying process of catalyst. •Sulfiding process of catalyst. •Investigate the effect of process variables on HDS efficiency of gas oil and lighter fractions. •Investigate the effect of operating variables on the yield and product quality of liquid products (naphtha, kerosene and gas oil ).
1.3.1. Drying process
Table (4) lists the operating conditions of the drying process.
Table (4): operating conditions of the drying process.
Operating conditions Specification
Temperature 200 ◦C
Pressure 10 bar
N2 flow rate 160 Nl/hr
Time 10 hr
The moisture detected by measuring the output gas from the high pressure (H.P.) separator using moisture content measuring device (AP2-a100), the first sample was taken after two hours, the second sample was taken after ten hours of operation. When the moisture content of effluent gas was reached a value of (15 ppm), the drying process is considered completed (Manual instructions of Petroleum Research and Development Center).
AL-QADISIYAH JOURNAL FOR ENGINEERING SCIENCES
Vol. 10, No. 4
ISSN: 1998-4456
Page 474 Copyright 2017 Al-Qadisiyah Journal For Engineering Sciences. All rights reserved.
1.3.2. Sulfiding process
In this process the catalyst was activated by converting (CoNiMoO4) into (CoNiMoS) form. In the present work, gas oil has been utilized for the sulfidation step with H2 gas. The concentration of sulfur in feeding stream was (4945 ppm). Operating parameters of the sulfidation step were (T = 200-300
oC, P = 15
bar, light gas oil flow = 120 ml/hr, (H2/HC) ratio= 200 vol/vol, and time of sulfidation = 19 hrs). The operating instructions of the Petroleum Research and Development Center suggested that the sulfidation step is complete when a 0.05% increase in catalyst weight occurs. This increase in weight is attributed to the sulfur deposition over the catalyst surface. Experimentally, it is decided that the sulfidation step is completed when the concentration of sulfur in the outlet stream equals to that in the inlet. Figure (2a) and Figure (2b) show the sulfidation procedure and the change in sulfur concentration at the outlet stream during the sulfidation step, respectively.
Figure (2a): Sulfiding process steps at (P=15 bar, T= 350 oC, gas oil flow = 120 ml/hr and H2/oil =200).
Figure (2b): Sulfur concentration in outlet stream as function of sulfidation time
AL-QADISIYAH JOURNAL FOR ENGINEERING SCIENCES
Vol. 10, No. 4
ISSN: 1998-4456
Page 475 Copyright 2017 Al-Qadisiyah Journal For Engineering Sciences. All rights reserved.
1.3.3. Hydrotreating process steps:
Figure (3): Experimentally Hydrotreating process steps.
Hydrotreating process for a mixture of gas oil and lighter fractions was conducted by:-
Loading the reactor with 50 gm of CoNiMo-S/Al2O3 depended on the selected values of WHSV within the range of the values used in the industry scale (50 gm. of catalyst have the volume 66 ml and the total volume of reactor 77 ml the remain reactor volume was packed with inert particles (glass beads of ¼” diameter) at entrance and the bottom of reactor. This entrance section was employed to heat up the mixture to the required temperature and to ensure homogeneous flow distribution of gas and liquid.
N2 gas was fed over one hour to heat the environment inside the reactor.
Prepared mixture of middle distillates was charged at the desired flow into the reaction chamber. To start the HDS reaction, H2 gas was injected co-currently with the liquid mixture at the desired flow value.
Reactor temperature starts to increase due to the heat liberated from the chemical reaction which controlled by the set value of the temperature controller that regulate the energy given by the heating elements of the box furnace.
Set value of operating conditions for each run used for the HDS process were (Temperature = 310-370
oC, WHSV = 1.2 to 3.6 h
-1, pressure = 40 to 55 bar, and (H2/HC) ratio = 150 to 300 vol/vol).
Products were cooled and distilled than analyzed for concentration of sulfur in each oil fractions.
The efficiency of the HDS process was calculated from equation (1).
……………………………………. (1)
1.4. ANALYSES TECHNIQUES
Concentration of sulfur into inlet and outlet stream of reactor was measured using (XOS analyzer, model Sindie OTG, USA). Water moisture inside the reaction chamber during the drying step was measured using (Meeco analyzer, model WaterBoy 2, USA).
AL-QADISIYAH JOURNAL FOR ENGINEERING SCIENCES
Vol. 10, No. 4
ISSN: 1998-4456
Page 476 Copyright 2017 Al-Qadisiyah Journal For Engineering Sciences. All rights reserved.
2. RESULTS AND DISCUSSION
2.1. INFLUENCE OF KEY PARAMETERS ON HDS % FOR A MIXTURE OF HCS
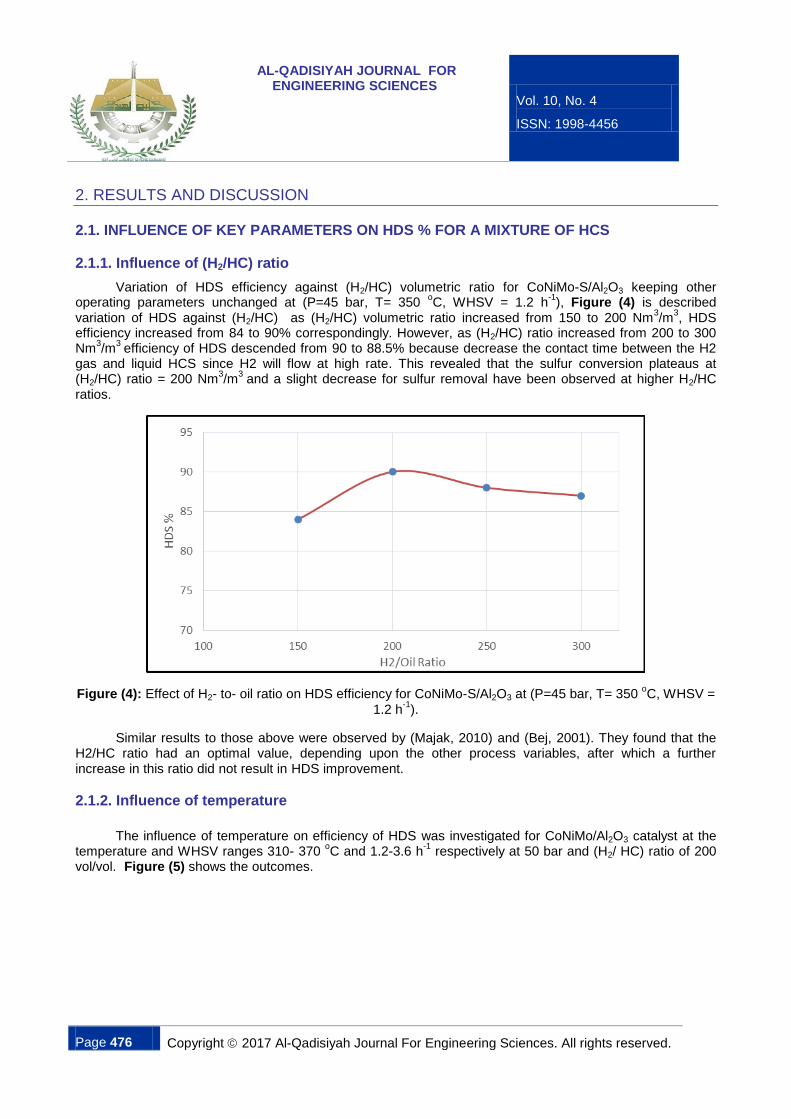
2.1.1. Influence of (H2/HC) ratio
Variation of HDS efficiency against (H2/HC) volumetric ratio for CoNiMo-S/Al2O3 keeping other operating parameters unchanged at (P=45 bar, T= 350
oC, WHSV = 1.2 h
-1), Figure (4) is described
variation of HDS against (H2/HC) as (H2/HC) volumetric ratio increased from 150 to 200 Nm3/m
3, HDS
efficiency increased from 84 to 90% correspondingly. However, as (H2/HC) ratio increased from 200 to 300 Nm
3/m
3 efficiency of HDS descended from 90 to 88.5% because decrease the contact time between the H2
gas and liquid HCS since H2 will flow at high rate. This revealed that the sulfur conversion plateaus at (H2/HC) ratio = 200 Nm
3/m
3 and a slight decrease for sulfur removal have been observed at higher H2/HC
ratios.
Figure (4): Effect of H2- to- oil ratio on HDS efficiency for CoNiMo-S/Al2O3 at (P=45 bar, T= 350 oC, WHSV =
1.2 h-1
).
Similar results to those above were observed by (Majak, 2010) and (Bej, 2001). They found that the H2/HC ratio had an optimal value, depending upon the other process variables, after which a further increase in this ratio did not result in HDS improvement.
2.1.2. Influence of temperature
The influence of temperature on efficiency of HDS was investigated for CoNiMo/Al2O3 catalyst at the temperature and WHSV ranges 310- 370
oC and 1.2-3.6 h
-1 respectively at 50 bar and (H2/ HC) ratio of 200
vol/vol. Figure (5) shows the outcomes.
AL-QADISIYAH JOURNAL FOR ENGINEERING SCIENCES
Vol. 10, No. 4
ISSN: 1998-4456
Page 477 Copyright 2017 Al-Qadisiyah Journal For Engineering Sciences. All rights reserved.
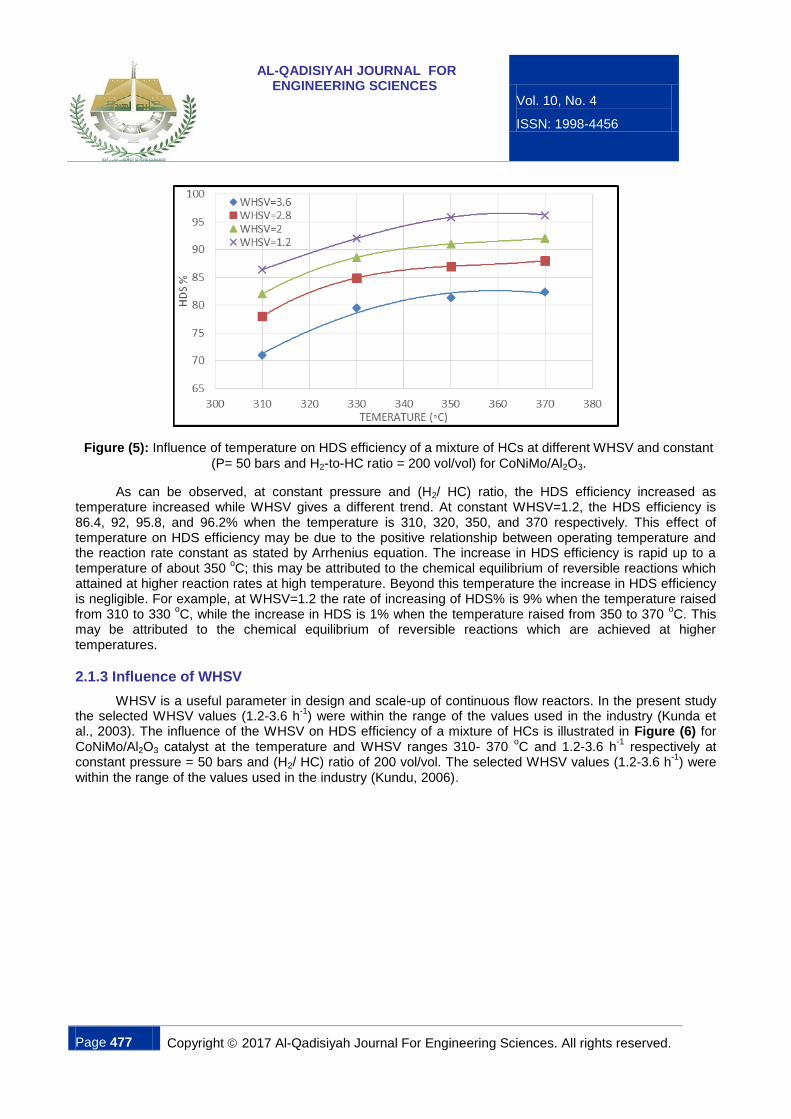
Figure (5): Influence of temperature on HDS efficiency of a mixture of HCs at different WHSV and constant
(P= 50 bars and H2-to-HC ratio = 200 vol/vol) for CoNiMo/Al2O3.
As can be observed, at constant pressure and (H2/ HC) ratio, the HDS efficiency increased as temperature increased while WHSV gives a different trend. At constant WHSV=1.2, the HDS efficiency is 86.4, 92, 95.8, and 96.2% when the temperature is 310, 320, 350, and 370 respectively. This effect of temperature on HDS efficiency may be due to the positive relationship between operating temperature and the reaction rate constant as stated by Arrhenius equation. The increase in HDS efficiency is rapid up to a temperature of about 350
oC; this may be attributed to the chemical equilibrium of reversible reactions which
attained at higher reaction rates at high temperature. Beyond this temperature the increase in HDS efficiency is negligible. For example, at WHSV=1.2 the rate of increasing of HDS% is 9% when the temperature raised from 310 to 330
oC, while the increase in HDS is 1% when the temperature raised from 350 to 370
oC. This
may be attributed to the chemical equilibrium of reversible reactions which are achieved at higher temperatures.
2.1.3 Influence of WHSV
WHSV is a useful parameter in design and scale-up of continuous flow reactors. In the present study the selected WHSV values (1.2-3.6 h
-1) were within the range of the values used in the industry (Kunda et
al., 2003). The influence of the WHSV on HDS efficiency of a mixture of HCs is illustrated in Figure (6) for CoNiMo/Al2O3 catalyst at the temperature and WHSV ranges 310- 370
oC and 1.2-3.6 h
-1 respectively at
constant pressure = 50 bars and (H2/ HC) ratio of 200 vol/vol. The selected WHSV values (1.2-3.6 h-1
) were within the range of the values used in the industry (Kundu, 2006).
AL-QADISIYAH JOURNAL FOR ENGINEERING SCIENCES
Vol. 10, No. 4
ISSN: 1998-4456
Page 478 Copyright 2017 Al-Qadisiyah Journal For Engineering Sciences. All rights reserved.
70
75
80
85
90
95
100H
DS
%
T=310 C
T=330 C
T=350 C
T=370 C
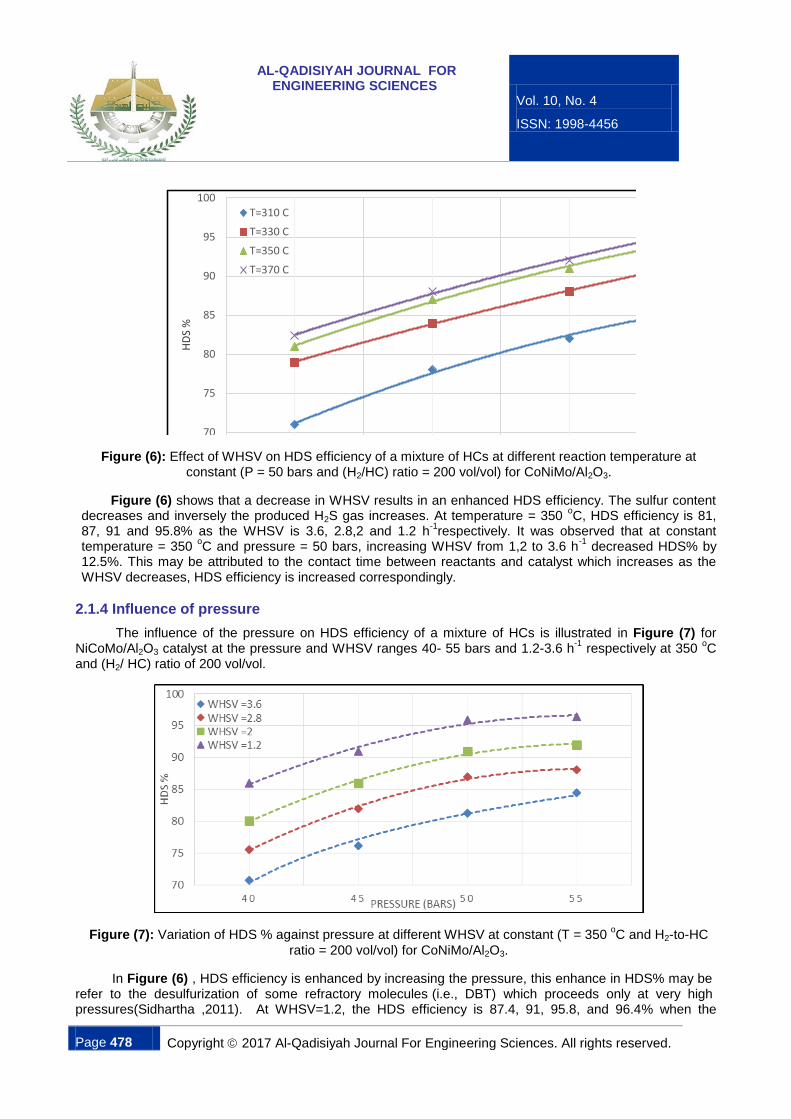
Figure (6): Effect of WHSV on HDS efficiency of a mixture of HCs at different reaction temperature at constant (P = 50 bars and (H2/HC) ratio = 200 vol/vol) for CoNiMo/Al2O3.
Figure (6) shows that a decrease in WHSV results in an enhanced HDS efficiency. The sulfur content decreases and inversely the produced H2S gas increases. At temperature = 350
oC, HDS efficiency is 81,
87, 91 and 95.8% as the WHSV is 3.6, 2.8,2 and 1.2 h-1
respectively. It was observed that at constant temperature = 350
oC and pressure = 50 bars, increasing WHSV from 1,2 to 3.6 h
-1 decreased HDS% by
12.5%. This may be attributed to the contact time between reactants and catalyst which increases as the WHSV decreases, HDS efficiency is increased correspondingly.
2.1.4 Influence of pressure
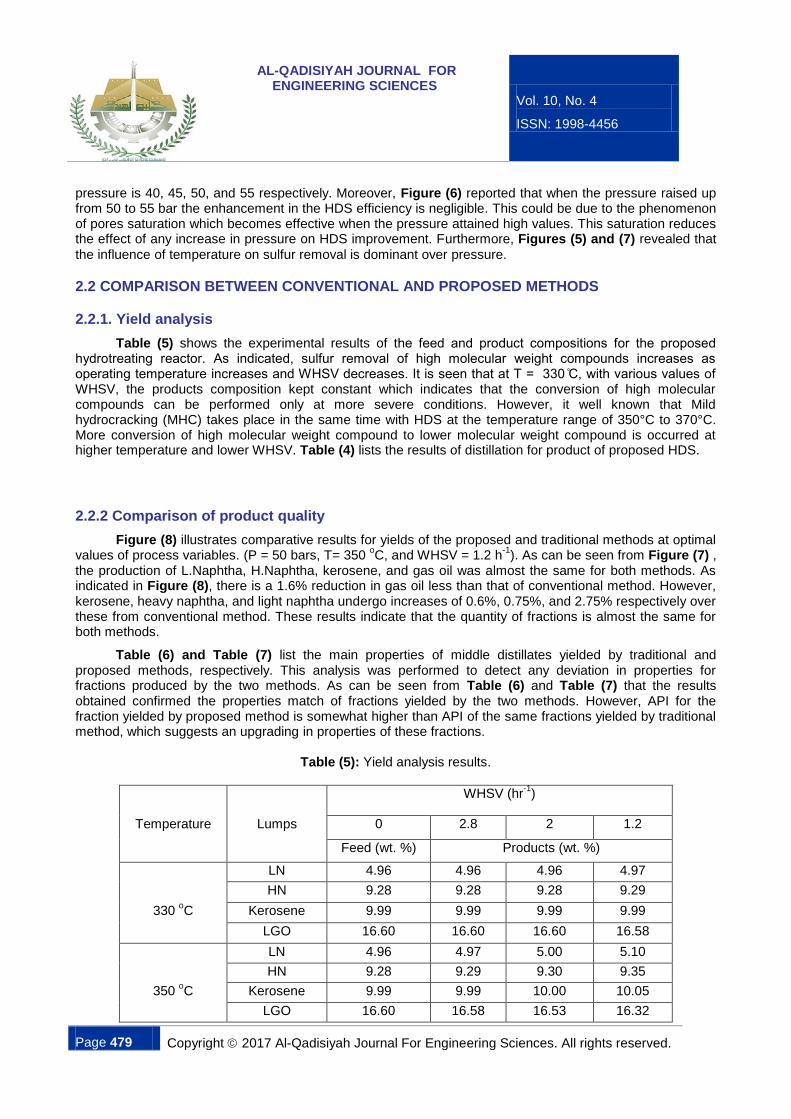
The influence of the pressure on HDS efficiency of a mixture of HCs is illustrated in Figure (7) for NiCoMo/Al2O3 catalyst at the pressure and WHSV ranges 40- 55 bars and 1.2-3.6 h
-1 respectively at 350
oC
and (H2/ HC) ratio of 200 vol/vol.
Figure (7): Variation of HDS % against pressure at different WHSV at constant (T = 350 oC and H2-to-HC
ratio = 200 vol/vol) for CoNiMo/Al2O3.
In Figure (6) , HDS efficiency is enhanced by increasing the pressure, this enhance in HDS% may be refer to the desulfurization of some refractory molecules (i.e., DBT) which proceeds only at very high pressures(Sidhartha ,2011). At WHSV=1.2, the HDS efficiency is 87.4, 91, 95.8, and 96.4% when the
AL-QADISIYAH JOURNAL FOR ENGINEERING SCIENCES
Vol. 10, No. 4
ISSN: 1998-4456
Page 479 Copyright 2017 Al-Qadisiyah Journal For Engineering Sciences. All rights reserved.
pressure is 40, 45, 50, and 55 respectively. Moreover, Figure (6) reported that when the pressure raised up from 50 to 55 bar the enhancement in the HDS efficiency is negligible. This could be due to the phenomenon of pores saturation which becomes effective when the pressure attained high values. This saturation reduces the effect of any increase in pressure on HDS improvement. Furthermore, Figures (5) and (7) revealed that
the influence of temperature on sulfur removal is dominant over pressure.
2.2 COMPARISON BETWEEN CONVENTIONAL AND PROPOSED METHODS
2.2.1. Yield analysis
Table (5) shows the experimental results of the feed and product compositions for the proposed hydrotreating reactor. s indicated sulfur removal of high molecular weight compounds increases as operating temperature increases and W V decreases. t is seen that at T 330 C with various values of WHSV, the products composition kept constant which indicates that the conversion of high molecular compounds can be performed only at more severe conditions. However, it well known that Mild hydrocracking (MHC) takes place in the same time with HDS at the temperature range of 350°C to 370°C. More conversion of high molecular weight compound to lower molecular weight compound is occurred at higher temperature and lower WHSV. Table (4) lists the results of distillation for product of proposed HDS.
2.2.2 Comparison of product quality
Figure (8) illustrates comparative results for yields of the proposed and traditional methods at optimal values of process variables. (P = 50 bars, T= 350
oC, and WHSV = 1.2 h
-1). As can be seen from Figure (7) ,
the production of L.Naphtha, H.Naphtha, kerosene, and gas oil was almost the same for both methods. As indicated in Figure (8), there is a 1.6% reduction in gas oil less than that of conventional method. However, kerosene, heavy naphtha, and light naphtha undergo increases of 0.6%, 0.75%, and 2.75% respectively over these from conventional method. These results indicate that the quantity of fractions is almost the same for both methods.
Table (6) and Table (7) list the main properties of middle distillates yielded by traditional and proposed methods, respectively. This analysis was performed to detect any deviation in properties for fractions produced by the two methods. As can be seen from Table (6) and Table (7) that the results obtained confirmed the properties match of fractions yielded by the two methods. However, API for the fraction yielded by proposed method is somewhat higher than API of the same fractions yielded by traditional method, which suggests an upgrading in properties of these fractions.
Table (5): Yield analysis results.
Temperature
Lumps
WHSV (hr-1
)
0 2.8 2 1.2
Feed (wt. %) Products (wt. %)
LN 4.96 4.96 4.96 4.97
HN 9.28 9.28 9.28 9.29
330 oC Kerosene 9.99 9.99 9.99 9.99
LGO 16.60 16.60 16.60 16.58
LN 4.96 4.97 5.00 5.10
HN 9.28 9.29 9.30 9.35
350 oC Kerosene 9.99 9.99 10.00 10.05
LGO 16.60 16.58 16.53 16.32
AL-QADISIYAH JOURNAL FOR ENGINEERING SCIENCES
Vol. 10, No. 4
ISSN: 1998-4456
Page 480 Copyright 2017 Al-Qadisiyah Journal For Engineering Sciences. All rights reserved.
LN 4.96 5.00 5.01 5.11
HN 9.28 9.30 9.32 9.36
370 oC Kerosene 9.99 10.00 10.02 10.05
LGO 16.60 16.53 16.48 16.31
Figure (8): Percentage weights of middle distillates yielded by proposed and traditional method.
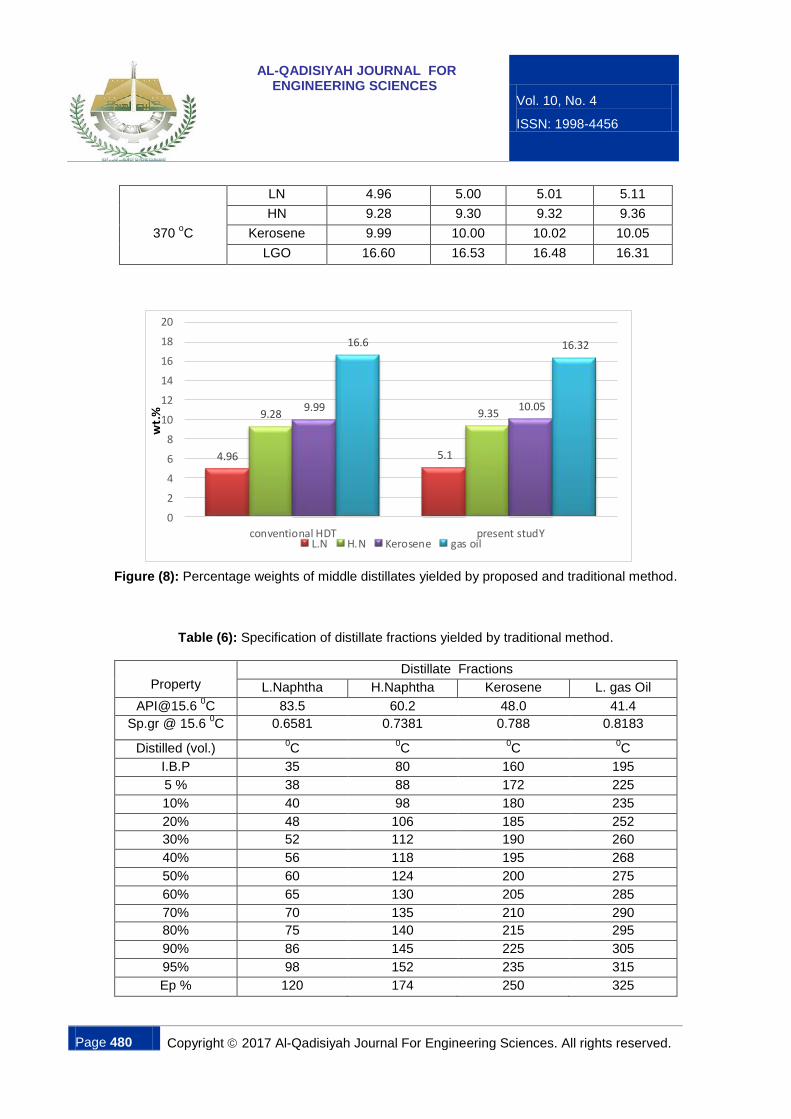
Table (6): Specification of distillate fractions yielded by traditional method.
The interaction of parameters, optimum operating conditions, and regression models for predicting the percent conversion of sulfur in HDS process to obtain optimum HDS % are estimated using Analysis of Variance (ANOVA) technique. Two statistical tests (test of significance of factors and R
2 test) were used to
evaluate how well the experimental data was represented by the models:
1- Test of significance of factors means that insignificant factors or interactions must be excluded from the model. Significance of the factors or the interactions is evaluated using p-value (probability value). When the p-value of a factor or an interaction is greater than 0.05, then this factor or interaction is considered insignificant and can therefore be excluded from the final mathematical model.
2- R2 test, a value that always falls between 0 and 1, is the relative predictive power of a model. The
closer to 1 the R2 is the better the model represents the experimental observations. Adjusted R
2 is a
modification of R2, but unlike R
2 it only increases when the newly included factor(s) or interaction (s) are
significant. Another quantity is predicted R2. While R
2 indicates how well the model fits the experimental data
at hand, predicted R2 indicates how well the model predicts responses for new observations.
Analysis of the experimental results was carried out using DESIGN-EXPERT 10.0.6.0 to optimize the considered operating conditions with respect to HDS %. The factorial design method was used for planning the experiments, because of its reliability in finding the effects and interaction between the controlled variables (P, T and WHSV) of the operating system.
Table (8): Independent variables with their coded and actual values
Factor Real symbol Units Minimum Limit Maximum Limit No. of levels (L)
X1 P bar 40 55 4
X2 T C 310 370 4
X3 WHSV hr-1 1.2 3.6 4
AL-QADISIYAH JOURNAL FOR ENGINEERING SCIENCES
Vol. 10, No. 4
ISSN: 1998-4456
Page 482 Copyright 2017 Al-Qadisiyah Journal For Engineering Sciences. All rights reserved.
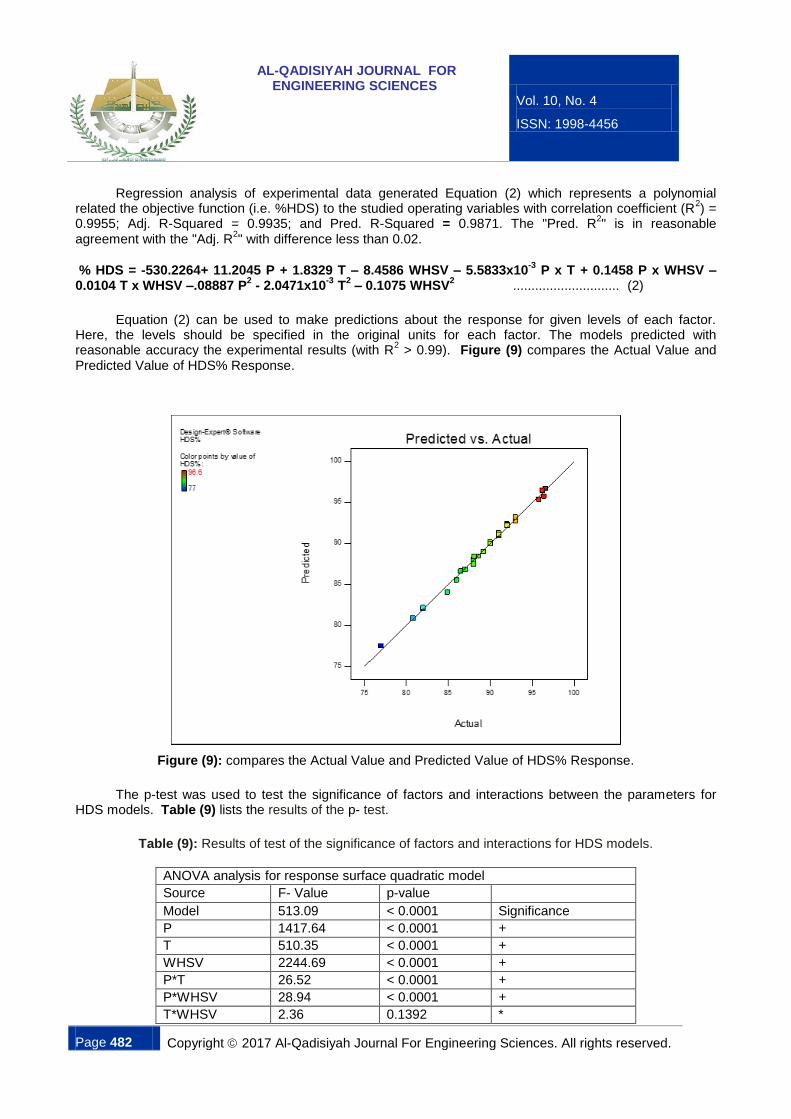
Regression analysis of experimental data generated Equation (2) which represents a polynomial related the objective function (i.e. %HDS) to the studied operating variables with correlation coefficient (R
2) =
0.9955; Adj. R-Squared = 0.9935; and Pred. R-Squared = 0.9871. The "Pred. R2" is in reasonable
agreement with the "Adj. R2" with difference less than 0.02.
% HDS = -530.2264+ 11.2045 P + 1.8329 T – 8.4586 WHSV – 5.5833x10⁻³
P x T + 0.1458 P x WHSV – 0.0104 T x WHSV –.08887 P
2 - 2.0471x10
-3 T
2 – 0.1075 WHSV
2 ............................. (2)
Equation (2) can be used to make predictions about the response for given levels of each factor. Here, the levels should be specified in the original units for each factor. The models predicted with reasonable accuracy the experimental results (with R
2 > 0.99). Figure (9) compares the Actual Value and
Predicted Value of HDS% Response.
Figure (9): compares the Actual Value and Predicted Value of HDS% Response.
The p-test was used to test the significance of factors and interactions between the parameters for HDS models. Table (9) lists the results of the p- test.
Table (9): Results of test of the significance of factors and interactions for HDS models.
ANOVA analysis for response surface quadratic model
Source F- Value p-value
Model 513.09 < 0.0001 Significance
P 1417.64 < 0.0001 +
T 510.35 < 0.0001 +
WHSV 2244.69 < 0.0001 +
P*T 26.52 < 0.0001 +
P*WHSV 28.94 < 0.0001 +
T*WHSV 2.36 0.1392 *
AL-QADISIYAH JOURNAL FOR ENGINEERING SCIENCES
Vol. 10, No. 4
ISSN: 1998-4456
Page 483 Copyright 2017 Al-Qadisiyah Journal For Engineering Sciences. All rights reserved.
P2 253.46 < 0.0001 +
T2 34.52 < 0.0001 +
WHSV 2 0.24 0.6265 *
+: significant; *: insignificant
Table (9) demonstrates the evaluated F-value and the corresponding p values. The single-factor term represents a linear effect of the corresponding factor, while the two factors represent the interaction between the two factors. Additionally, the second order term represents a quadratic effect towards the response. The p value serves as a tool to check the significance of each coefficient at a specified level of significance. The higher the t-value or the smaller the p value, more significant the corresponding coefficient. Generally, a p value of less than 0.05 is considered to be very significant and contributes largely towards the responses.
As observed in Table (9) , the terms P, T, WHSV, P x WHSV, P2, and T
2 are significant model terms.
However, the terms of values greater than 0.1000 are considered insignificant. In this case reduction of the terms T x WHSV, and WHSV
2 may improve HDS model.
2.3.1. Optimum operating conditions
Based on the studied operating variables, the best values to obtain the optimum HDS% are estimated using DESIGN-EXPERT 10.0.6.0 software. Figure (10) shows the location of the optimum conditions using the DESIGN-EXPERT software.
Figure (10): Best values of the studied operating conditions to obtain optimum HDS%.
CONCLUSIONS
Simplification of the HDT system was the goal of all process and design engineers of the field. In the present work a single HDT reactor was proposed for HDS of a mixture of naphtha, kerosene, and gas oil produced from atmospheric fractionation unit at Al-Dora Refinery. Experimental results showed that temperature and pressure have a positive effect on process performance while weight hour space velocity gives a different trend. Results showed that the best values to obtain the optimum HDS% are estimated using DESIGN-EXPERT 10.0.6.0 software (350
oC, 50 bars, 1.2 h
-1, and 200 vol/vol), the
AL-QADISIYAH JOURNAL FOR ENGINEERING SCIENCES
Vol. 10, No. 4
ISSN: 1998-4456
Page 484 Copyright 2017 Al-Qadisiyah Journal For Engineering Sciences. All rights reserved.
hydrodesulfurization (HDS) efficiency was 95.8%. Maximum sulfur conversion of (95-96) % was obtained at pressure range (50-55) bars. This increase in HDS efficiency may be attributed to the desulfurization of some refractory (i.e. DBT) molecules which proceeds only at very high pressures. Quantitative and qualitative analysis for the products from the proposed HDT method confirmed the feasibility and applicability of the method. the production of L.Naphtha, H.Naphtha, kerosene, and gas oil, there is a 1.6% reduction in gas oil while kerosene, heavy naphtha, and light naphtha increases of 0.6%, 0.75%, and 2.75% respectively over these from conventional method.
According to Statistical analysis (i.e. p-values) the significance order of the independent variables on the maximum obtained HDS activity is operating pressure then reaction temperature However, the effect of Weight hour space velocity terms on HDS activity is less statistically significant. The obtane models predicted with reasonable accuracy the experimental results (with R
2 > 0.99).
ACKNOWLEDGEMENT
Researchers are thankful to the School of Chemical Engineering, University of Technology for assistance in completion of this work. The fund which has been awarded by the Petroleum Research and Development Center is highly appreciated.
REFERENCES
1. Abid M.F., Abdullah M.K., Ali S. M. (2017) “Experimental Study on Catalyst Deactivation by Nitrogen Compounds in a Hydroprocessing Reactor”, Arab J Sci Eng, DOI 10.1007/s13369-017-2480-8. 2. Bej S. K., Dalai A. K., Adjaye J. (2001) “Comparison of hydrodenitrogenation of basic and nonbasic nitrogen compounds present in oil sands derived heavy gas oil”, Energy and Fuels 15, 375-383. 3. Knudsen K.G. (2006) “Ultra deep desulfurization of diesel: how an understanding of the underlying kinetics can reduce investment costs”, in: Book Chapter-10 in, Practical Advances in Petroleum Processing, Springer, Berlin. 4. Deng Z., Wang T., Zhanwen W. (2010) “Hydrodesulfurization of diesel in a slurry reactor”, Chemical Engineering Science 65, 480-486. 5. Farag H. , Mochida I. (2012) “A comparative kinetic study on ultra-deep hydrodesulfurization of pre-treated gas oil over nanosized MoS2, CoMo-sulfide, and commercial CoMo/Al2O3 catalysts “, Journal of Colloid and Interface Science, 372(1):121-129. 6. Ferreira C., Tayakout-Fayolle M., Guibard I. , Lemos F. , Toulhoat H., Ribeiro F.R. (2014) “Hydrodesulfurization and hydrodemetallization of different origin vacuum residues” new modeling approach, Fuel 129, 267-277. 7. Heinrich G., Kasztelan S. (2001), “Hydrotreating Conversion processes”, Paris, Technip, 533-573. 8. Klimov O.V. , Nadeina K.A. , Dik P.P. , Koryakina, G.I. , Kazakov M.O. , Budukva S.V. , Gerasimov E.Yu. , Prosvirin I.P. , Kochubey, D.I. , Noskov A.S. (2016), “CoNiMo/Al2O3 catalysts for deep. hydrotreatment of vacuum gas oil”, Catalysis Today 271, 56-63. 9. Kundu A., Nigam K.D.P., Duquenne A.M., Delmas H. (2003) “Recent developments in hydroprocessing reactions”, Rev. Chem. Eng., 19: 531-605. 10. Majak Mapiour (2010) “Effects of the operating variables on hydrotreating of heavy gas oil: Experimental, modeling, and kinetic studies” University of askatchewan Department of Chemical and Biological Engineering , Fuel 89(9):2536-2543. 11. Lappas A. A., R. Budisteanu R., Drakaki K., Vasalos I.A. (1999) “Production of low aromatics and low sulfur diesel in a hydrodesulfurization (HDS) pilot plant unit”, Global Nest: the Int. J. 1(1): 15-22. 12. Liu Y., Zou Y. (2013) “Effects of aromatic cycle oils on performance of residue hydrotreating”, Korean J. Chem. Eng. 30(11), 1985-1989.
Page 485 Copyright 2017 Al-Qadisiyah Journal For Engineering Sciences. All rights reserved.
13. Rana M.S., Rufino N., Jacques L. (2004). “Competitive effects of nitrogen and sulfur content on activity of hydrotreating CoMo/Al2O3 catalysts: a batch reactor study”, Catalysis Today 98, 67–74. 14. Sidhartha Mohanty (2011) “ Effect of citric acid on hydrotreating activity of NiMo catalysts” Masters of Science , Department of Chemical and Biological Engineering ,University of Saskatchewan.
15. SPEIGHT (2010) “Fundamentals of Petroleum and Petrochemical Engineering”, CHEMICAL INDUSTRIES, Taylor & Francis Groupin the United States of America.