25
Stunted. Current attempts to Eradicate Undernutrition Lawrence Haddad Institute of Development Studies Global Classroom
| Date post: | 20-Dec-2015 |
| Category: |
Documents |
| View: | 216 times |
| Download: | 0 times |
Stunted. Current attempts to Eradicate Undernutrition
Lawrence Haddad
Institute of Development Studies
Global Classroom

Outline• What is undernutrition?
• Why does it matter?
• Why is it a matter for public
• Which interventions work and why?
• How to move nutrition higher up the development agenda?

Child Undernutrition numbers are Increasing in SSA and Still Very High in South Asia
2730
34 3741
44
89 91 8881
7264
1980 1985 1990 1995 2000 2005
Sub-Saharan Africa Asia-South-central
Source: Based on estimates from de Onis and Blossner 2003
Millions
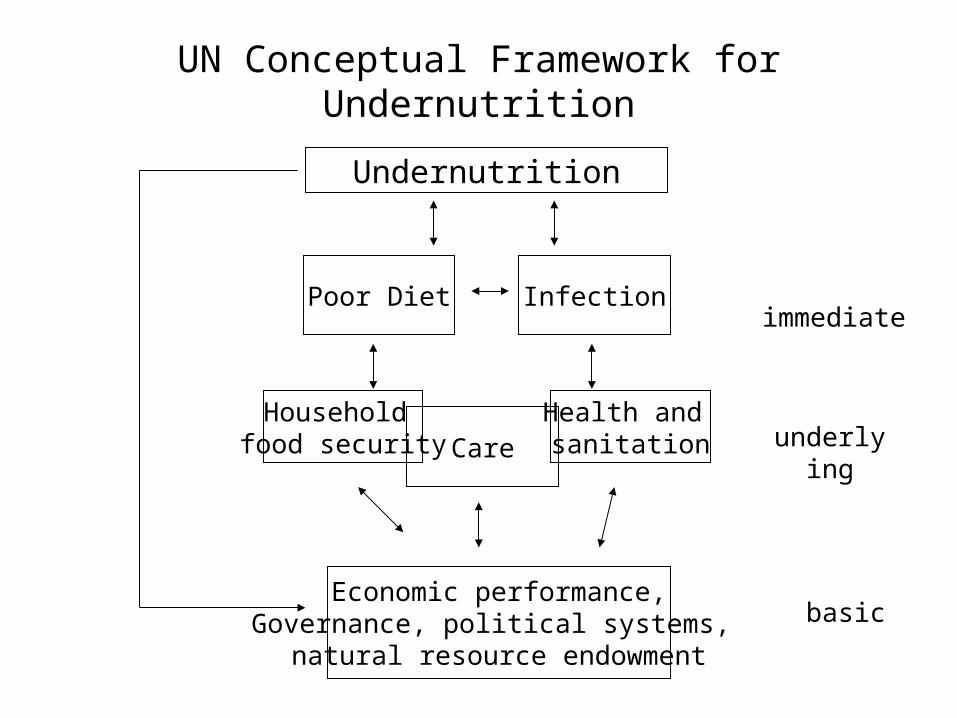
UN Conceptual Framework for Undernutrition
Undernutrition
CareHealth and sanitation
Household food security
Poor Diet Infection
Economic performance,Governance, political systems,
natural resource endowment
immediate
underlying
basic

Why does nutrition matter?• Foundational for the MDGs
– Mortality– Morbidity– Learning– Productivity

Child Undernutrition is Responsible for Half of All Child Deaths
0
5
10
15
20
25
30
35
neonataldeaths
pneumonia other Measles
% o
f ch
ild
dea
ths
proportion of deaths from being underweight
Source: Black RE, Morris SS, Bryce J 2003

1.8
1.8
1.9
2.3
2.4
2.7
2.8
3.7
4
4.1
4.4
6.3
9.5
vitamin A deficiency
low fruit and veg intake
zinc deficiency
high bmi
iron deficiency
indoor smoke from solid fuels
high cholesterol
unsafe water, sanitation and hygiene
alcohol
tobacco
high blood pressure
unsafe sex
infant and maternal underweight
Infant and Maternal Undernutrition is Leading Cause of Global Burden of Disease
Source: Ezzati et. al. 2002
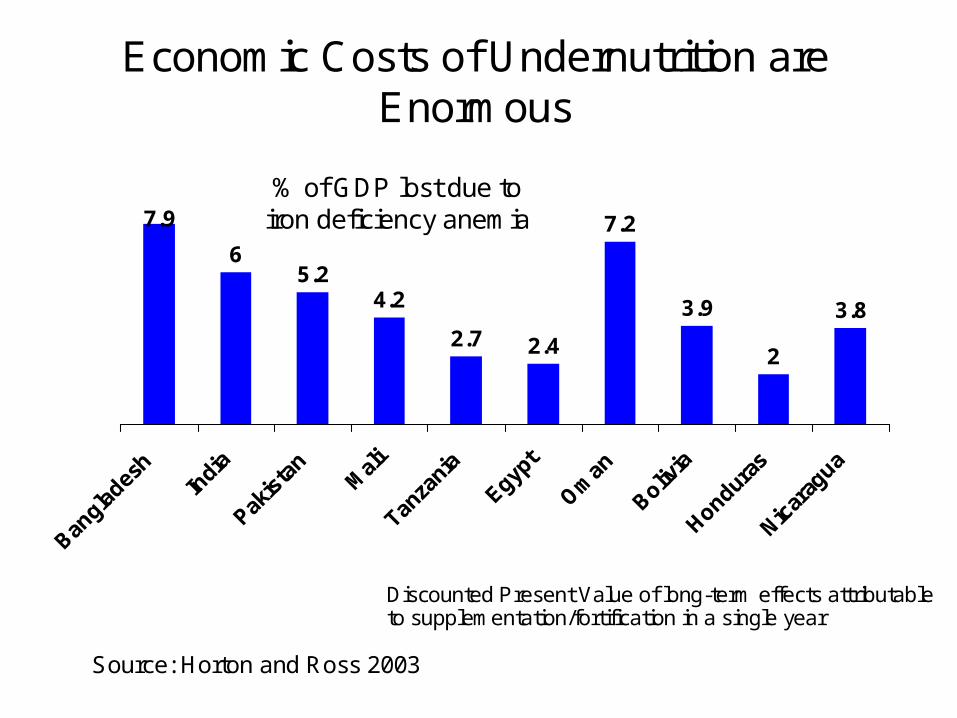
Economic Costs of Undernutrition are Enormous
7.9
65.2
4.2
2.7 2.4
7.2
3.9
2
3.8
Source: Horton and Ross 2003
% of GDP lost due to iron deficiency anemia
Discounted Present Value of long-term effects attributable to supplementation/fortification in a single year
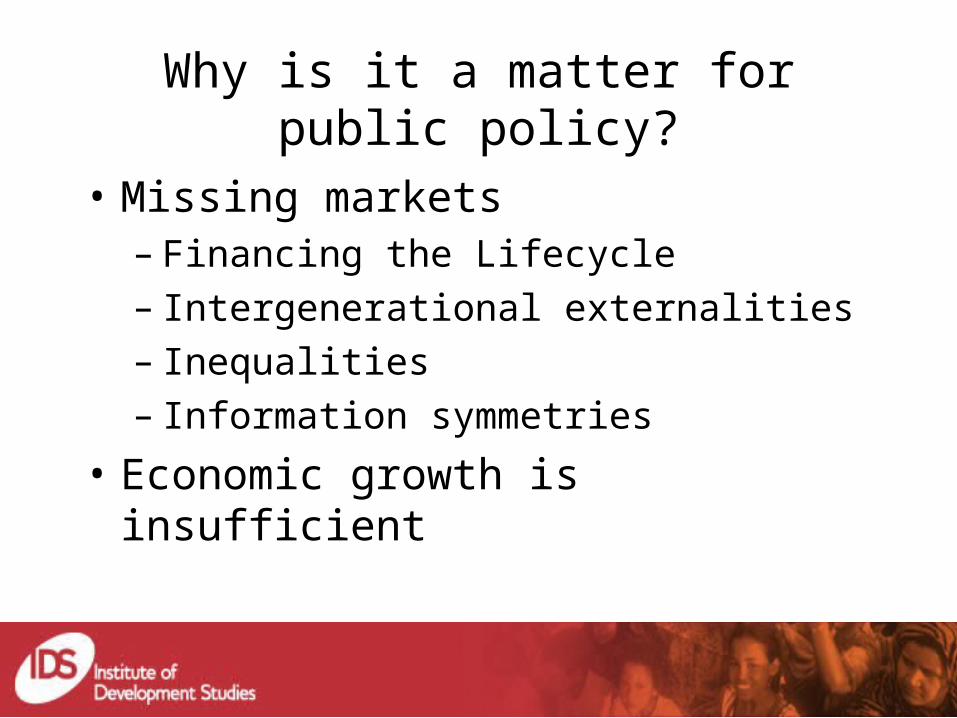
Why is it a matter for public policy?
• Missing markets– Financing the Lifecycle– Intergenerational externalities– Inequalities– Information symmetries
• Economic growth is insufficient

Irreversibility
-2
-1
0
0 6 12 18 24 30 36 42 48 54 60
Age (months)
Weig
ht
for
age Z
-sco
re
Africa Latin America and Caribbean Asia
Shrimpton et. al. 2001

-70
-60
-50
-40
-30
-20
-10
0
Per
u
Mo
rocc
o
Jam
aica
Nep
al
Ken
ya
Vie
tnam
Mo
zam
biq
ue
Eg
ypt
Pak
ista
n
Kyr
gz
So
uth
Afr
ica
Ro
man
ia
Red
uct
ion
in
ch
ild
mal
nu
trit
ion
(p
erce
nt
of
init
ial
valu
e)
Source: Haddad, L. et. al. 2004.
Decline in child malnutrition due to 2.5 percent annual growth in per capita income, 1990s to 2015
Income Growth does not Reduce Child Undernutrition Quickly Enough

Emphasis for direct interventions by country typology
Undernutrition
Ability of public sector
toaddress malnutri
tion
high * Targeted nutrition programs (e.g. WIC in USA)
med
* Early childhood development* Other food fortification
• Develop national guidelines on complementary foods
• Community-based behavior change
Low• Safe motherhood: the nutrition of girls and
women* Breastfeeding promotion
* Iron supplementation* Salt iodization
* Vitamin A mass dose with immunizations* Deworming schoolchildren

Emphasis at indirect level by country typology
Undernutrition
Ability of public sector
tosupport broad
malnutritionreduction
high* Improved crisis prevention information
networks
med
*Encourage network of community-based child care centers for poor mothers
*Reform of universal food subsidies to target to poor
*Target microcredit to women*Improve access to sanitation for poor
low
*Agriculture and food price policy to focus on improving availability of micronutrient
rich foods*Greater access to education for girls
* AIDS prevention campaigns* Improve safe water access

Commitments: Mentions of Nutrition• In Speeches (from Jan 2005)
– DFID: 0/50
– EC: 0/28
• In Press releases (from Jan 2005)– DFID: 0/197
– EC: 0/239
• In policy documents– 0 in G8 2005 and 2006
– 12 in Commission for Africa Report
– 0 in DFID Social transfers and chronic poverty

0.00%
0.10%
0.20%
0.30%
0.40%
0.50%
0.60%
Canad
a
France
Germ
any
Italy
Japan
Nether
lands
Spain
Sweden UK
USA EC
95-99
00-04
Percentage of total ODA spend on
Direct Interventions

0%
2%
4%
6%
8%
10%
12%
14%
16%
95-99
00-04
Percentage of total ODA spend on
Indirect Interventions

What constrains higher prioritisation?• The context-- weak institutional incentives
– no nutrition indicators in reporting frameworks– institutional orphan
• The message--lack of a simple story– “fuzzy” versus “silver” bullets– difficulty of attribution– lack of easy resonance with current policy frameworks
• The connectors--few, isolated and lacking visibility– failure of professional education at tertiary level– weak professional career incentives

Causes for optimism?
• CCTs
• Trends in randomised controlled trials
• Long wave issues—youth perspectives
• Diet-related chronic disease
• Governance agenda

Recommendations for Governments and Donors
• The context– use underweight as indicator for MDG1 on poverty
• The message– nutrition audit of indirect nutrition spend
– support nutrition surveys to name and shame and highlight poor governance
– generate research on a new generation of cost-effectiveness studies; policy process studies
• The connectors--few, isolated and lacking visibility– appoint a nutrition champion
– re-design higher education initiatives – e.g. Masters in Development Practice

Implications for Research
• Need a new generation of cost-effectiveness studies• More political and policy process studies• More institutional design studies

The Cost-Effectiveness of Targeting: Progresa in Mexico
Cost of targeted program to reduce poverty index by one unit Cost of non-targeted program to reduce poverty index by one unit
Source: Adapted from Skoufias, Davis and de la Vega 2001

Nutrition expenditure (rupees) per malnourished child in 8 Indian States
8.2
29.2
3.5
18.2
4.610.9 13.5
73.2
0
10
20
30
40
50
60
70
80
Source: Measham and Chatterjee 1999

Rands to create one day of employment, South Africa
Source: Hoddinott, Adato, Haddad and Besley 2001
Institutional arrangements and service delivery
Conclusions
• Undernutrition thinking desperately needs a development practice perspective—neither health nor agriculture sectors have made it a priority
• More political, institutional, policy process analyses needed
• Need a greater link to the governance agenda
• Need new graduate programmes stressing connections and the politics of undernutrition
• Some optimism that the context is becoming more receptive to changed thinking
Example questions for local investigation
• What percent of infants suffer from undernutrition in your local community? Check your perceptions against the data—how different? What do you think are the main causes of undernutrition in your area?
• The pros and cons of targeting versus universal access—dividing or uniting communities?
• The local politics of getting resources to children—mandated or voluntary?
• Variations in the design of service delivery in your area—where is it most obvious? Why?


