1 SECURITIES AND EXCHANGE COMMISSION WASHINGTON, D.C. 20549 FORM 10-K FOR ANNUAL AND TRANSITION REPORTS PURSUANT TO SECTION 13 OR 15(d) THE SECURITIES EXCHANGE ACT OF 1934 (Mark One) ANNUAL REPORT PURSUANT TO SECTION 13 OR 15(d) OF THE SECURITIES EXCHANGE ACT OF 1934 For the fiscal year ended December 31, 2017 OR TRANSITION REPORT PURSUANT TO SECTION 13 OR 15(d) OF THE SECURITIES EXCHANGE ACT OF 1934 For the transition period from ____________ to ___________ Commission File Number 0-4776 STURM, RUGER & COMPANY, INC. (Exact Name of Registrant as Specified in Its Charter) Delaware (State or Other Jurisdiction of Incorporation or Organization) 06-0633559 (I.R.S. Employer Identification No.) 1 Lacey Place, Southport, Connecticut (Address of Principal Executive Offices) 06890 (Zip Code) (203) 259-7843 (Registrant’s telephone number, including area code) Securities registered pursuant to Section 12(b) of the Act: Title of Each Class Common Stock, $1 par value Name of Each Exchange on Which Registered New York Stock Exchange Securities registered pursuant to Section 12(g) of the Act: None (Title of Class) Indicate by check mark if the registrant is a well-known seasoned issuer, as defined in Rule 405 of the Securities Act. YES NO Indicate by check mark if the registrant is not required to file reports pursuant to Section 13 or Section 15(d) of the Act. YES NO Indicate by check mark whether the registrant (1) has filed all reports required to be filed by Section 13 or 15(d) of the Securities Exchange Act of 1934 during the preceding 12 months (or for such shorter period that the registrant was required to file such reports), and (2) has been subject to such filing requirements for the past 90 days. YES NO Indicate by check mark if disclosure of delinquent filers pursuant to Item 405 of Regulation S-K is not contained herein, and will not be contained, to the best of registrant's knowledge, in definitive proxy or information statements incorporated by reference in Part III of this Form 10-K or any amendment to this Form 10-K [ ]. Indicate by check mark whether the registrant is a large accelerated filer, an accelerated filer, or a non-accelerated filer. See definition of “accelerated filer and large accelerated filer” in Rule 12b-2 of the Exchange Act. Large accelerated filer [ ] Accelerated filer [ ] Non- accelerated filer [ ] Smaller reporting company [ ]. Indicate by check mark whether the registrant is a shell company (as defined in Rule 12b-2 of the Exchange Act).YES NO Indicate by check mark whether the registrant has submitted electronically and posted on its corporate Web site, if any, every Interactive Data File required to be submitted and posted pursuant to Rule 405 of Regulation S-T (§ 232.405 of this chapter) during the preceding 12 months (or for such shorter period that the registrant was required to submit and post such files). YES NO The aggregate market value of the voting and non-voting common equity held by non-affiliates of the registrant computed by reference to the price at which the common equity was last sold, or the average bid and asked price of such common equity, as of June 30, 2017: Common Stock, $1 par value - $1,076,065,000 The number of shares outstanding of the registrant's common stock as of February 23, 2018: Common Stock, $1 par value –17,427,090 shares DOCUMENTS INCORPORATED BY REFERENCE. Portions of the registrant’s Proxy Statement relating to the 2018 Annual Meeting of Stockholders to be held May 9, 2018 are incorporated by reference into Part III (Items 10 through 14) of this Report.
Transcript
1
SECURITIES AND EXCHANGE COMMISSION
WASHINGTON, D.C. 20549
FORM 10-K
FOR ANNUAL AND TRANSITION REPORTS
PURSUANT TO SECTION 13 OR 15(d) THE SECURITIES EXCHANGE ACT OF 1934
(Mark One)
ANNUAL REPORT PURSUANT TO SECTION 13 OR 15(d) OF THE SECURITIES EXCHANGE ACT OF 1934
For the fiscal year ended December 31, 2017
OR
TRANSITION REPORT PURSUANT TO SECTION 13 OR 15(d) OF THE SECURITIES EXCHANGE ACT OF 1934
For the transition period from ____________ to ___________
Commission File Number 0-4776
STURM, RUGER & COMPANY, INC. (Exact Name of Registrant as Specified in Its Charter)
Delaware (State or Other Jurisdiction of
Incorporation or Organization)
06-0633559 (I.R.S. Employer
Identification No.)
1 Lacey Place, Southport, Connecticut (Address of Principal Executive Offices)
06890 (Zip Code)
(203) 259-7843 (Registrant’s telephone number, including area code)
Securities registered pursuant to Section 12(b) of the Act:
Title of Each Class Common Stock, $1 par value
Name of Each Exchange on Which Registered
New York Stock Exchange
Securities registered pursuant to Section 12(g) of the Act:
None
(Title of Class)
Indicate by check mark if the registrant is a well-known seasoned issuer, as defined in Rule 405 of the Securities Act. YES NO Indicate by check mark if the registrant is not required to file reports pursuant to Section 13 or Section 15(d) of the Act. YES NO Indicate by check mark whether the registrant (1) has filed all reports required to be filed by Section 13 or 15(d) of the Securities Exchange Act of
1934 during the preceding 12 months (or for such shorter period that the registrant was required to file such reports), and (2) has been subject to
such filing requirements for the past 90 days. YES NO
Indicate by check mark if disclosure of delinquent filers pursuant to Item 405 of Regulation S-K is not contained herein, and will not be contained,
to the best of registrant's knowledge, in definitive proxy or information statements incorporated by reference in Part III of this Form 10-K or any
amendment to this Form 10-K [ ].
Indicate by check mark whether the registrant is a large accelerated filer, an accelerated filer, or a non-accelerated filer. See definition of
“accelerated filer and large accelerated filer” in Rule 12b-2 of the Exchange Act. Large accelerated filer [ ] Accelerated filer [ ] Non-
accelerated filer [ ] Smaller reporting company [ ].
Indicate by check mark whether the registrant is a shell company (as defined in Rule 12b-2 of the Exchange Act).YES NO
Indicate by check mark whether the registrant has submitted electronically and posted on its corporate Web site, if any, every Interactive Data File
required to be submitted and posted pursuant to Rule 405 of Regulation S-T (§ 232.405 of this chapter) during the preceding 12 months (or for
such shorter period that the registrant was required to submit and post such files).
YES NO
The aggregate market value of the voting and non-voting common equity held by non-affiliates of the registrant computed by reference to the price
at which the common equity was last sold, or the average bid and asked price of such common equity, as of June 30, 2017:
Common Stock, $1 par value - $1,076,065,000
The number of shares outstanding of the registrant's common stock as of February 23, 2018:
Common Stock, $1 par value –17,427,090 shares
DOCUMENTS INCORPORATED BY REFERENCE.
Portions of the registrant’s Proxy Statement relating to the 2018 Annual Meeting of Stockholders to be held May 9, 2018 are incorporated by
reference into Part III (Items 10 through 14) of this Report.
In this Annual Report on Form 10-K, Sturm, Ruger & Company, Inc. and Subsidiary (the “Company”) makes forward-
looking statements and projections concerning future expectations. Such statements are based on current expectations and
are subject to certain qualifying risks and uncertainties, such as market demand, sales levels of firearms, anticipated castings
sales and earnings, the need for external financing for operations or capital expenditures, the results of pending litigation
against the Company, the impact of future firearms control and environmental legislation, and accounting estimates, any
one or more of which could cause actual results to differ materially from those projected. Words such as “expect,” “believe,”
“anticipate,” “intend,” “estimate,” “will,” “should,” “could” and other words and terms of similar meaning, typically
identify such forward-looking statements. Readers are cautioned not to place undue reliance on these forward-looking
statements, which speak only as of the date made. The Company undertakes no obligation to publish revised forward-
looking statements to reflect events or circumstances after the date such forward-looking statements are made or to reflect
the occurrence of subsequent unanticipated events.
4
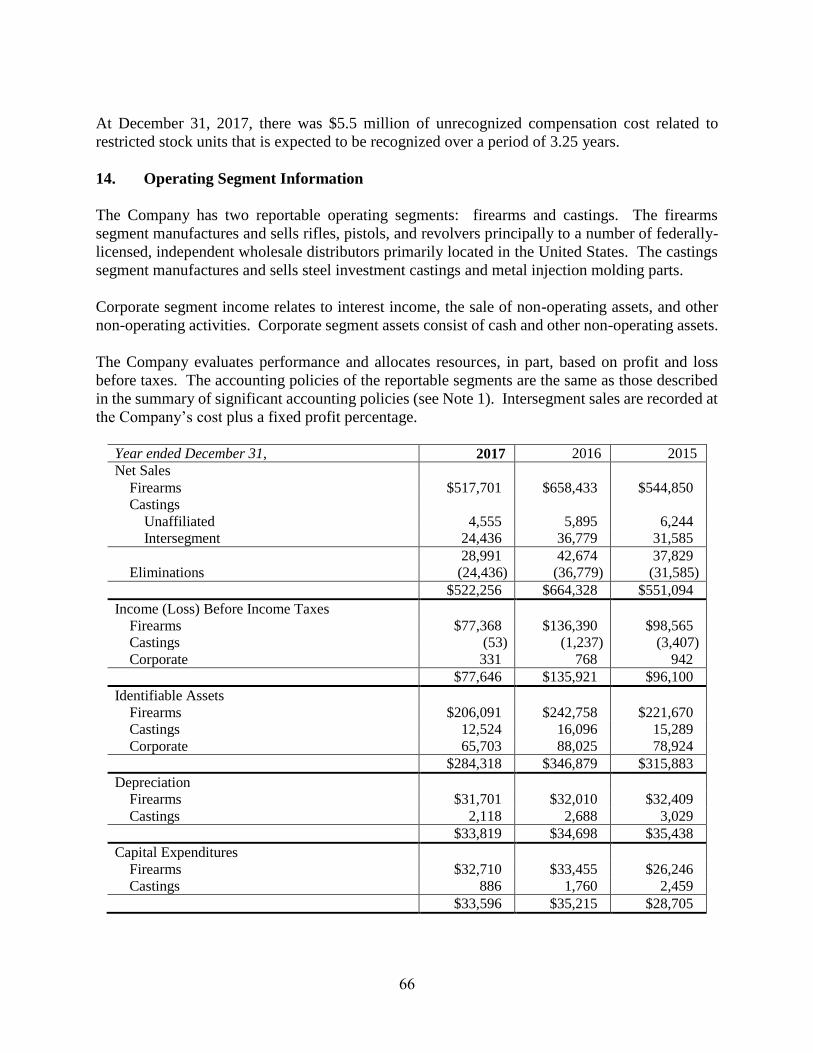
PART I ITEM 1—BUSINESS Company Overview
Sturm, Ruger & Company, Inc. and Subsidiary (the “Company”) is principally engaged in the
design, manufacture, and sale of firearms to domestic customers. Virtually all of the Company’s
sales for the year ended December 31, 2017 were from the firearms segment, with approximately
1% from the castings segment. Export sales represent approximately 4% of firearms sales. The
Company’s design and manufacturing operations are located in the United States and almost all
product content is domestic.
The Company has been in business since 1949 and was incorporated in its present form under the
laws of Delaware in 1969. The Company primarily offers products in three industry product
categories – rifles, pistols, and revolvers. The Company’s firearms are sold through independent
wholesale distributors, principally to the commercial sporting market.
The Company manufactures and sells investment castings made from steel alloys and metal
injection molding (“MIM”) parts for internal use in the firearms segment and has minimal sales to
outside customers. The castings and MIM parts sold to outside customers, either directly or
through manufacturers’ representatives, represented approximately 1% of the Company’s total
sales for the year ended December 31, 2017. For the years ended December 31, 2017, 2016, and 2015, net sales attributable to the Company's
firearms operations were $517.7 million, $658.4 million and $544.9 million. The balance of the
Company's net sales for the aforementioned periods was attributable to its castings operations.
Firearms Products
The Company presently manufactures firearm products, under the “Ruger” name and trademark,
in the following industry categories: Rifles Revolvers
Single-shot Single-action Autoloading Double-action Bolt-action Modern sporting
Pistols
Rimfire autoloading Centerfire autoloading
Most firearms are available in several models based upon caliber, finish, barrel length, and other
features.
5
Rifles
A rifle is a long gun with spiral grooves cut into the interior of the barrel to give the bullet a
stabilizing spin after it leaves the barrel. Net sales of rifles by the Company accounted for $243.0
million, $264.9 million, and $208.5 million of total net sales for the years 2017, 2016, and 2015,
respectively.
Pistols
A pistol is a handgun in which the ammunition chamber is an integral part of the barrel and which
typically is fed ammunition from a magazine contained in the grip. Net sales of pistols by the
Company accounted for $176.2 million, $250.0 million, and $192.2 million of revenues for the
years 2017, 2016, and 2015, respectively.
Revolvers
A revolver is a handgun that has a cylinder that holds the ammunition in a series of chambers
which are successively aligned with the barrel of the gun during each firing cycle. There are two
general types of revolvers, single-action and double-action. To fire a single-action revolver, the
hammer is pulled back to cock the gun and align the cylinder before the trigger is pulled. To fire
a double-action revolver, a single trigger pull advances the cylinder and cocks and releases the
hammer. Net sales of revolvers by the Company accounted for $74.6 million, $104.9 million, and
$113.3 million of revenues for the years 2017, 2016, and 2015, respectively.
Accessories
The Company also manufactures and sells accessories and replacement parts for its firearms.
These sales accounted for $23.9 million, $38.6 million, and $30.3 million of total net sales for the
years 2017, 2016, and 2015, respectively.
Castings Products
Net sales attributable to the Company’s casting operations (excluding intercompany transactions)
accounted for $4.6 million, $5.9 million, and $6.2 million, for 2017, 2016, and 2015, respectively.
These sales represented approximately 1% of total net sales in each of these years.
Manufacturing
Firearms
The Company produces one model of pistol, all of its revolvers and most of its rifles at the
Newport, New Hampshire facility. Most of the Company’s pistols are produced at the Prescott,
Arizona facility. Some rifle models and two pistol models are produced at the Mayodan, North
Carolina facility.
Many of the basic metal component parts of the firearms manufactured by the Company are
produced by the Company's castings segment through processes known as precision investment
casting. The Company also uses many MIM parts in its firearms. See "Manufacturing- Investment
Castings and Metal Injected Moldings" below for a description of these processes. The Company
believes that investment castings and MIM parts provide greater design flexibility and result in
component parts which are generally close to their ultimate shape and, therefore, require less
machining than processes requiring machining a solid billet of metal to obtain a part. Through the
6
use of investment castings and MIM parts, the Company endeavors to produce durable and less
costly component parts for its firearms.
All assembly, inspection, and testing of firearms manufactured by the Company are performed at
the Company's manufacturing facilities. Every firearm, including every chamber of every revolver
manufactured by the Company, is test-fired prior to shipment.
Investment Castings and Metal Injection Moldings
To produce a product by the investment casting method, a wax model of the part is created and
coated (“invested”) with several layers of ceramic material. The shell is then heated to melt the
interior wax, which is poured off, leaving a hollow mold. To cast the desired part, molten metal is
poured into the mold and allowed to cool and solidify. The mold is then broken off to reveal a
near net shape cast metal part.
Metal injection molding is a three part powder metallurgy process by which a feedstock consisting
of finely powdered metal and binders is processed through injection molding, debinding, and
sintering equipment to produce steel, stainless steel, and alloy parts of complex shape and
geometry. This process allows for high volume production while eliminating many of the wastes
of traditional metal working methods, yielding net shape and near net shape parts.
Marketing and Distribution
Firearms
The Company's firearms are primarily marketed through a network of federally licensed,
independent wholesale distributors who purchase the products directly from the Company. They
resell to federally licensed, independent retail firearms dealers who in turn resell to legally
authorized end users. All retail purchasers are subject to a point-of-sale background check by law
enforcement. These end users include sportsmen, hunters, people interested in self-defense, law
enforcement and other governmental organizations, and gun collectors. Each distributor carries
the entire line of firearms manufactured by the Company for the commercial market. Currently,
19 distributors service the domestic commercial market, with an additional 23 distributors
servicing the domestic law enforcement market and 41 distributors servicing the export market.
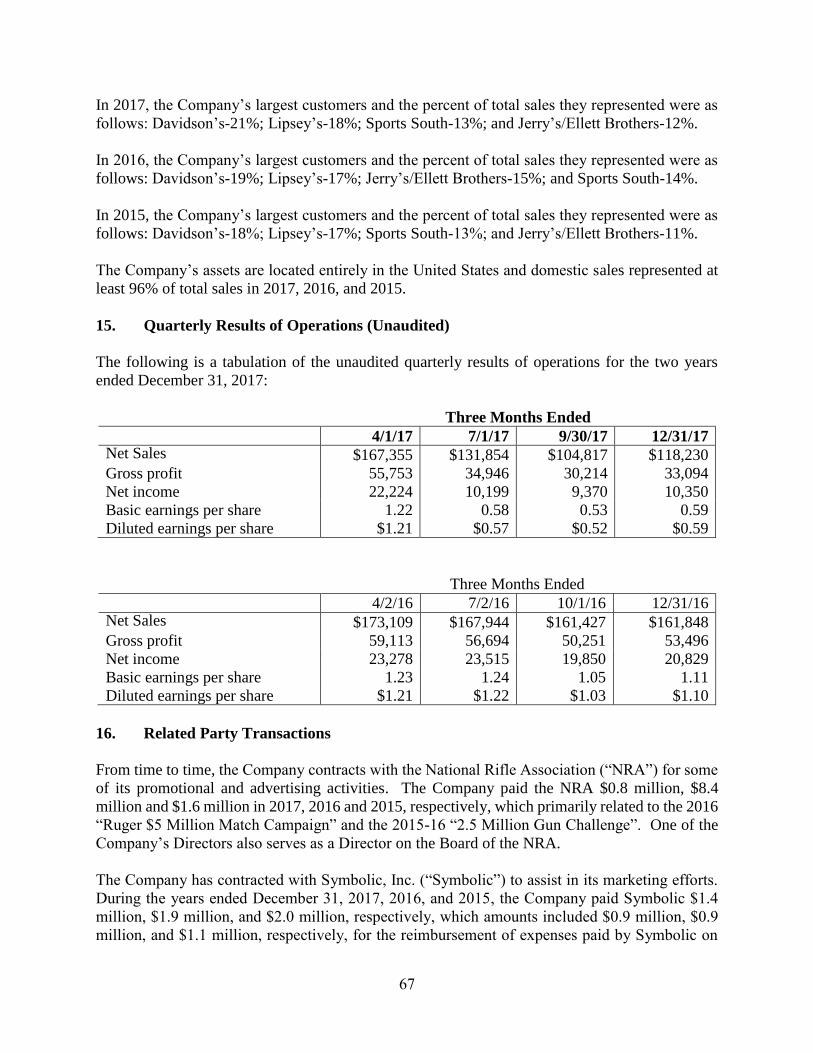
In 2017, the Company’s largest customers and the percent of total sales they represented were as
follows: Davidson’s-21%; Lipsey’s-18%; Sports South-13%; and Jerry’s/Ellett Brothers-12%.
In 2016, the Company’s largest customers and the percent of total sales they represented were as
follows: Davidson’s-19%; Lipsey’s-17%; Jerry’s/Ellett Brothers-15%; and Sports South-14%.
In 2015, the Company’s largest customers and the percent of total sales they represented were as
follows: Davidson’s-18%; Lipsey’s-17%; Sports South-13%, and Jerry’s/Ellett Brothers-11%.
The Company employs 14 employees who service these distributors and call on retailers and law
enforcement agencies. Because the ultimate demand for the Company's firearms comes from end
users rather than from the independent wholesale distributors, the Company believes that the loss
of any distributor would not have a material, long-term adverse effect on the Company, but may
7
have a material adverse effect on the Company’s financial results for a particular period. The
Company considers its relationships with its distributors to be satisfactory.
The Company also exports its firearms through a network of selected commercial distributors and
directly to certain foreign customers, consisting primarily of law enforcement agencies and foreign
governments. Foreign sales were less than 5% of the Company's consolidated net sales for each
of the past three fiscal years.
The Company does not consider its overall firearms business to be predictably seasonal; however,
orders of many models of firearms from the distributors tend to be stronger in the first quarter of
the year and weaker in the third quarter of the year. This is due in part to the timing of the
distributor show season, which occurs during the first quarter.
Investment Castings and Metal Injection Moldings
The castings segment provides castings and MIM parts for the Company’s firearms segment. In
addition, the castings segment produces some products for a number of customers in a variety of
industries.
Competition
Firearms
Competition in the firearms industry is intense and comes from both foreign and domestic
manufacturers. While some of these competitors concentrate on a single industry product category
such as rifles or pistols, several competitors manufacture products in all four industry categories
(rifles, shotguns, pistols, and revolvers). The principal methods of competition in the industry are
product innovation, quality, availability, brand, and price. The Company believes that it can
compete effectively with all of its present competitors.
Investment Castings and Metal Injection Moldings
There are a large number of investment castings and MIM manufacturers, both domestic and
foreign, with which the Company competes. Competition varies based on the type of investment
castings products and the end use of the product. Companies offering alternative methods of
manufacturing such as wire electric discharge machining (EDM) and advancements in computer
numeric controlled (CNC) machining also compete with the Company’s castings segment. Many
of these competitors are larger corporations than the Company with substantially greater financial
resources than the Company, which could affect the Company’s ability to compete with these
competitors. The principal methods of competition in the industry are quality, price, and
production lead time.
Employees
As of February 1, 2018, the Company employed approximately 1,750 full-time employees,
approximately 27% of whom had at least ten years of service with the Company. From time to
time, the Company uses temporary employees to supplement its workforce. As of February 1,
2018, the Company had no temporary employees.
8
None of the Company's employees are subject to a collective bargaining agreement.
Research and Development
In 2017, 2016, and 2015, the Company spent approximately $9.8 million, $8.7 million, and $8.5
million, respectively, on research and development activities relating to new products and the
improvement of existing products. As of February 1, 2018, the Company had approximately 70
employees whose primary responsibilities were research and development activities.
Patents and Trademarks
The Company owns various United States and foreign patents and trademarks which have been
secured over a period of years and which expire at various times. It is the policy of the Company
to apply for patents and trademarks whenever new products or processes deemed commercially
valuable are developed or marketed by the Company. However, none of these patents and
trademarks are considered to be fundamental to any important product or manufacturing process
of the Company and, although the Company deems its patents and trademarks to be of value, it
does not consider its business materially dependent on patent or trademark protection.
Environmental Matters
The Company is committed to achieving high standards of environmental quality and product
safety, and strives to provide a safe and healthy workplace for its employees and others in the
communities in which it operates. The Company has programs in place that monitor compliance
with various environmental regulations. However, in the normal course of its manufacturing
operations the Company is subject to governmental proceedings and orders pertaining to waste
disposal, air emissions, and water discharges into the environment. These regulations are
integrated into the Company’s manufacturing, assembly, and testing processes. The Company
believes that it is generally in compliance with applicable environmental regulations and that the
outcome of any environmental proceedings and orders will not have a material adverse effect on
the financial position of the Company, but could have a material adverse effect on the financial
results for a particular period.
9
Executive Officers of the Company
Set forth below are the names, ages, and positions of the executive officers of the Company.
Officers serve at the discretion of the Board of Directors of the Company. Name Age Position With Company Christopher J. Killoy 59 President and Chief Executive Officer Thomas A. Dineen 49 Senior Vice President, Treasurer and Chief Financial
Officer Thomas P. Sullivan 57 Senior Vice President of Operations Kevin B. Reid, Sr. 57 Vice President, General Counsel and Corporate
Secretary Shawn C. Leska 46 Vice President, Sales
Christopher J. Killoy became President & Chief Executive Officer on May 9, 2017. Previously he
served as President and Chief Operating Officer since January 1, 2014. Prior to that he served as
Vice President of Sales and Marketing since November 27, 2006. Mr. Killoy originally joined the
Company in 2003 as Executive Director of Sales and Marketing, and subsequently served as Vice
President of Sales and Marketing from November 1, 2004 to January 25, 2005.
Thomas A. Dineen became Senior Vice President on July 10, 2017. Previously he served as Vice
President since May 24, 2006. Prior to that he served as Treasurer and Chief Financial Officer
since May 6, 2003 and had been Assistant Controller since 2001. Mr. Dineen joined the Company
as Manager, Corporate Accounting in 1997.
Thomas P. Sullivan became Senior Vice President of Operations on July 1, 2017. Mr. Sullivan
joined the Company as Vice President of Newport Operations for the Newport, New Hampshire
Firearms and Pine Tree Castings divisions on August 14, 2006.
Kevin B. Reid, Sr. became Vice President and General Counsel on April 23, 2008. Previously he
served as the Company’s Director of Marketing from June 4, 2007. Mr. Reid joined the Company
in July 2001 as an Assistant General Counsel.
Shawn C. Leska became Vice President, Sales on November 6, 2015. Mr. Leska joined the
Company in 1989 and has served in a variety of positions in the sales department. Most recently,
Mr. Leska served as Director of Sales since 2011.
Where You Can Find More Information
The Company is subject to the informational requirements of the Securities Exchange Act of 1934,
as amended (the "Exchange Act"), and accordingly, files its Annual Report on Form 10-K,
Quarterly Reports on Form 10-Q, Definitive Proxy Statements, Current Reports on Form 8-K, and
10
other information with the Securities and Exchange Commission (the "SEC"). The public may
read and copy any materials filed with the SEC at the SEC's Public Reference Room at 100 F Street
NE, Washington, DC 20549. Please call the SEC at (800) SEC-0330 for further information on
the Public Reference Room. As an electronic filer, the Company's public filings are maintained
on the SEC's Internet site that contains reports, proxy and information statements, and other
information regarding issuers that file electronically with the SEC. The address of that website is
http://www.sec.gov.
The Company makes its Annual Report on Form 10-K, Quarterly Reports on Form 10-Q,
Definitive Proxy Statements, Current Reports on Form 8-K and amendments to those reports filed
or furnished pursuant to Section 13(a) or 15(d) of the Exchange Act accessible free of charge
through the Company's Internet site after the Company has electronically filed such material with,
or furnished it to, the SEC. The address of that website is http://www.ruger.com. However, such
reports may not be accessible through the Company's website as promptly as they are accessible
on the SEC’s website.
Additionally, the Company’s corporate governance materials, including its Corporate Governance
Guidelines, the charters of the Audit, Compensation, Nominating and Corporate Governance, and
Risk Oversight committees, and the Code of Business Conduct and Ethics may also be found under
the “Investor Relations” subsection of the “Corporate” section of the Company’s Internet site at
http://www.ruger.com/corporate. A copy of the foregoing corporate governance materials is
available upon written request to the Corporate Secretary at Sturm, Ruger & Company, Inc., 1
The Company’s operations could be affected by various risks, many of which are beyond its
control. Based on current information, the Company believes that the following identifies the most
significant risk factors that could adversely affect its business. Past financial performance may
not be a reliable indicator of future performance and historical trends should not be used to
anticipate results or trends in future periods.
In evaluating the Company’s business, the following risk factors, as well as other information in
this report, should be carefully considered.
Changes in government policies and firearms legislation could adversely affect the
Company’s financial results.
The sale, purchase, ownership, and use of firearms are subject to thousands of federal, state and
local governmental regulations. The basic federal laws are the National Firearms Act, the Federal
Firearms Act, and the Gun Control Act of 1968. These laws generally prohibit the private
ownership of fully automatic weapons and place certain restrictions on the interstate sale of
firearms unless certain licenses are obtained. The Company does not manufacture fully automatic
weapons and holds all necessary licenses under these federal laws. Several states currently have
laws in effect similar to the aforementioned legislation.
11
In 2005, Congress enacted the Protection of Lawful Commerce in Arms Act (“PLCAA”). The
PLCAA was enacted to address abuses by cities and agenda-driven individuals who wrongly
sought to make firearms manufacturers liable for legally manufactured and lawfully sold products
if those products were later used in criminal acts. The Company believes the PLCAA merely
codifies common sense and long standing tort principles. If the PLCAA is repealed or efforts to
circumvent it are successful and lawsuits similar to those filed by cities and agenda-driven
individuals in the late 1990s and early 2000s are allowed to proceed, it could have a material
adverse impact on the Company.
Currently, federal and several states’ legislatures are considering additional legislation relating to
the regulation of firearms. These proposed bills are extremely varied, but many seek either to
restrict or ban the sale and, in some cases, the ownership of various types of firearms. Other
legislation seeks to require new technologies, such as microstamping and so-called “smart gun”
technology, that are not proven, reliable or feasible. Such legislation became effective in
California in 2013, and has limited our ability to sell certain products in California. If similar
legislation is enacted in other states, it could effectively ban or severely limit the sale of affected
firearms. There also are legislative proposals to limit magazine capacity.
The Company believes that the lawful private ownership of firearms is guaranteed by the Second
Amendment to the United States Constitution and that the widespread private ownership of
firearms in the United States will continue. However, there can be no assurance that the regulation
of firearms will not become more restrictive in the future and that any such restriction would not
have a material adverse effect on the business of the Company.
The Company’s results of operations could be further adversely affected if legislation with
diverse requirements is enacted.
With literally thousands of laws being proposed at the federal, state and local levels, if even a small
percentage of these laws are enacted and they are incongruent, the Company could find it difficult,
expensive or even practically impossible to comply with them, impeding new product development
and distribution of existing products.
The Company’s results of operations could be adversely affected by litigation.
The Company faces risks arising from various asserted and unasserted litigation matters. These
matters include, but are not limited to, assertions of allegedly defective product design or
manufacture, alleged failure to warn, purported class actions against firearms manufacturers,
generally seeking relief such as medical expense reimbursement, property damages, and punitive
damages arising from accidents involving firearms or the criminal misuse of firearms, and those
lawsuits filed on behalf of municipalities alleging harm to the general public. Various factors or
developments can lead to changes in current estimates of liabilities such as final adverse judgment,
significant settlement or changes in applicable law. A future adverse outcome in any one or more
of these matters could have a material adverse effect on the Company’s financial results. See Note
17 to the financial statements which are included in this Annual Report on Form 10-K.
12
Our insurance may be insufficient to protect us from claims or losses. We maintain insurance coverage with third-party insurers. However, not every risk or liability is
or can be protected by insurance, and, for those risks we insure, the limits of coverage we purchase
or that are reasonably obtainable in the market may not be sufficient to cover all actual losses or
liabilities incurred. Moreover, there is a risk that commercially available liability insurance will
not continue to be available to us at a reasonable cost, if at all. If liability claims or losses exceed
our current or available insurance coverage, our business and prospects may be harmed.
The Company’s results of operations could be adversely affected by a decrease in demand
for Company products.
If demand for the Company’s products decreases significantly, the Company would be unable to
efficiently utilize its capacity, and profitability would suffer. Decreased demand could result from
a macroeconomic downturn, or could be specific to the firearms industry. If the decrease in
demand occurs abruptly, the adverse impact would be even greater.
The financial health of our independent distributors is critical to our success.
Over 90% of our sales are made to 19 federally licensed, independent wholesale distributors. We
review our distributors’ financial statements and have credit insurance for many of them.
However, our credit evaluations of distributors and credit insurance may not be completely
effective, especially if an interest rate increase exacts an additional financial strain.
If one or more independent distributors experience financial distress or liquidity issues, we may
not be able to collect our accounts receivable on a timely basis, which would have an adverse
impact on our operating results and financial condition.
The Company must comply with various laws and regulations pertaining to workplace safety
and environment, environmental matters, and firearms manufacture.
In the normal course of its manufacturing operations, the Company is subject to numerous federal,
state and local laws and governmental regulations, and governmental proceedings and orders.
These laws and regulations pertain to matters like workplace safety and environment, firearms
serial number tracking and control, waste disposal, air emissions and water discharges into the
environment. Noncompliance with any one or more of these laws and regulations could have a
material adverse impact on the Company.
Misconduct of our employees or contractors could cause us to lose customers and could have
a significant adverse impact on our business and reputation. Misconduct, fraud or other improper activities by our employees or contractors could have a
material adverse impact on our business and reputation. Such misconduct could include the failure
to comply with federal, state, local or foreign government procurement regulations, regulations
regarding the protection of personal information, laws and regulations relating to antitrust and any
other applicable laws or regulations.
13
Business disruptions at one of the Company’s manufacturing facilities could adversely affect
the Company’s financial results.
The Newport, New Hampshire, Prescott, Arizona and Mayodan, North Carolina facilities are
critical to the Company’s success. These facilities house the Company’s principal production,
research, development, engineering, design, and shipping operations. Any event that causes a
disruption of the operation of any of these facilities for even a relatively short period of time could
have a material adverse effect on the Company’s ability to produce and ship products and to
provide service to its customers.
We rely on our information and communications systems in our operations. Security
breaches and other disruptions could adversely affect our business and results of operations. Cyber-security threats are significant and evolving and include, among others, malicious software,
attempts to gain unauthorized access to data, and other electronic security breaches that could lead
to disruptions in mission critical systems, unauthorized release of confidential or otherwise
protected information and corruption of data. In addition to security threats, we are also subject to
other systems failures, including network, software or hardware failures, whether caused by us,
third-party service providers, natural disasters, power shortages, terrorist attacks or other events.
The unavailability of our information or communications systems, the failure of these systems to
perform as anticipated or any significant breach of data security could cause loss of data, disrupt
our operations, lead to financial losses from remedial actions, require significant management
attention and resources, and negatively impact our reputation among our customers and the public,
which could have a negative impact on our financial condition, results of operations and liquidity.
Price increases for raw materials could adversely affect the Company’s financial results.
Third parties supply the Company with various raw materials for its firearms and castings, such as
fabricated steel components, walnut, birch, beech, maple and laminated lumber for rifle stocks,
wax, ceramic material, metal alloys, various synthetic products and other component parts. There
is a limited supply of these materials in the marketplace at any given time, which can cause the
purchase prices to vary based upon numerous market factors. The Company believes that it has
adequate quantities of raw materials in inventory or on order to provide ample time to locate and
obtain additional items at then-current market cost without interruption of its manufacturing
operations. However, if market conditions result in a significant prolonged inflation of certain
prices or if adequate quantities of raw materials cannot be obtained, the Company’s manufacturing
processes could be interrupted and the Company’s financial condition or results of operations
could be materially adversely affected.
Retention of key management is critical to the success of the Company. We rely on the management and leadership skills of our senior management team. Our senior
executives are not bound by employment agreements. The loss of the services of one or more of
our senior executives or other key personnel could have a significant adverse impact on our
business.
ITEM 1B—UNRESOLVED STAFF COMMENTS
None
14
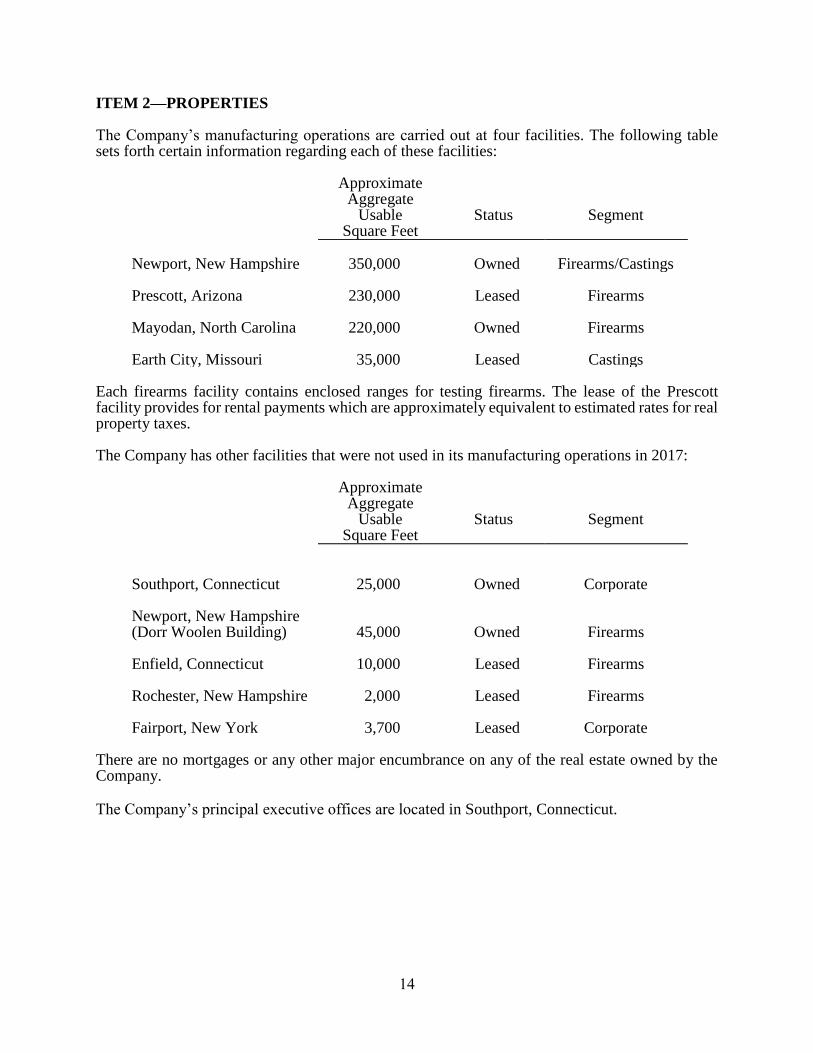
ITEM 2—PROPERTIES The Company’s manufacturing operations are carried out at four facilities. The following table sets forth certain information regarding each of these facilities:
Approximate Aggregate
Usable Square Feet
Status
Segment
Newport, New Hampshire 350,000 Owned Firearms/Castings Prescott, Arizona 230,000 Leased Firearms Mayodan, North Carolina 220,000 Owned Firearms Earth City, Missouri 35,000 Leased Castings
Each firearms facility contains enclosed ranges for testing firearms. The lease of the Prescott facility provides for rental payments which are approximately equivalent to estimated rates for real property taxes. The Company has other facilities that were not used in its manufacturing operations in 2017:
Enfield, Connecticut 10,000 Leased Firearms Rochester, New Hampshire 2,000 Leased Firearms Fairport, New York 3,700 Leased Corporate
There are no mortgages or any other major encumbrance on any of the real estate owned by the Company. The Company’s principal executive offices are located in Southport, Connecticut.
15
ITEM 3—LEGAL PROCEEDINGS
The nature of the legal proceedings against the Company is discussed at Note 17 to the financial
statements, which are included in this Form 10-K.
The Company has reported all cases instituted against it through September 30, 2017, and the
results of those cases, where terminated, to the SEC on its previous Form 10-Q and 10-K reports,
to which reference is hereby made.
One lawsuit was formally instituted against the Company during the three months ending
December 31, 2017, captioned as David S. Palmer, on behalf of himself and all others similarly
situated vs. Sturm, Ruger & Co., and filed in the Circuit Court for the Thirteenth Judicial Circuit
in and for Hillsborough County, Florida. The suit alleges breach of warranty and deceptive trade
practices related to the sale of 10/22 Target Rifles.
During the three months ending December 31, 2017, the previously reported case of Terry W.
Turner v. Sturm, Ruger & Company., Inc. and Winchester Ammunition, Inc. was dismissed, with
prejudice.
ITEM 4—MINE SAFETY DISCLOSURES – NOT APPLICABLE
16
PART II ITEM 5—MARKET FOR REGISTRANT'S COMMON EQUITY, RELATED
STOCKHOLDER MATTERS AND ISSUER PURCHASES OF EQUITY SECURITIES
The Company’s common stock is traded on the New York Stock Exchange under the symbol
“RGR.” At February 9, 2018, the Company had 1,662 stockholders of record.
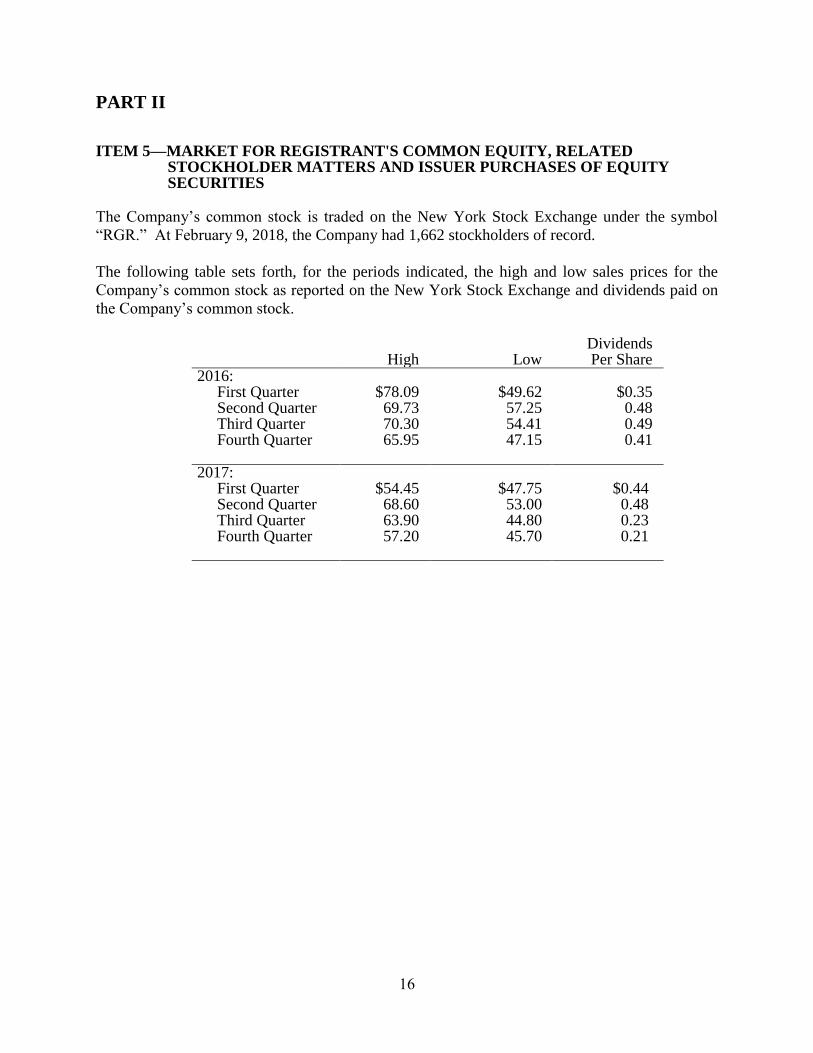
The following table sets forth, for the periods indicated, the high and low sales prices for the
Company’s common stock as reported on the New York Stock Exchange and dividends paid on
the Company’s common stock.
High
Low Dividends Per Share
2016: First Quarter $78.09 $49.62 $0.35 Second Quarter 69.73 57.25 0.48 Third Quarter 70.30 54.41 0.49 Fourth Quarter 65.95 47.15 0.41 2017: First Quarter $54.45 $47.75 $0.44 Second Quarter 68.60 53.00 0.48 Third Quarter 63.90 44.80 0.23 Fourth Quarter 57.20 45.70 0.21
17
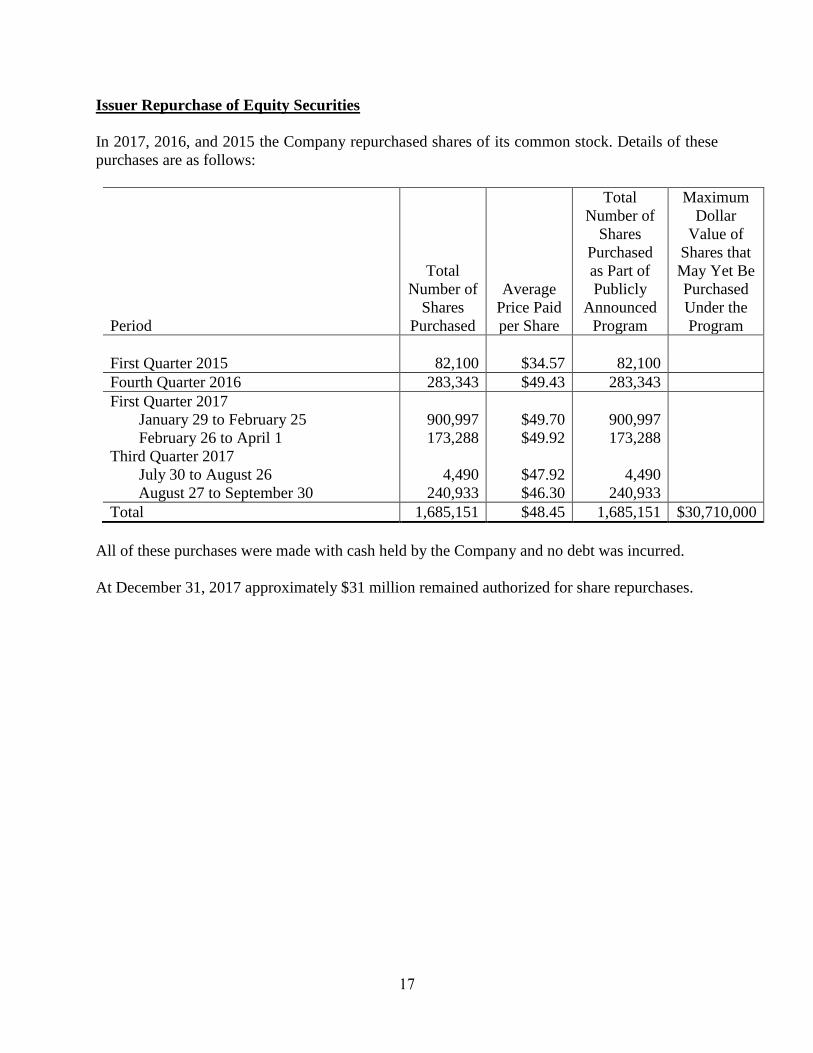
Issuer Repurchase of Equity Securities
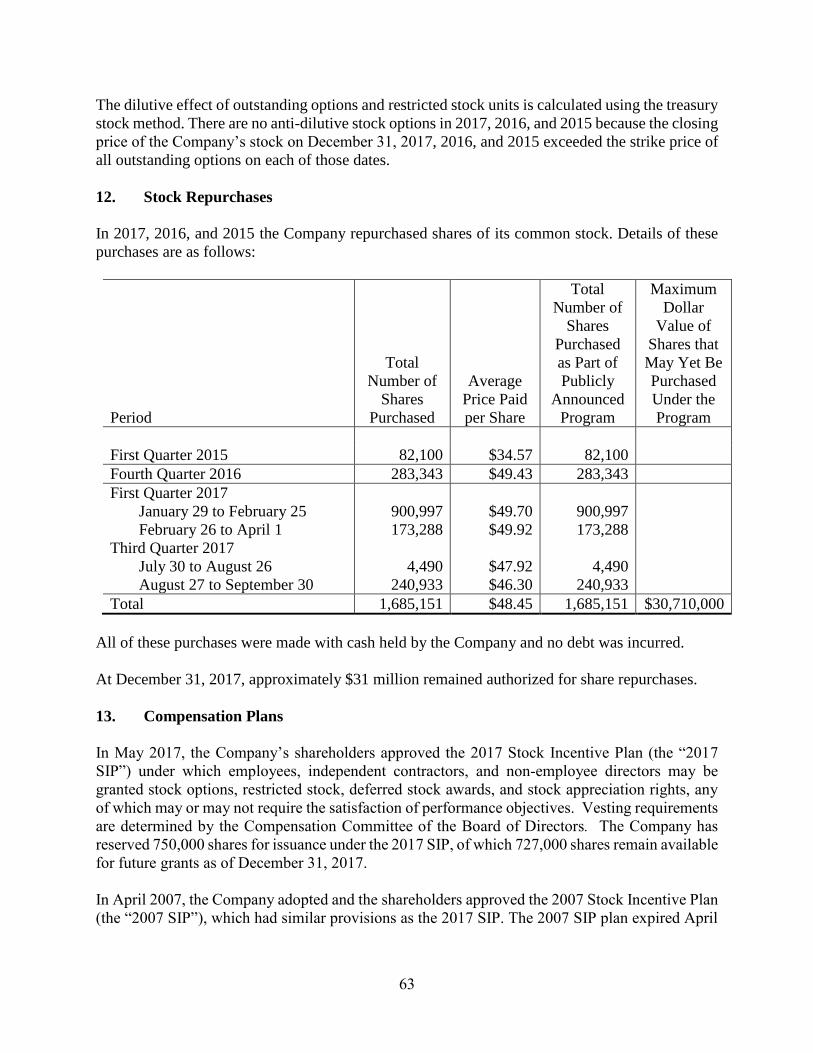
In 2017, 2016, and 2015 the Company repurchased shares of its common stock. Details of these
purchases are as follows:
Period
Total
Number of
Shares
Purchased
Average
Price Paid
per Share
Total
Number of
Shares
Purchased
as Part of
Publicly
Announced
Program
Maximum
Dollar
Value of
Shares that
May Yet Be
Purchased
Under the
Program
First Quarter 2015 82,100 $34.57 82,100
Fourth Quarter 2016 283,343 $49.43 283,343
First Quarter 2017
January 29 to February 25
February 26 to April 1
Third Quarter 2017
July 30 to August 26
August 27 to September 30
900,997
173,288
4,490
240,933
$49.70
$49.92
$47.92
$46.30
900,997
173,288
4,490
240,933
Total 1,685,151 $48.45 1,685,151 $30,710,000
All of these purchases were made with cash held by the Company and no debt was incurred.
At December 31, 2017 approximately $31 million remained authorized for share repurchases.
18
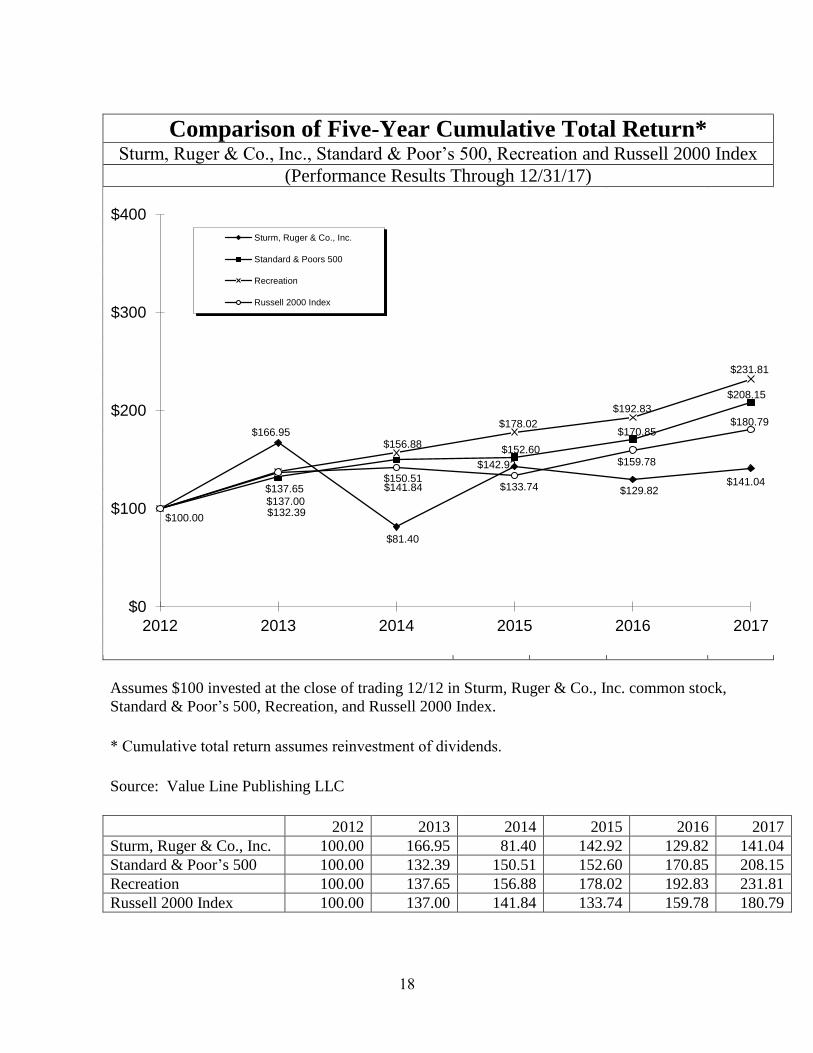
Comparison of Five-Year Cumulative Total Return* Sturm, Ruger & Co., Inc., Standard & Poor’s 500, Recreation and Russell 2000 Index
(Performance Results Through 12/31/17)
Assumes $100 invested at the close of trading 12/12 in Sturm, Ruger & Co., Inc. common stock,
Standard & Poor’s 500, Recreation, and Russell 2000 Index.
* Cumulative total return assumes reinvestment of dividends.
Russell 2000 Index 100.00 137.00 141.84 133.74 159.78 180.79
$100.00
$166.95
$81.40
$142.92
$129.82$141.04
$132.39
$150.51
$152.60
$170.85
$208.15
$137.65
$156.88
$178.02
$192.83
$231.81
$137.00
$141.84 $133.74
$159.78
$180.79
$0
$100
$200
$300
$400
2012 2013 2014 2015 2016 2017
Sturm, Ruger & Co., Inc.
Standard & Poors 500
Recreation
Russell 2000 Index
19
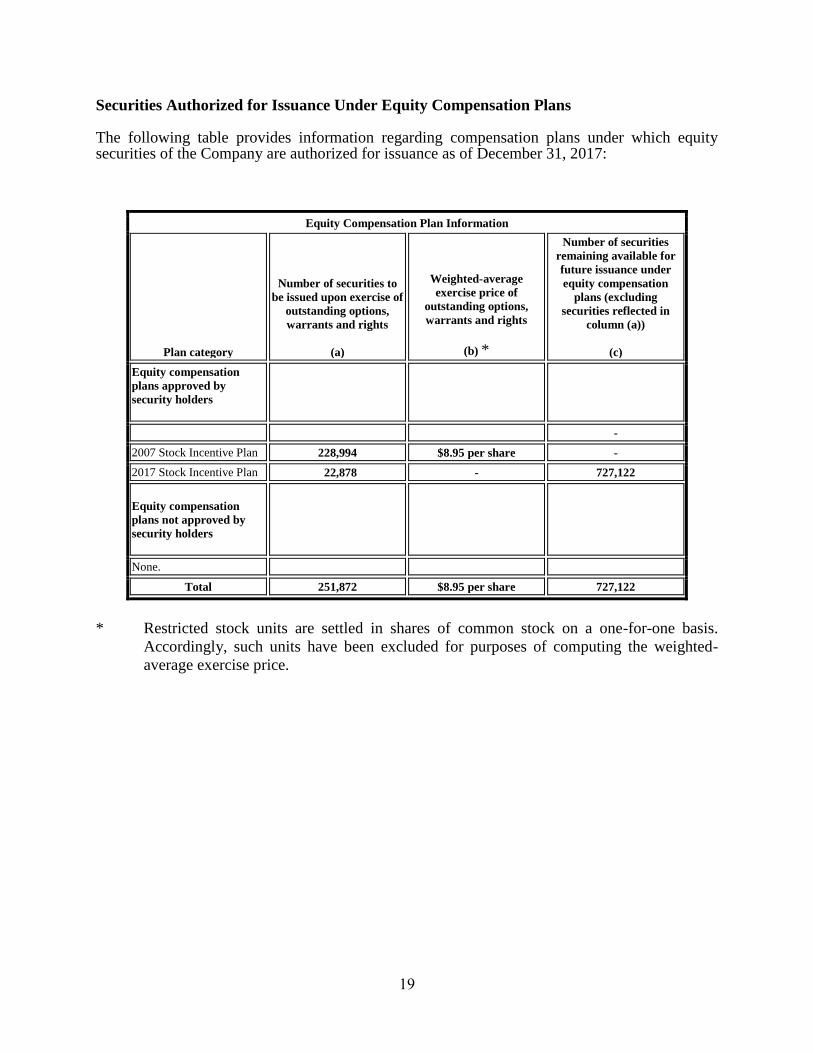
Securities Authorized for Issuance Under Equity Compensation Plans The following table provides information regarding compensation plans under which equity securities of the Company are authorized for issuance as of December 31, 2017:
Equity Compensation Plan Information
Plan category
Number of securities to
be issued upon exercise of
outstanding options,
warrants and rights
(a)
Weighted-average
exercise price of
outstanding options,
warrants and rights
(b) *
Number of securities
remaining available for
future issuance under
equity compensation
plans (excluding
securities reflected in
column (a))
(c)
Equity compensation
plans approved by
security holders
-
2007 Stock Incentive Plan 228,994 $8.95 per share -
2017 Stock Incentive Plan 22,878 - 727,122
Equity compensation
plans not approved by
security holders
None.
Total 251,872 $8.95 per share 727,122
* Restricted stock units are settled in shares of common stock on a one-for-one basis.
Accordingly, such units have been excluded for purposes of computing the weighted-
average exercise price.
20
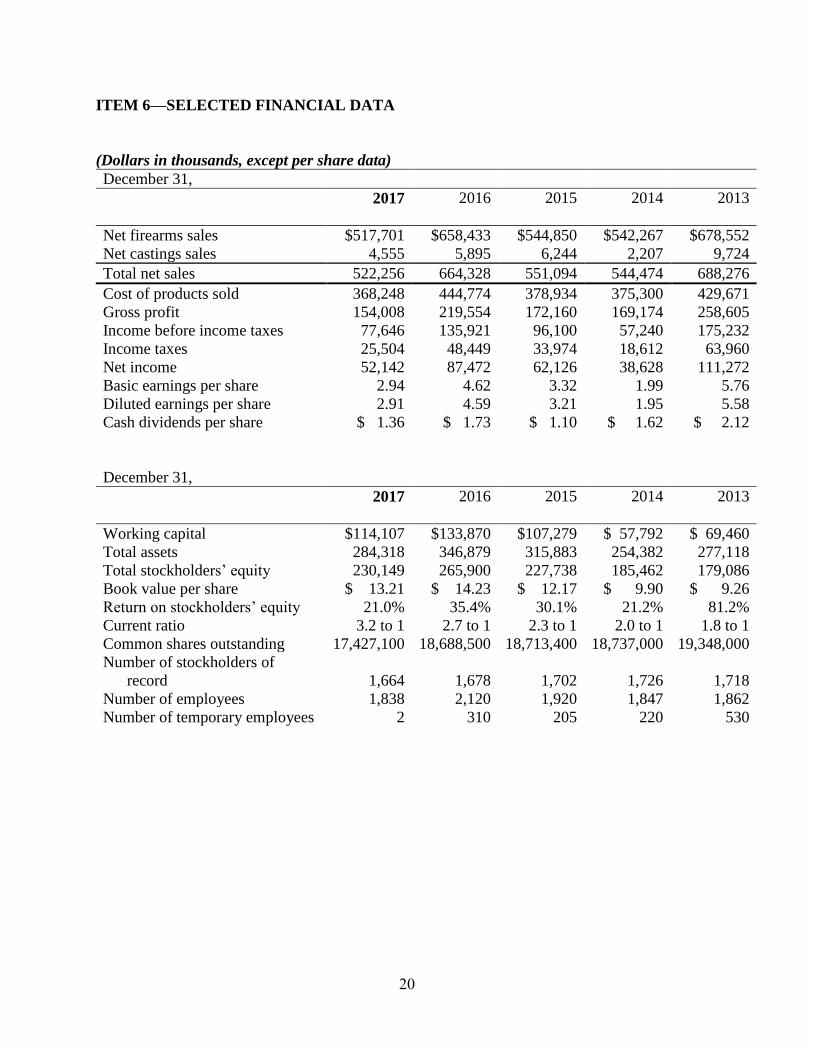
ITEM 6—SELECTED FINANCIAL DATA
(Dollars in thousands, except per share data)
December 31,
2017
2016
2015 2014 2013
Net firearms sales $517,701 $658,433 $544,850 $542,267 $678,552
Net castings sales 4,555 5,895 6,244 2,207 9,724
Total net sales 522,256 664,328 551,094 544,474 688,276
Cost of products sold 368,248 444,774 378,934 375,300 429,671
Working capital $114,107 $133,870 $107,279 $ 57,792 $ 69,460
Total assets 284,318 346,879 315,883 254,382 277,118
Total stockholders’ equity 230,149 265,900 227,738 185,462 179,086
Book value per share $ 13.21 $ 14.23 $ 12.17 $ 9.90 $ 9.26
Return on stockholders’ equity 21.0% 35.4% 30.1% 21.2% 81.2%
Current ratio 3.2 to 1 2.7 to 1 2.3 to 1 2.0 to 1 1.8 to 1
Common shares outstanding 17,427,100 18,688,500 18,713,400 18,737,000 19,348,000
Number of stockholders of
record
1,664
1,678
1,702
1,726
1,718
Number of employees 1,838 2,120 1,920 1,847 1,862
Number of temporary employees 2 310 205 220 530
21
ITEM 7—MANAGEMENT'S DISCUSSION AND ANALYSIS OF FINANCIAL CONDITION AND RESULTS OF OPERATIONS
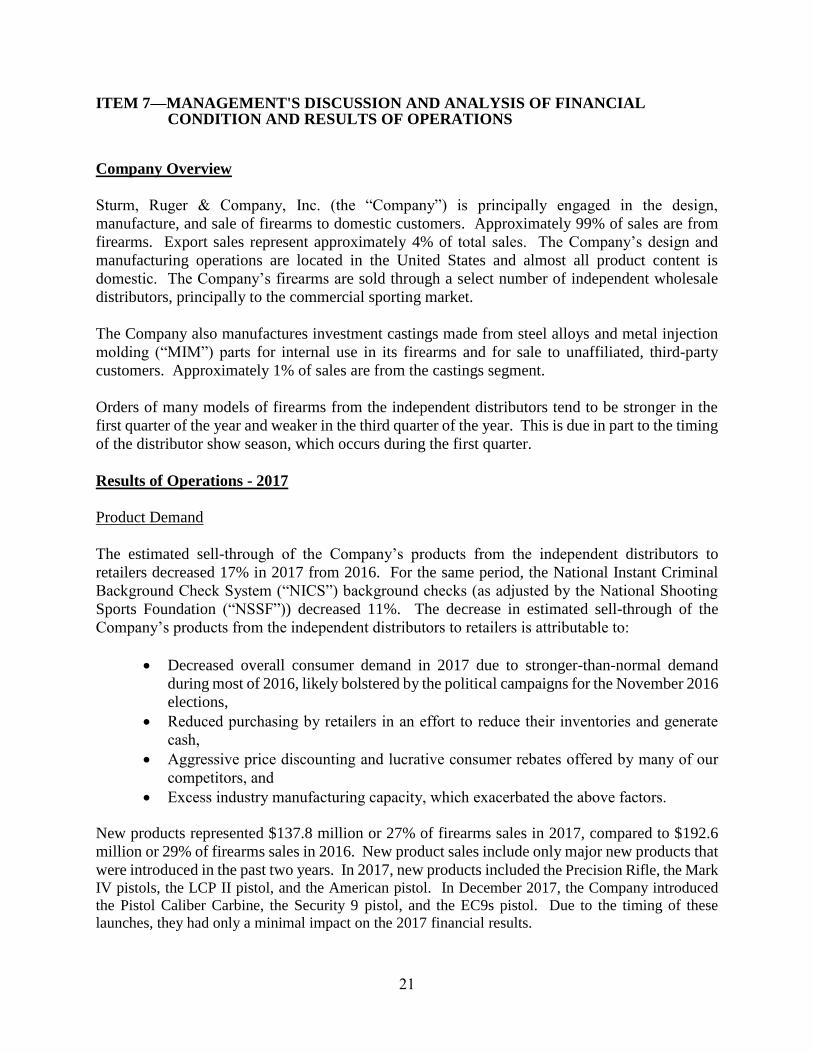
Company Overview
Sturm, Ruger & Company, Inc. (the “Company”) is principally engaged in the design,
manufacture, and sale of firearms to domestic customers. Approximately 99% of sales are from
firearms. Export sales represent approximately 4% of total sales. The Company’s design and
manufacturing operations are located in the United States and almost all product content is
domestic. The Company’s firearms are sold through a select number of independent wholesale
distributors, principally to the commercial sporting market.
The Company also manufactures investment castings made from steel alloys and metal injection
molding (“MIM”) parts for internal use in its firearms and for sale to unaffiliated, third-party
customers. Approximately 1% of sales are from the castings segment.
Orders of many models of firearms from the independent distributors tend to be stronger in the
first quarter of the year and weaker in the third quarter of the year. This is due in part to the timing
of the distributor show season, which occurs during the first quarter.
Results of Operations - 2017
Product Demand
The estimated sell-through of the Company’s products from the independent distributors to
retailers decreased 17% in 2017 from 2016. For the same period, the National Instant Criminal
Background Check System (“NICS”) background checks (as adjusted by the National Shooting
Sports Foundation (“NSSF”)) decreased 11%. The decrease in estimated sell-through of the
Company’s products from the independent distributors to retailers is attributable to:
Decreased overall consumer demand in 2017 due to stronger-than-normal demand
during most of 2016, likely bolstered by the political campaigns for the November 2016
elections,
Reduced purchasing by retailers in an effort to reduce their inventories and generate
cash,
Aggressive price discounting and lucrative consumer rebates offered by many of our
competitors, and
Excess industry manufacturing capacity, which exacerbated the above factors.
New products represented $137.8 million or 27% of firearms sales in 2017, compared to $192.6
million or 29% of firearms sales in 2016. New product sales include only major new products that
were introduced in the past two years. In 2017, new products included the Precision Rifle, the Mark
IV pistols, the LCP II pistol, and the American pistol. In December 2017, the Company introduced
the Pistol Caliber Carbine, the Security 9 pistol, and the EC9s pistol. Due to the timing of these
launches, they had only a minimal impact on the 2017 financial results.
22
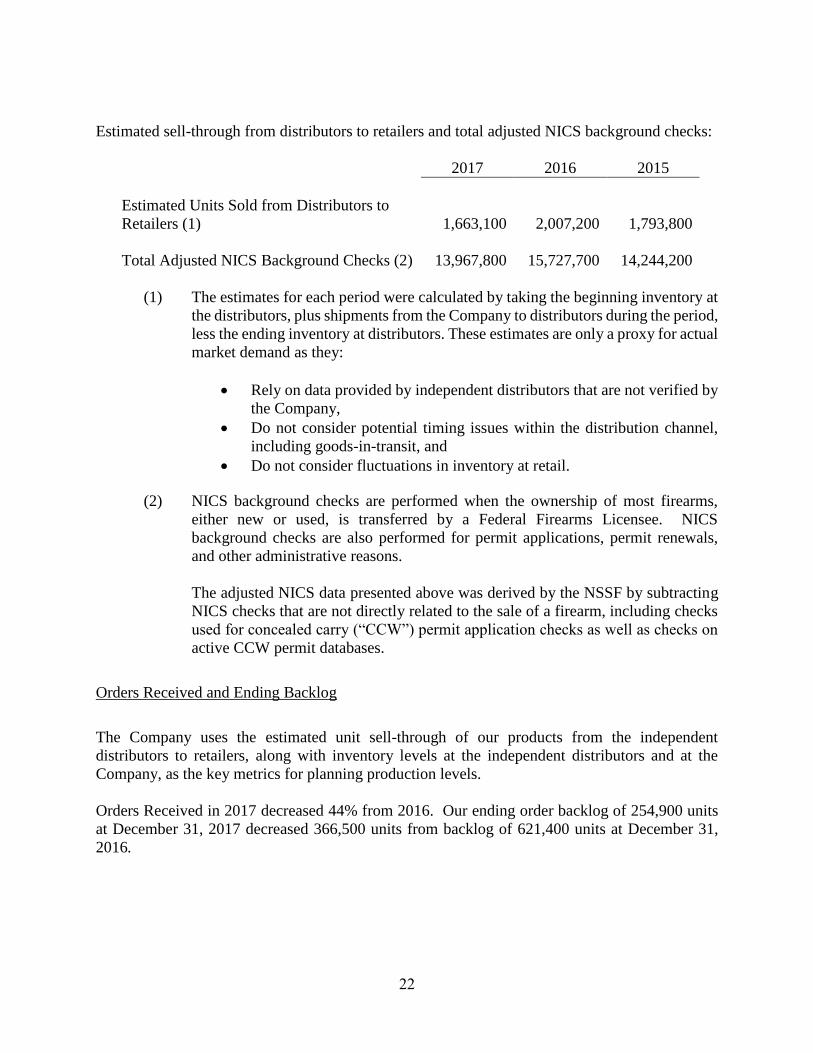
Estimated sell-through from distributors to retailers and total adjusted NICS background checks:
2017 2016 2015
Estimated Units Sold from Distributors to
Retailers (1)
1,663,100
2,007,200
1,793,800
Total Adjusted NICS Background Checks (2) 13,967,800 15,727,700 14,244,200
(1) The estimates for each period were calculated by taking the beginning inventory at
the distributors, plus shipments from the Company to distributors during the period,
less the ending inventory at distributors. These estimates are only a proxy for actual
market demand as they:
Rely on data provided by independent distributors that are not verified by
the Company,
Do not consider potential timing issues within the distribution channel,
including goods-in-transit, and
Do not consider fluctuations in inventory at retail.
(2) NICS background checks are performed when the ownership of most firearms,
either new or used, is transferred by a Federal Firearms Licensee. NICS
background checks are also performed for permit applications, permit renewals,
and other administrative reasons.
The adjusted NICS data presented above was derived by the NSSF by subtracting
NICS checks that are not directly related to the sale of a firearm, including checks
used for concealed carry (“CCW”) permit application checks as well as checks on
active CCW permit databases.
Orders Received and Ending Backlog
The Company uses the estimated unit sell-through of our products from the independent
distributors to retailers, along with inventory levels at the independent distributors and at the
Company, as the key metrics for planning production levels.
Orders Received in 2017 decreased 44% from 2016. Our ending order backlog of 254,900 units
at December 31, 2017 decreased 366,500 units from backlog of 621,400 units at December 31,
2016.
23
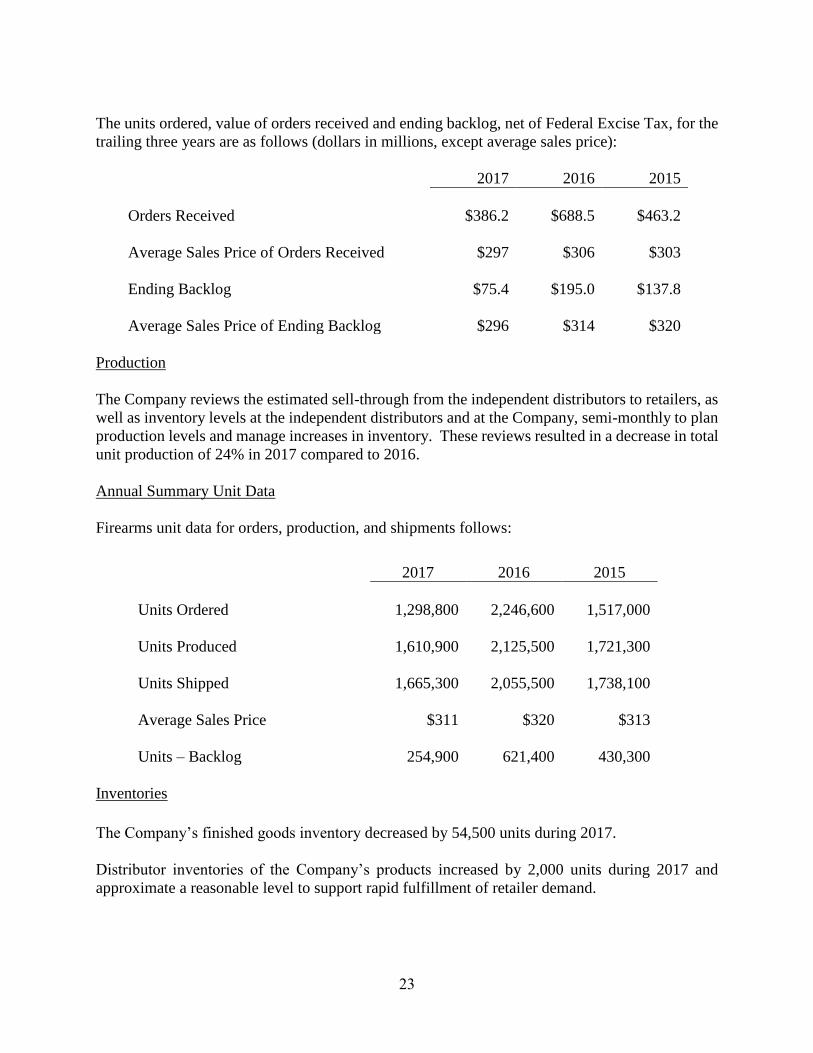
The units ordered, value of orders received and ending backlog, net of Federal Excise Tax, for the
trailing three years are as follows (dollars in millions, except average sales price):
2017 2016 2015
Orders Received $386.2 $688.5 $463.2
Average Sales Price of Orders Received $297 $306 $303
Ending Backlog $75.4 $195.0 $137.8
Average Sales Price of Ending Backlog $296 $314 $320
Production
The Company reviews the estimated sell-through from the independent distributors to retailers, as
well as inventory levels at the independent distributors and at the Company, semi-monthly to plan
production levels and manage increases in inventory. These reviews resulted in a decrease in total
unit production of 24% in 2017 compared to 2016.
Annual Summary Unit Data
Firearms unit data for orders, production, and shipments follows:
2017 2016 2015
Units Ordered 1,298,800 2,246,600 1,517,000
Units Produced 1,610,900 2,125,500 1,721,300
Units Shipped 1,665,300 2,055,500 1,738,100
Average Sales Price $311 $320 $313
Units – Backlog 254,900 621,400 430,300
Inventories
The Company’s finished goods inventory decreased by 54,500 units during 2017.
Distributor inventories of the Company’s products increased by 2,000 units during 2017 and
approximate a reasonable level to support rapid fulfillment of retailer demand.
24
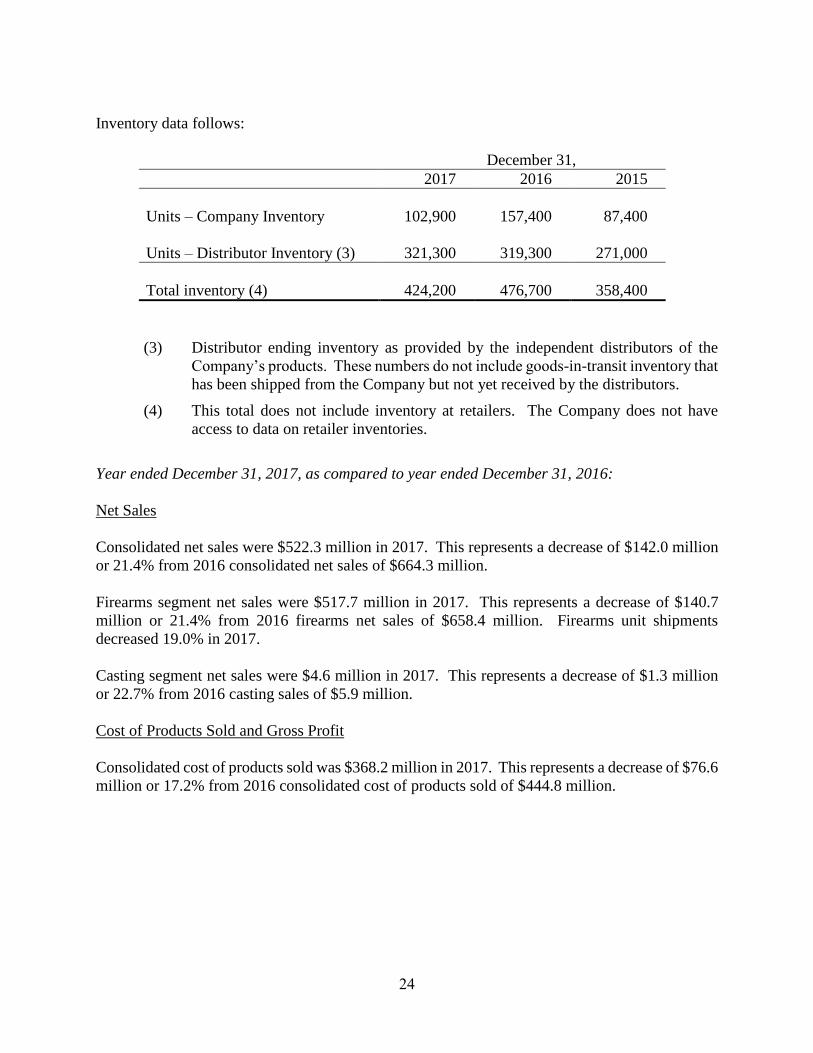
Inventory data follows:
December 31,
2017 2016 2015
Units – Company Inventory
102,900
157,400
87,400
Units – Distributor Inventory (3) 321,300 319,300 271,000
Total inventory (4) 424,200 476,700 358,400
(3) Distributor ending inventory as provided by the independent distributors of the
Company’s products. These numbers do not include goods-in-transit inventory that
has been shipped from the Company but not yet received by the distributors.
(4) This total does not include inventory at retailers. The Company does not have
access to data on retailer inventories.
Year ended December 31, 2017, as compared to year ended December 31, 2016:
Net Sales
Consolidated net sales were $522.3 million in 2017. This represents a decrease of $142.0 million
or 21.4% from 2016 consolidated net sales of $664.3 million.
Firearms segment net sales were $517.7 million in 2017. This represents a decrease of $140.7
million or 21.4% from 2016 firearms net sales of $658.4 million. Firearms unit shipments
decreased 19.0% in 2017.
Casting segment net sales were $4.6 million in 2017. This represents a decrease of $1.3 million
or 22.7% from 2016 casting sales of $5.9 million.
Cost of Products Sold and Gross Profit
Consolidated cost of products sold was $368.2 million in 2017. This represents a decrease of $76.6
million or 17.2% from 2016 consolidated cost of products sold of $444.8 million.
25
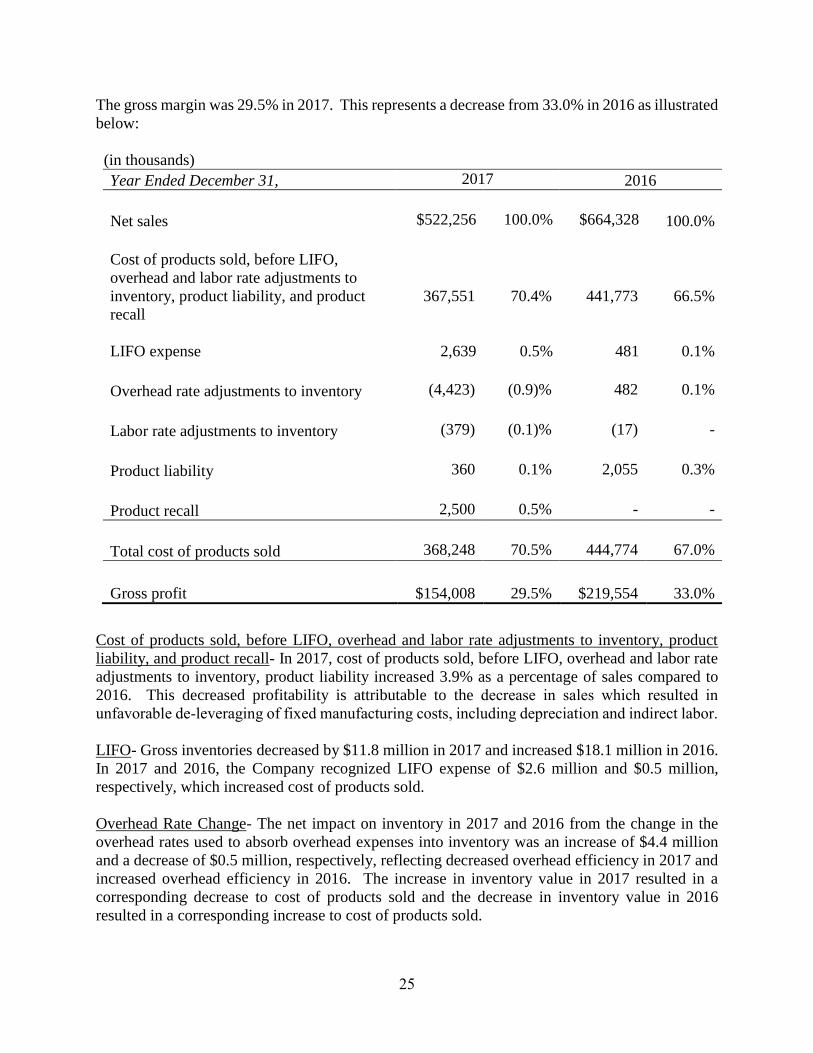
The gross margin was 29.5% in 2017. This represents a decrease from 33.0% in 2016 as illustrated
below:
(in thousands)
Year Ended December 31, 2017 2016
Net sales $522,256 100.0% $664,328 100.0%
Cost of products sold, before LIFO,
overhead and labor rate adjustments to
inventory, product liability, and product
recall
367,551
70.4%
441,773
66.5%
LIFO expense
2,639
0.5%
481
0.1%
Overhead rate adjustments to inventory (4,423) (0.9)% 482 0.1%
Labor rate adjustments to inventory (379) (0.1)% (17) -
Product liability 360 0.1% 2,055 0.3%
Product recall 2,500 0.5% - -
Total cost of products sold 368,248 70.5% 444,774 67.0%
Gross profit $154,008 29.5% $219,554 33.0%
Cost of products sold, before LIFO, overhead and labor rate adjustments to inventory, product
liability, and product recall- In 2017, cost of products sold, before LIFO, overhead and labor rate
adjustments to inventory, product liability increased 3.9% as a percentage of sales compared to
2016. This decreased profitability is attributable to the decrease in sales which resulted in
unfavorable de-leveraging of fixed manufacturing costs, including depreciation and indirect labor.
LIFO- Gross inventories decreased by $11.8 million in 2017 and increased $18.1 million in 2016.
In 2017 and 2016, the Company recognized LIFO expense of $2.6 million and $0.5 million,
respectively, which increased cost of products sold.
Overhead Rate Change- The net impact on inventory in 2017 and 2016 from the change in the
overhead rates used to absorb overhead expenses into inventory was an increase of $4.4 million
and a decrease of $0.5 million, respectively, reflecting decreased overhead efficiency in 2017 and
increased overhead efficiency in 2016. The increase in inventory value in 2017 resulted in a
corresponding decrease to cost of products sold and the decrease in inventory value in 2016
resulted in a corresponding increase to cost of products sold.
26
Labor Rate Adjustments- In 2017, the change in inventory value resulting from the change in the
labor rates used to absorb labor expenses into inventory was an increase of $0.4 million, reflecting
decreased labor efficiency. This increase in inventory value resulted in a corresponding decrease
to cost of products sold. In 2016, the change in inventory value resulting from the change in the
labor rates used to absorb labor expenses into inventory was de minimis.
Product Liability- This expense includes the cost of outside legal fees, insurance, and other
expenses incurred in the management and defense of product liability matters. These costs totaled
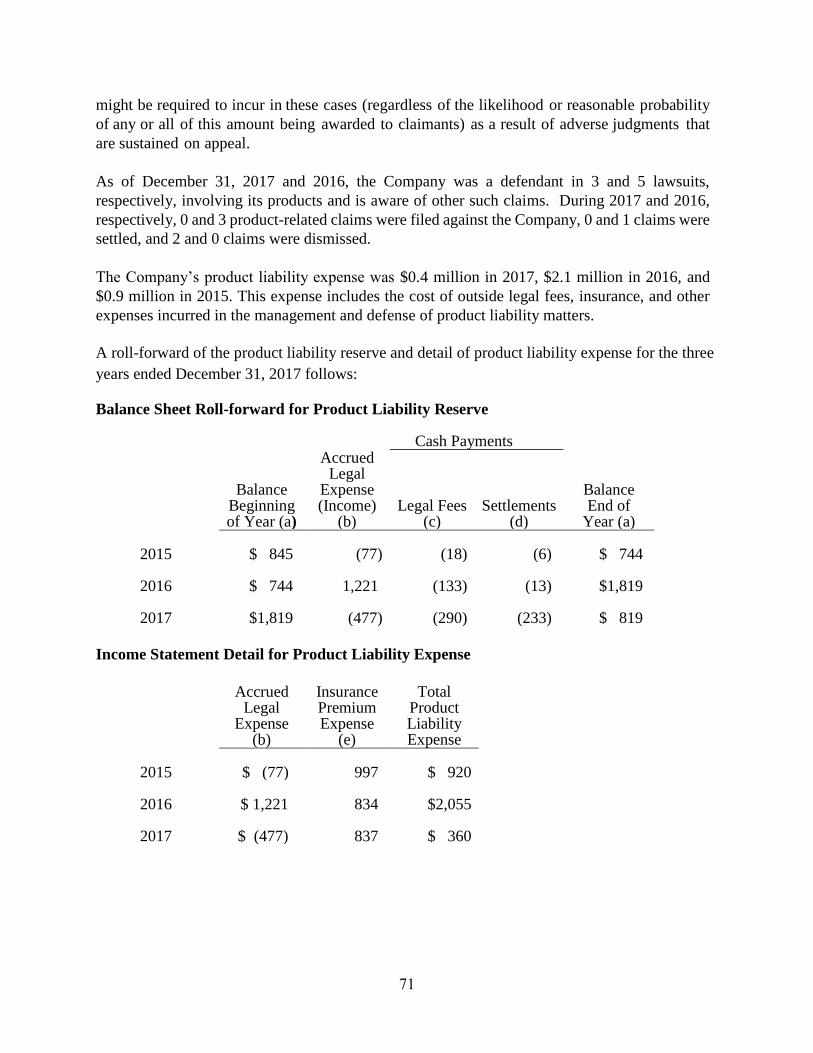
$0.4 million and $2.1 million in 2017 and 2016, respectively. See Note 17 in the notes to the
financial statements “Contingent Liabilities” for further discussion of the Company’s product
liability.
Product Recall – In June 2017, the Company discovered that Mark IV pistols manufactured prior
to June 1, 2017 had the potential to discharge unintentionally if the safety was not utilized
correctly. The Company recalled all Mark IV pistols and recorded a $2.5 million expense in the
second quarter, which is the expected total cost of the recall. No such expense was recorded in the
prior year.
Gross Profit- Gross profit was $154.0 million or 29.5% of sales in 2017. This is a decrease of
$65.6 million from 2016 gross profit of $219.6 million or 33.0% of sales in 2016.
Selling, General and Administrative
Selling, general and administrative expenses were $77.6 million in 2017, a decrease of $7.5 million
from $85.1 million in 2016, and an increase from 12.8% of sales in 2016 to 14.9% of sales in 2017.
The decrease is primarily attributable to the absence of the “2.5 Million Gun Challenge” and the
“Ruger $5 Million Match Challenge”, both of which were in effect in 2016. The decrease was
partially offset by increased firearms promotional activities in 2017.
Other Operating Income, net
Other operating income, net was de minimis in 2017 and 2016.
Operating Income
Operating income was $76.3 million or 14.6% of sales in 2017. This is a decrease of $58.1 million
from 2016 operating income of $134.4 million or 20.2% of sales.
Royalty Income
Royalty income was $0.5 million in 2017 and $1.1 million in 2016.
Interest Income and Interest Expense
Interest income and interest expense were negligible in 2017 and 2016.
27
Other Income, Net
Other income, net was $0.9 million in 2017, an increase of $0.4 million from income of $0.5
million in 2016.
Income Taxes and Net Income
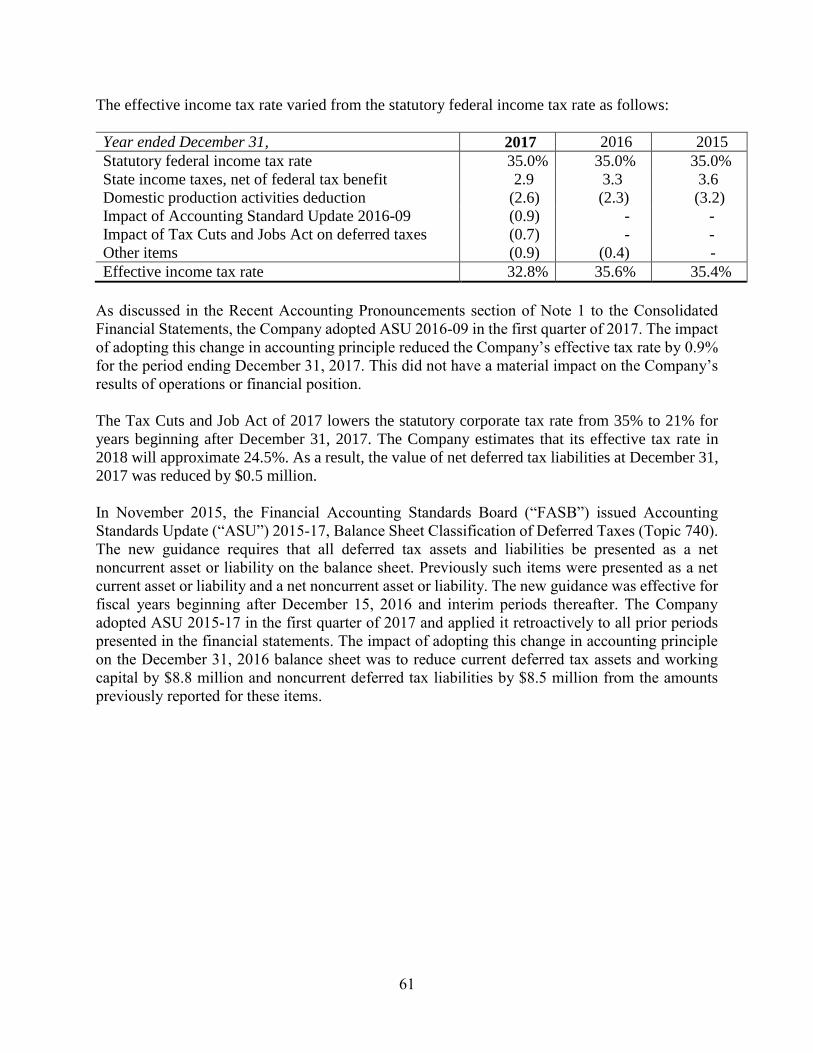
The effective income tax rate was 32.8% in 2017 and 35.6% in 2016. The decrease in the effective
tax rate in 2017 is primarily attributable to:
the inclusion of the tax impact of 2017 equity-based compensation in income taxes, as
required by newly issued Accounting Standards Update (ASU) 2016-09, “Improvements
to Employee Share Based Payment Accounting”, which reduced the effective tax rate by
0.9%. In the prior year, the tax impact of equity-based compensation was recorded directly
into equity, and
The revaluation of the Company’s net deferred tax liability at December 31, 2017 to reflect
the impact of the lower statutory corporate tax rate enacted by the “Tax Cuts and Jobs
Act”, which reduced the effective tax rate by 0.7%.
The effective tax rate is expected to decrease to 24.5% in 2018 principally due to the “2017 Tax
Cuts and Jobs Act” which reduces the Federal corporate income tax rate to 21% beginning in 2018.
As a result of the foregoing factors, consolidated net income was $52.1 million in 2017. This
represents a decrease of $35.4 million from 2016 consolidated net income of $87.5 million.
Non-GAAP Financial Measure
In an effort to provide investors with additional information regarding its results, the Company
refers to various United States generally accepted accounting principles (“GAAP”) financial
measures and one non-GAAP financial measure, EBITDA, which management believes provides
useful information to investors. This non-GAAP measure may not be comparable to similarly
titled measures being disclosed by other companies. In addition, the Company believes that the
non-GAAP financial measure should be considered in addition to, and not in lieu of, GAAP
financial measures. The Company believes that EBITDA is useful to understanding its operating
results and the ongoing performance of its underlying business, as EBITDA provides information
on the Company’s ability to meet its capital expenditure and working capital requirements, and is
also an indicator of profitability. The Company believes that this reporting provides better
transparency and comparability to its operating results. The Company uses both GAAP and non-
GAAP financial measures to evaluate the Company’s financial performance.
28
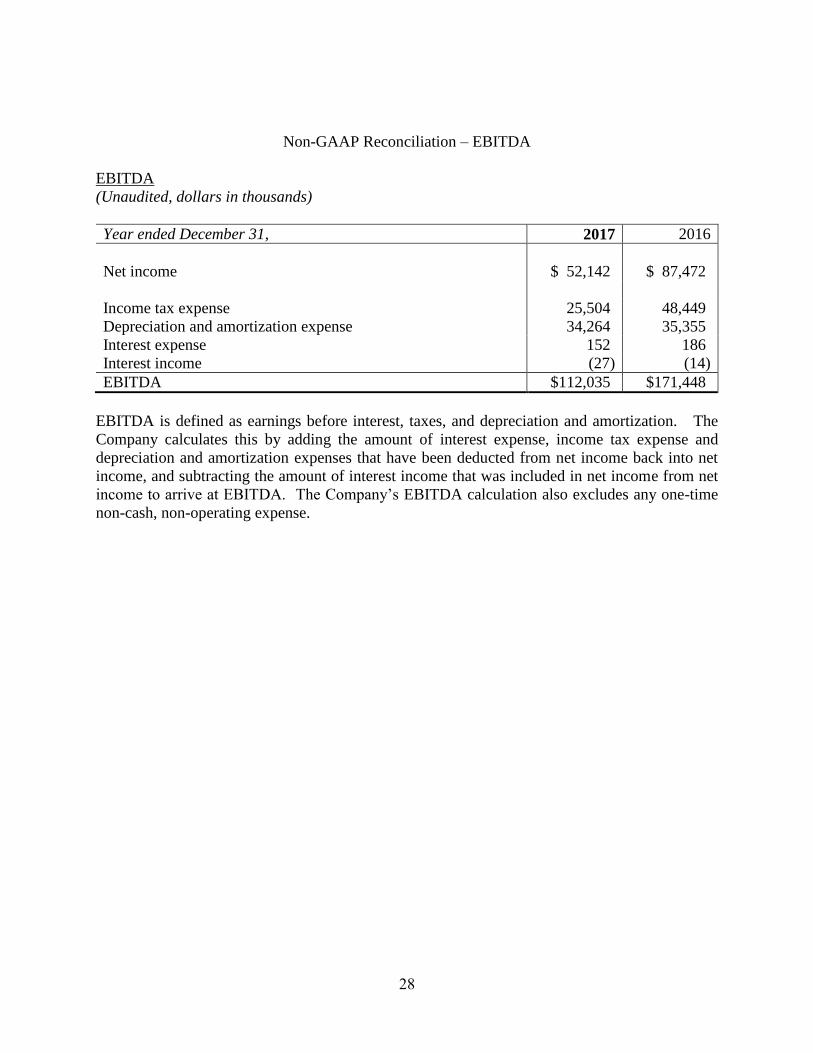
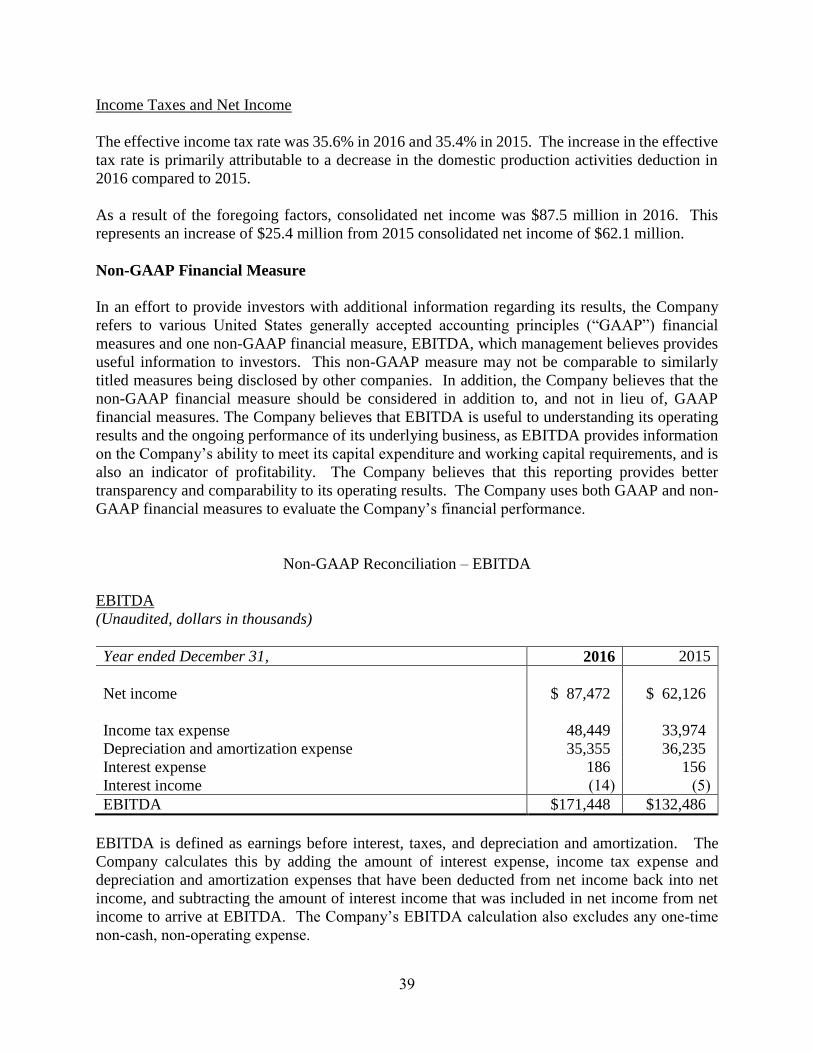
Non-GAAP Reconciliation – EBITDA
EBITDA
(Unaudited, dollars in thousands)
Year ended December 31, 2017 2016
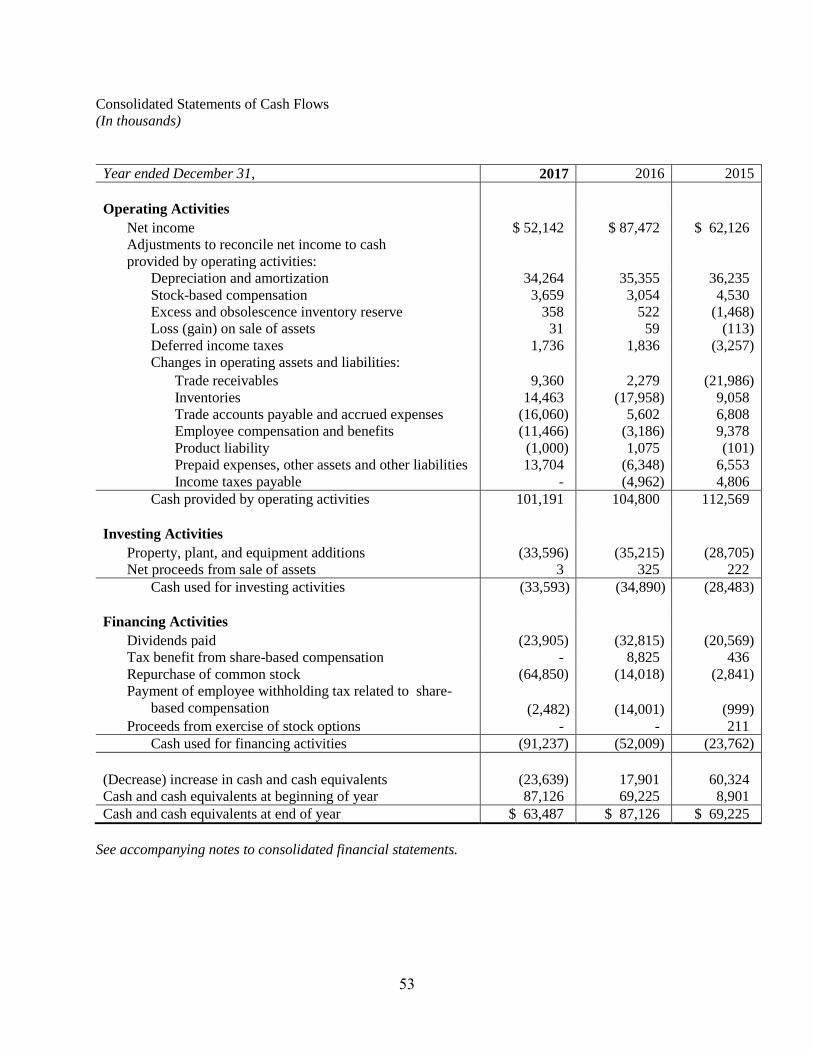
Net income $ 52,142 $ 87,472
Income tax expense 25,504 48,449
Depreciation and amortization expense 34,264 35,355
Interest expense 152 186
Interest income (27) (14)
EBITDA $112,035 $171,448
EBITDA is defined as earnings before interest, taxes, and depreciation and amortization. The
Company calculates this by adding the amount of interest expense, income tax expense and
depreciation and amortization expenses that have been deducted from net income back into net
income, and subtracting the amount of interest income that was included in net income from net
income to arrive at EBITDA. The Company’s EBITDA calculation also excludes any one-time
non-cash, non-operating expense.
29
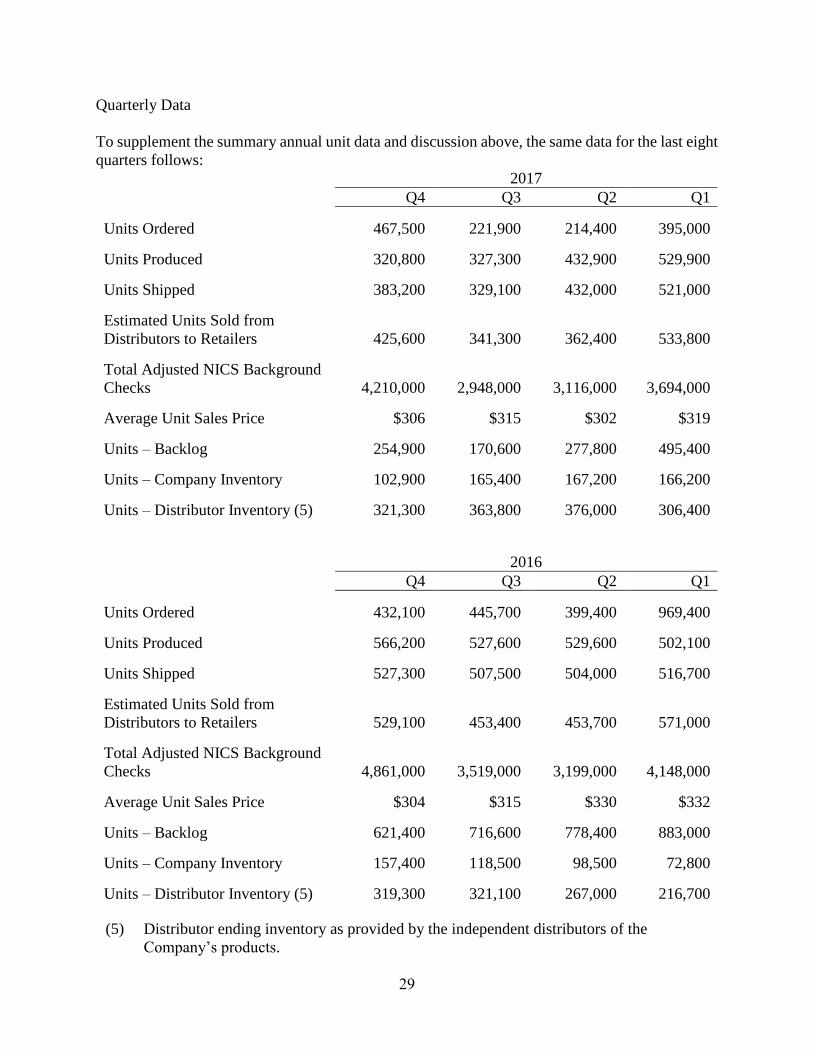
Quarterly Data
To supplement the summary annual unit data and discussion above, the same data for the last eight
quarters follows:
2017
Q4 Q3 Q2 Q1
Units Ordered 467,500 221,900 214,400 395,000
Units Produced 320,800 327,300 432,900 529,900
Units Shipped 383,200 329,100 432,000 521,000
Estimated Units Sold from
Distributors to Retailers
425,600
341,300
362,400
533,800
Total Adjusted NICS Background
Checks
4,210,000
2,948,000
3,116,000
3,694,000
Average Unit Sales Price $306 $315 $302 $319
Units – Backlog 254,900 170,600 277,800 495,400
Units – Company Inventory 102,900 165,400 167,200 166,200
Units – Distributor Inventory (5) 321,300 363,800 376,000 306,400
2016
Q4 Q3 Q2 Q1
Units Ordered 432,100 445,700 399,400 969,400
Units Produced 566,200 527,600 529,600 502,100
Units Shipped 527,300 507,500 504,000 516,700
Estimated Units Sold from
Distributors to Retailers
529,100
453,400
453,700
571,000
Total Adjusted NICS Background
Checks
4,861,000
3,519,000
3,199,000
4,148,000
Average Unit Sales Price $304 $315 $330 $332
Units – Backlog 621,400 716,600 778,400 883,000
Units – Company Inventory 157,400 118,500 98,500 72,800
Units – Distributor Inventory (5) 319,300 321,100 267,000 216,700
(5) Distributor ending inventory as provided by the independent distributors of the
Company’s products.
30
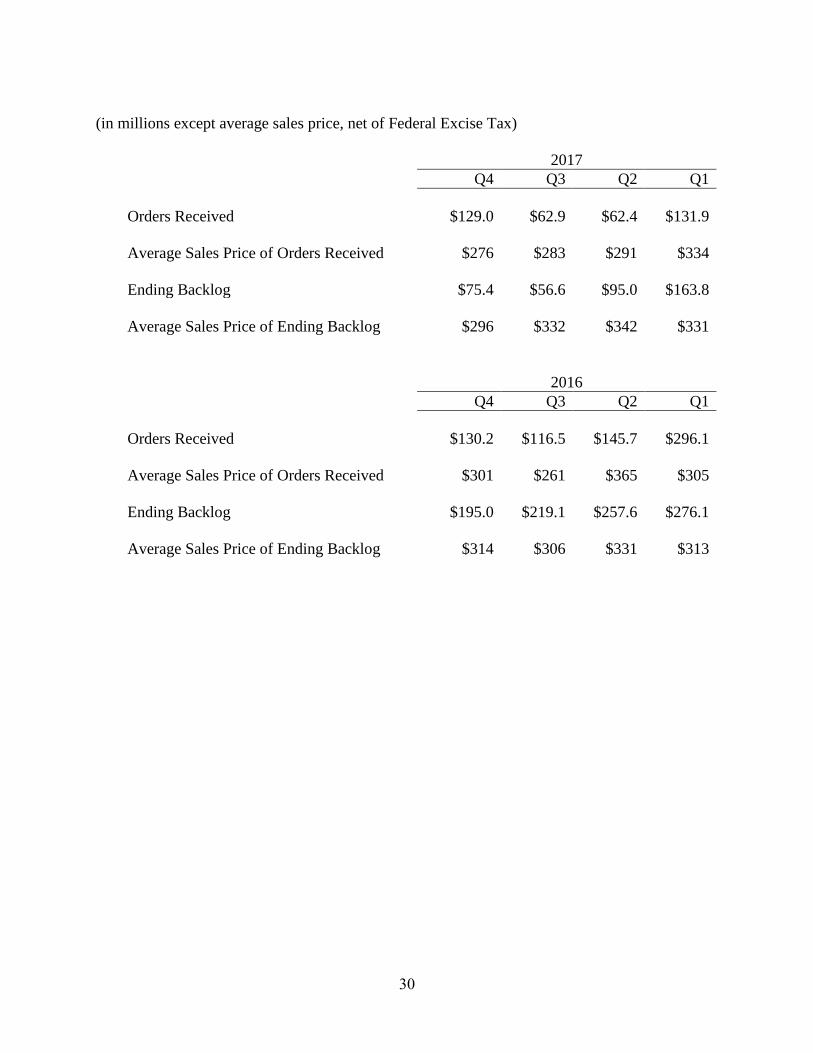
(in millions except average sales price, net of Federal Excise Tax)
2017
Q4 Q3 Q2 Q1
Orders Received $129.0 $62.9 $62.4 $131.9
Average Sales Price of Orders Received $276 $283 $291 $334
Ending Backlog $75.4 $56.6 $95.0 $163.8
Average Sales Price of Ending Backlog $296 $332 $342 $331
2016
Q4 Q3 Q2 Q1
Orders Received $130.2 $116.5 $145.7 $296.1
Average Sales Price of Orders Received $301 $261 $365 $305
Ending Backlog $195.0 $219.1 $257.6 $276.1
Average Sales Price of Ending Backlog $314 $306 $331 $313
31
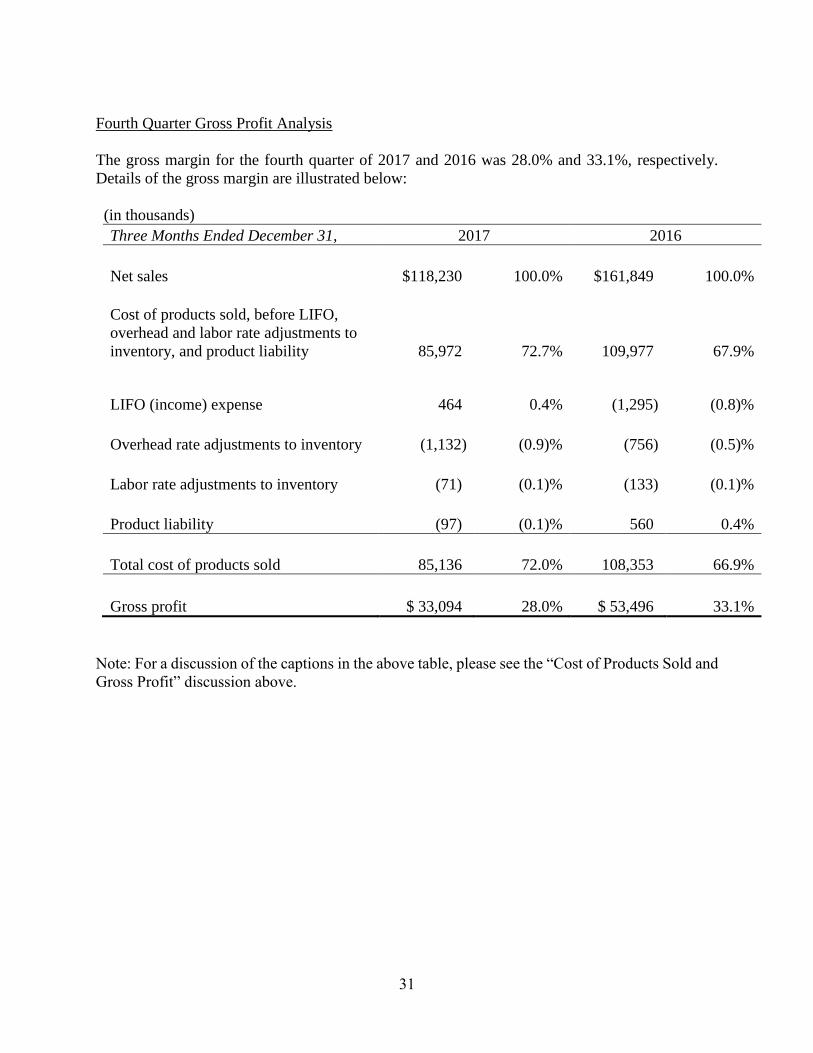
Fourth Quarter Gross Profit Analysis
The gross margin for the fourth quarter of 2017 and 2016 was 28.0% and 33.1%, respectively.
Details of the gross margin are illustrated below:
(in thousands)
Three Months Ended December 31, 2017 2016
Net sales $118,230 100.0% $161,849 100.0%
Cost of products sold, before LIFO,
overhead and labor rate adjustments to
inventory, and product liability 85,972 72.7% 109,977 67.9%
LIFO (income) expense 464 0.4% (1,295) (0.8)%
Overhead rate adjustments to inventory (1,132) (0.9)% (756) (0.5)%
Labor rate adjustments to inventory (71) (0.1)% (133) (0.1)%
Product liability (97) (0.1)% 560 0.4%
Total cost of products sold 85,136 72.0% 108,353 66.9%
Gross profit $ 33,094 28.0% $ 53,496 33.1%
Note: For a discussion of the captions in the above table, please see the “Cost of Products Sold and
Gross Profit” discussion above.
32
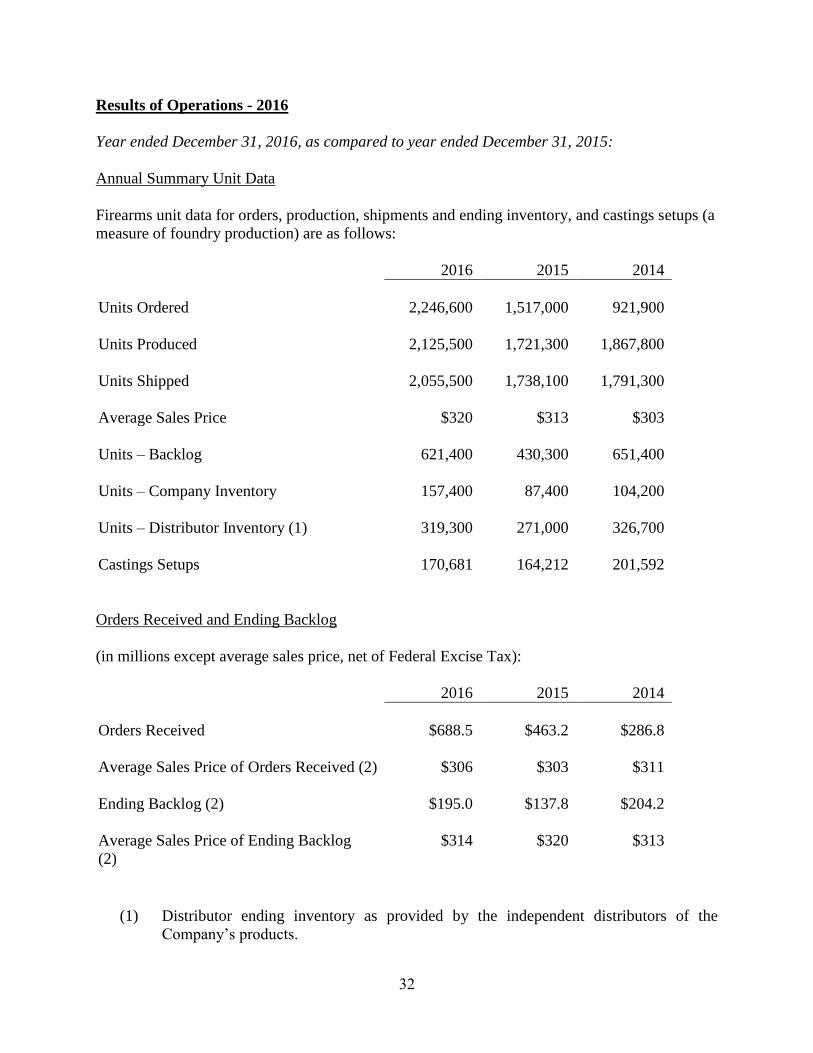
Results of Operations - 2016
Year ended December 31, 2016, as compared to year ended December 31, 2015:
Annual Summary Unit Data
Firearms unit data for orders, production, shipments and ending inventory, and castings setups (a
measure of foundry production) are as follows:
2016 2015 2014
Units Ordered 2,246,600 1,517,000 921,900
Units Produced 2,125,500 1,721,300 1,867,800
Units Shipped 2,055,500 1,738,100 1,791,300
Average Sales Price $320 $313 $303
Units – Backlog 621,400 430,300 651,400
Units – Company Inventory 157,400 87,400 104,200
Units – Distributor Inventory (1) 319,300 271,000 326,700
Castings Setups 170,681 164,212 201,592
Orders Received and Ending Backlog
(in millions except average sales price, net of Federal Excise Tax):
2016 2015 2014
Orders Received $688.5 $463.2 $286.8
Average Sales Price of Orders Received (2) $306 $303 $311
Ending Backlog (2) $195.0 $137.8 $204.2
Average Sales Price of Ending Backlog
(2)
$314 $320 $313
(1) Distributor ending inventory as provided by the independent distributors of the
Company’s products.
33
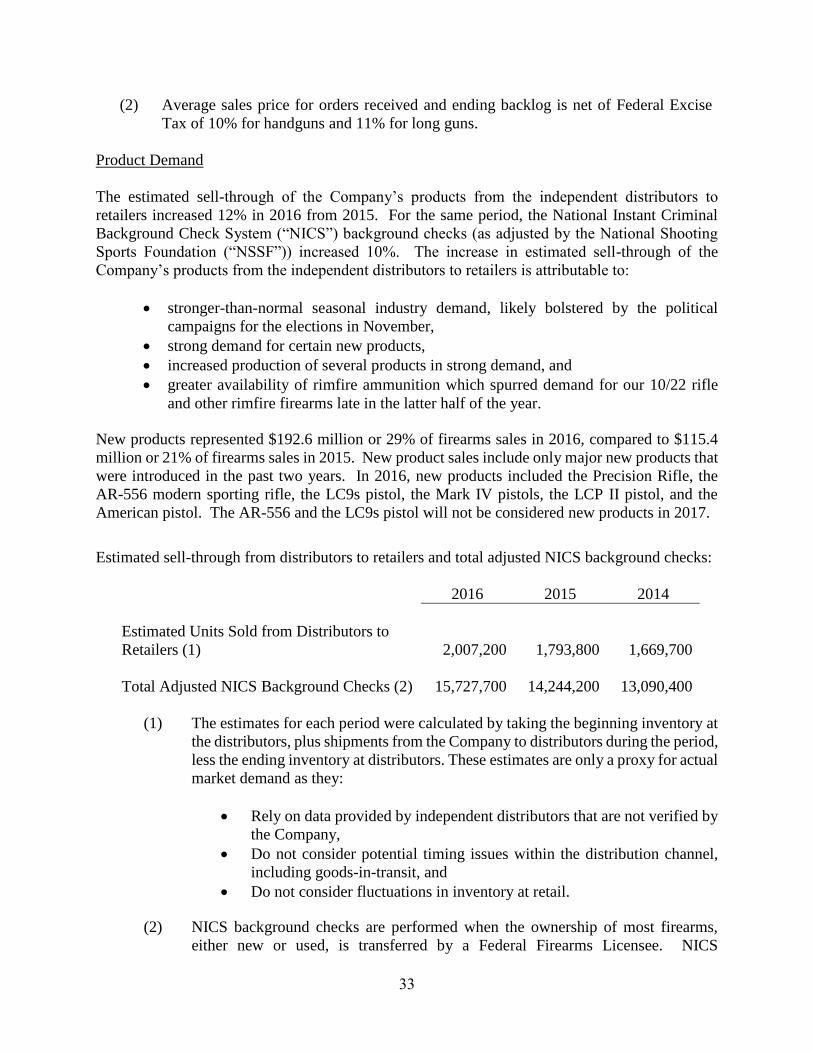
(2) Average sales price for orders received and ending backlog is net of Federal Excise
Tax of 10% for handguns and 11% for long guns.
Product Demand
The estimated sell-through of the Company’s products from the independent distributors to
retailers increased 12% in 2016 from 2015. For the same period, the National Instant Criminal
Background Check System (“NICS”) background checks (as adjusted by the National Shooting
Sports Foundation (“NSSF”)) increased 10%. The increase in estimated sell-through of the
Company’s products from the independent distributors to retailers is attributable to:
stronger-than-normal seasonal industry demand, likely bolstered by the political
campaigns for the elections in November,
strong demand for certain new products,
increased production of several products in strong demand, and
greater availability of rimfire ammunition which spurred demand for our 10/22 rifle
and other rimfire firearms late in the latter half of the year.
New products represented $192.6 million or 29% of firearms sales in 2016, compared to $115.4
million or 21% of firearms sales in 2015. New product sales include only major new products that
were introduced in the past two years. In 2016, new products included the Precision Rifle, the
AR-556 modern sporting rifle, the LC9s pistol, the Mark IV pistols, the LCP II pistol, and the
American pistol. The AR-556 and the LC9s pistol will not be considered new products in 2017.
Estimated sell-through from distributors to retailers and total adjusted NICS background checks:
2016 2015 2014
Estimated Units Sold from Distributors to
Retailers (1)
2,007,200
1,793,800
1,669,700
Total Adjusted NICS Background Checks (2) 15,727,700 14,244,200 13,090,400
(1) The estimates for each period were calculated by taking the beginning inventory at
the distributors, plus shipments from the Company to distributors during the period,
less the ending inventory at distributors. These estimates are only a proxy for actual
market demand as they:
Rely on data provided by independent distributors that are not verified by
the Company,
Do not consider potential timing issues within the distribution channel,
including goods-in-transit, and
Do not consider fluctuations in inventory at retail.
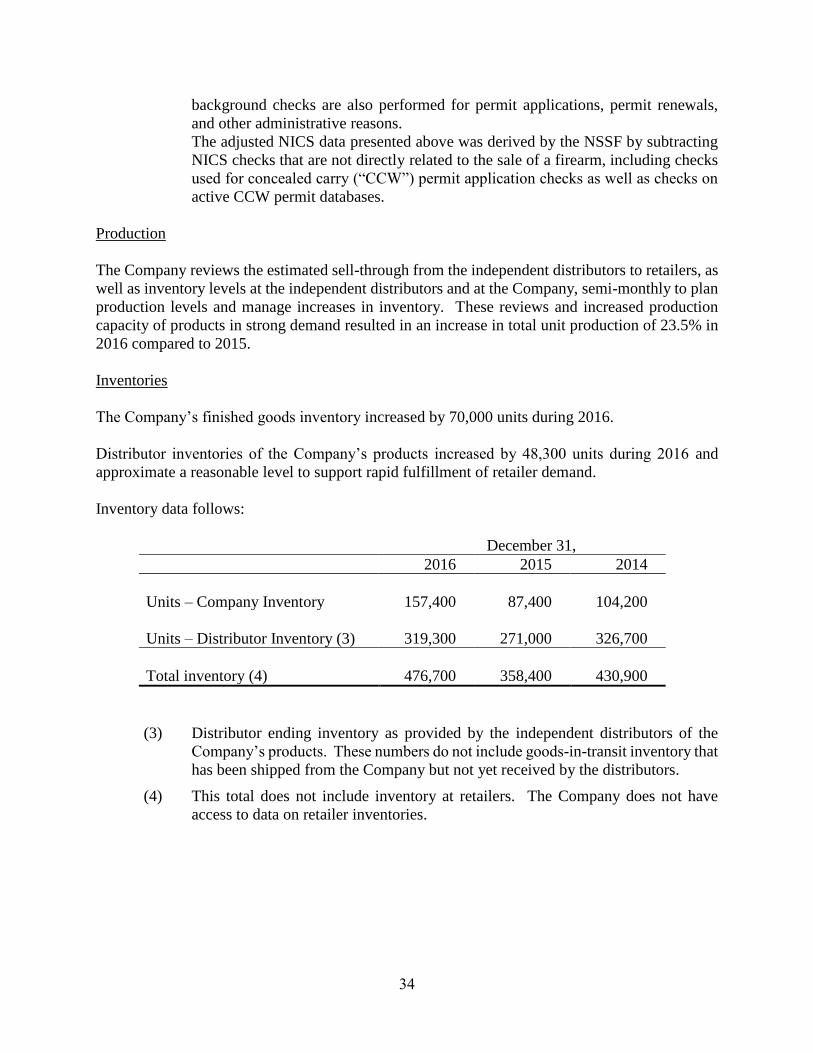
(2) NICS background checks are performed when the ownership of most firearms,
either new or used, is transferred by a Federal Firearms Licensee. NICS
34
background checks are also performed for permit applications, permit renewals,
and other administrative reasons.
The adjusted NICS data presented above was derived by the NSSF by subtracting
NICS checks that are not directly related to the sale of a firearm, including checks
used for concealed carry (“CCW”) permit application checks as well as checks on
active CCW permit databases.
Production
The Company reviews the estimated sell-through from the independent distributors to retailers, as
well as inventory levels at the independent distributors and at the Company, semi-monthly to plan
production levels and manage increases in inventory. These reviews and increased production
capacity of products in strong demand resulted in an increase in total unit production of 23.5% in
2016 compared to 2015.
Inventories
The Company’s finished goods inventory increased by 70,000 units during 2016.
Distributor inventories of the Company’s products increased by 48,300 units during 2016 and
approximate a reasonable level to support rapid fulfillment of retailer demand.
Inventory data follows:
December 31,
2016 2015 2014
Units – Company Inventory
157,400
87,400
104,200
Units – Distributor Inventory (3) 319,300 271,000 326,700
Total inventory (4) 476,700 358,400 430,900
(3) Distributor ending inventory as provided by the independent distributors of the
Company’s products. These numbers do not include goods-in-transit inventory that
has been shipped from the Company but not yet received by the distributors.
(4) This total does not include inventory at retailers. The Company does not have
access to data on retailer inventories.
35
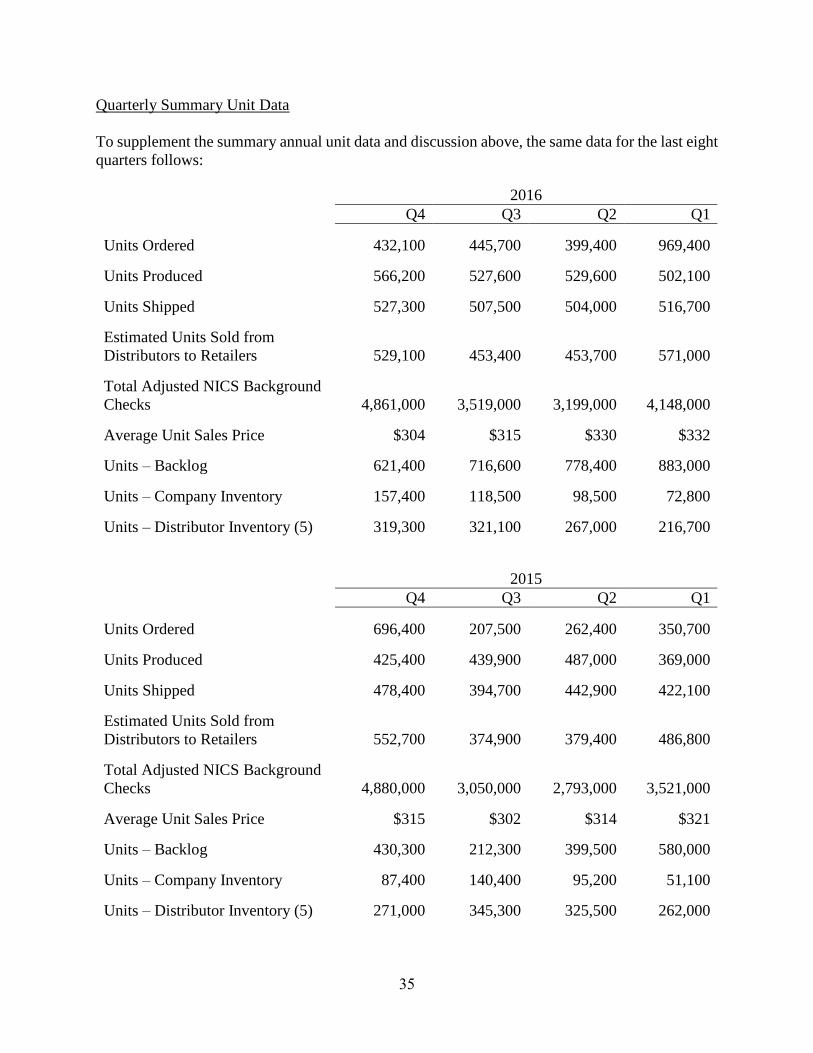
Quarterly Summary Unit Data
To supplement the summary annual unit data and discussion above, the same data for the last eight
quarters follows:
2016
Q4 Q3 Q2 Q1
Units Ordered 432,100 445,700 399,400 969,400
Units Produced 566,200 527,600 529,600 502,100
Units Shipped 527,300 507,500 504,000 516,700
Estimated Units Sold from
Distributors to Retailers
529,100
453,400
453,700
571,000
Total Adjusted NICS Background
Checks
4,861,000
3,519,000
3,199,000
4,148,000
Average Unit Sales Price $304 $315 $330 $332
Units – Backlog 621,400 716,600 778,400 883,000
Units – Company Inventory 157,400 118,500 98,500 72,800
Units – Distributor Inventory (5) 319,300 321,100 267,000 216,700
2015
Q4 Q3 Q2 Q1
Units Ordered 696,400 207,500 262,400 350,700
Units Produced 425,400 439,900 487,000 369,000
Units Shipped 478,400 394,700 442,900 422,100
Estimated Units Sold from
Distributors to Retailers
552,700
374,900
379,400
486,800
Total Adjusted NICS Background
Checks
4,880,000
3,050,000
2,793,000
3,521,000
Average Unit Sales Price $315 $302 $314 $321
Units – Backlog 430,300 212,300 399,500 580,000
Units – Company Inventory 87,400 140,400 95,200 51,100
Units – Distributor Inventory (5) 271,000 345,300 325,500 262,000
36
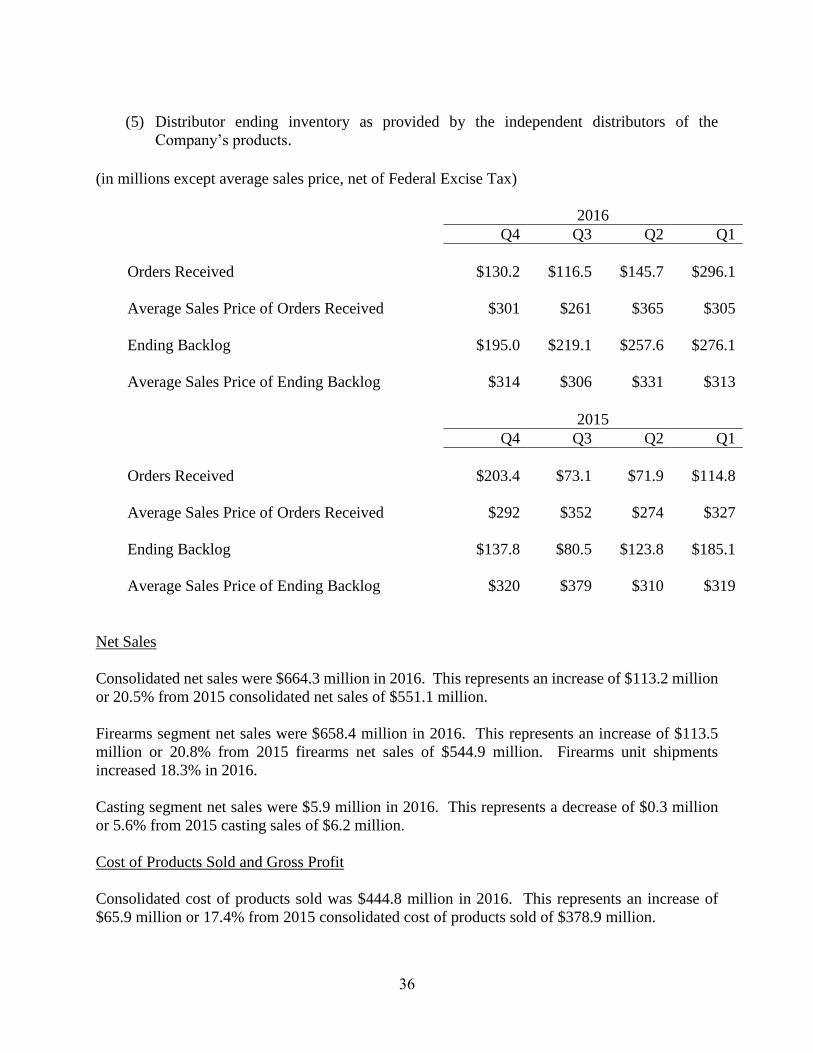
(5) Distributor ending inventory as provided by the independent distributors of the
Company’s products.
(in millions except average sales price, net of Federal Excise Tax)
2016
Q4 Q3 Q2 Q1
Orders Received $130.2 $116.5 $145.7 $296.1
Average Sales Price of Orders Received $301 $261 $365 $305
Ending Backlog $195.0 $219.1 $257.6 $276.1
Average Sales Price of Ending Backlog $314 $306 $331 $313
2015
Q4 Q3 Q2 Q1
Orders Received $203.4 $73.1 $71.9 $114.8
Average Sales Price of Orders Received $292 $352 $274 $327
Ending Backlog $137.8 $80.5 $123.8 $185.1
Average Sales Price of Ending Backlog $320 $379 $310 $319
Net Sales
Consolidated net sales were $664.3 million in 2016. This represents an increase of $113.2 million
or 20.5% from 2015 consolidated net sales of $551.1 million.
Firearms segment net sales were $658.4 million in 2016. This represents an increase of $113.5
million or 20.8% from 2015 firearms net sales of $544.9 million. Firearms unit shipments
increased 18.3% in 2016.
Casting segment net sales were $5.9 million in 2016. This represents a decrease of $0.3 million
or 5.6% from 2015 casting sales of $6.2 million.
Cost of Products Sold and Gross Profit
Consolidated cost of products sold was $444.8 million in 2016. This represents an increase of
$65.9 million or 17.4% from 2015 consolidated cost of products sold of $378.9 million.
37
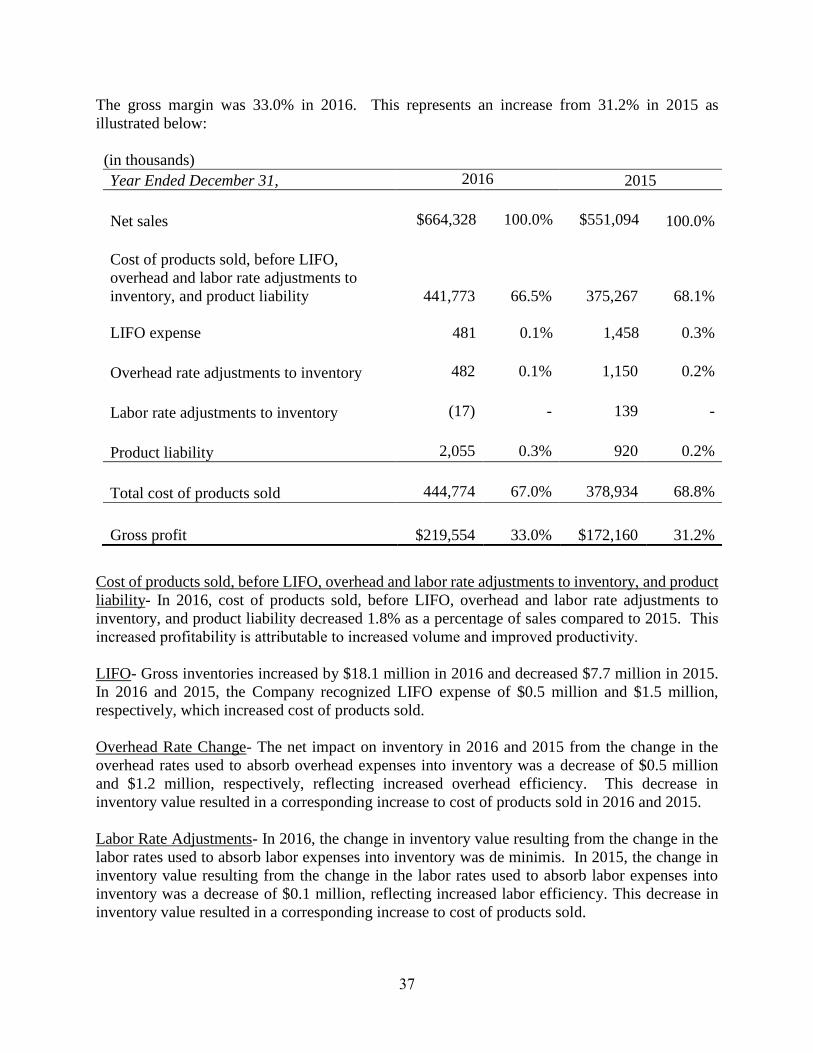
The gross margin was 33.0% in 2016. This represents an increase from 31.2% in 2015 as
illustrated below:
(in thousands)
Year Ended December 31, 2016 2015
Net sales $664,328 100.0% $551,094 100.0%
Cost of products sold, before LIFO,
overhead and labor rate adjustments to
inventory, and product liability
441,773
66.5%
375,267
68.1%
LIFO expense
481
0.1%
1,458
0.3%
Overhead rate adjustments to inventory 482 0.1% 1,150 0.2%
Labor rate adjustments to inventory (17) - 139 -
Product liability 2,055 0.3% 920 0.2%
Total cost of products sold 444,774 67.0% 378,934 68.8%
Gross profit $219,554 33.0% $172,160 31.2%
Cost of products sold, before LIFO, overhead and labor rate adjustments to inventory, and product
liability- In 2016, cost of products sold, before LIFO, overhead and labor rate adjustments to
inventory, and product liability decreased 1.8% as a percentage of sales compared to 2015. This
increased profitability is attributable to increased volume and improved productivity.
LIFO- Gross inventories increased by $18.1 million in 2016 and decreased $7.7 million in 2015.
In 2016 and 2015, the Company recognized LIFO expense of $0.5 million and $1.5 million,
respectively, which increased cost of products sold.
Overhead Rate Change- The net impact on inventory in 2016 and 2015 from the change in the
overhead rates used to absorb overhead expenses into inventory was a decrease of $0.5 million
and $1.2 million, respectively, reflecting increased overhead efficiency. This decrease in
inventory value resulted in a corresponding increase to cost of products sold in 2016 and 2015.
Labor Rate Adjustments- In 2016, the change in inventory value resulting from the change in the
labor rates used to absorb labor expenses into inventory was de minimis. In 2015, the change in
inventory value resulting from the change in the labor rates used to absorb labor expenses into
inventory was a decrease of $0.1 million, reflecting increased labor efficiency. This decrease in
inventory value resulted in a corresponding increase to cost of products sold.
38
Product Liability- This expense includes the cost of outside legal fees, insurance, and other
expenses incurred in the management and defense of product liability matters. These costs totaled
$2.1 million and $0.9 million in 2016 and 2015, respectively. See Note 17 in the notes to the
financial statements “Contingent Liabilities” for further discussion of the Company’s product
liability.
Gross Profit- Gross profit was $219.6 million or 33.0% of sales in 2016. This is an increase of
$47.4 million from 2015 gross profit of $172.2 million or 31.2% of sales in 2015.
Selling, General and Administrative
Selling, general and administrative expenses were $85.1 million in 2016, an increase of $7.4
million from $77.7 million in 2015, and a decrease from 14.1% of sales in 2015 to 12.8% of sales
in 2016. The increase in selling, general and administrative expenses is primarily attributable to
increased promotional selling expenses, including the “Ruger $5 Million Match Challenge” and the
“2.5 Million Gun Challenge” in 2016.
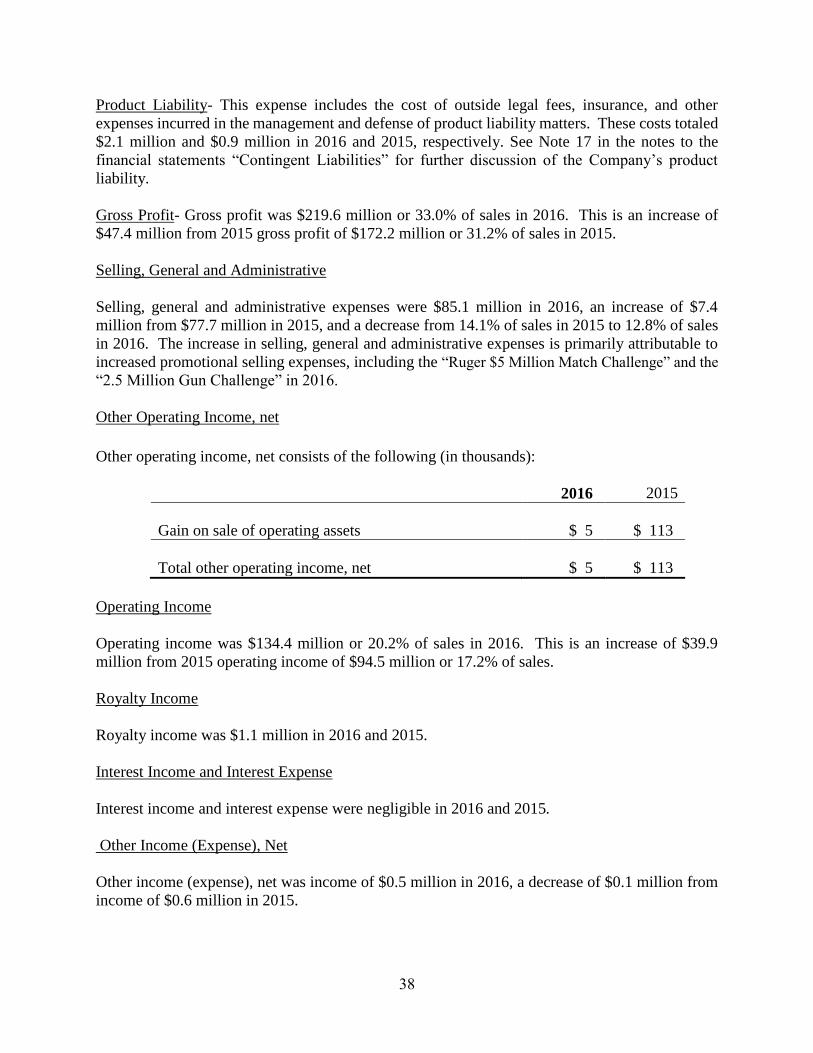
Other Operating Income, net
Other operating income, net consists of the following (in thousands):
2016 2015
Gain on sale of operating assets $ 5 $ 113
Total other operating income, net $ 5 $ 113
Operating Income
Operating income was $134.4 million or 20.2% of sales in 2016. This is an increase of $39.9
million from 2015 operating income of $94.5 million or 17.2% of sales.
Royalty Income
Royalty income was $1.1 million in 2016 and 2015.
Interest Income and Interest Expense
Interest income and interest expense were negligible in 2016 and 2015.
Other Income (Expense), Net
Other income (expense), net was income of $0.5 million in 2016, a decrease of $0.1 million from
income of $0.6 million in 2015.
39
Income Taxes and Net Income
The effective income tax rate was 35.6% in 2016 and 35.4% in 2015. The increase in the effective
tax rate is primarily attributable to a decrease in the domestic production activities deduction in
2016 compared to 2015.
As a result of the foregoing factors, consolidated net income was $87.5 million in 2016. This
represents an increase of $25.4 million from 2015 consolidated net income of $62.1 million.
Non-GAAP Financial Measure
In an effort to provide investors with additional information regarding its results, the Company
refers to various United States generally accepted accounting principles (“GAAP”) financial
measures and one non-GAAP financial measure, EBITDA, which management believes provides
useful information to investors. This non-GAAP measure may not be comparable to similarly
titled measures being disclosed by other companies. In addition, the Company believes that the
non-GAAP financial measure should be considered in addition to, and not in lieu of, GAAP
financial measures. The Company believes that EBITDA is useful to understanding its operating
results and the ongoing performance of its underlying business, as EBITDA provides information
on the Company’s ability to meet its capital expenditure and working capital requirements, and is
also an indicator of profitability. The Company believes that this reporting provides better
transparency and comparability to its operating results. The Company uses both GAAP and non-
GAAP financial measures to evaluate the Company’s financial performance.
Non-GAAP Reconciliation – EBITDA
EBITDA
(Unaudited, dollars in thousands)
Year ended December 31, 2016 2015
Net income $ 87,472 $ 62,126
Income tax expense 48,449 33,974
Depreciation and amortization expense 35,355 36,235
Interest expense 186 156
Interest income (14) (5)
EBITDA $171,448 $132,486
EBITDA is defined as earnings before interest, taxes, and depreciation and amortization. The
Company calculates this by adding the amount of interest expense, income tax expense and
depreciation and amortization expenses that have been deducted from net income back into net
income, and subtracting the amount of interest income that was included in net income from net
income to arrive at EBITDA. The Company’s EBITDA calculation also excludes any one-time
non-cash, non-operating expense.
40
Financial Condition
Liquidity
At December 31, 2017, the Company had cash and cash equivalents of $63.5 million. Our pre-
LIFO working capital of $159.3 million, less the LIFO reserve of $45.2 million, resulted in
working capital of $114.1 million and a current ratio of 3.2 to 1.
Operations
Cash provided by operating activities was $101.2 million, $104.8 million, and $112.6 million in
2017, 2016, and 2015, respectively. The decrease in cash provided in 2017 compared to 2016 is
attributable to decreased profitability, partially offset by a decrease in inventories in 2017 and an
increase in inventories in 2016 and other working capital fluctuations.
The decrease in cash provided in 2016 compared to 2015 is attributable to an increase in inventory
in 2016 compared to a decrease in 2015, partially offset by a decrease in accounts receivable in
2016 compared to an increase in 2015, and increased profitability in 2015.
Third parties supply the Company with various raw materials for its firearms and castings, such as
fabricated steel components, walnut, birch, beech, maple and laminated lumber for rifle stocks,
wax, ceramic material, metal alloys, various synthetic products and other component parts. There
is a limited supply of these materials in the marketplace at any given time, which can cause the
purchase prices to vary based upon numerous market factors. The Company believes that it has
adequate quantities of raw materials in inventory or on order to provide sufficient time to locate
and obtain additional items at then-current market cost without interruption of its manufacturing
operations. However, if market conditions result in a significant prolonged inflation of certain
prices or if adequate quantities of raw materials cannot be obtained, the Company’s manufacturing
processes could be interrupted and the Company’s financial condition or results of operations
could be materially adversely affected.
Investing and Financing
Capital expenditures were $33.6 million, $35.2 million, and $28.7 million in 2017, 2016, and 2015,
respectively. In 2018, the Company expects capital expenditures to approximate $15 million,
much of which will relate to tooling and fixtures for new product introductions and to upgrade and
modernize manufacturing equipment. Due to market conditions and business circumstances,
actual capital expenditures could vary significantly from the budgeted amount. The Company
finances, and intends to continue to finance, all of these activities with funds provided by
operations and current cash.
In 2017, the Company repurchased 1,319,708 shares of its common stock for $64.8 million in the
open market. The average price per share purchased was $49.14. These purchases were funded
with cash on hand. In 2016, the Company repurchased 283,343 shares of its common stock for
$14.0 million in the open market. The average price per share purchased was $49.43. These
purchases were funded with cash on hand. In 2015, the Company repurchased 82,100 shares of
41
its common stock for $2.8 million in the open market. The average price per share purchased was
$34.57. These purchases were made with cash held by the Company and no debt was incurred.
At December 31, 2017, $30.7 million remained authorized for future share repurchases.
The Company paid dividends totaling $23.9 million, $32.8 million, and $20.6 million in 2017,
2016, and 2015, respectively. The dividend varies every quarter because the Company pays a
percentage of earnings rather than a fixed amount per share. The Company’s practice is to pay a
dividend of approximately 40% of net income.
On February 16, 2018, the Company’s Board of Directors authorized a dividend of 23¢ per share
to shareholders of record on March 15, 2018. The payment of future dividends depends on many
factors, including internal estimates of future performance, then-current cash, and the Company’s
need for funds.
The Company provides supplemental discretionary contributions to substantially all employees’
individual 401(k) accounts.
Based on its unencumbered assets, the Company believes it has the ability to raise cash through
issuance of short-term or long-term debt. The Company’s unsecured $40 million credit facility,
which expires on June 15, 2018, remained unused at December 31, 2017 and the Company has no
debt.
Contractual Obligations
The table below summarizes the Company’s significant contractual obligations at December 31,
2017, and the effect such obligations are expected to have on the Company’s liquidity and cash
flows in future periods. This table excludes amounts already recorded on the Company’s balance
sheet as current liabilities at December 31, 2017.
“Purchase Obligations” as used in the below table includes all agreements to purchase goods or
services that are enforceable and legally binding on the Company and that specify all significant
terms, including: fixed or minimum quantities to be purchased; fixed, minimum or variable price
provisions; and the approximate timing of the transaction. Certain of the Company’s purchase
orders or contracts for the purchase of raw materials and other goods and services that may not
necessarily be enforceable or legally binding on the Company are also included in “Purchase
Obligations” in the table, and, therefore, certain of the Company’s purchase orders or contracts
included in the table may represent authorizations to purchase rather than legally binding
agreements. The Company expects to fund all of these commitments with cash flows from
operations and current cash.
42
Payment due by period (in thousands)
Contractual Obligations
Total
Less than
1 year
1-3 years
3-5 years
More
than 5
Years
Long-Term Debt Obligations - - - - -
Capital Lease Obligations - - - - -
Operating Lease Obligations $ 204 $ 204 $ - $ - -
Purchase Obligations $30,522 $30,522 - - -
Other Long-Term Liabilities
Reflected on the
Registrant’s Balance
Sheet under GAAP
-
-
-
-
-
Total $30,726 $30,726 $ $ - -
The expected timing of payment of the obligations discussed above is estimated based on current
information. Timing of payments and actual amounts paid may be different depending on the time
of receipt of goods or services or changes to agreed-upon amounts for some obligations.
Firearms Legislation and Litigation
See Item 1A - Risk Factors and Note 17 to the financial statements which are included in the
Annual Report on Form 10-K for a discussion of firearms legislation and litigation. Other Operational Matters
In the normal course of its manufacturing operations, the Company is subject to occasional
governmental proceedings and orders pertaining to workplace safety, firearms serial number
tracking and control, waste disposal, air emissions and water discharges into the environment. The
Company believes that it is generally in compliance with applicable Bureau of Alcohol, Tobacco,
Firearms & Explosives, environmental, and safety regulations and the outcome of any proceedings
or orders will not have a material adverse effect on the financial position or results of operations
of the Company.
The Company self-insures a significant amount of its product liability, workers’ compensation,
medical, and other insurance. It also carries significant deductible amounts on various insurance
policies.
The Company expects to realize its deferred tax assets through tax deductions against future
taxable income. Critical Accounting Policies and Estimates
The preparation of financial statements in accordance with accounting principles generally
accepted in the United States requires management to make assumptions and estimates that affect
43
the reported amounts of assets and liabilities as of the balance sheet date and net sales and expenses
recognized and incurred during the reporting period then ended. The Company bases estimates on
prior experience, facts and circumstances, and other assumptions, including those reviewed with
actuarial consultants and independent counsel, when applicable, that are believed to be reasonable.
However, actual results may differ from these estimates.
The Company believes the determination of its product liability accrual is a critical accounting
policy. The Company’s management reviews every lawsuit and claim and is in contact with
independent and corporate counsel on an ongoing basis. The provision for product liability claims
is based upon many factors, which vary for each case. These factors include the type of claim,
nature and extent of injuries, historical settlement ranges, jurisdiction where filed, and advice of
counsel. An accrual is established for each lawsuit and claim, when appropriate, based on the
nature of each such lawsuit or claim.
Amounts are charged to product liability expense in the period in which the Company becomes
aware that a claim or, in some instances a threat of a claim, has been made when potential losses
or costs of defense are probable and can be reasonably estimated. Such amounts are determined
based on the Company’s experience in defending similar claims. Occasionally, charges are made
for claims made in prior periods because the cumulative actual costs incurred for that claim, or
reasonably expected to be incurred in the future, exceed amounts already provided with respect to
such claims. Likewise, credits may be taken if cumulative actual costs incurred for that claim, or
reasonably expected to be incurred in the future, are less than amounts previously provided.
While it is not possible to forecast the outcome of litigation or the timing of related costs, in the
opinion of management, after consultation with independent and corporate counsel, there is a
remote likelihood that litigation, including punitive damage claims, will have a material adverse
effect on the financial position of the Company, but such litigation may have a material impact on
the Company’s financial results and cash flows for a particular period.
The Company believes the valuation of its inventory and the related excess and obsolescence
reserve is also a critical accounting policy. Inventories are carried at the lower of cost, principally
determined by the last-in, first-out (LIFO) method, or market. An actual valuation of inventory
under the LIFO method is made at the end of each year based on the inventory levels and prevailing
inventory costs existing at that time.
The Company determines its excess and obsolescence reserve by projecting the year in which
inventory will be consumed into a finished product. Given ever-changing market conditions,
customer preferences and the anticipated introduction of new products, it does not seem prudent
nor supportable to carry inventory at full cost beyond that needed during the next 36 months.
Recent Accounting Pronouncements
In November 2015, the Financial Accounting Standards Board (“FASB”) issued Accounting
Standard Update (“ASU”) 2015-17, Income Taxes (Topic 740): Balance Sheet Classification of
Deferred Taxes. This ASU simplifies the presentation of deferred income taxes by eliminating the
requirement for entities to separate deferred tax liabilities and assets into current and noncurrent
44
amounts in classified balance sheets. Instead, it requires deferred tax assets and liabilities be
classified as noncurrent in the balance sheet. ASU 2015-17 is effective for financial statements
issued for annual periods beginning after December 15, 2016. The Company adopted ASU 2015-
17 in the first quarter of 2017 and applied it retroactively to all prior periods presented in the
financial statements. The impact of adopting this change in accounting principle on the December
31, 2016 balance sheet was to reduce current deferred tax assets and working capital by $8.8
million and noncurrent deferred tax liabilities by $8.5 million from the amounts previously
reported for these items.
In May 2014, the FASB issued ASU 2014-09, Revenue from Contracts with Customers (Topic
606), requiring an entity to recognize the amount of revenue to which it expects to be entitled for
the transfer of promised goods or services to customers. The updated standard will replace most
existing revenue recognition guidance in U.S. GAAP when it becomes effective and permits the
use of either a full retrospective or retrospective with cumulative effect transition method. In
August 2015, the FASB issued ASU 2015-14 which defers the effective date of ASU 2014-09 one
year making it effective for annual reporting periods beginning after December 15, 2017. The
new standard will be effective for the Company in the first quarter of 2018 and can be applied
using a modified retrospective or full retrospective method. The Company has evaluated the new
standard against its existing accounting policies and practices, including reviewing standard
purchase orders, invoices, shipping terms, and reviewing agreements with customers. The
Company expects to adopt the new standard in the first quarter of 2018 using the modified
retrospective transition method. The Company will modify its revenue recognition related to
certain of its sales promotion activities that involve the shipment of no charge firearms. As a
result, the Company expects to record a contract liability of approximately $7 million on January
1, 2018. In addition, certain promotional expenses that had been classified as selling expenses will
be recorded as cost of products sold in future periods. The Company believes the new guidance
will not have a material impact on the Company’s consolidated financial results, cash flows, or
financial position, but may have a material impact on the Company’s financial results for a
particular period.
In February 2016, the FASB issued ASU 2016-02, "Leases" (ASU 2016-02), which requires
companies to recognize leased assets and liabilities for both capital and operating leases. ASU
2016-02 is effective for public business entities for fiscal years beginning after December 15, 2018,
including interim periods within those fiscal years, with early adoption permitted. Companies are
required to adopt the guidance using a modified retrospective method. While the Company is
currently assessing the impact ASU 2016-02 will have on the consolidated financial statements,
the adoption of this standard is not expected to have a material impact to our consolidated financial
position.
Forward-Looking Statements and Projections
The Company may, from time to time, make forward-looking statements and projections
concerning future expectations. Such statements are based on current expectations and are subject
to certain qualifying risks and uncertainties, such as market demand, sales levels of firearms,
anticipated castings sales and earnings, the need for external financing for operations or capital
expenditures, the results of pending litigation against the Company, the impact of future firearms
45
control and environmental legislation and accounting estimates, any one or more of which could
cause actual results to differ materially from those projected. Words such as “expect,” “believe,”
“anticipate,” “intend,” “estimate,” “will,” “should,” “could” and other words and terms of similar
meaning, typically identify such forward-looking statements. Readers are cautioned not to place
undue reliance on these forward-looking statements, which speak only as of the date made. The
Company undertakes no obligation to publish revised forward-looking statements to reflect events
or circumstances after the date such forward-looking statements are made or to reflect the
occurrence of subsequent unanticipated events. ITEM 7A—QUANTITATIVE AND QUALITATIVE DISCLOSURES ABOUT MARKET
RISK The Company is exposed to changing interest rates on its investments, which consist primarily of
United States Treasury instruments with short-term (less than one year) maturities and cash. The
interest rate market risk implicit in the Company's investments at any given time is low, as the
investments mature within short periods and the Company does not have significant exposure to
changing interest rates on invested cash.
The Company has not undertaken any actions to cover interest rate market risk and is not a party
to any interest rate market risk management activities.
A hypothetical 100 basis point change in market interest rates over the next year would not
materially impact the Company’s earnings or cash flows. A hypothetical 100 basis point change
in market interest rates would not have a material effect on the fair value of the Company’s
investments.
46
ITEM 8—FINANCIAL STATEMENTS AND SUPPLEMENTARY DATA
INDEX TO CONSOLIDATED FINANCIAL STATEMENTS
Reports of Independent Registered Public Accounting Firm
47 Consolidated Balance Sheets at December 31, 2017 and 2016 49 Consolidated Statements of Income and Comprehensive Income
for the years ended December 31, 2017, 2016 and 2015
51 Consolidated Statements of Stockholders’ Equity for the years
ended December 31, 2017, 2016 and 2015
52 Consolidated Statements of Cash Flows for the years ended
December 31, 2017, 2016 and 2015
53 Notes to Consolidated Financial Statements 54
47
Report of Independent Registered Public Accounting Firm
To the Shareholders and the Board of Directors of Sturm, Ruger & Company, Inc. and Subsidiary
Opinion on the Internal Control Over Financial Reporting
We have audited Sturm, Ruger & Company, Inc. and Subsidiary's (“the Company”) internal control over financial
reporting as of December 31, 2017, based on criteria established in Internal Control—Integrated Framework issued by the
Committee of Sponsoring Organizations of the Treadway Commission in 2013. In our opinion, the Company
maintained, in all material respects, effective internal control over financial reporting as of December 31, 2017, based on
criteria established in Internal Control—Integrated Framework issued by the Committee of Sponsoring Organizations of
the Treadway Commission in 2013.
We have also audited, in accordance with the standards of the Public Company Accounting Oversight Board (United
States) (“PCAOB”), the consolidated balance sheets of the Company as of December 31, 2017 and 2016, and the related
consolidated statements of comprehensive income, stockholders’ equity, and cash flows for each of the three years in the
period ended December 31, 2017, and our report dated February 21, 2018 expressed an unqualified opinion.
Basis for Opinion
The Company’s management is responsible for maintaining effective internal control over financial reporting and for its
assessment of the effectiveness of internal control over financial reporting in the accompanying Management’s Report on
Internal Control over Financial Reporting. Our responsibility is to express an opinion on the Company's internal control
over financial reporting based on our audit. We are a public accounting firm registered with the PCAOB and are required
to be independent with respect to the Company in accordance with U.S. federal securities laws and the applicable rules and
regulations of the Securities and Exchange Commission and the PCAOB.
We conducted our audit in accordance with the standards of the PCAOB. Those standards require that we plan and
perform the audit to obtain reasonable assurance about whether effective internal control over financial reporting was
maintained in all material respects. Our audit included obtaining an understanding of internal control over financial
reporting, assessing the risk that a material weakness exists, and testing and evaluating the design and operating
effectiveness of internal control based on the assessed risk. Our audit also included performing such other procedures as
we considered necessary in the circumstances. We believe that our audit provides a reasonable basis for our opinion.
Definition and Limitations of Internal Control Over Financial Reporting
A company's internal control over financial reporting is a process designed to provide reasonable assurance regarding the
reliability of financial reporting and the preparation of financial statements for external purposes in accordance with
generally accepted accounting principles. A company's internal control over financial reporting includes those policies
and procedures that (1) pertain to the maintenance of records that, in reasonable detail, accurately and fairly reflect the
transactions and dispositions of the assets of the company; (2) provide reasonable assurance that transactions are recorded
as necessary to permit preparation of financial statements in accordance with generally accepted accounting principles, and
that receipts and expenditures of the company are being made only in accordance with authorizations of management and
directors of the company; and (3) provide reasonable assurance regarding prevention or timely detection of unauthorized
acquisition, use, or disposition of the company's assets that could have a material effect on the financial statements.
Because of its inherent limitations, internal control over financial reporting may not prevent or detect misstatements.
Also, projections of any evaluation of effectiveness to future periods are subject to the risk that controls may become
inadequate because of changes in conditions, or that the degree of compliance with the policies or procedures may
deteriorate.
/s/RSM US LLP
Stamford, Connecticut
February 21, 2018
48
Report of Independent Registered Public Accounting Firm To the Shareholders and the Board of Directors of Sturm, Ruger & Company, Inc. and Subsidiary
Opinion on the Financial Statements
We have audited the accompanying consolidated balance sheets of Sturm, Ruger & Company, Inc. and
Subsidiary (“the Company”) as of December 31, 2017 and 2016, and the related consolidated statements
of income and comprehensive income, stockholders’ equity, and cash flows for each of the three years in
the period ended December 31, 2017 , and the related notes and schedule (collectively referred to as the
"financial statements"). In our opinion, the consolidated financial statements referred to above present
fairly, in all material respects, the financial position of the Company as of December 31, 2017 and 2016,
and the results of its operations and its cash flows for each of the three years in the period ended
December 31, 2017, in conformity with U.S. generally accepted accounting principles.
We also have audited, in accordance with the standards of the Public Company Accounting Oversight
Board (United States) (“PCAOB”), the Company’s internal control over financial reporting as of
December 31, 2017, based on criteria established in Internal Control—Integrated Framework issued by
the Committee of Sponsoring Organizations of the Treadway Commission in 2013, and our report dated
February 21, 2018 expressed an unqualified opinion on the effectiveness of the Company’s internal
control over financial reporting.
Basis for Opinion These consolidated financial statements and financial statement schedule are the responsibility of the
Company's management. Our responsibility is to express an opinion on these consolidated financial
statements based on our audits. We are a public accounting firm registered with the PCAOB and are
required to be independent with respect to the Company in accordance with the U.S. federal securities
laws and the applicable rules and regulations of the Securities and Exchange Commission and the
PCAOB.
We conducted our audits in accordance with the standards of the PCAOB. Those standards require that
we plan and perform the audit to obtain reasonable assurance about whether the financial statements are
free of material misstatement , whether due to error or fraud. Our audits included performing procedures
to assess the risks of material misstatement of the financial statements, whether due to error or fraud, and
performing procedures that respond to those risks. Such procedures included examining, on a test basis,
evidence supporting the amounts and disclosures in the financial statements. Our audits also includes
assessing the accounting principles used and significant estimates made by management, as well as
evaluating the overall financial statement presentation. We believe that our audits provide a reasonable
basis for our opinion.
/s/RSM US LLP
We have served as the Company's auditor since 2005.
Stamford, Connecticut
February 21, 2018
49
Consolidated Balance Sheets (Dollars in thousands, except per share data)
December 31, 2017 2016
Assets
Current Assets
Cash and cash equivalents $ 63,487 $ 87,126
Trade receivables, net 60,082 69,442
Gross inventories
Less LIFO reserve
Less excess and obsolescence reserve
87,592
(45,180)
(2,698)
99,417
(42,542)
(2,340)
Net inventories 39,714 54,535
Prepaid expenses and other current assets 3,501 3,660
Total Current Assets 166,784 214,763
Property, Plant, and Equipment 365,013 331,639
Less allowances for depreciation (261,218) (227,398)
Net property, plant and equipment 103,795 104,241
Deferred income taxes - 334
Other assets 13,739 27,541
Total Assets $284,318 $346,879
See accompanying notes to consolidated financial statements.
50
December 31, 2017 2016
Liabilities and Stockholders’ Equity
Current Liabilities
Trade accounts payable and accrued expenses $ 32,422 $ 48,493
Product liability 729 1,733
Employee compensation and benefits 14,315 25,467
Workers’ compensation 5,211 5,200
Total Current Liabilities 52,677 80,893
Product liability 90 86
Deferred income taxes 1,402 -
Contingent liabilities (Note 17) - -
Stockholders’ Equity
Common stock, non-voting, par value $1:
Authorized shares – 50,000; none issued
Common stock, par value $1:
Authorized shares – 40,000,000
2017 – 24,092,488 issued,
17,427,090 outstanding
2016 – 24,034,201 issued,
18,688,511 outstanding
24,092
24,034
Additional paid-in capital 28,329 27,211
Retained earnings 321,323 293,400
Less: Treasury stock – at cost
2017 – 6,665,398 shares
2016 – 5,345,690 shares
(143,595)
(78,745)
Total Stockholders’ Equity 230,149 265,900
Total Liabilities and Stockholders’ Equity $284,318 $346,879
See accompanying notes to consolidated financial statements.
51
Consolidated Statements of Income and Comprehensive Income
(In thousands, except per share data)
Year ended December 31, 2017 2016 2015
Net firearms sales $517,701 $658,433 $544,850
Net castings sales 4,555 5,895 6,244
Total net sales 522,256 664,328 551,094
Cost of products sold 368,248 444,774 378,934
Gross profit 154,008 219,554 172,160
Operating Expenses:
Selling 49,232 56,146 49,864
General and administrative 28,396 29,004 27,864
Other operating income, net 31 (5) (113)
Total operating expenses 77,659 85,145 77,615
Operating income 76,349 134,409 94,545
Other income:
Royalty income 506 1,142 1,084
Interest income 27 14 5
Interest expense (152) (186) (156)
Other income, net 916 542 622
Total other income, net 1,297 1,512 1,555
Income before income taxes 77,646 135,921 96,100
Income taxes 25,504 48,449 33,974
Net income and comprehensive income $ 52,142 $ 87,472 $ 62,126
Basic Earnings Per Share $2.94 $4.62 $3.32
Diluted Earnings Per Share $2.91 $4.59 $3.21
Cash Dividends Per Share $1.36 $1.73 $1.10
See accompanying notes to consolidated financial statements.
52
Consolidated Statements of Stockholders’ Equity
(Dollars in thousands)
Common
Stock
Additional
Paid-in
Capital
Retained
Earnings
Treasury
Stock
Total
Balance at December 31, 2014 $23,717 $25,472 $198,159 $(61,886) $185,462
Net income 62,126 62,126
Dividends paid (20,569) (20,569)
Stock-based compensation 4,530 4,530
Exercise of stock options and
vesting of RSU’s
(788)
(788)
Tax benefit realized from exercise
of stock options and vesting of
RSU’s
436
436
Common stock issued –
compensation plans
59
(59)
-
Unpaid dividends accrued (618) (618)
Repurchase of 82,100 shares of
common stock
(2,841)
(2,841)
Balance at December 31, 2015 23,776 29,591 239,098 (64,727) 227,738
Net income 87,472 87,472
Dividends paid (32,815) (32,815)
Stock-based compensation 3,054 3,054
Exercise of stock options and
vesting of RSU’s
(14,002) (14,002)
Tax benefit realized from exercise
of stock options and vesting of
RSU’s
8,826 8,826
Common stock issued –
compensation plans
258 (258) -
Unpaid dividends accrued (355) (355)
Repurchase of 283,343 shares of
common stock
(14,018)
(14,018)
Balance at December 31, 2016 24,034 27,211 293,400 (78,745) $265,900
Net income 52,142 52,142
Dividends paid (23,905) (23,905)
Stock-based compensation 3,659 3,659
Exercise of stock options and
vesting of RSU’s
(2,483)
(2,483)
Common stock issued –
compensation plans
58
(58)
-
Unpaid dividends accrued (314) (314)
Repurchase of 1,319,708 shares of
common stock
(64,850)
(64,850)
Balance at December 31, 2017 $24,092 $28,329 $321,323 $(143,595) $230,149
See accompanying notes to consolidated financial statements.
53
Consolidated Statements of Cash Flows
(In thousands)
Year ended December 31, 2017 2016 2015
Operating Activities
Net income $ 52,142 $ 87,472 $ 62,126 Adjustments to reconcile net income to cash provided by operating activities:
Depreciation and amortization 34,264 35,355 36,235 Stock-based compensation 3,659 3,054 4,530 Excess and obsolescence inventory reserve 358 522 (1,468) Loss (gain) on sale of assets 31 59 (113) Deferred income taxes 1,736 1,836 (3,257) Changes in operating assets and liabilities:
Trade receivables 9,360 2,279 (21,986) Inventories 14,463 (17,958) 9,058 Trade accounts payable and accrued expenses (16,060) 5,602 6,808 Employee compensation and benefits (11,466) (3,186) 9,378 Product liability (1,000) 1,075 (101) Prepaid expenses, other assets and other liabilities 13,704 (6,348) 6,553 Income taxes payable - (4,962) 4,806
Cash provided by operating activities 101,191 104,800 112,569
Investing Activities
Property, plant, and equipment additions (33,596) (35,215) (28,705) Net proceeds from sale of assets 3 325 222
Cash used for investing activities (33,593) (34,890) (28,483) Financing Activities
Dividends paid (23,905) (32,815) (20,569) Tax benefit from share-based compensation - 8,825 436 Repurchase of common stock (64,850) (14,018) (2,841) Payment of employee withholding tax related to share-
based compensation
(2,482)
(14,001)
(999) Proceeds from exercise of stock options - - 211
Cash used for financing activities (91,237) (52,009) (23,762)
(Decrease) increase in cash and cash equivalents (23,639) 17,901 60,324 Cash and cash equivalents at beginning of year 87,126 69,225 8,901 Cash and cash equivalents at end of year $ 63,487 $ 87,126 $ 69,225
See accompanying notes to consolidated financial statements.
54
Notes to Consolidated Financial Statements
(Dollars in thousands, except per share)
1. Summary of Significant Accounting Policies
Organization
Sturm, Ruger & Company, Inc. (the “Company”) is principally engaged in the design,
manufacture, and sale of firearms to domestic customers. Approximately 99% of sales were from
firearms. Export sales represented approximately 4% of firearms sales. The Company’s design
and manufacturing operations are located in the United States and almost all product content is
domestic. The Company’s firearms are sold through a select number of independent wholesale
distributors principally to the commercial sporting market.
The Company manufactures investment castings made from steel alloys and metal injection
molding (“MIM”) parts for internal use in its firearms and utilizes available capacity to
manufacture and sell investment castings and MIM parts to unaffiliated, third-party customers.
Castings were approximately 1% of the Company’s total sales for the year ended December 31,
2017.
Preparation of Financial Statements
The Company follows United States generally accepted accounting principles (“GAAP”). The
preparation of financial statements in conformity with GAAP requires management to make
estimates and assumptions that affect the reported amounts of assets and liabilities and disclosure
of contingent liabilities at the date of the financial statements and the reported amounts of revenues
and expenses during the reporting period. Actual results could differ from these estimates.
The significant accounting policies described below, together with the notes that follow, are an
integral part of the Financial Statements. Principles of Consolidation
The consolidated financial statements include the accounts of the Company and its wholly owned
subsidiary. All significant intercompany accounts and transactions have been eliminated. Revenue Recognition
Substantially all product sales are sold FOB (free on board) shipping point. Revenue is recognized
when product is shipped and the customer takes ownership and assumes the risk of loss. Accruals
are made for sales discounts and incentives based on the Company’s experience. The Company
accounts for cash sales discounts as a reduction in sales and sales incentives as a charge to selling
expense. Amounts billed to customers for shipping and handling fees are included in net sales and
costs incurred by the Company for the delivery of goods are classified as selling expenses. Federal
excise taxes are excluded from net sales. See “Recent Accounting Pronouncements” below for a
discussion of revenue recognition in future periods.
55
Cash and Cash Equivalents
The Company considers interest-bearing deposits with financial institutions with remaining
maturities of three months or less at the time of acquisition to be cash equivalents.
Accounts Receivable
The Company establishes an allowance for doubtful accounts based on the creditworthiness of its
customers and historical experience. While the Company uses the best information available to
make its evaluation, future adjustments to the allowance for doubtful accounts may be necessary
if there are significant changes in economic and industry conditions or any other factors considered
in the Company’s evaluation. Bad debt expense has been immaterial during each of the last three
years.
Inventories
Substantially all of the Company’s inventories are valued at the lower of cost, principally
determined by the last-in, first-out (LIFO) method, or market. Elements of cost in inventories
include raw materials, direct labor and manufacturing overhead.
Property, Plant, and Equipment
Property, plant, and equipment are carried at cost. Depreciation is computed over useful lives
using the straight-line and declining balance methods predominately over 15 years for buildings,
7 years for machinery and equipment and 3 years for tools and dies. When assets are retired, sold
or otherwise disposed of, their gross carrying values and related accumulated depreciation are
removed from the accounts and a gain or loss on such disposals is recognized when appropriate.
Maintenance and repairs are charged to operations; replacements and improvements are
capitalized.
Long-lived Assets
The Company evaluates the carrying value of long-lived assets to be held and used when events
or changes in circumstances indicate the carrying value may not be recoverable. In performing this
review, the carrying value of the assets is compared to the projected undiscounted cash flows to
be generated from the assets. If the sum of the undiscounted expected future cash flows is less
than the carrying value of the assets, the assets are considered to be impaired. Impairment losses
are measured as the amount by which the carrying value of the assets exceeds their fair value. The
Company bases fair value of the assets on quoted market prices if available or, if not available,
quoted market prices of similar assets. Where quoted market prices are not available, the Company
estimates fair value using the estimated future cash flows generated by the assets discounted at a
rate commensurate with the risks associated with the recovery of the assets.
56
Income Taxes
Income taxes are accounted for using the asset and liability method. Under this method, deferred
income taxes are recognized for the tax consequences of “temporary differences” by applying
enacted statutory rates applicable to future years to temporary differences between the financial
statement carrying amounts and the tax basis of the Company’s assets and liabilities.
Product Liability
The Company provides for product liability claims including estimated legal costs to be incurred
defending such claims. The provision for product liability claims is charged to cost of products
sold.
Advertising Costs
The Company expenses advertising costs as incurred. Advertising expenses for 2017, 2016, and
2015, were $3.1 million, $2.9 million, and $3.0 million, respectively.
Shipping Costs
Costs incurred related to the shipment of products are included in selling expense. Such costs
totaled $4.8 million, $5.7 million, and $6.4 million in 2017, 2016, and 2015, respectively.
Research and Development
In 2017, 2016, and 2015, the Company spent approximately $9.8 million, $8.7 million, and $8.5
million, respectively, on research and development activities relating to new products and the
improvement of existing products. These costs are expensed as incurred.
Earnings per Share
Basic earnings per share is based upon the weighted-average number of shares of common stock
outstanding during the year. Diluted earnings per share reflect the impact of options, restricted
stock units, and deferred stock outstanding using the treasury stock method.
Recent Accounting Pronouncements
In November 2015, the Financial Accounting Standards Board (“FASB”) issued Accounting
(a) The beginning and ending liability balances represent accrued legal fees only. Settlements
and administrative costs are expensed as incurred. Only in rare instances is an accrual
established for settlements.
(b) The expense accrued in the liability is for legal fees only. In 2015 and 2017, the costs
incurred related to cases that were settled or dismissed were less than the amounts accrued
for these cases in prior years.
(c) Legal fees represent payments to outside counsel related to product liability matters.
(d) Settlements represent payments made to plaintiffs or allegedly injured parties in exchange
for a full and complete release of liability.
(e) Insurance expense represents the cost of insurance premiums.
There were no insurance recoveries during any of the above years.
18. Financial Instruments
The Company does not hold or issue financial instruments for trading or hedging purposes, nor
does it hold interest rate, leveraged, or other types of derivative financial instruments. Fair values
of accounts receivable, accounts payable, accrued expenses and income taxes payable reflected in
the December 31, 2017 and 2016 balance sheets approximate carrying values at those dates.
19. Subsequent Events
On February 16, 2018, the Company’s Board of Directors authorized a dividend of 23¢ per share
to shareholders of record on March 15, 2018.
The Company’s management has evaluated transactions occurring subsequent to December 31,
2017 and determined that there were no events or transactions during that period that would have
a material impact on the Company’s results of operations or financial position.
73
ITEM 9—CHANGES IN AND DISAGREEMENTS WITH ACCOUNTANTS ON
ACCOUNTING AND FINANCIAL DISCLOSURE
None. ITEM 9A—CONTROLS AND PROCEDURES
Evaluation of Disclosure Controls and Procedures
The Company conducted an evaluation, with the participation of its Chief Executive Officer and
Chief Financial Officer, of the effectiveness of the design and operation of the Company’s
disclosure controls and procedures, as defined in Rules 13a-15(e) and 15d-15(e) under the
Securities Exchange Act of 1934, as amended, as of December 31, 2017. Based upon that
evaluation, the Chief Executive Officer and Chief Financial Officer have concluded that as of
December 31, 2017, the Company’s disclosure controls and procedures over financial reporting
were effective.
Management’s Report on Internal Control over Financial Reporting
The Company’s management is responsible for establishing and maintaining adequate internal
control over financial reporting as defined in Rules 13a-15(f) and 15d-15(f) under the Securities
Exchange Act of 1934. Because of its inherent limitations, internal control over financial reporting
may not prevent or detect misstatements. Also, projections of any evaluation of effectiveness to
future periods are subject to the risk that controls may become inadequate because of changes in
conditions, or that the degree of compliance with the policies or procedures may deteriorate.
The Company conducted an evaluation, with the participation of its Chief Executive Officer and
Chief Financial Officer, of the effectiveness of its internal control over financial reporting as of
December 31, 2017. This evaluation was performed based on the criteria established in “Internal
Control — Integrated Framework” issued by the Committee of Sponsoring Organizations of the
Treadway Commission (“COSO”) in 2013.
Management has concluded that the Company maintained effective internal control over financial
reporting as of December 31, 2017, based on criteria established in “Internal Control — Integrated
Framework” issued by the COSO in 2013.
The effectiveness of the Company’s internal control over financial reporting as of December 31,
2017 has been audited by RSM US LLP, an independent registered public accounting firm, as
stated in their report which is included in this Form 10-K.
Changes in Internal Control over Financial Reporting
There were no changes in our internal control over financial reporting that occurred during our
most recently completed fiscal quarter that has materially affected, or is reasonably likely to
materially affect, our internal control over financial reporting.
74
New York Stock Exchange Certification
Pursuant to Section 303A.12(a) of the New York Stock Exchange Listed Company Manual, the
Company submitted an unqualified certification of our Chief Executive Officer to the New York
Stock Exchange in 2017. The Company has also filed, as exhibits to this Annual Report on Form
10-K, the Chief Executive Officer and Chief Financial Officer Certifications required under the
Sarbanes-Oxley Act of 2002. ITEM 9B—OTHER INFORMATION
None.
PART III ITEM 10—DIRECTORS, EXECUTIVE OFFICERS AND CORPORATE GOVERNANCE Information concerning the Company’s directors, including the Company’s separately designated standing audit committee, and on the Company’s code of business conduct and ethics required by this Item is incorporated by reference from the Company’s Proxy Statement relating to the 2018 Annual Meeting of Stockholders scheduled to be held May 9, 2018, which will be filed with the SEC in March 2018. Information concerning the Company’s executive officers required by this Item is set forth in Item 1 of this Annual Report on Form 10-K under the caption “Executive Officers of the Company.” Information concerning beneficial ownership reporting compliance required by this Item is
incorporated by reference from the Company’s Proxy Statement relating to the 2018 Annual
Meeting of Stockholders scheduled to be held May 9, 2018, which will be filed with the SEC in
March 2018. ITEM 11—EXECUTIVE COMPENSATION Information concerning director and executive compensation required by this Item is incorporated by reference from the Company’s Proxy Statement relating to the 2018 Annual Meeting of Stockholders scheduled to be held May 9, 2018, which will be filed with the SEC in March 2018.
ITEM 12—SECURITY OWNERSHIP OF CERTAIN BENEFICIAL OWNERS AND
MANAGEMENT AND RELATED STOCKHOLDER MATTERS Information concerning the security ownership of certain beneficial owners and management and related stockholder matters required by this Item is incorporated by reference from the Company’s Proxy Statement relating to the 2018 Annual Meeting of Stockholders scheduled to be held May 9, 2018, which will be filed with the SEC in March 2018.
75
ITEM 13—CERTAIN RELATIONSHIPS AND RELATED TRANSACTIONS AND DIRECTOR INDEPENDENCE
Information concerning certain relationships and related transactions required by this Item is incorporated by reference from the Company’s Proxy Statement relating to the 2018 Annual Meeting of Stockholders scheduled to be held May 9, 2018. ITEM 14—PRINCIPAL ACCOUNTANT FEES AND SERVICES Information concerning the Company’s principal accountant fees and services and the pre-approval policies and procedures of the audit committee of the board of directors required by this Item is incorporated by reference from the Company’s Proxy Statement relating to the 2018 Annual Meeting of Stockholders scheduled to be held May 9, 2018, which will be filed with the SEC in March 2018.
76
PART IV ITEM 15—EXHIBITS AND FINANCIAL STATEMENT SCHEDULE (a) Exhibits and Financial Statement Schedule
(1) Financial Statements can be found under Item 8 of Part II of this Form 10-K
(2) Schedule can be found on Page 82 of this Form 10-K
(3) Listing of Exhibits:
Exhibit 3.1 Certificate of Incorporation of the Company, as amended (Incorporated by reference to Exhibits 4.1 and 4.2 to the Form S-3 Registration Statement previously filed by the Company File No. 33-62702).
Exhibit 3.2 Bylaws of the Company, as amended through May 8, 2017.
Exhibit 10.1 Credit Agreement, dated as of December 14, 2007, by and
between the Company and Bank of America (Incorporated by reference to Exhibit 10.18 to the Company's Current Report on Form 8-K filed with the SEC on December 20, 2007).
Exhibit 10.2 Severance Agreement, dated as of April 10, 2008, by and
between the Company and Thomas A. Dineen (Incorporated by reference to Exhibit 10.2 to the Company's Current Report on Form 8-K filed with the SEC on April 11, 2008).
Exhibit 10.3 Severance Agreement, dated as of April 10, 2008, by and
between the Company and Thomas P. Sullivan (Incorporated by reference to Exhibit 10.6 to the Company's Current Report on Form 8-K filed with the SEC on April 11, 2008).
Exhibit 10.4 Severance Agreement, dated as of May 2, 2008 by and between
the Company and Kevin B. Reid, Sr. (Incorporated by reference to Exhibit 10.1 to the Company's Current Report on Form 8-K filed with the SEC on May 5, 2008).
Exhibit 10.5 Ninth Amendment to Credit Agreement, dated June 15, 2017,
by and between the Company and Bank of America (Incorporated by reference to Exhibit 99.1 to the Company's Current Report on Form 8-K filed with the SEC on June 19, 2017).
Exhibit 10.6 Transition Services and Consulting Agreement, dated August 1,
2016, by and between the Company and Michael O. Fifer (Incorporated by reference to Exhibit 10.1 to the Company's Current Report on Form 8-K filed with the SEC on August 2, 2016).
Exhibit 10.7 Agreement, dated August 1, 2016, by and between the
Company and Christopher J. Killoy (Incorporated by reference to Exhibit 10.2 to the Company's Current Report on Form 8-K filed with the SEC on August 2, 2016).
Exhibit 10.8 Executive Severance Agreement, dated August 1, 2016, by and
between the Company and Shawn C. Leska (Incorporated by reference to Exhibit 10.3 to the Company's Current Report on Form 8-K filed with the SEC on August 2, 2016).
Exhibit 23.1 Consent of RSM US LLP
Exhibit 31.1 Certification of Chief Executive Officer Pursuant to Rule 13a-
14(a) of the Exchange Act.
Exhibit 31.2 Certification of Treasurer and Chief Financial Officer Pursuant
to Rule 13a-14(a) of the Exchange Act.
Exhibit 32.1 Certification of the Chief Executive Officer Pursuant to Rule
13a-14(b) of the Exchange Act and 18 U.S.C. Section 1350, as Adopted Pursuant to Section 906 of the Sarbanes-Oxley Act of 2002.
Exhibit 32.2 Certification of the Treasurer and Chief Financial Officer
Pursuant to Rule 13a-14(b) of the Exchange Act and 18 U.S.C. Section 1350, as Adopted Pursuant to Section 906 of the Sarbanes-Oxley Act of 2002.
SIGNATURES Pursuant to the requirements of Section 13 or 15(d) of the Securities Exchange Act of 1934, the registrant has duly caused this report to be signed on its behalf by the undersigned, thereunto duly authorized. STURM, RUGER & COMPANY, INC. (Registrant) S/THOMAS A. DINEEN Thomas A. Dineen Principal Financial Officer Principal Accounting Officer, Senior Vice President, Treasurer, and Chief Financial Officer February 21, 2018 Date
Pursuant to the requirements of the Securities Exchange Act of 1934, this report has been signed below by the following persons on behalf of the registrant and in the capacities and on the dates indicated. S/CHRISTOPHER J. KILLOY 2/21/18 Christopher J. Killoy Chief Executive Officer, Director (Principal Executive Officer)
S/JOHN A. COSENTINO, JR. 2/21/18 John A. Cosentino, Jr. Director
S/C. MICHAEL JACOBI 2/21/18 C. Michael Jacobi Director
S/RONALD C. WHITAKER 2/21/18 Ronald C. Whitaker Director
S/AMIR P. ROSENTHAL 2/21/18 Amir P. Rosenthal Director
S/PHILLIP C. WIDMAN 2/21/18 Phillip C. Widman Director
S/TERRENCE G. O’CONNOR 2/21/18 Terrence G. O’Connor Director
S/SANDRA S. FROMAN 2/21/18 Sandra S. Froman Director
S/MICHAEL O. FIFER 2/21/18 Michael O. Fifer Director
S/THOMAS A. DINEEN 2/21/18 Thomas A Dineen Principal Financial Officer Principal Accounting Officer, Senior Vice President, Treasurer, and Chief Financial Officer
79
EXHIBIT INDEX
Page No.
Exhibit 3.1 Certificate of Incorporation of the Company, as amended (Incorporated by reference to Exhibits 4.1 and 4.2 to the Form S-3 Registration Statement previously filed by the Company File No. 33-62702).
Exhibit 3.2 Bylaws of the Company, as amended through May 8, 2017.
Exhibit 10.1 Credit Agreement, dated as of December 14, 2007, by and
between the Company and Bank of America (Incorporated by reference to Exhibit 10.18 to the Company's Current Report on Form 8-K filed with the SEC on December 20, 2007).
Exhibit 10.2 Severance Agreement, dated as of April 10, 2008, by and
between the Company and Thomas A. Dineen (Incorporated by reference to Exhibit 10.2 to the Company's Current Report on Form 8-K filed with the SEC on April 11, 2008).
Exhibit 10.3 Severance Agreement, dated as of April 10, 2008, by and
between the Company and Thomas P. Sullivan (Incorporated by reference to Exhibit 10.6 to the Company's Current Report on Form 8-K filed with the SEC on April 11, 2008).
Exhibit 10.4 Severance Agreement, dated as of May 2, 2008 by and between
the Company and Kevin B. Reid, Sr. (Incorporated by reference to Exhibit 10.1 to the Company's Current Report on Form 8-K filed with the SEC on May 2, 2008).
Exhibit 10.5 Ninth Amendment to Credit Agreement, dated June 15, 2017,
by and between the Company and Bank of America (Incorporated by reference to Exhibit 99.1 to the Company's Current Report on Form 8-K filed with the SEC on June 8, 2016).
Exhibit 10.6 Transition Services and Consulting Agreement, dated August 1,
2016, by and between the Company and Michael O. Fifer (Incorporated by reference to Exhibit 10.1 to the Company's Current Report on Form 8-K filed with the SEC on August 2, 2016).
Exhibit 10.7 Agreement, dated August 1, 2016, by and between the
Company and Christopher J. Killoy (Incorporated by reference to Exhibit 10.2 to the Company's Current Report on Form 8-K filed with the SEC on August 2, 2016).
Exhibit 10.8 Executive Severance Agreement, dated August 1, 2016, by and
between the Company and Shawn C. Leska (Incorporated by reference to Exhibit 10.3 to the Company's Current Report on Form 8-K filed with the SEC on August 2, 2016).
Exhibit 31.1 Certification of Chief Executive Officer Pursuant to Rule 13a-14(a) of the Exchange Act.
84
Exhibit 31.2 Certification of Treasurer and Chief Financial Officer Pursuant
to Rule 13a-14(a) of the Exchange Act.
86
Exhibit 32.1 Certification of the Chief Executive Officer Pursuant to Rule 13a-14(b) of the Exchange Act and 18 U.S.C. Section 1350, as Adopted Pursuant to Section 906 of the Sarbanes-Oxley Act of 2002.
88
Exhibit 32.2 Certification of the Treasurer and Chief Financial Officer Pursuant to Rule 13a-14(b) of the Exchange Act and 18 U.S.C. Section 1350, as Adopted Pursuant to Section 906 of the Sarbanes-Oxley Act of 2002.
89
81
YEAR ENDED DECEMBER 31, 2017
STURM, RUGER & COMPANY, INC.
ITEMS 15(a) FINANCIAL STATEMENT SCHEDULE
82
Sturm, Ruger & Company, Inc.
Item 15(a)--Financial Statement Schedule
Schedule II—Valuation and Qualifying Accounts
(In Thousands) COL. A COL. B COL. C COL. D COL. E ADDITIONS Description
Balance at Beginning of Period
(1)
Charged (Credited) to
Costs and Expenses
(2)
Charged to Other
Accounts –Describe
Deductions
Balance at End
of Period
Deductions from asset accounts:
Allowance for doubtful accounts: Year ended December 31, 2017 $ 400 $ - $ - $ 400 Year ended December 31, 2016 $ 400 $ 9 $ 9 (a) $ 400 Year ended December 31, 2015 $ 400 $ 120 $ 120 (a) $ 400
Allowance for discounts:
Year ended December 31, 2017 $1,405 $11,795 $11,975 (b) $1,225 Year ended December 31, 2016 $1,443 $14,835 $14,873 (b) $1,405 Year ended December 31, 2015 $1,003 $11,797 $11,357 (b) $1,443
Excess and obsolete inventory
reserve:
Year ended December 31, 2017 $2,340 $1,247 $ 889(c) $2,698 Year ended December 31, 2016 $2,118 $1,044 $ 822 (c) $2,340 Year ended December 31, 2015 $3,750 $(1,468) $ 164 (c) $2,118
(a) Accounts written off (b) Discounts taken (c) Inventory written off
83
Exhibit 23.1
Consent of Independent Registered Public Accounting Firm
We consent to incorporation by reference in the Registration Statements (Nos. 333-84677 and
333-53234) on Form S-8 of Sturm, Ruger & Company, Inc. of our reports dated February 21,
2018 relating to our audits of the consolidated financial statements, the financial statement
schedule, and the effectiveness of internal control over financial reporting, which appear in this
Annual Report on Form 10-K of Sturm, Ruger & Company, Inc. for the year ended December
31, 2017.
/s/ RSM US LLP
Stamford, Connecticut February 21, 2018
84
EXHIBIT 31.1
CERTIFICATION
I, Christopher J. Killoy, certify that:
1. I have reviewed this Annual Report on Form 10-K (the “Report”) of Sturm, Ruger &
Company, Inc. (the “Registrant”);
2. Based on my knowledge, this Report does not contain any untrue statement of a material
fact or omit to state a material fact necessary to make the statements made, in light of
the circumstances under which such statements were made, not misleading with respect
to the period covered by this Report;
3. Based on my knowledge, the financial statements, and other financial information
included in this Report, fairly present in all material respects, the financial condition,
results of operations and cash flows of the Registrant as of, and for, the periods presented
in this Report;
4. The Registrant’s other certifying officer and I are responsible for establishing and
maintaining disclosure controls and procedures (as defined in Exchange Act Rules 13a-
15(e) and 15d-15(e)) and internal control over financial reporting (as defined in
Exchange Act Rules 13a-15(f) and 15d-15(f)) for the Registrant and have:
a) Designed such disclosure controls and procedures, or caused such disclosure
controls and procedures to be designed under our supervision, to ensure that
material information relating to the Registrant, including its consolidated
subsidiaries, is made known to us by others within those entities, particularly during
the period in which this Report is being prepared;
b) Designed such internal control over financial reporting, or caused such internal
control over financial reporting to be designed under our supervision, to provide
reasonable assurance regarding the reliability of financial reporting and the
preparation of financial statements for external purposes in accordance with
generally accepted accounting principles;
c) Evaluated the effectiveness of the Registrant’s disclosure controls and procedures
and presented in this Report our conclusions about the effectiveness of the
disclosure controls and procedures, as of the end of the period covered by this
Report based on such evaluation; and
d) Disclosed in this Report any change in the Registrant’s internal control over
financial reporting that occurred during the Registrant’s most recent fiscal quarter
(the Registrant’s fourth fiscal quarter in the case of an annual report) that has
materially affected, or is reasonably likely to materially affect, the Registrant’s
internal control over financial reporting.
85
5. The Registrant’s other certifying officer and I have disclosed, based on our most recent
evaluation of internal control over financial reporting, to the Registrant’s auditors and
the audit committee of Registrant’s board of directors (or persons performing the
equivalent functions):
a) All significant deficiencies and material weaknesses in the design or operation of
internal control over financial reporting which are reasonably likely to adversely
affect the Registrant’s ability to record, process, summarize and report financial
information; and
b) Any fraud, whether or not material, that involves management or other employees
who have a significant role in the Registrant’s internal control over financial
reporting.
Date: February 21, 2018
S/CHRISTOPHER J. KILLOY
Christopher J. Killoy
Chief Executive Officer
86
EXHIBIT 31.2
CERTIFICATION
I, Thomas A. Dineen, certify that:
1. I have reviewed this Annual Report on Form 10-K (the “Report”) of Sturm, Ruger &
Company, Inc. (the “Registrant”);
2. Based on my knowledge, this Report does not contain any untrue statement of a material
fact or omit to state a material fact necessary to make the statements made, in light of
the circumstances under which such statements were made, not misleading with respect
to the period covered by this Report;
3. Based on my knowledge, the financial statements, and other financial information
included in this Report, fairly present in all material respects, the financial condition,
results of operations and cash flows of the Registrant as of, and for, the periods presented
in this Report;
4. The Registrant’s other certifying officer and I are responsible for establishing and
maintaining disclosure controls and procedures (as defined in Exchange Act Rules 13a-
15(e) and 15d-15(e)) and internal control over financial reporting (as defined in
Exchange Act Rules 13a-15(f) and 15d-15(f)) for the Registrant and have:
a) Designed such disclosure controls and procedures, or caused such disclosure
controls and procedures to be designed under our supervision, to ensure that
material information relating to the Registrant, including its consolidated
subsidiaries, is made known to us by others within those entities, particularly during
the period in which this Report is being prepared;
b) Designed such internal control over financial reporting, or caused such internal
control over financial reporting to be designed under our supervision, to provide
reasonable assurance regarding the reliability of financial reporting and the
preparation of financial statements for external purposes in accordance with
generally accepted accounting principles;
c) Evaluated the effectiveness of the Registrant’s disclosure controls and procedures
and presented in this Report our conclusions about the effectiveness of the
disclosure controls and procedures, as of the end of the period covered by this
Report based on such evaluation; and
d) Disclosed in this Report any change in the Registrant’s internal control over
financial reporting that occurred during the Registrant’s most recent fiscal quarter
(the Registrant’s fourth fiscal quarter in the case of an annual report) that has
materially affected, or is reasonably likely to materially affect, the Registrant’s
internal control over financial reporting.
87
5. The Registrant’s other certifying officer and I have disclosed, based on our most recent
evaluation of internal control over financial reporting, to the Registrant’s auditors and
the audit committee of Registrant’s board of directors (or persons performing the
equivalent functions):
a) All significant deficiencies and material weaknesses in the design or operation of
internal control over financial reporting which are reasonably likely to adversely
affect the Registrant’s ability to record, process, summarize and report financial
information; and
b) Any fraud, whether or not material, that involves management or other employees
who have a significant role in the Registrant’s internal control over financial
reporting.
Date: February 21, 2018
S/THOMAS A. DINEEN
Thomas A. Dineen
Senior Vice President, Treasurer and
Chief Financial Officer
88
EXHIBIT 32.1
Certification Pursuant to 18 U.S.C. Section 1350, As Adopted Pursuant to
Section 906 of the Sarbanes-Oxley Act of 2002
In connection with the Annual Report on Form 10-K of Sturm, Ruger & Company, Inc. (the
“Company”) for the period ended December 31, 2017, as filed with the Securities and Exchange
Commission on the date hereof (the “Report”), I, Christopher J. Killoy, hereby certify, pursuant to
18 U.S.C. Section 1350, as adopted pursuant to Section 906 of the Sarbanes-Oxley Act of 2002,
that, to the best of my knowledge:
(1) The Report fully complies with the requirements of Section 13(a) or 15(d) of the Securities Exchange Act of 1934; and
(2) The information contained in the Report fairly presents, in all material respect, the
financial condition and results of operations of the Company. Date: February 21, 2018 S/CHRISTOPHER J. KILLOY Christopher J. Killoy Chief Executive Officer A signed original of this statement has been provided to the Company and will be retained by the
Company and furnished to the Securities and Exchange Commission or its staff upon request.
89
EXHIBIT 32.2
Certification Pursuant to 18 U.S.C. Section 1350, As Adopted Pursuant to
Section 906 of the Sarbanes-Oxley Act of 2002
In connection with the Annual Report on Form 10-K of Sturm, Ruger & Company, Inc. (the
“Company”) for the period ended December 31, 2017, as filed with the Securities and Exchange
Commission on the date hereof (the “Report”), I, Thomas A. Dineen, hereby certify, pursuant to
18 U.S.C. Section 1350, as adopted pursuant to Section 906 of the Sarbanes-Oxley Act of 2002,
that, to the best of my knowledge:
(1) The Report fully complies with the requirements of Section 13(a) or 15(d) of the Securities Exchange Act of 1934; and
(2) The information contained in the Report fairly presents, in all material respect, the
financial condition and results of operations of the Company. Date: February 21, 2018 S/THOMAS A. DINEEN Thomas A. Dineen Senior Vice President, Treasurer and Chief Financial Officer
A signed original of this statement has been provided to the Company and will be retained by the
Company and furnished to the Securities and Exchange Commission or its staff upon request.