Shipbuilding Some breathing space 5 Cruiseship under construction at STX FRANCE for MSC Cruises. While 2016 turned out to be an annus horribilis with the freefall in newbuilding prices and the near-disappearance of newbuilding orders, 2017 brought some breathing space to the shipping community. The number of newbuilding orders more than doubled and the improvement was spread equally across the three main pillars of the shipbuilding industry: bulker, tanker and container carrier. As a consequence, newbuilding prices finally inched up, though they remain at desperately low levels and hardly cover shipbuilders’ construction costs which also rose last year.
Transcript
Shipbuilding
Some breathing space
5
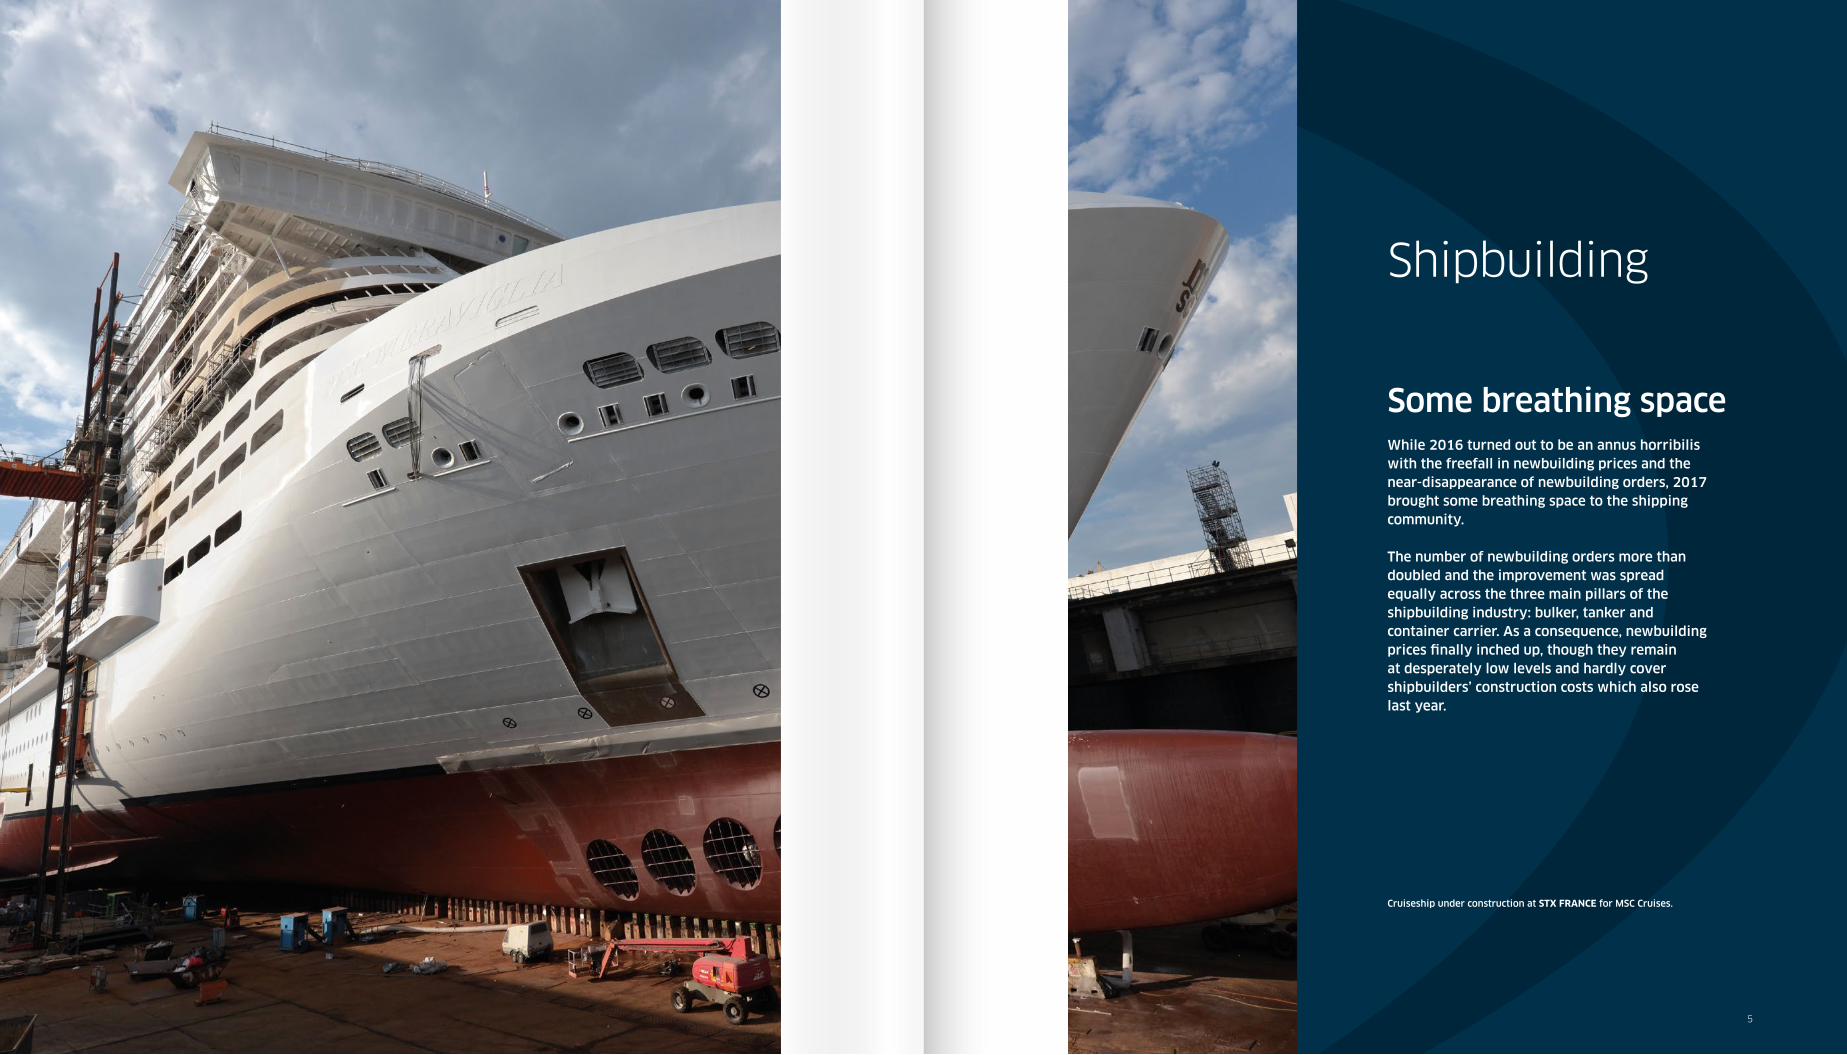
Cruiseship under construction at STX FRANCE for MSC Cruises.
While 2016 turned out to be an annus horribilis with the freefall in newbuilding prices and the near-disappearance of newbuilding orders, 2017 brought some breathing space to the shipping community.
The number of newbuilding orders more than doubled and the improvement was spread equally across the three main pillars of the shipbuilding industry: bulker, tanker and container carrier. As a consequence, newbuilding prices fi nally inched up, though they remain at desperately low levels and hardly cover shipbuilders’ construction costs which also rose last year.
The three giants of the shipbuilding industry, representing almost 95% of the global orderbook by deadweight, fought fi ercely for market share in 2017. China consolidated its top position recording a 44.8% market share, while Japan and Korea swapped positions again with Korea regaining its second place (24.7%) lost in 2016. Japan slipped back to third place in 2017 (23.8%). The ‘rest of the world’ (RoW) and Europe followed with 4.6% and 1.9% respectively.
Newbuilding deliveries (95.9m dwt) outpaced orders (89.1m dwt), and the global orderbook declined marginally from 233.4m dwt to 222.4m dwt. Korea was alone in winning enough orders to grow its orderbook during the year.
With owners wanting to take advantage of the low asset prices seen in early 2017, many returned to the yards where they invested in additional newbuildings (89.1m dwt in 2017 versus 33.1m dwt in 2016) while still being very active on the second hand market (93m dwt sales versus 83m dwt in 2016).
Newbuilding prices increased between 5% and 20% during the year depending on size and type of vessel.
This was partly a consequence of the increased demand, but also rising steel prices (which rose from approximately $450/ton to $750/ton year-on-year) and the weakening of the dollar against most of the main shipbuilding currencies.
Shipyards also wanted to cover the costs arising from changes to rules and regulations requiring either additional scantlings or additional equipment.
The key topics of SOx, NOx, CO2, scrubbers and dual fuel propulsion were hot throughout the year. So far it is not clear what the shipping community will do ahead of the 2020 fuel sulphur cap deadline and how it will address the key question: will sulphur be stripped out at the point of production or at the point of consumption?
Picture: VENTURE GOAL, Deltamarin B43 design. 43,500 dwt bulk carrier, delivered in 2015 by Qingshan shipyard to Hamburg Bulk Carriers. With CO2 emission 40% below average of the Handysize fleet, Sistership VENTURE JOY won the Nor-Shipping 2017 Energy Efficiency Award for meeting the highest Energy Efficiency Design Index 2025 requirements.
World EconomyThe world economy performed better in 2017 with a growth of 3.7% against 3.2% the previous year. World seaborne trade growth also accelerated from 2.8% in 2016 to 3.7% in 2017.
The world fl eet increased from 1,678m dwt to 1,774m dwt (33,939 ships). It is interesting to note that the fl eet has more than doubled since 2008, when it consisted of just 711m dwt (17,406 ships).
After a dreadful 2016, which saw the Baltic Exchange Dry Index (BDI) log its lowest level (290 points) since launching in 1985, the dry bulk market improved throughout 2017.
The BDI steadily increased from 953 at the start of 2017 to hit the year’s highest level of 1,743 on 12 December. This translated into a welcome increase in earnings for shipowners, from levels close to operating expenses to a level beyond breakeven. The quarterly average of the Baltic Capesize 5TC average was: Q1= $11,170/day, Q2= $12,043/day, Q3= $14,654/day, Q4= $23,057/day.
Tanker
Product tanker rates had come down substantially in 2016 and remained at low but stable levels throughout 2017. A one-year Time Charter on a MR2 fl uctuated between $12,500 and $14,500 per day. The Baltic Exchange Clean Tanker Index started the year at 867 and ended at 720, reaching a year-low of 508 in August 2017.
Meanwhile crude tanker rates that had decreased signifi cantly in 2016 continued to soften across the board in 2017. A one-year Time Charter on a VLCC fell during the year from $30,500 to $24,000 per day. The Baltic Exchange Dirty Tanker Index started at 1,088 and ended at 827, reaching a low of 614 in August 2017.
Seasons were well marked, with rate increases in the autumn which peaked at the start of winter, and then declines in spring before reaching a bottom in summer.
Container
Spot freight rates improved substantially in 2017 after touching record lows in 2016. The Alphaliner Charter Index rose to an average of around 60 in 2017 after hitting a low of 40 at the end of 2016.
However, while charter rates for containerships rose signifi cantly in 2017, they remained only slightly above operating expenses as carriers consolidated into an even smaller number of large alliances and used their bargaining power to keep rates under check.
The idle or unemployed containership pool shrank from about 1.4m teu (7% of the active fl eet) at the start of 2017 to about 0.4m teu (1.8%) at year end.
Alphaliner Charter Index since 2010
2010 2011 2012 2013 2014 2015 20172016
-4%
-2%
0%
2%
4%
6%
8%
10%
2009 2010 2011 2012 2013 2014 2015 2016 2017
Global Trade and World GDP & Active Fleet Growth
World GDP Seaborne Trade World Active Fleet Growth
Maritime TradeGlobal dry bulk trade growth accelerated from 1.3% in 2016 to 3.7% in 2017, while the growth in the oil trade inched down slightly from 4.2% to 2.5%. Container throughput growth accelerated sharply from 2.5% to 6.5%.
Seabornetrade growth accelerated from 2.8% in 2016 to 3.7% in 2017
Picture: DAMIA DESGAGNES , product chemical tanker, 14,986 dwt, delivered by Turkish shipyard Besiktas in 2017 to Transport Desgagnes.
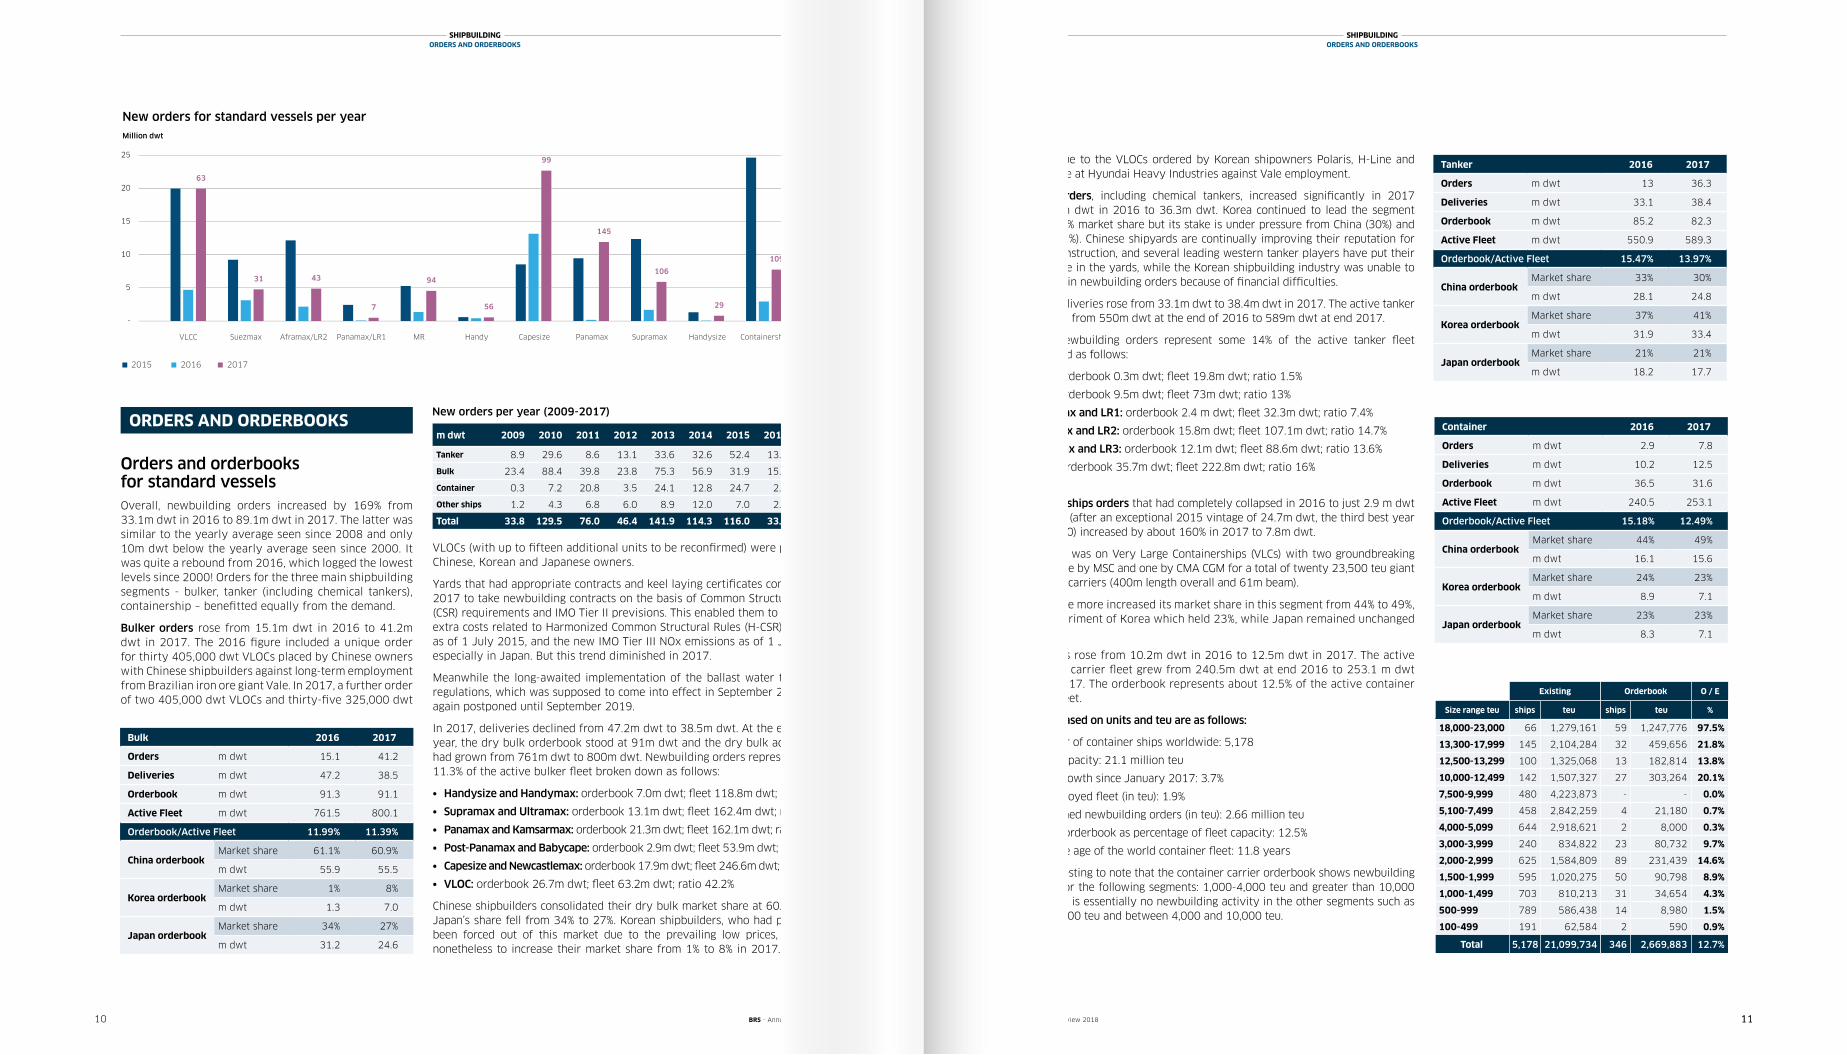
New orders for standard vessels per yearMillion dwt
Orders and orderbooks for standard vesselsOverall, newbuilding orders increased by 169% from 33.1m dwt in 2016 to 89.1m dwt in 2017. The latter was similar to the yearly average seen since 2008 and only 10m dwt below the yearly average seen since 2000. It was quite a rebound from 2016, which logged the lowest levels since 2000! Orders for the three main shipbuilding segments - bulker, tanker (including chemical tankers), containership – benefi tted equally from the demand.
Bulker orders rose from 15.1m dwt in 2016 to 41.2m dwt in 2017. The 2016 fi gure included a unique order for thirty 405,000 dwt VLOCs placed by Chinese owners with Chinese shipbuilders against long-term employment from Brazilian iron ore giant Vale. In 2017, a further order of two 405,000 dwt VLOCs and thirty-fi ve 325,000 dwt
Tanker 2016 2017
Orders m dwt 13 36.3
Deliveries m dwt 33.1 38.4
Orderbook m dwt 85.2 82.3
Active Fleet m dwt 550.9 589.3
Orderbook/Active Fleet 15.47% 13.97%
China orderbookMarket share 33% 30%
m dwt 28.1 24.8
Korea orderbookMarket share 37% 41%
m dwt 31.9 33.4
Japan orderbookMarket share 21% 21%
m dwt 18.2 17.7
Container 2016 2017
Orders m dwt 2.9 7.8
Deliveries m dwt 10.2 12.5
Orderbook m dwt 36.5 31.6
Active Fleet m dwt 240.5 253.1
Orderbook/Active Fleet 15.18% 12.49%
China orderbookMarket share 44% 49%
m dwt 16.1 15.6
Korea orderbookMarket share 24% 23%
m dwt 8.9 7.1
Japan orderbookMarket share 23% 23%
m dwt 8.3 7.1
mainly due to the VLOCs ordered by Korean shipowners Polaris, H-Line and Korea Line at Hyundai Heavy Industries against Vale employment.
Tanker orders, including chemical tankers, increased signifi cantly in 2017 from 13m dwt in 2016 to 36.3m dwt. Korea continued to lead the segment with a 41% market share but its stake is under pressure from China (30%) and Japan (21%). Chinese shipyards are continually improving their reputation for tanker construction, and several leading western tanker players have put their confi dence in the yards, while the Korean shipbuilding industry was unable to take certain newbuilding orders because of fi nancial diffi culties.
Tanker deliveries rose from 33.1m dwt to 38.4m dwt in 2017. The active tanker fl eet grew from 550m dwt at the end of 2016 to 589m dwt at end 2017.
Tanker newbuilding orders represent some 14% of the active tanker fl eet distributed as follows:
Containerships orders that had completely collapsed in 2016 to just 2.9 m dwt of orders, (after an exceptional 2015 vintage of 24.7m dwt, the third best year since 2000) increased by about 160% in 2017 to 7.8m dwt.
The focus was on Very Large Containerships (VLCs) with two groundbreaking orders, one by MSC and one by CMA CGM for a total of twenty 23,500 teu giant container carriers (400m length overall and 61m beam).
China once more increased its market share in this segment from 44% to 49%, to the detriment of Korea which held 23%, while Japan remained unchanged at 23%.
Deliveries rose from 10.2m dwt in 2016 to 12.5m dwt in 2017. The active container carrier fl eet grew from 240.5m dwt at end 2016 to 253.1 m dwt at end 2017. The orderbook represents about 12.5% of the active container carrier fl eet.
Figures based on units and teu are as follows:
• Number of container ships worldwide: 5,178
• Fleet capacity: 21.1 million teu
• Fleet growth since January 2017: 3.7%
• Unemployed fl eet (in teu): 1.9%
• Confi rmed newbuilding orders (in teu): 2.66 million teu
• Vessel orderbook as percentage of fl eet capacity: 12.5%
• Average age of the world container fl eet: 11.8 years
It is interesting to note that the container carrier orderbook shows newbuilding activity for the following segments: 1,000-4,000 teu and greater than 10,000 teu. There is essentially no newbuilding activity in the other segments such as below 1,000 teu and between 4,000 and 10,000 teu.
Existing
Size range teu ships teu
18,000-23,000 66 1,279,161
13,300-17,999 145 2,104,284
12,500-13,299 100 1,325,068
10,000-12,499 142 1,507,327
7,500-9,999 480 4,223,873
5,100-7,499 458 2,842,259
4,000-5,099 644 2,918,621
3,000-3,999 240 834,822
2,000-2,999 625 1,584,809
1,500-1,999 595 1,020,275
1,000-1,499 703 810,213
500-999 789 586,438
100-499 191 62,584
Total 5,178 21,099,734
Orderbook O / E
ships teu %
59 1,247,776 97.5%
32 459,656 21.8%
13 182,814 13.8%
27 303,264 20.1%
- - 0.0%
4 21,180 0.7%
2 8,000 0.3%
23 80,732 9.7%
89 231,439 14.6%
50 90,798 8.9%
31 34,654 4.3%
14 8,980 1.5%
2 590 0.9%
346 2,669,883 12.7%
New orders per year (2009-2017)
VLOCs (with up to fi fteen additional units to be reconfi rmed) were placed by Chinese, Korean and Japanese owners.
Yards that had appropriate contracts and keel laying certifi cates continued in 2017 to take newbuilding contracts on the basis of Common Structural Rules (CSR) requirements and IMO Tier II previsions. This enabled them to avoid the extra costs related to Harmonized Common Structural Rules (H-CSR) imposed as of 1 July 2015, and the new IMO Tier III NOx emissions as of 1 Jan 2016, especially in Japan. But this trend diminished in 2017.
Meanwhile the long-awaited implementation of the ballast water treatment regulations, which was supposed to come into effect in September 2017, was again postponed until September 2019.
In 2017, deliveries declined from 47.2m dwt to 38.5m dwt. At the end of the year, the dry bulk orderbook stood at 91m dwt and the dry bulk active fl eet had grown from 761m dwt to 800m dwt. Newbuilding orders represent about 11.3% of the active bulker fl eet broken down as follows:
• Handysize and Handymax: orderbook 7.0m dwt; fl eet 118.8m dwt; ratio 5.9%
• Supramax and Ultramax: orderbook 13.1m dwt; fl eet 162.4m dwt; ratio 8.0%
• Panamax and Kamsarmax: orderbook 21.3m dwt; fl eet 162.1m dwt; ratio 13.1%
• Post-Panamax and Babycape: orderbook 2.9m dwt; fl eet 53.9m dwt; ratio 5.3%
• Capesize and Newcastlemax: orderbook 17.9m dwt; fl eet 246.6m dwt; ratio 7.2%
Chinese shipbuilders consolidated their dry bulk market share at 60.9%, while Japan’s share fell from 34% to 27%. Korean shipbuilders, who had previously been forced out of this market due to the prevailing low prices, managed nonetheless to increase their market share from 1% to 8% in 2017. This was
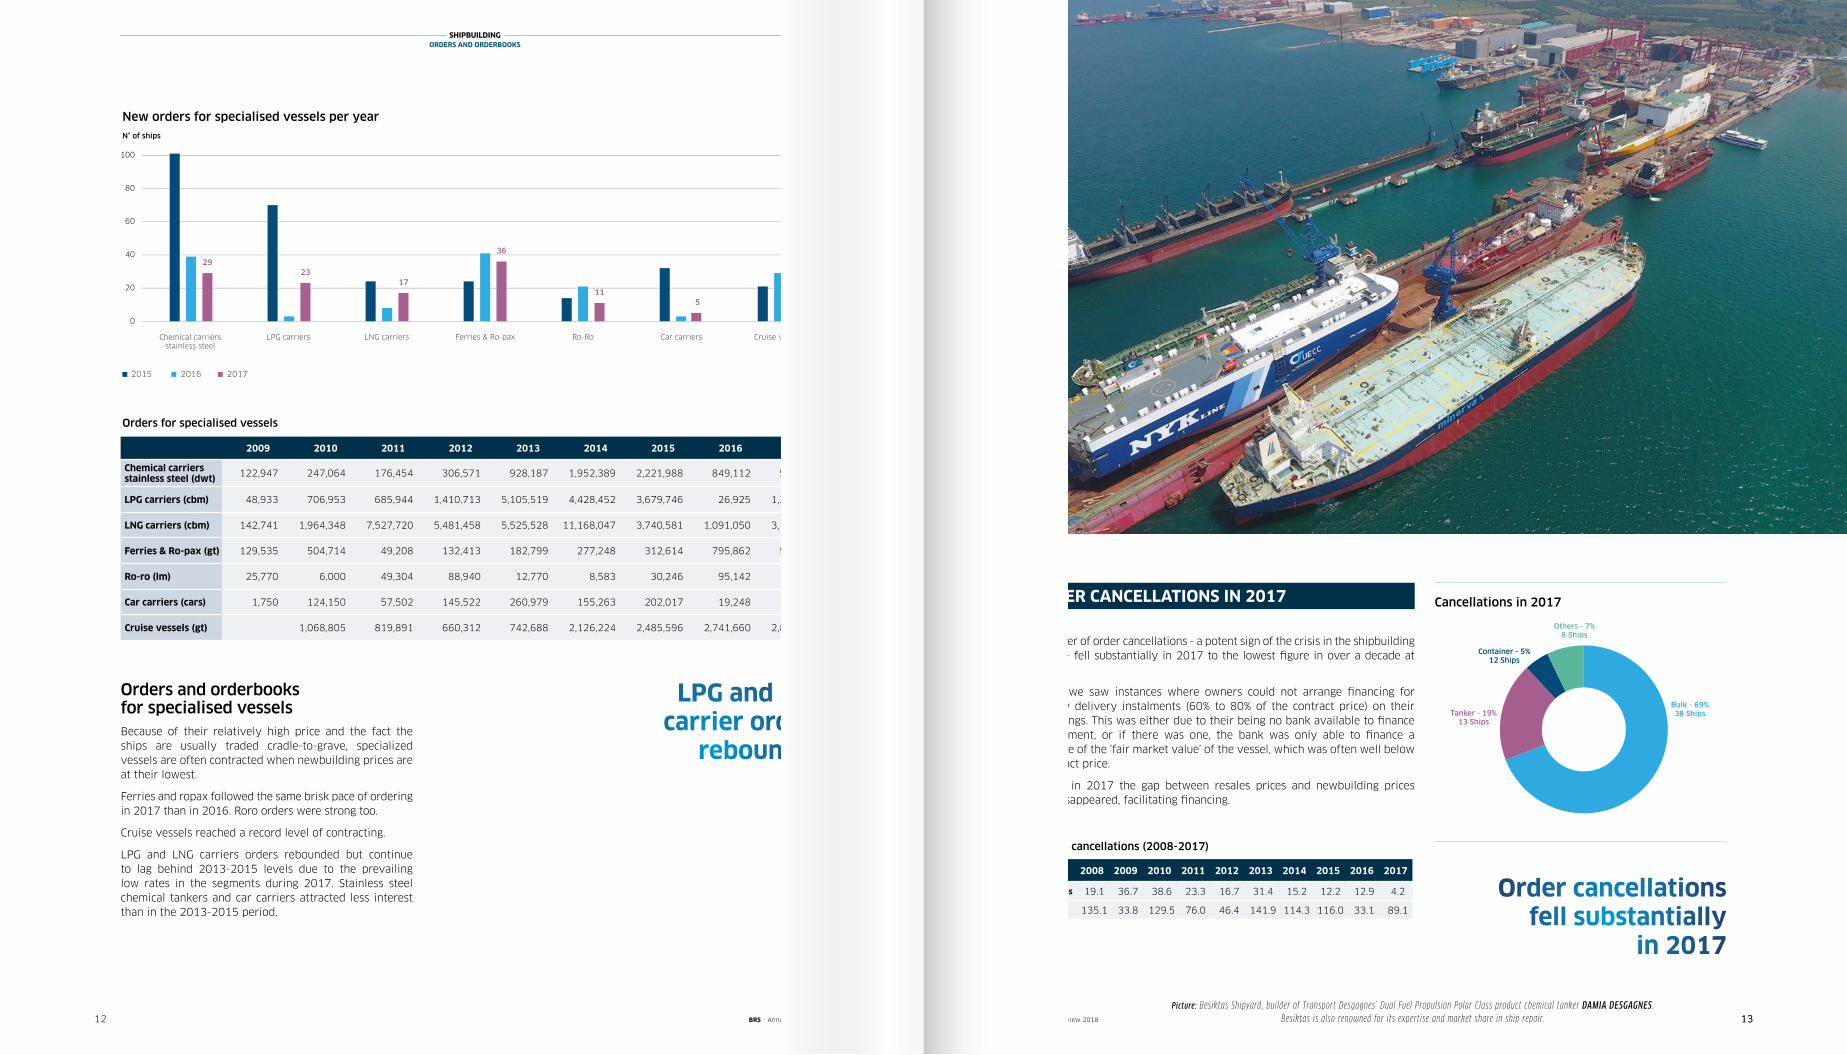
New orders for specialised vessels per yearN° of ships
Orders and orderbooks for specialised vesselsBecause of their relatively high price and the fact the ships are usually traded cradle-to-grave, specialized vessels are often contracted when newbuilding prices are at their lowest.
Ferries and ropax followed the same brisk pace of ordering in 2017 than in 2016. Roro orders were strong too.
Cruise vessels reached a record level of contracting.
LPG and LNG carriers orders rebounded but continue to lag behind 2013-2015 levels due to the prevailing low rates in the segments during 2017. Stainless steel chemical tankers and car carriers attracted less interest than in the 2013-2015 period.
LPG and LNGcarrier orders
rebounded
The number of order cancellations - a potent sign of the crisis in the shipbuilding industry – fell substantially in 2017 to the lowest fi gure in over a decade at 4.2m dwt.
In 2016, we saw instances where owners could not arrange fi nancing for tail-heavy delivery instalments (60% to 80% of the contract price) on their newbuildings. This was either due to their being no bank available to fi nance the instalment, or if there was one, the bank was only able to fi nance a percentage of the ‘fair market value’ of the vessel, which was often well below the contract price.
However, in 2017 the gap between resales prices and newbuilding prices almost disappeared, facilitating fi nancing.
Picture: Besiktas Shipyard, builder of Transport Desgagnes’ Dual Fuel Propulsion Polar Class product chemical tanker DAMIA DESGAGNES.Besiktas is also renowned for its expertise and market share in ship repair.
SHIPBUILDINGDELIVERIES AND WORLDWIDE SHIPBUILDING CAPACITY IN 2017
Tonnage sent for demolition in 2017 declined from 44m dwt in 2016 to 31.7m dwt, refl ecting the improved performance of the shipping market. That trend was accentuated in the bulk and container carrier markets where tonnage sent to scrap fell from 30.3m dwt to 14.2m dwt (bulk), and from 8.8m dwt to 5.6m dwt (container carrier). On the contrary, demolition in the tanker market rose from 2.5m dwt to 8.9m dwt.
The volume of demolished tonnage remains well below expectations and our forecast in January 2017 of a minimum 60m dwt. The fi nal amount also lagged behind the 2011-2012-2013 average of 48.6m dwt.
Demolition prices hovered between $270 and $440 per lightweight ton, a rise compared to 2016 mainly as a consequence of increased steel prices and a reduced supply of ships for scrap.
In spite of a growing commercial pressure from oil majors, oil traders, bulk cargo owners and port authorities to avoid trading vessels over 15 years (ships can no longer trade on the Yangtze river if they are over 16 years), this has not translated into large amounts of additional scrapping.
The average age of demolition remains high, at 24 years for both bulkers (up from 23 in 2016) and tankers (down from 27 in 2016).
The average age also rose for container carriers to 20 years in 2017 versus 22 years in 2015 and 19 years in 2016.
We expect however that the upcoming rules and regulations related to the implementation of the Ballast Water Treatment System (BWTS) regulations in September 2019, and the necessary compliance with reductions in NOx and SOx emissions as of 1 January 2020, will have a signifi cant impact on demolition rates.
Total shipyard deliveries fell slightly from 98.6m dwt in 2016 to 95.9m dwt in 2017. This was divided into 38.5m dwt of bulk carriers (down from 47.2m dwt in 2016), 38.4m dwt of tankers (up from 33.1 m dwt) and 12.5 m dwt of containerships (up from 10.2m dwt).
In China, annual shipbuilding production (which had increased sevenfold between 2006 and 2011 from 10m dwt to 69m dwt) inched up from 35.8m dwt in 2016 to 38.3m dwt in 2017.
In Japan, annual output (which rose from 28m dwt to 33m dwt between 2008 and 2010) slid from 21.6m dwt in 2016 to around 20.2m dwt in 2017.
In South Korea, annual production (which had previously doubled from 25m dwt to 53.4m dwt between 2006 and 2011) declined again in 2017 to 30.8m dwt from 35.9m dwt in 2016.
It is interesting to note that the number of active building facilities (yards that either won new contracts and/or delivered tonnage during a given year) fell again in 2017 to 302 facilities, after having dropped from a peak of 684 in September 2008 to just 311 at the end of 2016.
DELIVERIES AND WORLDWIDE SHIPBUILDING CAPACITY IN 2017
Historical Building Facilities per year & main areas (Excluding offshore)
CHINA JAPAN SOUTH KOREA EUROPE ROW N° of World Active Shipyards
N° of facilities
Japan Europe ROWChina
The volume of demolished tonnage remained well below expectations
Demolitions vs deliveries (2008-2017)
Shipbuilding in ChinaChina maintained its position as the world’s leading shipbuilder in 2017, ranking number one for its orderbook of 99.8m dwt (45% market share), number one for its 36.4m dwt of newbuilding orders (around 41%), and number one for its tonnage output of 38.3m dwt (around 40%).
At 36.4m dwt, Chinese yards secured around double the volume of orders in 2017 than in 2016 (17.3m dwt), although the increase was somewhat less than the global trend for the year. It is interesting to note that 80% of these orders were placed in just 11 shipyards out of the 105 so-called active building facilities in existence in 2017.
Handymax (H) 25 (H) 20 (S) 47-50 (S) 23-24 (U) 24(U)* 22-23 (U)
19-20 (H) 23-24 (U)* 21-22 (H)*
25.5 (U) 23 (H)
26.5 (U)24 (H)
Newbuilding prices (million $)
* Japan only, ** Prices at China’s 2nd tier yards are an estimated 5% lower
As a matter of fact, change came from the dry bulk market. An improvement in the bulk freight market, subsequent price increases in the second hand market, and a closing of the gap between newbuilding and resale prices (the ceiling of resales prices pushing the floor of newbuilding prices) all served to drive prices northwards.
This was assisted by an increase in the yards’ building costs (steel prices, new rules and regulations) plus a weakening in the US dollar versus the main shipbuilding currencies.
In 2017, newbuilding prices increased as follows:
• Bulkers from 15% to 20% for the larger sizes (Newcastlemax and Capesize)and from 5% to 10% for the smaller sizes (Handysize to Kamsarmax)
• Tankers by around 5% for the large sizes (VLCC) and 10% for the smaller sizes (MR2 to LR2)
Jan 2017 High Low Dec 2017 Variation Jan- Dec
VLCC 59.40 61.60 05 Jun 58.60 13 Feb 61.25 3.1%
Aframax 27.50 29.93 21 Aug 27.30 13 Dec 29.37 6.8%
MR Tanker 20.25 24.30 29 May 20.25 02 Jan 23.49 16.0%
Capesize 22.15 33.30 04 Dec 22.15 02 Jan 32.80 48.1%
Panamax 14.10 20.50 13 Nov 14.00 16 Jan 20.40 44.7%
Supramax 13.75 17.50 27 Nov 13.75 02 Jan 17.25 25.5%
Second hand price evolution during 2017 for 5 year old vessels (million $)
SHIPBUILDING IN THE WORLD
China2016 2017
m dwt Ships m dwt Ships
Orderbook
Market share 44.9% 1,351 44.9% 1,267
Bulk 55.9 516 55.5 478
Tanker 28.1 368 24.8 350
Container 16.1 262 15.5 248
All ships 104.7 1,351 99.8 1,267
Orders
Bulk 12.5 45 24.8 236
Tanker 3.1 68 7.3 116
Container 1.1 53 3.1 68
All ships 17.3 216 36.4 485
Deliveries
Bulk 22.3 275 22.4 237
Tanker 8.9 101 10.9 130
Container 2.8 65 3.7 79
All ships 35.8 532 38.3 519
With 24.8m dwt of dry bulk orders during the year, China continues to dominate this segment and bulk represented some two-thirds of its total order intake. But China had to concede supremacy in 2017 to Korea’s yards for tanker and container carrier newbuilding orders.
After a slight fall in deliveries in 2016, the Chinese shipbuilding industry managed to increase its production in 2017 to 38.3m dwt (roughly the same level as in 2015), and the ratio between the current orderbook and current output is now about 2.5.
In January 2017, the Chinese ministry in charge of the shipbuilding sector issued future guidelines, setting a goal that the top 10 national shipbuilders should represent more than 70% of domestic output by 2020. Data shows that in 2011 the top 10 shipbuilders in China accounted for 35% of the total delivery volume, a figure which reached 63.7% in 2017. After the industry’s expansion and privatization in the 2000s, consolidation and re-nationalization is the motto for the 2010s.
China ranked number one
for orderbook, new orders and output in 2017
Picture: SONANGOL CAZENGA , crude oil tanker, 156,899 dwt, delivered in 2017 by Korea’s DSME shipyard to Sonangol.
Back in 2016, the quasi-disappearance of new orders plus the intensification of competition from the second hand market sent newbuilding prices below what had previously been thought of as the ‘bottom’. Prices fell between 10% and 25% in 2016, depending on the type and size of ship, to reach new lows. To some extent, owners could dictate their own price to the yards, the implied reference being the level reached for yard resales.
At the start of 2017, the perception was that newbuilding prices had truly reached a bottom and that they could only rise again due to the enormous pressure on shipyards.
White List Since its inception in 2014, seven yards have been removed from the White List. Six yards were added in 2017 :
• Nantong Huatai • Jiangsu Dajin Co.Ltd• Tsuneishi Group (Zhoushan) Shipbuilding Inc.• Zhejiang Xinle • Fujian Changxin Heavy Industry Ltd. Co.• ZPMC Shanghai
A place on the White List can raise the profi le of yards in the shipping and banking communities but it is not a guarantee of success. Of the 70 yards currently on the White List, fewer than half took orders in 2017.
Consolidation, Restructurings and Bankruptcies
Newbuilding price pressure, a dearth of orders, yard closures and the realization of losses at both yards and banks are all driving further consolidation of the industry:
• CIMC and SOE: after a initial fruitless attempt in 2016, CIMC Enric, an affi liate of China International Marine Containers (CIMC), fi nally acquired Sinopacifi c Offshore & Engineering (SOE). SOE has a track record in the design and manufacture of LPG and LEG carriers, IMO type C tank liquid cargo handling systems for LNG and LPG carriers, as well as the production of marine oil and gas modules.
• CSSC and CSIC: 2018 could be the year of the merger of CSSC and CSIC. The rumour has become more and more persistent. The CSSC group split in 1999 into CSSC for South shipyards and CSIC for North shipyards. The merger of the two largest state-owned shipbuilding groups would have a major impact on the newbuilding industry.
• Qingshan: Qingshan Shipyard, an affi liate shipyard of state-run shipping and logistics giant Sinotrans & CSC, decided to quit shipbuilding as part of the parent group’s latest effort to cut capacity.
• GSI Liwan (downtown Guangzhou) will deliver its last newbuilding in 2018 and all future production will be carried out at GSI Nansha, which has been in operation since 2007 and was purchased by the GSI Group in 2011.
• Several state-owned companies invested in private yards in 2017:
- State-owned trading house Sumec took over ex Sinopacifi c Dayang which went bankrupt in 2016.
- State-owned shipyard Wuchang, part of CSIC Group, plans to buy 51% of the shares of Zengzhou shipyard located in the Zhoushan area.
- CIMC are in talks to invest some 50% in Zhoushan Changhong shipyard.
Chinese leasing companies
Chinese leasing companies have taken a prominent role in the ship fi nance industry in the wake of the diffi culties experienced by traditional ship fi nanciers. From 100 leasing companies with total assets of RMB 24 million in 2007, we counted 7,000 Chinese leasing companies at the end of 2016 with total assets of about RMB 5,330 billion.
China’s currency strengthened in
2017, increasing pressure on
building costs
Leading Chinese leasing companies specialising in shipping and offshore:
Currency
China’s currency weakened from about RMB 6.5 to the US dollar at the start of 2016 to RMB 6.95 at the end of the year, bringing some relief to the Chinese shipbuilding industry during the year. However, it went the other way in 2017, strengthening from RMB 6.69 to RMB 6.61 in 2017, increasing pressure on building costs.
Some signifi cant orders in 2017
• In 2016, ICBC Leasing, COSCO and China Merchant Group together placed a giant deal for thirty 400,000 dwt VLOCs at Chinese yards, with the ships to be chartered out to Brazilian mining giant Vale. Each company ordered ten ships, with the orders split between Yangzijiang (6 units), Beihai (8 units), SWS (14 units) and CMHI Jiangsu (2 units). One further Valemax was also contracted by Japanese owner NS with JMU. In 2017, Vale unexpectedly doubled down with another giant deal of thirty-seven VLOCs. Chinese yards again benefi ted, with 14 orders during the year: ICBC (China) placed 6 units with Beihai, Panocean (Korea) ordered 6 units with New Times and U-Ming (Taiwan) ordered 2 units with Beihai.
• CMA-CGM placed an order for nine 23,500 teu container ships with the CSSC group. Five units will be built by Hudong-Zhonghua and four at Shanghai Waigaoqiao Shipbuilding (SWS). This order is remarkable not only for the fact they will be largest container carriers ever built (loa 400 m, beam 61 m) but also because they will be equipped with dual fuel propulsion based on GTT membrane LNG bunker tanks.
• Maersk Tankers ordered ten 115,000 dwt LR2 product tankers at Dalian shipyard.
• BoCom Financial Leasing placed an order for six Suezmax tankers and four LR2 product tankers with New Times. These ships will be time chartered to the Trafi gura Group.
• CDB Financial Leasing ordered fi ve 208,000 dwt Newcastlemax bulkers at New Yangzijiang with an option for fi ve additional units.
• Mitsui OSK Lines signed contracts for four 174,000 cbm LNG carriers at Hudong-Zhonghua in connection with YAMAL LNG project.
• COSCO entered into multiple shipbuilding contracts: with Dalian Shipyard for four 319,000 dwt VLCCs and three 158,000 dwt Suezmax tankers; with GSI for two 64,900 dwt crude oil tankers, two 109,900 dwt product and crude oil tankers and three 114,000 dwt crude oil tankers.
• Sunstone contracted two 85-cabin ice class 1A expedi-tion cruise vessels with CMHI Jiangsu based on a design and a procurement package arranged from Scandinavia.
• Tsuneishi Zhoushan announced that it will build a 2,500-passenger cruiseship.
Company Total Value of Vessel and Offshore Assets (Billion $)
ICBC Leasing 10.81
Bank of Communication Leasing 7.52
Minsheng Financial Leasing 6.11
Cosco Shipping Leasing Co. LTD 5.64
CSSC Leasing 4.70
CMB Financial Leasing 4.70
CDB Financial Leasing 2.35
Civic Leasing 1.41
CCB Leasing 0.94
Others 2.82
Picture: BIT ECO , asphalt tanker, 9,922 dwt, built by Turkey’s RMK in 2017 for Tarbit Shipping.
Chinese leasingcompanies have taken a prominent role
Total assets committed by Chinese leasing companies
Billion RMB
109 142170 233
369
643
1,106
2,202
4,508
7,136
0
1,000
2,000
3,000
4,000
5,000
6,000
2007 2008 2009 2010 2011 2012 2013 2014 2015 2016
Billion RMB
Chinese Commitments of Finance Amount Companies
6.00
6.20
6.40
6.60
6.80
7.00
2015 2016 2017
Average Exchange Rates for the Yuan with the US$
companies
2011 2012 2013 2014 2015 201620102008 20092007
Average exchange rates of the Yuan to the US Dollar
Consolidation, Restructurings and Bankruptcies In 2017, the Korean shipbuilding industry continued its rigorous reorganization plan (building capacity reduction, labour cost cutting, lay-offs, closures). All the yards are intensifying their efforts to reduce building capacity and implement cost-cutting measures, under pressure from the authorities and national banks.
Hyundai Heavy Industries (HHI) successfully secured about 60% of the orders placed in Korea in 2017. It exceeded its order target by 33%, recording $10 billion of orders. HHI decided to shut down its yard facility in Gunsan but could reopen it in 2019 if at least 70 orders are won in 2018. However, HHI’s main yard in Ulsan is suffering from a lack of orders and it has asked 5,000 of its 17,000 employees to take unpaid leave. The shipbuilder shut two docks in its Ulsan yard. The company remains optimistic for 2018 and has set a sales target of $13.2 billion for 2018, nearly double its $7.5 billion target for 2017.
Samsung HI (SHI) exceeded its order target, achieving $6.9 billion of orders compared to a target of $6.5 billion. As part of an effort to boost liquidity, SHI is seeking the consent of all its employees to return 10% of their salaries over the past 10 months. SHI has already undertaken intensive cost-cutting measures as part of its rescue plan. By the end of 2017, SHI had shed as many as 5,600 of its 14,000 permanent staff. Anticipating losses in 2017 and 2018, SHI executed a KRW1.5 trillion ($1.3 billion) rights issue in December 2017 and laid off 30% of its executives. The company has set a sales target of $7.7 billion for 2018, up 18% from 2017. The new CEO Nam Joon-ou is forecasting an operating profit in 2019 due to cost-cutting and an expected increase in orders in 2018. SHI agreed to create a joint venture with Zvezda Shipbuilding Complex (Russia) to jointly manage the construction of ice-class shuttle tankers (42,000–120,000 dwt). These tankers will be deployed to ship crude oil produced by Rosneft and other Russian companies.
Daewoo Shipbuilding and Marine Engineering (DSME) fell short of its sales target of $6.2 billion with $2 billion of orders. DSME was especially hard hit due to an accounting fraud that resulted in a massive $2.8 billion loss for 2015. DSME’s main lenders, the Korea Development Bank (KDB) and the Export-Import Bank of Korea, launched a second rescue package worth KRW6.7 trillion ($6 billion), conditional on DSME cutting another 1,000 jobs and implementing more intensive cost-cutting measures. Hopefully, the yard has nearly completed the sale of its non-core subsidiaries, fulfilling its KRW5 trillion rescue plan. For 2018, DSME is aiming for more than $5 billion of orders.
Small and mid-tier shipbuilders are also struggling with falling orders and the reorganization of their building capacities and debt.
Hyundai Mipo Dockyard (HMD) is now largely dominating the small and mid-tier shipyard segment, accumulating about 60% of new orders placed at Korean small and medium size yards in 2017. It won 51 orders in 2017 against 25 in 2016, representing about 70% of its building capacity. Its main product is the MR tanker and the company succeeded in winning about 50% of these orders placed worldwide.
STX Offshore & Shipbuilding (STX) secured eleven orders in 2017 (six 50,000 dwt and five 11,200 dwt product tankers). This was vital for STX as their backlog ran only to the start of 2018. KDB agreed to issue the necessary bank refund guarantees. STX resumed restructuring efforts under its creditor banks’ direction after emerging from court protection in July 2017. STX has set a target of winning 20 orders in 2018 against 7 units in 2017. Some rumours are suggesting a possible merger of Sungdong and STX.
Work at Sungdong Shipbuilding & Marine Engineering came to a standstill after the shipbuilder delivered its last ship in October 2017, forcing its employees to go on unpaid leave. Pending orders, including five 115,000 dwt tankers from Kyklades Maritime, have not been confirmed as Sungdong’s banks are withholding refund guarantees over concerns that the ships are underpriced. However, officials of South Gyeongsang province where the shipyard is based refused to give up and have appealed for government and bank support.
Dae Sun Shipbuilding and Engineering secured nine ships in 2017 (6 small containerships and 3 small tankers). Korea Eximbank and other creditor banks have been working with Dae Sun to restructure its debts. KExim has not ruled out selling the yard in due course.
Daehan Shipbuilding, now under the management of DSME, secured orders for six Aframaxes in 2017 after receiving no orders in 2016.
Hanjin Heavy Industries & Construction (HHIC) entered into an autonomous restructuring agreement in 2016 with its main creditor, Korea Development Bank (KDB), after incurring debts of more than $1 billion. The engineering subsidiary Korea Engineering Consultants Corp is set to be taken over by its employees. HHIC is now concentrating on the construction of merchant ships at its yard in Subic Bay in the Philippines. No order has been registered at Hanjin Busan since 2015.
SPP Shipbuilding (SPP) shut down in 2017 having run out of orders and failed to find a buyer. Liquidation appears to be inevitable. The shipbuilder’s banks, led by main creditor Woori Bank, appear to have given up hope that SPP can be revived, with the last two vessels in its orderbook nearing completion without any new contracts.
Shipbuilding in South KoreaAfter having lost its place as the world’s second largest shipbuilder in 2016 to Japan, Korea rebounded sharply in 2017. It reclaimed its position, ranking number two for its orderbook of 55.1m dwt (25% market share), number two for newbuilding orders of 35m dwt (around 39%), and number two for its tonnage output of 30.8m dwt (around 32%).
This turnaround was the result of a strong push to win more newbuilding orders, and the country logged an increase far above the global trend (35m dwt in 2017 vs 6.6m dwt in 2016). In 2017, the world’s largest shipbuilder, Hyundai Heavy Industries (HHI), exceeded its order target by 33%, recording 20.6m dwt of orders. SHI also exceeded its order target, achieving 4.7m dwt of orders, while DSME, struggling with a financial crisis, fell short of its target at 5.6m dwt. Overall, the ‘Big 3’ secured 88% of all orders placed in South Korea in 2017.
Korea’s shipbuilders remain extremely strong in the tanker segment, capturing about 61% or 22.3m dwt of tanker orders worldwide. The remaining 13.9m dwt was split 7.3m dwt for China, 3.8m dwt for Japan, 1.0m dwt for Europe and 1.8m dwt for the rest of the world.
Some significant orders in 2017
• HHI returned to the dry bulk market in 2017 after three years without orders, securing 6.9m dwt of VLOC contracts for the Vale project (21 units of 325,000 dwt, ordered by H-Line (4 units), Polaris (15 units) and Korea Line (2 units).
• HHI secured an order to build up to six LNG-fuelled Aframax tankers for Russian shipowner Sovcomflot, which will trade in the Baltic and North European areas.
• MSC placed an order (concomitantly with their rival CMA CGM) for eleven 23,500 teu container ships with DSME and SHI. In contrast to the CMA CGM orders, these ships will not be equipped with dual fuel propulsion.
South Korea2016 2017
m dwt Ships m dwt Ships
Orderbook
Market share 22.0% 475 24.8% 422
Bulk 1.3 10 7.0 23
Tanker 31.9 253 33.4 240
Container 8.9 60 7.1 50
All ships 51.4 475 55.1 422
Orders
Bulk 0.05 1 6.9 21
Tanker 5.3 52 22.3 143
Container 0.6 4 4.1 31
Gas 0.5 7 1.6 26
RoRo 0.0 0 0.07 4
All ships 6.6 66 35.0 225
Deliveries
Bulk 5.9 34 1.2 8
Tanker 19.7 177 20.1 152
Container 5.7 47 5.8 41
All ships 35.9 341 30.8 272
Picture: STENA IMMACULATE, MR2 tanker, 49,729 dwt, delivered by GSI in 2017 to Stena Bulk, part of a 13-ship contract.
Small and mid-tier shipbuilders are struggling with
falling orders
Korea rebounded sharply in 2017, regaining its number two position
Shipbuilding in JapanIn 2016, Japan moved up to become the world’s second largest shipbuilding nation based on the size of its orderbook and orders won, overtaking Korea, which nevertheless remained ahead of Japan on volume of deliveries. In 2017, Japan could not retain this advantage. Japanese shipyards secured around 40% more orders in 2017 compared to 2016 (11.9m dwt versus 7.7m dwt), however the increase was less than the global trend for the year. Its orderbook decreased from 62m dwt to 53.1m dwt and its market share receded from 26.6% to 23.9%
Japan remains a strong player in the bulk segment, with a significant increase in new dry bulk orders in 2017 (7.2m dwt versus 2.4m dwt in 2016). In terms of tanker orders, yards secured around the same volume as 2016 (3.8m dwt).
Some 28 Japanese shipyards recorded an increase in orders in 2017, while the three largest (JMU, Oshima and Imabari) counted for 70% of total new orders, underlining the on-going concentration in the shipbuilding industry.
Some newsworthy events of the year
Japan considers shipbuilding as a strategic industry and plans to reinvigorate the sector, targeting a 30% market share of completed ships by 2025. New technologies, alliances and consolidations make up the major elements of Japan’s strategy to recover market share. Industrial groups whose main activity is focused on shipbuilding, such as Imabari, Oshima, Namura, JMU, Tsuneishi and Shin Kurushima, will continue to adapt and expand so as to compete with their Chinese and Korean counterparts. Shipbuilders that are part of larger industrial companies, such as MHI, KHI, MES and Sumitomo HI, for which shipbuilding represents a minor part of total turnover, might in the years to come withdraw gradually from shipbuilding activities.
Japan lost its second place in 2017
Japan2016 2017
m dwt Ships m dwt Ships
Orderbook
Market share 26.6% 901 23.9% 717
Bulk 31.2 435 24.7 325
Tanker 18.2 266 17.7 225
Container 8.3 68 7.1 55
All ships 62.0 901 53.1 717
Orders
Bulk 2.4 29 7.2 97
Tanker 3.9 56 3.8 37
Container 1.1 9 0.5 7
All ships 7.7 112 11.9 166
Deliveries
Bulk 17.1 241 13.7 205
Tanker 3.0 66 4.3 75
Container 0.6 7 1.6 12
All ships 21.6 366 20.2 337
• Mitsubishi Heavy Industries (MHI) reached agreement with Imabari Shipbuilding, Namura Shipbuilding and Oshima Shipbuilding to form an alliance in the commercial ship business. This alliance will allow them to enhance their competitiveness in shipbuilding, focus on core engineering capabilities such as development of new ship designs and technologies, standardization of design and construction, and efficient shared use of tools and equipment.
• After a failed attempt in 2013 to merge with Kawasaki Heavy Industries (KHI) due to internal opposition in KHI, Mitsui Engineering & Shipbuilding (MES) reached an agreement with its compatriot and rival Tsuneishi Shipbuilding to form an alliance to compete with Chinese and Korean rivals. The plan is to design and build merchant ships jointly, especially bulkers. MES is also preparing a spin-off plan that will see its various business units become separate entities.
• Imabari Shipbuilding is progressively taking control of its rival Minami Nippon. Agreements have been signed to buy 25% of the shares from MES and 24% from MES shipping affiliate Mitsui OSK Lines (MOL). Imabari acquired Tsuneishi’s subsidiary Tadotsu Shipyard in 2013 and Koyo Dockyard in 2014. It now controls 11 separate shipbuilding sites and has tied up a business cooperation pact with Mitsubishi Heavy, Oshima Shipbuilding and Namura Shipbuilding. It also built a new very large dock in Marugame (610-metre-long dock equipped with three 1,330-ton Goliath cranes) to accommodate ULCS, VLCC and VLOC. The owning Higaki family has confirmed its ambition to revitalise the local economy by investing in shipbuilding in Japan rather than shifting production abroad with new facilities, as has been the strategy of compatriots Tsuneishi Shipbuilding and Kawasaki Heavy Industries.
• Fukuoka Shipbuilding has acquired Watanabe Shipbuilding. Both shipbuilders are based on Japan’s southern island of Kyushu. Fukuoka specialises in building stainless steel chemical tankers, while Watanabe previously took orders for small general cargo ships, tankers, and LPG carriers.
• Japanese shipbuilder Kawasaki Heavy Industries (KHI) will recognise an extraordinary loss of JPY13 billion ($115.3 million) after agreeing mutually with Norway’s Island Offshore to cancel an order for a top hole drilling light well intervention vessel. Island Offshore, through subsidiary Island Navigation, placed the order in 2013 and at the time, KHI sought to diversify into the building of offshore vessels amid high oil prices.
Shipbuilding in EuropeEuropean shipyards maintained their world market share in 2017 at about 2%. After steady increases between 2013 and 2015 (from 2.7m dwt to 5.8m dwt), the European orderbook shrank in 2016 and 2017 to finish the year at 4.2m dwt. This was mainly due to the fact that Daewoo Mangalia shipyard, the main European contributor in deadweight tonnage, is now up for sale as part of the recovery strategy of parent company DSME, and as a result did not take any new orders.
The number of new European orders fell slightly from 90 ships in 2016 to 76 in 2017 but in terms of deadweight tonnage, volumes almost doubled (from 0.8m dwt to 1.3m dwt). The main contribution came from Russia’s shipyards
Europe2016 2017
m dwt Ships m dwt Ships
Orderbook
Market share 2.0% 266 1.9% 252
Bulk 0.1 8 0.1 4
Tanker 3.0 75 2.8 66
Container 0.01 2 0.01 1
All ships 4.6 266 4.2 252
Orders
Bulk 0.00 0 0.00 0
Tanker 0.1 17 1.00 21
Container 0.0 0 0.0 0
Cruise 0.23 28 0.18 28
All ships 0.8 90 1.3 76
Deliveries
Bulk 0.6 6 0.04 4
Tanker 0.7 22 1.2 30
Container 0.2 2 0.0 1
Cruise 0.09 9 0.09 9
All ships 1.9 74 1.7 90
which secured around 0.65m dwt of new orders, mainly at Zvezda yard with contracts from Sovcomflot/Rosneft.
The surge in newbuilding orders by the cruise industry, which started in 2013, shows no sign of abating. A total of 37 cruiseships were contracted in 2017, mainly with the three major shipbuilders, Meyerwerft, Fincantieri, and STX France, which together signed up 20 units. Other major European yards such as Vard, Kleven and Ulstein in Norway, Barreras in Spain, De Hoop in the Netherlands and West Sea in Portugal managed to win 11 orders between them. 2017 will go down as a record year, after a total of 29 orders in 2016, 21 in 2015, 16 in 2014, 10 in 2013 and 4 in 2012. The orderbook of the four major European cruise shipbuilders now stretches until 2025.
The depreciation of the euro versus the dollar, which started in the summer 2014 and brought the euro/dollar rate of exchange from 1.35 $/euro during the first half of 2014 to an average of 1.10 $/euro during 2015 and 2016, proved helpful in reducing the price gaps with Asian shipyards. But in 2017 the continuous appreciation of the euro versus the dollar from 1.04 $/euro in January to 1.20 $/euro at the end of December hindered efforts by Europe’s shipyards to attract more orders for sophisticated tonnage aside from cruiseships
Europe’s shipyards are now under pressure, and they are losing ground in what used to be one of their fields of expertise, ferries and ropax. Several of these contracts were placed with Chinese yards (Stena’s ropax at Avic Weihai, DFDS’ roro at Jinling, and Viking Line’s ferry at Xiamen). It is likely that some other European companies will follow suit, although Flensburger and Visentini managed to capture some key ferry contracts.
Picture: STOLT TENACITY , stainless steel chemical tanker, 38,907 dwt, delivered by China’s Hudong-Zhonghua in 2017 to Stolt Tankers.
• Russian and “Big 3” South Korean shipyards have signed several joint ventures :
- Zvezda shipyard and Samsung HI created a joint venture to co-manage the construction of ice-class shuttle tankers (42,000–120,000 dwt). Rosneft has already placed an order for ten Arctic shuttle tankers of 42,000 dwt at Zvezda shipyard and also a letter of intent to build ice-class 70,000 dwt shuttle tankers. These tankers will be deployed to ship crude oil produced by Rosneft and other Russian companies.
- Far Eastern Design Institute Vostokproektverf, a subsidiary of Russia’s Far Eastern Shipbuilding and Repair Center (FESRC), and Daewoo Shipbuilding & Engineering Co Ltd (DSEC), formerly the ship design subsidiary of Daewoo Shipbuilding & Marine Engineering (DSME), signed a joint venture agreement to provide design, engineering, procurement, management and supervision services.
- Zvezda shipyard and Hyundai HI created a joint venture to cooperate on building LNG-fuelled Aframax tankers for Rosneft.
• The French and Italian authorities fi nally came to an agreement over the future of STX France. The deal will split ownership of the French shipbuilder on a 50/50 basis but gives Fincantieri the majority it was requesting. France will loan 1% of the company’s capital to Fincantieri, thus giving it provisional control, as well as the chairmanship of its board and the right to appoint the chief executive. The loan will have a 12-year term and the agreement between the two governments provides for regular reviews to ensure that its provisions are respected. France will hold 34.34% of STX, Naval Group 10% percent, STX employees up to 2.4% and local suppliers up to 3.26%. The partners must now fi nd a new name for the yard.
• Dutch shipbuilder Damen, which already owns the Damen Galati shipyard in Romania and wishes to build larger ships, agreed to buy a majority stake in Daewoo Mangalia from DSME. However, the future is not clear as the Romanian government, which already has a 49% stake in the facility, indicated in early 2018 it might exercise its pre-emption rights to acquire the remaining 51%.
• Russia’s shipbuilding industry jumped up seven places in 2016 to take the lead position in 2017, going from 0.2m dwt to 1.1m dwt on the back of several large domestic orders including four Aframax tankers with LNG propulsion from Sovcomfl ot and ten Artic shuttle tankers from Rosneft placed with Russian state-owned Zvezda Far Eastern Shipyard.
• The Spanish shipbuilding industry retained its second position in 2017 thanks to the six Suezmax tankers ordered by Ibaizabal with Navantia Puerto Real to be delivered in 2018. Barreras succeeded in entering the exclusive club of cruiseship builders with an order for a 300 passenger luxury cruiseship from Ritz Carlton. However, dredger and ropax specialist La Naval sought bankruptcy protection.
• Croatia meanwhile retained its third position, even if it did not secure any orders in 2017 and is currently experiencing some diffi cult times. The country relies on three yards: Uljanik/3Maj, Trogir and Brodosplit. The Croatian authorities are fi nalising a plan to restructure the Uljanik Group which would seek new investors and inject fresh cash to pay off debt.
• Romania is now in fourth position, having lost its leading position in Europe (orderbook of 0.3m dwt at end 2017 versus 1.5m dwt end 2016). It follows the lack of new orders at Daewoo Mangalia (DMHI) and the decision by parent DSME to sell the facilities as part of its own rescue strategy. But Romania can count on its other shipyards, such as Constanta, Vard Tulcea, Vard Braila and Damen Galatz.
• The Turkish shipbuilding industry has been able to maintain its sixth ranking in spite of the political uncertainty since the country’s failed coup in July 2016. It is interesting to note that Turkish yards secured orders for 10 ships (tankers, ferries and general cargo for foreign accounts) in 2017.
• Norway’s shipyards, which had lost a number of customers with the offshore crisis, managed very well in 2017 and took 15 newbuilding orders out of the 76 placed in Europe across nine different shipyards, rewarding them with fourth position in number of ships.
Romania lost its leading position in Europe
• The 8 largest shipbuilders in Europe (ranking in GT)
Ranking Europe’s shipyards on the basis of Gross Tonnage (GT) instead of Deadweight highlights those orderbooks based on high-value vessels with relatively small deadweights but larger gross tonnage. Ranking on this basis produces a totally different list, with the top four European shipbuilding nations being respectively Italy, Germany, France and Finland.
Orderbook of European Shipyards Gross Tonnage Ships on order
Meyerwerft (Papenburg+Neptun+Turku) 4,449,566 28
Fincantieri 3,047,826 29
STX France 1,786,500 11
Navantia 495,632 6
Uljanik + 3 MAJ 420,275 13
Vard 167,054 17
Ferus Smit 85,335 15
ROW2016 2017
m dwt Ships m dwt Ships
Orderbook
Market share 4.7% 234 4.6% 227
Bulk 2.8 45 4.0 54
Tanker 4.0 69 3.8 70
Container 3.1 44 1.8 32
All ships 10.9 234 10.2 227
Orders
Bulk 0.0 0 2.4 27
Tanker 0.0 7 1.8 34
Container 0.0 3 0.20 6
All ships 0.6 35 4.4 83
Deliveries
Bulk 1.4 22 1.2 18
Tanker 0.9 27 2.0 31
Container 1.0 11 1.7 20
All ships 3.6 81 5.0 90
Shipbuilding in the Rest of the WorldThe orderbook in the Rest of the World (RoW) shipyards decreased slightly from 10.9m dwt to 10.2m dwt in 2017, albeit they retained about the same market share at 4.6%. But newbuilding orders jumped from 0.6m dwt (35 ships) to 4.4m dwt (83 ships), the highest since 2015. Four shipyards - HVS (Vietnam), CSBC (Taiwan), Tsuneishi Cebu and Hanjin Subic (The Philippines) - were responsible for more than 95% of the new orders.
With the exception of 2016, deliveries have been growing since 2008, from 2.5m dwt in 2008 to 5.0m dwt in 2017.
• The Philippines remains by far the leader of the “Rest of the World” shipbuilding group with 56% of the total orderbook against 30% in 2016 (30% of the orderbook for Tsuneishi Cebu and 24% for Hanjin Subic).
• Vietnam consolidated its second position thanks to HVS which took 89% of the new orders in 2017. The country counts some other foreign-controlled shipyards such as Vard Vung Tau and Triyards, with the latter unfortunately experiencing some fi nancial diffi culties.
• Taiwan remained in third position but CSBC shipyard saw its orderbook shrink with only two Capesize contracts secured in 2017.
• The United States maintained its fourth position thanks to the order of two 2,500 teu containerships with LNG propulsion from the Pasha Group at Keppel AmFELS.
• Brazil is slowly emptying its orderbook, with no orders taken in 2016 or 2017. Only one shipyard, Eisa Ilha, still has orders (4 tankers and 3 containerships) lasting until 2019. Brazilian yards have been caught in the fallout from the Petrobras bribery scandal.
• Bangladesh displayed a great deal of dynamism in 2017 and now has an orderbook of twenty nine units to be built at nine different shipyards. It currently holds sixth position. The main yards are Western Marine and Meghna.
• Saudi Arabia’s Ras Al Khair Shipyard opened in 2017. Its ambition is to become the largest shipbuilding and repair facility in the Middle East thanks to its venture partners Saudi Aramco, National Shipping Company of Saudi Arabia (Bahri), Lamprell, and Hyundai Heavy Industries (HHI).
There is a growing pressure to phase out old tonnage
Newbuilding prices rose signifi cantly in 2017. That increase was driven by:
• Increased building costs, deriving mainly from: the rise in steel prices, implementation of new rules and regulations, the weakening of the US dollar against the Yuan, Won, Yen, Euro (the currencies of the main building countries).
• A reduction in shipbuilding capacity in Korea, China and Japan, exacerbating competition.
• An increased reluctance by shipyards to take on loss-making contracts.
• A rise in newbuilding orders: about 89m dwt in 2017 versus 33m dwt in 2016, reducing the pressure on shipbuilders.
We believe that prices will continue to rise in 2018 and intensify in the years to come, driven by age limits, technical obsolescence and fuel emission regulations.
Age limitThere is a growing pressure to phase out old tonnage, both in the oil industry and elsewhere.
While there are no written rules about age limitation, it is clear where the market is moving. Five years ago, the age limit for a VLCC or Suezmax tanker was 20 years. Since then it has dropped to 18 years, and more recently to 15 years. Those prepared to compromise on age were typically Far Eastern charterers, mainly Chinese and Korean, plus a handful of traders. But that is also changing. Chinese oil majors, namely UNIPEC, the largest VLCC charterer in the world, initially introduced a restriction of ‘cap 1 on hull and machinery’ but subsquently opted to enforce a maximum 15 years. All other Chinese charterers had to follow. Korean charterers for their part now also prefer maximum 15 years. Traders are also following the trend, with some saying that they will also not be able to fi x tankers over this age. There is a preference for less than 15 years in the Aframax market, particularly due to the current low market and over-supply of tonnage, but a number of charterers still fi x tankers above 15 years.
In the clean products market, spot charters are more fl exible but some oil majors have been requested by their vetting departments to try to retain the younger vessels on offer, and going above 15 years looks now more and more improbable. Meanwhile, if most traders have no real constraints, the clean products market requires a certain fl exibility: when ships are fi xed, the cargoes are rarely sold and the tankers will have to be approved by the oil major receivers that control many of the destination terminals. Thus, even if a charterer would accept older tonnage, it has to rely on the trading chains and structures that involve suppliers, charterers, receivers, insurers, bankers and it is likely that somewhere along the chain an older ship may get rejected.
As a consequence, the older vessels are likely to enter alternative niche trades at often lower rates and with less known and demanding charterers. However, the question remains whether some charterers will be tempted by older and cheaper vessels once markets improve.
Some countries have also introduced new rules to protect sensitive navigation areas or ports. For instance, China’s Ministry of Communications stipulates that oil tankers, chemical tankers, LPG tankers and bitumen tankers operated on the Yangtze River must be less than 16 years.
Looking at the demolition table above, it is interesting to note that the average age of demolition for bulkers, tankers and container carriers has fallen from 31, 30 and 29 years respectively in 2008 to 24, 24 and 20 in 2017. Old ships are not welcome any more.
Technical obsolescenceIs the industry really serious in its undertaking to get rid of old tonnage or will that concern disappear as soon as the freight market improves?
There is a legitimate argument that old tonnage should be eliminated to minimize risk, a risk that is further compounded in a poor freight market where maintenance costs are under pressure.
But if the fl eet can be divided today between old and young tonnage, it can also be divided between non-eco (non-economic) designs and eco (economic) designs. In addition to economic pressure, there is a growing pressure from international authorities to reduce noxious emissions, be they SOx, NOx, CO2
or particle matters. This push favours eco designs and now so-called super-eco designs are emerging, where the difference in daily fuel consumption with non-eco designs has become signifi cant. This should contribute to the phasing out of older tonnage.
Picture: PALANCA MIAMI , asphalt tanker, 36,681 dwt, delivered in 2017 by Korea’s Hyundai Mipo to Wisby Tankers.
So-called ‘‘super-eco’’ ship designs
are emerging
Laden(Knt)
Super Eco(mt)
Eco (mt)
Non Eco(mt)
VLCC 13 46 52 80
Suezmax 13 - 40 48
Aframax 13 - 32 40
Panamax 13 - 25 30
MR2 13 - 20 28
Capesize 13 33 43 48
Kamsarmax 13.5 - 29 31
Supramax 13.5 - 25.5 33
Tan
ker
sB
ulk
ers
Fuel consumption comparison
It is interesting to note that out of the four criteria generally used to quantify pollution from exhaust gases i.e: SOx, NOx, CO2 and PM2.5 (Particle Matter below 2.5 mm), LNG is by far the cleanest when compared to other types of propulsion: 3.5% HFO, or 3.5% HFO with scrubbers, or LSFO (Low Sulphur Fuel Oil) – see table.
If IMO regulations have focused over the years on SOx, NOx and CO2 in exhaust gas emissions, most health indices globally are generally based on PM2.5, as it is believed that particle matters are the main source of cancers.
On that count, LNG with 0 PM proves for the moment unbeatable, another reason why LNG could prevail in the near future despite additional investment costs and/or the current lack of logistics. The car industry is gradually phasing out diesel.
This will also have an impact on the demand for future newbuildings.
The 1st January 2020 deadline capping the sulphur content in Heavy Fuel Oil (HFO) at 0.5% is coming soon and the marine fuel bunker market is set to undergo profound change.
So far, refi ners have managed to adjust production in line with the industry’s requirements, which have changed as sulphur limits were fi rst set in the Emission Control Areas (ECAs), and then on a global basis.
This time, however, there are some doubts that suffi cient MGO and other compliant fuels will be available in every port on 1st January 2020, simply because of the magnitude of the shift. ECA areas represent a tiny proportion of the fuel consumption. Refi nery output of compliant 0.5% HFO will increase and production of 3.5% HFO will decrease proportionally. But the change will still be a shock that will impact the price of MGO and 0.5% HFO, and therefore the cost of transportation.
As a consequence, it is expected that the industry will give priority to eco or super-eco designs, while vessel scrapping will rise and slow steaming will increase. As a further consequence, more newbuildings will be needed.
Of course, there is also some doubt whether or not the legislation will be enforced. And perhaps this is why forward prices for MGO fuel from 2020 onwards today (in early 2018) remain fl at. But:
• Over 90% compliance with the new cap is expected, as the 89 states that have ratifi ed Annex VI represent more than 90% of seaborne trade
• An amendment to Marpol Annex VI which prohibits the carriage of non-compliant fuel oils and makes it an offence is expected to be approved and come into force on 1st March 2020. Port State will only need to prove carriage of non-compliant bunkers, not actual use
• Enforcement will be by Port State Control, using MARPOL samples, remote sensing or portable devices, and possibly open-sea monitoring. Heavy penalties for non-compliance and criminal offence in some states will be implemented
A massive uptake of scrubbers in existing ships is not expected either. This is because they are costly (anything between several million dollars for a MR2, up to $10m for a VLCC) and because the availability of 3.5% HFO will become uncertain.
Scrubbers were originally devised as a solution to reduce today’s 3.5% sulfur content to the 0.1% sulfur level needed in Emission Control Areas (ECAs). Could scrubbers be a global solution after 2020?.
Besides, it should not be forgotten that scrubbers require a lot of energy to run (between 400 kW for a MR2 and up to 4,000 kW for a large cruiseship). In short, to avoid SOx, we are prepared to inject tons of CO2 in the air and drop tons of acids in the sea!
It is likely that 0.5% HFO will come in greater supply because that is what the market requires and also that a greater quantity of 0.1% HFO will also be available and that the prices will then readjust and come down.
There is scepticism that scrubbers are a good global solution for the shipping industry, and thus dual fuel propulsion could become an interesting alternative. Container carrier operator CMA CGM opted to order nine megamax container carriers (loa 400 m, beam 61 m, capacity 23,500 teu) that will be propelled with a dual fuel engine. That decision by a major owner will certainly be followed by others.
The marine fuel bunker market is set to undergo profound change
HFO 3.5% HFO + Scrubber LSFO 0.1% LNG
SOX 100 10 10 0
NOX 100 94 100 14
CO2 100 58 100 80
PM 100 100 37 0
Picture: CASTILLO DE TEBRA , Stainless steel chemical carrier, 13,020 dwt, delivered by Ningbo Xinle in 2017 for Elcano..
Consolidation of the industry andreduction in shipbuilding capacityThe shipbuilding industry is now in its ninth year of challenging conditions following the collapse of Lehman Brothers in 2008. This is a very long period of time both by historical standards, and in a world which has become used to faster cycles.
As mentioned above, be it in China, Korea, Japan or Europe, efforts are now underway to push for a reduction in worldwide shipbuilding capacity. The shipbuilding industry is restructuring either through massive capacity reductions on a voluntary basis (consolidation and restructuring), or on a forced basis (closure due to bankruptcy or lack of orders).
The number of active building facilities has fallen from 684 at its peak in 2008 to 302 in 2017.
Some shipbuilding capacity is also being transferred to the naval sector, where the race for rearmament has intensifi ed.
We believe there are a number of factors which suggest the market could recover sometime in 2018-2019, after which newbuilding prices will rise.
New ordersWe underestimated in last year’s review the amount of newbuilding contracts that would be placed in 2017, predicting between 40m and 50m dwt versus the 89.1m dwt actually ordered. We thought that the unique order of thirty 400,000 dwt VLOCs in 2016 was unlikely to be repeated. In fact, a total of thirty-seven VLOCs were ordered in 2017.
It appears that dry bulk and container freight markets have improved in what is now a more dynamic worldwide economy, and that rising second hand prices are also pushing up newbuilding prices. However, even if they are on the rise, newbuilding prices remain low and could still trigger interest among shipowners looking to take advantage of the market cycle.
We would therefore estimate that about 90m to 110m dwt should be ordered in 2018.
DeliveriesTheoretically, deliveries could reach about 105m dwt in 2018. We believe that there will be relatively little slippage and cancellation, and that actual deliveries in 2018 could reach a fi gure between 95m and 105m dwt.
CancellationsIn view of the fi gures recorded for 2017, we expect cancellations to be marginal in 2018.
DemolitionsAlthough demolitions came in lower than estimated last year at 31.7m dwt, several factors should favour a stronger demolition market in 2018 than in 2017. Therefore we estimate between 40m and 50m dwt of tonnage could be scrapped in 2018.
Newbuilding prices will continue to rise in 2018 due to greater demand and rising building costs. Much will also depend on the strength of the dollar versus the currencies of the main shipbuilding nations. The dollar appreciated against most of the currencies in 2016, helping yards reduce prices, but this situation changed in 2017. Steven Mnuchin, US treasury secretary, said openly at the World Economic Forum in Davos this year that a weak US dollar is good for America First. However, many pundits are unsure why the dollar lost some 16% of its value against a basket of currencies last year at the same time the US economy is performing strongly and the gap between US interest rates and foreign interest rates has never been so wide - both factors that in principle support a stronger US dollar.
NEWBUILDING PRICES OUTLOOK
Newbuilding prices will continue to
rise in 2018 due to greater demand and rising building costs