SUB 1-MILLIMETER SIZE FRESNEL MICRO SPECTROMETER Yeonjoon Park National Institute of Aerospace, Hampton, VA, 23681, USA Laura Koch, Kyo D. Song Optical Engineering, Dept. of Engineering, Norfolk State University, Norfolk, VA, 23504, USA SangJoon Park Chemistry Dept., Kyungwon University, Kyungki-do, 461-701, Korea Glen King, Sang Choi NASA Langley Research Center, Hampton, VA, 23681, USA Abstract An ultra-small micro spectrometer with less than 1mm diameter was constructed using Fresnel diffraction. The fabricated spectrometer has a diameter of 750 micrometers and a focal length of 2.4 mm at 533nm wavelength. The micro spectrometer was built with a simple negative zone plate that has an opaque center with an ecliptic shadow to remove the zero-order direct beam to the aperture slit. Unlike conventional approaches, the detailed optical calculation indicates that the ideal spectral resolution and resolving power do not depend on the miniaturized size but only on the total number of rings. We calculated 2D and 3D photon distribution around the aperture slit and confirmed that improved micro-spectrometers below 1mm size can be built with Fresnel diffraction. The comparison between mathematical simulation and measured data demonstrates the theoretical resolution, measured performance, misalignment effect, and improvement for the sub-1mm Fresnel micro- spectrometer. We suggest the utilization of an array of micro spectrometers for tunable multi-spectral imaging in the ultra violet range. https://ntrs.nasa.gov/search.jsp?R=20100033750 2018-05-05T09:48:44+00:00Z
Transcript
SUB 1-MILLIMETER SIZE FRESNEL MICRO SPECTROMETER
Yeonjoon Park
National Institute of Aerospace, Hampton, VA, 23681, USA
Laura Koch, Kyo D. Song
Optical Engineering, Dept. of Engineering, Norfolk State University, Norfolk, VA, 23504, USA
SangJoon Park
Chemistry Dept., Kyungwon University, Kyungki-do, 461-701, Korea
Glen King, Sang Choi
NASA Langley Research Center, Hampton, VA, 23681, USA
Abstract
An ultra-small micro spectrometer with less than 1mm diameter was constructed using Fresnel
diffraction. The fabricated spectrometer has a diameter of 750micrometers and a focal length of 2.4
mm at 533nm wavelength. The micro spectrometer was built with a simple negative zone plate that has
an opaque center with an ecliptic shadow to remove the zero-order direct beam to the aperture slit.
Unlike conventional approaches, the detailed optical calculation indicates that the ideal spectral
resolution and resolving power do not depend on the miniaturized size but only on the total number of
rings. We calculated 2D and 3D photon distribution around the aperture slit and confirmed that
improved micro-spectrometers below 1mm size can be built with Fresnel diffraction. The comparison
between mathematical simulation and measured data demonstrates the theoretical resolution,
measured performance, misalignment effect, and improvement for the sub-1mm Fresnel micro-
spectrometer. We suggest the utilization of an array of micro spectrometers for tunable multi-spectral
A tiny spectrometer with a small prism or grating can be utilized for applications such as a hyper
spectral microscope1, spectral measurement of molecular light source in a tiny confined volume such as
inside a cryostat2, miniaturized Raman spectroscopy for in-vivo medical research3, and mini-spectral
scanner for multiple optical fibers. Since the miniaturization of a spectrometer has great technological
and commercial importance, there have been significant efforts to reduce the size of a spectrometer.
For example, Hamamatsu photonics developed 1-inch cube mini-spectrometer with 9nm spectral
resolution, I. Avrutsky et al.4 built a compact 1cm spectrometer, P. Montgomery et al.5 fabricated a
miniature 5mm x 5mm x 0.5mm Fourier transform spectrometer, and N. Kitaura et al.6 demonstrated a
mini-spectrometer having a 4.5mm diameter with 14.83mm focal length based on a whole transparent
molded plastic Fresnel lens. While most of the today’s spectrometers use the Fraunhofer diffraction
equation with a linear grating, the approach with Fresnel diffraction has a fundamental advantage in
miniaturization. Although Fraunhofer diffraction7 is valid when the optical distance Z is large such that Z
>> a2/ where a is the diameter of an aperture and is the wavelength of the light, Fresnel diffraction is
valid for very small optical distances such that Z << a2/Therefore Fresnel diffraction is a better
mathematical foundation for the ultimate miniaturization of small Z. Recently, there has been a strong
interest for gratings in the deep Fresnel field as well.8 The early design of N. Kitaura et al.6 used a whole
transparent plastic Fresnel lens with saw-tooth blades for the high light-collection efficiency, which was
originally developed for a laser collimator. However, this lens was designed for a specific target
wavelength with a limited working spectral range for optimal photon confinement at the focal point. It
has zero-order direct beam noise from the center of a lens and it is very difficult to fabricate angled 3D
structure in the further miniaturized micro-to-nanometer scales. Also the limit of miniaturization and
the size-effect on the spectral resolution were not clear in the previous studies. Therefore, we report an
alternate tiny Fresnel spectrometer design with a circular ring grating, having a two-dimensional
opaque-centered binary zone plate of 750m diameter and study the spectral analysis capability and the
effect of further miniaturization, i.e. over 200 times smaller optical-path volume compared with
previous designs6. Unlike the whole transparent Fresnel lens, two-dimensional binary zone plates have
lower light collection efficiency (below 50%) but are easier to fabricate on smaller scales and can be
used for a wider range of wavelengths because they do not have a specific target wavelength for
optimized focusing. Also, our approach can adopt the recent developments of electrically controllable
Fresnel zone plates based on liquid crystals9-11.
II. DESIGN OF FRESNEL MICRO SPECTROMETER
Figure 1 shows the set-up of Fresnel micro-spectrometer with the opaque-center zone plate. The
general types of straight-line spectrometers were first proposed with a kinoform lens by P.M. Hirsch et
al.12 in 1970 and demonstrated with a plastic Fresnel lens by N. Kitaura et al.6 in 1995. A binary zone
plate was typically designed with a concentric series of transparent and opaque rings. The radius of each
ring is determined by a size coefficient K, such that 𝑟𝑛 = 𝐾 𝑛 where 𝑟𝑛 is the beginning and ending
radius of the nth ring and 𝑛 is the order number. When the transparent rings are built on the annular
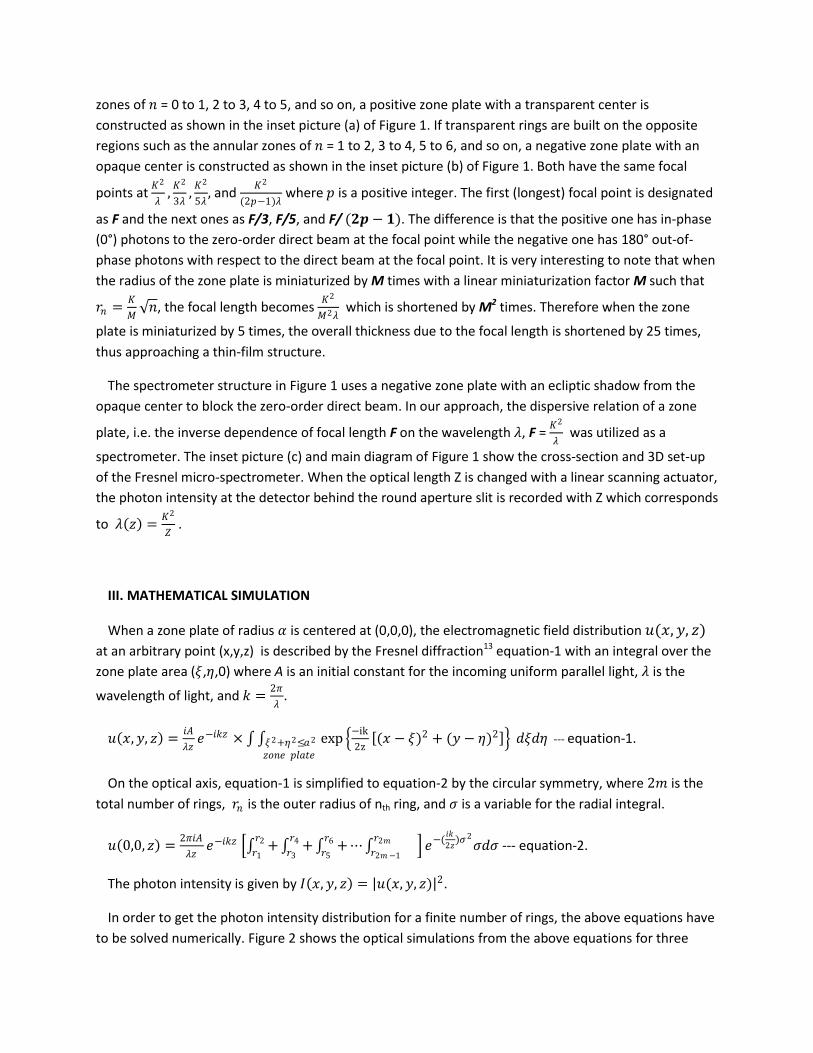
zones of 𝑛 = 0 to 1, 2 to 3, 4 to 5, and so on, a positive zone plate with a transparent center is
constructed as shown in the inset picture (a) of Figure 1. If transparent rings are built on the opposite
regions such as the annular zones of 𝑛 = 1 to 2, 3 to 4, 5 to 6, and so on, a negative zone plate with an
opaque center is constructed as shown in the inset picture (b) of Figure 1. Both have the same focal
points at 𝐾2
𝜆,𝐾2
3𝜆,𝐾2
5𝜆, and
𝐾2
(2𝑝−1)𝜆 where 𝑝 is a positive integer. The first (longest) focal point is designated
as F and the next ones as F/3, F/5, and F/ (𝟐𝒑 − 𝟏). The difference is that the positive one has in-phase
(0°) photons to the zero-order direct beam at the focal point while the negative one has 180° out-of-
phase photons with respect to the direct beam at the focal point. It is very interesting to note that when
the radius of the zone plate is miniaturized by M times with a linear miniaturization factor M such that
𝑟𝑛 =𝐾
𝑀 𝑛, the focal length becomes
𝐾2
𝑀2𝜆 which is shortened by M2 times. Therefore when the zone
plate is miniaturized by 5 times, the overall thickness due to the focal length is shortened by 25 times,
thus approaching a thin-film structure.
The spectrometer structure in Figure 1 uses a negative zone plate with an ecliptic shadow from the
opaque center to block the zero-order direct beam. In our approach, the dispersive relation of a zone
plate, i.e. the inverse dependence of focal length F on the wavelength 𝜆, F = 𝐾2
𝜆 was utilized as a
spectrometer. The inset picture (c) and main diagram of Figure 1 show the cross-section and 3D set-up
of the Fresnel micro-spectrometer. When the optical length Z is changed with a linear scanning actuator,
the photon intensity at the detector behind the round aperture slit is recorded with Z which corresponds
to 𝜆 𝑧 =𝐾2
𝑍 .
III. MATHEMATICAL SIMULATION
When a zone plate of radius 𝛼 is centered at (0,0,0), the electromagnetic field distribution 𝑢(𝑥, 𝑦, 𝑧)
at an arbitrary point (x,y,z) is described by the Fresnel diffraction13 equation-1 with an integral over the
zone plate area (𝜉,𝜂,0) where A is an initial constant for the incoming uniform parallel light, 𝜆 is the
wavelength of light, and 𝑘 =2𝜋
𝜆.
𝑢 𝑥, 𝑦, 𝑧 =𝑖𝐴
𝜆𝑧𝑒−𝑖𝑘𝑧 × exp
−ik
2z (𝑥 − 𝜉)2 + (𝑦 − 𝜂)2 𝜉2+𝜂2≤𝑎2
𝑧𝑜𝑛𝑒 𝑝𝑙𝑎𝑡𝑒
𝑑𝜉𝑑𝜂 --- equation-1.
On the optical axis, equation-1 is simplified to equation-2 by the circular symmetry, where 2𝑚 is the
total number of rings, 𝑟𝑛 is the outer radius of nth ring, and 𝜎 is a variable for the radial integral.
𝑢 0,0, 𝑧 =2𝜋𝑖𝐴
𝜆𝑧𝑒−𝑖𝑘𝑧 + + +⋯
𝑟2𝑚
𝑟2𝑚−1
𝑟6
𝑟5
𝑟4
𝑟3
𝑟2
𝑟1 𝑒−(
𝑖𝑘
2𝑧)𝜎2
𝜎𝑑𝜎 --- equation-2.
The photon intensity is given by 𝐼 𝑥, 𝑦, 𝑧 = 𝑢(𝑥, 𝑦, 𝑧) 2.
In order to get the photon intensity distribution for a finite number of rings, the above equations have
to be solved numerically. Figure 2 shows the optical simulations from the above equations for three
monochromatic lasers at 450nm, 533nm, and 633nm. In the first row, the photon intensity at the actual
optical distance is plotted. In the second row, the photon intensity at the converted wavelength
according to the above 𝜆 𝑧 equation is plotted. In the first column (a), three different negative zone
plates with the same size constant K, but different number of rings are compared as shown in picture
(a3). Dotted lines are for a total of 60 rings, dashed lines are for 80 rings, and solid lines are for 100 rings.
As the number of rings increases, the full diameter increases and the sharpness of the peaks in the
wavelength scan (a2) and optical distance scan (a1) are improved. In the second column (b), two
different zone plates with the same number of rings (total 100 rings) and different size constants Ks,
having different full diameters are compared. The bigger one has a 1,000m diameter (dotted line) and
the smaller one has a 750m diameter (solid line) but both of them have a total of 100 rings as shown in
(b3). They have different focal distance and sharpness of the peaks in the actual optical distance scan as
shown in (b1). However, once the optical distance is converted to the corresponding wavelength
according to the 𝜆 𝑧 equation, they have exactly the same spectral peaks as shown in (b2). Therefore,
we conclude that there is no size dependence in the spectral resolution of the micro spectrometer as
long as they have the same number of rings. This unanticipated result comes from the fact that when K
is large, the actual optical distance is increased by K2 but another K2 term in the conversion equation
𝜆 𝑧 cancels the size effect. In column (c), three different zone plates with the same full diameter
(750m) and different number of rings are compared. The size constant K is adjusted so that they have
the same full diameters. They have different focal lengths and sharpness of the peaks in the optical
distance graph (c1). The converted wavelength graph (c2) shows that the spectral sharpness of the
peaks depends on the total number of rings only. The converted spectral scan graph (c2) is identical to
the previous spectral graph (a2). This confirms that the size of the Fresnel micro spectrometer does not
affect the spectral resolution under ideal conditions. However, the fabrication error on the small scale
may be significant in actual manufacturing.
Figure 3-(a) shows the spectral resolution of two negative zone plates with 100 rings and 50 rings by
the Rayleigh criterion in which the secondary peak is located at the first minima of the primary peak.
The Rayleigh criterion has different intensity drops at the middle point, depending on the detailed
distribution profile. For example, the Rayleigh criterion on the spatial resolution of an optical
microscope with Airy distribution from two adjacent apertures has a 26% intensity drop at the
midpoint.13 The Rayleigh criterion on the spectral resolution of a linear grating with Fraunhofer
diffraction has a 19% intensity drop at the midpoint.13 In our calculation, the Rayleigh criterion on the
spectral resolution of the Fresnel micro-spectrometer with a negative zone plate has an 11% intensity
drop at the midpoint.
Figure 3-(b) shows the spectral resolution and resolving power for 533nm wavelength in terms of the
total number of rings. The calculated spectral resolution Δ𝜆 is inversely proportional to the number of
rings such that Δ𝜆 =1045 (𝑛𝑚 )
# 𝑜𝑓 𝑟𝑖𝑛𝑔𝑠 and the resolving power is
𝜆
Δ𝜆= 0.5 × # 𝑜𝑓 𝑟𝑖𝑛𝑔𝑠 . The full width at half
maximum (FWHM) was 9.26nm. With 100 rings, the spectral resolution is 10. 45 𝑛𝑚 and resolving
power is about 50 and these values are independent from the size. In previous work by N. Kitaura et al.6,
the resolving power of a full-transparent Fresnel lens was estimated to be linearly proportional to the
lens size as 𝜆
Δ𝜆≒
𝑎
4𝜆(𝑓/#) , where 𝑓/# is the f-number of a lens and 𝒂 is the radius of lens. This
estimation has hindered further miniaturization without loss of spectral resolution. To the contrary, in
our approach, 𝑓/# is not a constant upon the miniaturization because 𝑓/# is defined as 𝐹
2𝑎 , and the
focal length F is shortened by M2 times when the radius 𝒂 is miniaturized by M times. Therefore, the
resolving power of a Fresnel zone plate does not depend on the size, but depends on the total number
of rings only. For comparison, the resolving power of a Fraunhofer linear grating is determined not by
the size, but by the total number of lines such that 𝜆
Δ𝜆= 𝑛𝑁 where 𝑛 is the refractive index and 𝑁 is the
total number of lines.13
Figure 3-(c) shows the 2D photon intensity calculation from equation-1 for a general point (x,0,z) on
and off the optical axis. This calculation is made with a total of 50 rings having 500m diameter. Z axis
has a wide range from 400m to 2900m including the primary focal point F, F/3, and F/5 focal points. X
axis is plotted in a zoomed range between +20m and -20m in order to show the details around the
focal points. Figure 3-(d) shows the 3D interpretation of a 2D simulation in detail. Smaller ranges of X
and Z were used to show the fine features around the focal point F. The low intensity “X” shape around
the focal point is a weak light-cone that surrounds the focal point and there is an extended ripple on the
optical axis. The light-cones from different wavelengths do not enter the aperture slit because they
diverge fast. The center ripples from different wavelengths can enter the aperture slit and cause the
interference but the center ripples diminish as the number of ring increases.
IV. FABRICATION AND EXPERIMENT SET-UP
Several units of negative zone plates with different diameters and total number of rings were
fabricated with e-beam lithography14 and focused ion beam15. Figure 4 shows Scanning Electron
Microscope (SEM) image of a fabricated 750m diameter negative zone plate comprised of 100 rings.
The stage was tilted to 52° with respect to the electron gun when this image was taken. The top layer
was coated with Au of 400nm thickness on top of a quartz substrate and Ga+ ion beam was used with an
enhanced etching gas, Xenon difluoride (XeF2)16,17 to obtain optically flat and smooth surface. Figure 5
shows the experimental set-up for the optical test. Two lasers of 533nm and 633nm were roughly mixed
with a beam splitter. A beam chopper was used to block and pass the mixed laser beams at a frequency
of 192Hz. The binary modulation signal from the beam chopper was connected to the reference line of a
lock-in amplifier. A spatial filter was inserted to get a uniformly mixed TEM00 beam from two lasers. The
ring grating module with the negative zone plate was connected to a movable XYZ stage with 0.1 m
steps. X and Y stage movements were used for alignment and Z stage movement was used for changing
and scanning the optical distance. The aperture slits of 10−25 m diameters were used in front of a
blue-enhanced silicon photon detector. The signal from the photon detector was connected to the lock-
in amplifier with the current amplification of 106 V/I. The synchronized lock-in amplification of the
modulated photon signal removes the noise from room light and other stray lights. An automatic
program was built to align XY stages, scan Z-distance, collect the photon intensity, and calculate the
spectral distribution.
Figure 6 shows the photo of a mixed beam on the ring grating module after it passed the spatial filter.
The size of ring grating made of a negative zone plate is only 0.75mm and the diameter of uniformly
mixed beam is about 5mm as shown in Figure 6-(a). The mixed beam appears as bright yellow color to
the human eye and digital camera because they have only three color sensors, red, green, and blue.
When the mixed beam is separated by a negative zone plate of 40 rings, about 90% of photons are
separated according to the focal distance as shown in Figure 6-(b) and Figure 6-(c) which are the digital
camera images of passing lights on a screen after the aperture slit. Both of the images have residual
photons of different colors from unwanted wavelengths at the center. When the photons of the correct
wavelength pass the aperture slit with a large divergence angle, the stray light from different
wavelengths passes the aperture with a narrow confinement at the center. We explain these central
residual photons as the center ripple effect in the optical simulation Figure 3-(d). The ripples on the
optical axis diminish as the number of rings increases.
V. RESULT AND DISCUSSION
A negative zone plate with a total of 100 rings in 750m diameter and an aperture slit of 10m
diameter were used in the automated spectral data acquisition in Figure 7. The actual scan distance is
from 1mm to 7mm to cover the wavelengths from 200nm to 1100nm. Figure 7-(a) shows the graph of
measured photon intensity vs. optical length and Figure 7-(b) shows the graph of the photon intensity vs.
the wavelength which is converted by 𝜆 𝑧 =𝐾2
𝑍 from the actual optical length. The photon intensity
was measured with photocurrent in pico-ampere (pA) unit from unbiased blue-enhanced silicon
photodiode. The measured FWHM of 533nm green laser was 20.3nm in Figure 7-(b). This corresponds to
∆𝜆 = 22.9nm of Rayleigh criterion and the resolving power of 23.2. Since the actual FWHM of a green
laser is less than 1nm, the large FWHM comes from the instrumental broadening of a micro
spectrometer and it can be improved by increasing the number of rings. Figure 7-(c) shows the spectral
scan with a 533nm green laser as shown in the inset picture. Figure 7-(d) shows the spectral scan with a
633nm red laser as shown in the inset picture. Figure 7-(e) shows the spectral scan with a mixed beam of
533nm and 633nm lasers which looks like yellow light in the inset picture. In the inset pictures, a white
bar was inserted in the beam path to show the color of the light. Dashed lines are the references for the
533nm and 633nm wavelengths. Most of the photons exist at the focal points that make the strong
peaks at the correct converted wavelengths. However, there are small amounts of stray light to the left
and right side of major peaks. These small stray peaks are likely to be the zero-order direct beams from
adjacent transparent rings when the ring grating module is slightly misaligned with a small tilt angle.
Since the optical distance between the two lasers is about 200m and the aperture diameter is only
10m, the required angular tolerance to keep half of the aperture slit on the correct optical axis is
arctan 5
200 =1.4°. Therefore high angular accuracy is required in the optical alignment between the
optical axis and scanning axis. The peak at 533nm wavelength peak has a truncated summit while the
peak at 633nm has a full summit at the desired point. This is because the optical system was aligned for
633nm focal point so that the accumulated photons with 533nm wavelength fall on a slightly different
point next to the aperture when the Z-scan is at the exact optical distance for 533nm wavelength. These
data show that the fabricated Fresnel micro-spectrometer of 0.75 mm size can acquire spectral
information as expected but relatively high alignment accuracy for both of X- and Y-direction is required
to avoid artifacts. In the Fraunhofer linear grating, the alignment on the Y-direction which is parallel to
the line grooves can be loose because the linear slit accepts the broad width of lights in the Y-direction.
Another source of error is that the focused ion beam machine had about 3% tolerance in the X/Y aspect
ratio. 3% of the full radius of 375m is 11m which can be larger than the width of outer rings.
Therefore the inaccuracy of the X/Y aspect ratio may result in a large FWHM due to imperfect
confinement of photons at the focal point as well.
Figure 8 shows an array of negative zone plates with 1mm x 1mm pitch. If this array is combined with
individual aperture slit and detector, the small size and pitch allow a dense integration of 100 x 100 =
10,000 micro-spectrometers in a 10cm x 10cm area. The spectral resolution of 23nm is similar to the
bandwidth of common optical filters which are used for multi-spectral CCD imaging. Therefore, we
suggest that an array of micro-spectrometers can afford tunable multi-spectral imaging. Such a system
can remove the necessity to exchange numerous filters to get multiple images with high spectral
resolution. When the transparent substrate is made with UV transparent materials such as calcium
fluoride (CaF2)18, it can operate in the UV range where most liquid crystal based tunable filters19,20
cannot be used due to UV absorption. Because of sensitivity and requirements for alignment accuracy, it
would be necessary to control the XYZ position of aperture slits and detectors individually rather than
simultaneously in a group mode.
VI. CONCLUSION
We demonstrated that the spectral resolution and resolving power of an ideal Fresnel micro
spectrometer do not depend on the miniaturized size but on the total number of rings only. This is
analogous to the spectral relationship of a linear grating with Fraunhofer diffraction. The full 2D/3D
simulation of the photon distribution around the focal point reveals weak light cones and central ripples.
The fabricated micro spectrometer of 100 rings in 750m full diameter had a spectral resolution of
22.9nm and resolving power of 23.2. These values are about half of the best theoretical resolving power
due to small misalignment and inaccurate manufacturing. The volume of the optical path in the
fabricated micro spectrometer is 𝜋 ∙ 0.75(𝑚𝑚 )
2
2∙ 2.4 𝑚𝑚 = 1.06 𝑚𝑚3 for 533nm light. This is about
230 times smaller than the volume obtained by previous spectrometers6. We conclude that further
miniaturized and improved spectrometers based on Fresnel diffraction can be built if the total number
of rings is kept constant or increased and the fabrication accuracy is improved.
VII. ACKNOWLEDGEMENT
The authors appreciate the assistance of Ms. Pokeun Han and Ms. Seojin Kim with the focused ion
beam machine. This research was supported by the space act agreement SAA-15546 of NASA, USA and
KOSEF program by the ministry of science and technology, Republic of Korea.
Figure 1. Optical set-up diagram of Fresnel micro spectrometer with negative zone plate, Inset pictures: (a) positive zone plate with a transparent center, (b) negative zone plate with an opaque center, (c) cross-sectional view
Figure 2. Optical simulation of normalized photon intensity vs. (1) optical distance and (2) scanned wavelength in different
ring gratings; (a) constant K, variable number of rings, (b) constant number of rings, variable outer diameter(), (c) same outer diameter, but different number of rings. Inset pictures (a3), (b3), and (c3) show the comparison schemes.
2000 3000 4000 5000 60000
5000
1 104
400 450 500 550 600 650 7000
5000
1 104
2000 2200 2400 2600 2800 3000 3200 34000
5000
1 104
400 450 500 550 600 650 7000
5000
1 104
400 450 500 550 600 650 7000
5000
1 104
Ph
oto
n in
ten
sity
(a.
u.)
Ph
oto
n in
ten
sity
(a.
u.)
2000 2500 3000 3500 4000 4500 5000 55000
5000
1 104
Optical distance (m)
Wavelength (nm)
(a) Ring#: 60 /80 /100K:Constant, =Variable
(b) Ring#:Constant (100)K:Variable, =750/1000m
(c) Ring#:100 /80 /60K:Variable, =Constant (750m)
(a1)
(a2)
(b1)
(b2)
(c1)
(c2)
(a3) (b3) (c3)
Figure 3. (a) Spectral resolution by Rayleigh criterion (i) total 100 rings, (ii) total 50 rings, (b) Spectral resolution and resolving power vs. total number of rings, (c) Photon intensity simulation around focal points in a general 2D plane, (x,0,z) - on and off the optical axis, (d) 3D interpretation of 2D photon intensity simulation
Figure 4. SEM image of fabricated negative zone plate with 100 rings (50 transparent and 50 opaque rings), stage tilt = 52°
Figure 5. Optical test set-up diagram
Figure 6. (a) Uniformly mixed beam (yellow color) falls on the ring grating, (b) transmitted light through the aperture slit at the red focal point, (c) at the green focal point.
Figure 7. Measured data, (a) intensity vs. optical distance, (b) intensity vs. wavelength, (c) spectral data with 533nm laser, (d) spectral data with 633nm laser, (e) spectral data with mixed beam, 533nm and 633nm lasers.
Figure 8. Array of Fresnel micro-spectrometers
Reference
1 M. B. Sinclair, D. M. Haaland, J. A. Timlin, and H. D. T. Jones, Applied Optics 45, 6283-6291 (2006).
2 Y. Khang, Y. Park, M. Salmeron, and E. R. Weber, Review of Scientific Instruments 70, 4595-4599 (1999).
3 E. B. Hanlon, R. Manoharan, T. W. Koo, K. E. Shafer, J. T. Motz, M. Fitzmaurice, J. R. Kramer, I. Itzkan, R. R. Dasari, and M. S. Feld, Physics in Medicine and Biology 45, R1-R59 (2000).
4 I. Avrutsky, K. Chaganti, I. Salakhutdinov, and G. Auner, Applied Optics 45, 7811-7817 (2006). 5 P. C. Montgomery, D. Montaner, O. Manzardo, M. Flury, and H. P. Herzig, Thin Solid Films 450,
79-83 (2004). 6 N. Kitaura, S. Ogata, and Y. Mori, Optical Engineering 34, 584-588 (1995). 7 Y. Park, J. D. Wright, J. D. L. Jensen, G. C. King, and S. H. Choi, Measurement Science &
Technology 16, 2208-2212 (2005). 8 S. Teng, N. Zhang, Q. Dong, and C. Cheng, Journal of the Optical Society of America a-Optics
Image Science and Vision 24, 3636-3543 (2007). 9 Y. H. Fan, H. W. Ren, and S. T. Wu, Optics Express 11, 3080-3086 (2003). 10 M. Honma and T. Nose, Japanese Journal of Applied Physics Part 1-Regular Papers Short Notes &
Review Papers 44, 287-290 (2005). 11 T. H. Lin, Y. H. Huang, A. Y. G. Fuh, and S. T. Wu, Optics Express 14, 2359-2364 (2006). 12 P. M. Hirsch, J. A. Jordan, and L. B. Lesem, IBM Technical Disclosure Bulletin 12, 1806 (1970). 13 A. Ghatak and K. Thyagarajan, Optical Electronics (Cambridge University Press, New York, 1989). 14 T. Fujita, H. Nishihara, and J. Koyama, Optics Letters 6, 613-615 (1981). 15 M. Yasumoto, S. Tamura, N. Kamijo, Y. Suzuki, M. Awaji, A. Takeuchi, H. Takano, Y. Kohmura, and
K. Handa, Japanese Journal of Applied Physics Part 1-Regular Papers Short Notes & Review Papers 40, 4747-4748 (2001).
16 J. D. Casey, A. F. Doyle, R. G. Lee, D. K. Stewart, and H. Zimmermann, Microelectronic Engineering 24, 43-50 (1994).
17 J. Taniguchi, N. Ohno, S. Takeda, I. Miyamoto, and M. Komuro, Journal of Vacuum Science & Technology B 16, 2506-2510 (1998).
18 G. Kopitkovas, T. Lippert, C. David, A. Wokaun, and J. Gobrecht, Thin Solid Films 453-54, 31-35 (2004).
19 Y. Saito, T. Matsubara, T. Koga, F. Kobayashi, T. D. Kawahara, and A. Nomura, Review of Scientific Instruments 76, 106103 (2005).
20 J. Y. Hardeberg, F. Schmitt, and H. Brettel, Optical Engineering 41, 2532-2548 (2002).