34
UBS Group AG and significant regulated subsidiaries and sub-groups First quarter 2017 Pillar 3 report
UBS Group AG and significant regulated subsidiaries and sub-groupsFirst quarter 2017 Pillar 3 report
UBS Group AG consolidated
Contacts
SwitchboardsFor all general inquirieswww.ubs.com/contact
Zurich +41-44-234 1111London +44-20-7568 0000New York +1-212-821 3000Hong Kong +852-2971 8888
Investor RelationsUBS’s Investor Relations team supports institutional, professional and retail investors from our offices in Zurich, London, New York and Hong Kong.
UBS Group AG, Investor RelationsP.O. Box, CH-8098 Zurich, Switzerland
www.ubs.com/investors
Hotline Zurich +41-44-234 4100Hotline New York +1-212-882 5734Fax (Zurich) +41-44-234 3415
Media RelationsUBS’s Media Relations team supportsglobal media and journalists from our offices in Zurich, London, New York and Hong Kong.
www.ubs.com/media
Zurich +41-44-234 [email protected]
London +44-20-7567 4714 [email protected]
New York +1-212-882 5857 [email protected]
Hong Kong +852-2971 [email protected]
Office of the Group Company SecretaryThe Group Company Secretary receives inquiries on compensation and related issues addressed to members of the Board of Directors.
UBS Group AG, Office of the Group Company SecretaryP.O. Box, CH-8098 Zurich, Switzerland
Hotline +41-44-235 6652Fax +41-44-235 8220
Shareholder ServicesUBS’s Shareholder Services team, a unit of the Group Company Secretary Office, is responsible for the registration of UBS Group AG registered shares.
UBS Group AG, Shareholder ServicesP.O. Box, CH-8098 Zurich, Switzerland
Hotline +41-44-235 6652Fax +41-44-235 8220
US Transfer AgentFor global registered share-relatedinquiries in the US.
Computershare Trust Company NAP.O. Box 30170 College StationTX 77842-3170, USA
Shareholder online inquiries:https://www-us.computershare.com/investor/Contact
Shareholder website:www.computershare.com/investor
Calls from the US +1-866-305-9566Calls from outside the US +1-781-575-2623TDD for hearing impaired+1-800-231-5469TDD for foreign shareholders+1-201-680-6610
Imprint
Publisher: UBS Group AG, Zurich, Switzerland | www.ubs.comLanguage: English
© UBS 2017. The key symbol and UBS are among the registered and unregistered trademarks of UBS. All rights reserved.
Table of contents
UBS Group AG consolidated
2 Section 1 Introduction3 Section 2 Risk-weighted assets8 Section 3 Going and gone concern requirements and
eligible capital15 Section 4 Leverage ratio18 Section 5 Liquidity coverage ratio
Significant regulated subsidiaries and sub-groups
20 Section 1 Introduction20 Section 2 UBS AG standalone23 Section 3 UBS Switzerland AG standalone28 Section 4 UBS Limited standalone28 Section 5 UBS Americas Holding LLC consolidated

1
UBS Group AG consolidated
UBS Group AG consolidated
2
Section 1 Introduction
Regulatory framework and scope of Basel III Pillar 3 disclosuresThe Basel III capital adequacy framework consists of three complementary pillars. Pillar 1 provides a framework for measuring minimum capital requirements for the credit, market, operational and non-counterparty-related risks faced by banks. Pillar 2 addresses the principles of the supervisory review process, emphasizing the need for a qualitative approach to supervising banks. Pillar 3 requires banks to publish a range of disclosures, mainly covering risk, capital, leverage, liquidity and remuneration.
This report provides Pillar 3 disclosures for UBS Group AG on a consolidated basis. Because UBS is considered a systemically relevant bank (SRB) under Swiss banking law, UBS Group AG is required to comply with regulations based on the Basel III framework as applicable to Swiss SRBs on a consolidated basis. Capital information as of 31 March 2017 for UBS Group AG consolidated is provided in the “Capital management” section of our first quarter 2017 report, available under “Quarterly reporting” at www.ubs.com/investors.
Pillar 3 rules also require us to disclose certain regulatory information for the significant banking subsidiaries UBS AG, UBS Switzerland AG and UBS Limited, as well as the significant sub-groups under UBS AG and UBS Americas Holding LLC. This information is provided in the “Significant regulated subsidiaries and sub-groups” section of this report.
UBS Pillar 3 disclosures are based on phase-in rules under the Basel III framework, as implemented by the revised Swiss Capital Adequacy Ordinance issued by the Swiss Federal Council and required by FINMA regulation.
BCBS publishes enhanced Pillar 3 disclosure requirementsIn March 2017, the BCBS issued the consolidated and enhanced framework of the Pillar 3 disclosure requirements. The enhancements include: i) the consolidation of all existing BCBS disclosure requirements into the Pillar 3 framework, including the composition of capital, the leverage ratio, the liquidity ratios, the indicators for determining globally systemically important banks (G-SIBs), the countercyclical capital buffer, interest rate risk in the banking book and remuneration; ii) the introduction of a “dashboard” of banks’ key prudential metrics; iii) a new requirement for banks to disclose valuation adjustments as well as the underlying calculation methodology; and iv) the incorporation of ongoing reforms into the regulatory framework, such as the total loss-absorbing capacity (TLAC) regime for G-SIBs and the revised market risk framework.
The implementation date for existing disclosure requirements that are consolidated under the standard will generally be at the end of 2017. However, for disclosure requirements that are new and / or depend on the implementation of another policy framework, the implementation date has been aligned with the implementation date of that framework.
FINMA-defined asset classesFor an overview of the FINMA-defined asset classes used within this Pillar 3 report, refer to the Basel III Pillar 3 UBS Group AG 2016 report under “Pillar 3, SEC filings & other disclosures” at www.ubs.com/investors.
Format, frequency and comparability of Pillar 3 disclosures Certain Pillar 3 disclosures follow a fixed format defined by FINMA, whereas other disclosures are flexible and may be modified to a certain degree to present the most relevant information. Revised Pillar 3 requirements are presented under the relevant FINMA table / template reference (e.g., OV1, CR8). Pillar 3 disclosures may also include column or row labeling as prescribed by FINMA. Naming conventions used in our Pillar 3 disclosures are based on the FINMA guidance and may not reflect UBS naming conventions. The reporting frequency for each disclosure follows the FINMA-specified interval, which is either quarterly, semi-annual or annual. For further information on disclosure frequencies, refer to the Basel III Pillar 3 UBS Group AG 2016 report under “Pillar 3, SEC filings & other disclosures” at www.ubs.com/investors. Comparative period information and commentary provided on movements is provided in line with the FINMA-specified frequency.
Basel III capital requirements for G-SIBs The BCBS has defined minimum Basel III capital requirements, which are being phased in from 1 January 2013 to 31 December 2018 and become fully effective on 1 January 2019. As of 31 March 2017, the minimum ratio requirements for common equity tier 1 (CET1) capital including capital conservation buffer and for total capital including capital conservation buffer were 5.75% and 9.25%, respectively. Moreover, global systemically important banks (G-SIBs) are subject to additional CET1 capital buffer requirements in the range from 1.0% to 3.5%. These additional buffer requirements are being phased in from 1 January 2016 to 31 December 2018 and become fully effective on 1 January 2019. The Financial Stability Board (FSB) has determined that UBS is a G-SIB, using an indicator-based methodology adopted by the BCBS. In November 2016, the FSB confirmed that, based on the year-end 2015 indicators, the additional CET1 capital buffer requirement for UBS Group is 1.0%. BCBS requirements are minimum requirements that regulators must put in place in their respective jurisdictions. As our Swiss SRB capital requirements exceed the BCBS requirements, including the G-SIB buffer, UBS is not affected by these additional G-SIB requirements.
Refer to the “Capital management” section of our Annual
Report 2016 for more information on phase-in arrangements
and regulatory requirements
Refer to “Pillar 3, SEC filings & other disclosures” at
www.ubs.com/ investors for more information on our G-SIB
indicators
3
Section 2 Risk-weighted assets
Our approach to measuring risk exposure and risk-weighted assetsMeasures of risk exposure may differ, depending on whether the exposures are calculated for financial accounting purposes under International Financial Reporting Standards (IFRS), for deriving our regulatory capital requirement or for internal risk management and control purposes. Our Pillar 3 disclosures are generally based on measures of risk exposure used to derive the regulatory capital required to underpin those risks. The calculation of risk-weighted assets (RWA) follows the BIS Basel III framework, as implemented by the Swiss Capital Adequacy Ordinance issued by the Swiss Federal Council.
Refer to the Basel III Pillar 3 UBS Group AG 2016 report under
“Pillar 3, SEC filings & other disclosures” at
www.ubs.com/investors for more information
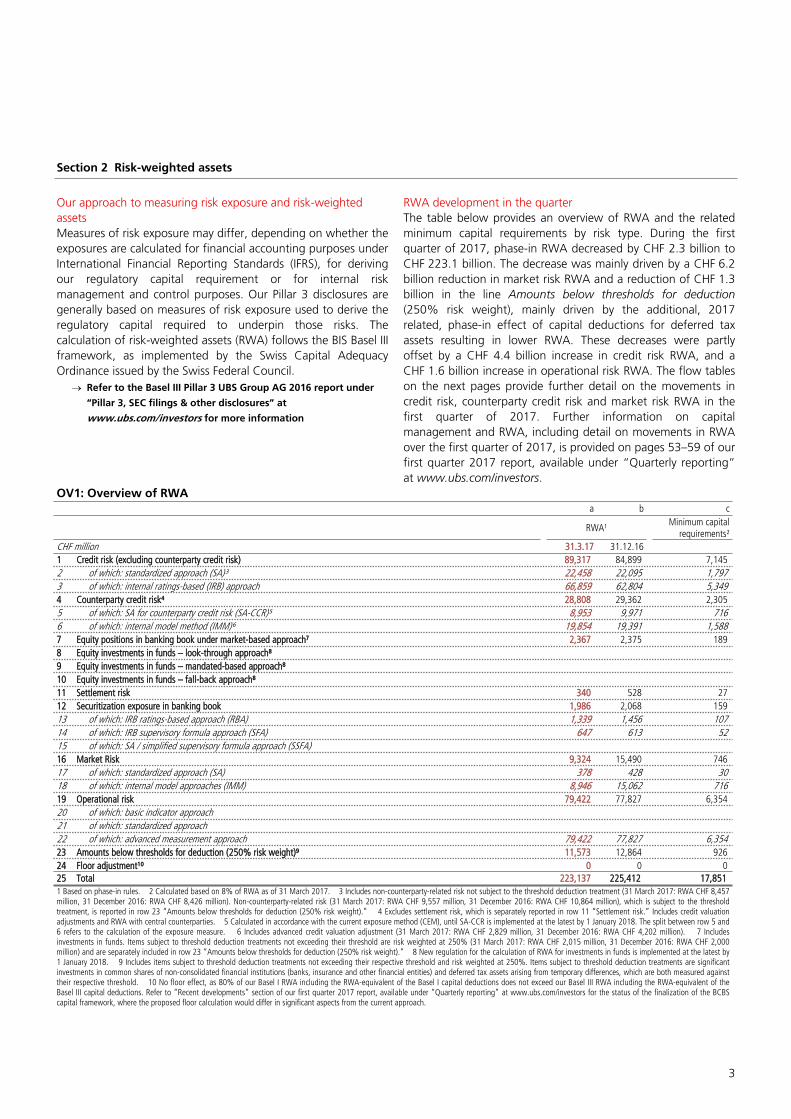
RWA development in the quarterThe table below provides an overview of RWA and the related minimum capital requirements by risk type. During the first quarter of 2017, phase-in RWA decreased by CHF 2.3 billion to CHF 223.1 billion. The decrease was mainly driven by a CHF 6.2 billion reduction in market risk RWA and a reduction of CHF 1.3 billion in the line Amounts below thresholds for deduction (250% risk weight), mainly driven by the additional, 2017 related, phase-in effect of capital deductions for deferred tax assets resulting in lower RWA. These decreases were partly offset by a CHF 4.4 billion increase in credit risk RWA, and a CHF 1.6 billion increase in operational risk RWA. The flow tables on the next pages provide further detail on the movements in credit risk, counterparty credit risk and market risk RWA in the first quarter of 2017. Further information on capital management and RWA, including detail on movements in RWA over the first quarter of 2017, is provided on pages 53–59 of our first quarter 2017 report, available under “Quarterly reporting” at www.ubs.com/investors.
OV1: Overview of RWAa b c
RWA¹ Minimum capital requirements²
CHF million 31.3.17 31.12.161 Credit risk (excluding counterparty credit risk) 89,317 84,899 7,1452 of which: standardized approach (SA)³ 22,458 22,095 1,7973 of which: internal ratings-based (IRB) approach 66,859 62,804 5,3494 Counterparty credit risk⁴ 28,808 29,362 2,3055 of which: SA for counterparty credit risk (SA-CCR)⁵ 8,953 9,971 7166 of which: internal model method (IMM)⁶ 19,854 19,391 1,5887 Equity positions in banking book under market-based approach⁷ 2,367 2,375 1898 Equity investments in funds – look-through approach⁸9 Equity investments in funds – mandated-based approach⁸10 Equity investments in funds – fall-back approach⁸11 Settlement risk 340 528 2712 Securitization exposure in banking book 1,986 2,068 15913 of which: IRB ratings-based approach (RBA) 1,339 1,456 10714 of which: IRB supervisory formula approach (SFA) 647 613 5215 of which: SA / simplified supervisory formula approach (SSFA)16 Market Risk 9,324 15,490 74617 of which: standardized approach (SA) 378 428 3018 of which: internal model approaches (IMM) 8,946 15,062 71619 Operational risk 79,422 77,827 6,35420 of which: basic indicator approach21 of which: standardized approach22 of which: advanced measurement approach 79,422 77,827 6,35423 Amounts below thresholds for deduction (250% risk weight)⁹ 11,573 12,864 92624 Floor adjustment¹⁰ 0 0 025 Total 223,137 225,412 17,8511 Based on phase-in rules. 2 Calculated based on 8% of RWA as of 31 March 2017. 3 Includes non-counterparty-related risk not subject to the threshold deduction treatment (31 March 2017: RWA CHF 8,457 million, 31 December 2016: RWA CHF 8,426 million). Non-counterparty-related risk (31 March 2017: RWA CHF 9,557 million, 31 December 2016: RWA CHF 10,864 million), which is subject to the threshold treatment, is reported in row 23 “Amounts below thresholds for deduction (250% risk weight).” 4 Excludes settlement risk, which is separately reported in row 11 “Settlement risk.” Includes credit valuation adjustments and RWA with central counterparties. 5 Calculated in accordance with the current exposure method (CEM), until SA-CCR is implemented at the latest by 1 January 2018. The split between row 5 and 6 refers to the calculation of the exposure measure. 6 Includes advanced credit valuation adjustment (31 March 2017: RWA CHF 2,829 million, 31 December 2016: RWA CHF 4,202 million). 7 Includes investments in funds. Items subject to threshold deduction treatments not exceeding their threshold are risk weighted at 250% (31 March 2017: RWA CHF 2,015 million, 31 December 2016: RWA CHF 2,000 million) and are separately included in row 23 “Amounts below thresholds for deduction (250% risk weight).” 8 New regulation for the calculation of RWA for investments in funds is implemented at the latest by 1 January 2018. 9 Includes items subject to threshold deduction treatments not exceeding their respective threshold and risk weighted at 250%. Items subject to threshold deduction treatments are significant investments in common shares of non-consolidated financial institutions (banks, insurance and other financial entities) and deferred tax assets arising from temporary differences, which are both measured against their respective threshold. 10 No floor effect, as 80% of our Basel I RWA including the RWA-equivalent of the Basel I capital deductions does not exceed our Basel III RWA including the RWA-equivalent of the Basel III capital deductions. Refer to “Recent developments” section of our first quarter 2017 report, available under “Quarterly reporting” at www.ubs.com/investors for the status of the finalization of the BCBS capital framework, where the proposed floor calculation would differ in significant aspects from the current approach.
UBS Group AG consolidated
4
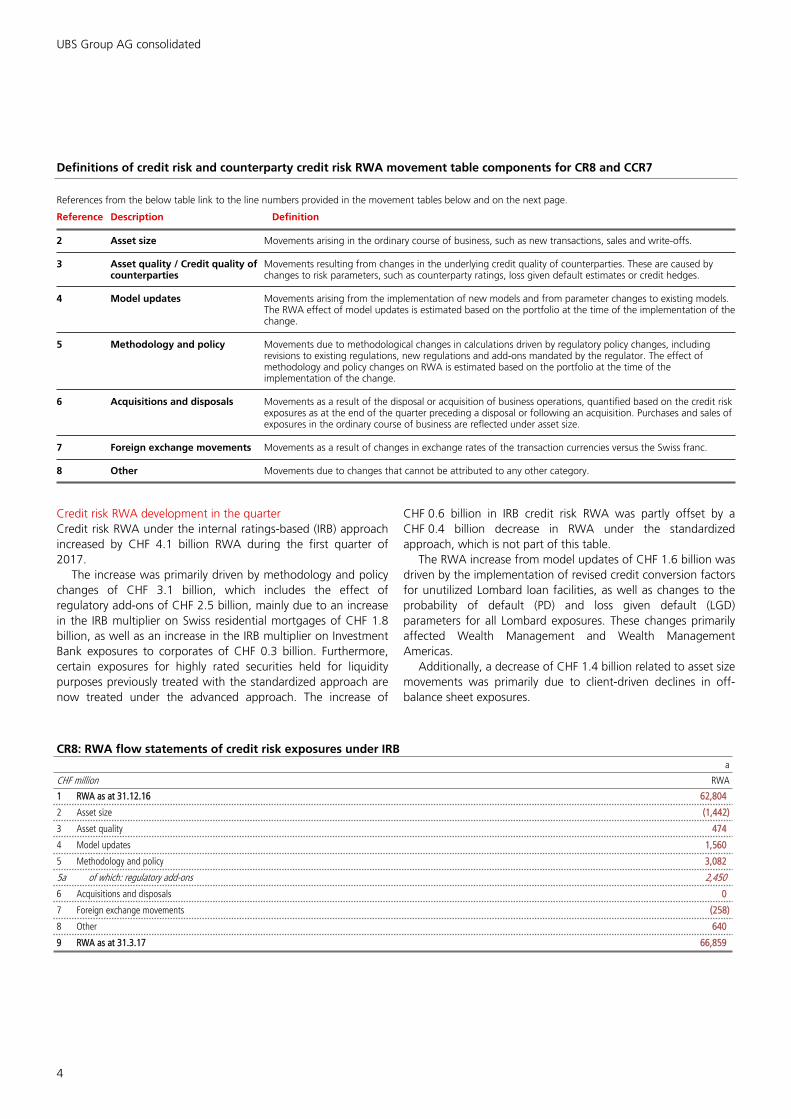
Definitions of credit risk and counterparty credit risk RWA movement table components for CR8 and CCR7
References from the below table link to the line numbers provided in the movement tables below and on the next page.
Reference Description Definition
2 Asset size Movements arising in the ordinary course of business, such as new transactions, sales and write-offs.
3 Asset quality / Credit quality of counterparties
Movements resulting from changes in the underlying credit quality of counterparties. These are caused by changes to risk parameters, such as counterparty ratings, loss given default estimates or credit hedges.
4 Model updates Movements arising from the implementation of new models and from parameter changes to existing models. The RWA effect of model updates is estimated based on the portfolio at the time of the implementation of the change.
5 Methodology and policy Movements due to methodological changes in calculations driven by regulatory policy changes, including revisions to existing regulations, new regulations and add-ons mandated by the regulator. The effect of methodology and policy changes on RWA is estimated based on the portfolio at the time of the implementation of the change.
6 Acquisitions and disposals Movements as a result of the disposal or acquisition of business operations, quantified based on the credit risk exposures as at the end of the quarter preceding a disposal or following an acquisition. Purchases and sales of exposures in the ordinary course of business are reflected under asset size.
7 Foreign exchange movements Movements as a result of changes in exchange rates of the transaction currencies versus the Swiss franc.
8 Other Movements due to changes that cannot be attributed to any other category.
Credit risk RWA development in the quarterCredit risk RWA under the internal ratings-based (IRB) approach increased by CHF 4.1 billion RWA during the first quarter of 2017.
The increase was primarily driven by methodology and policy changes of CHF 3.1 billion, which includes the effect of regulatory add-ons of CHF 2.5 billion, mainly due to an increase in the IRB multiplier on Swiss residential mortgages of CHF 1.8 billion, as well as an increase in the IRB multiplier on Investment Bank exposures to corporates of CHF 0.3 billion. Furthermore, certain exposures for highly rated securities held for liquidity purposes previously treated with the standardized approach are now treated under the advanced approach. The increase of
CHF 0.6 billion in IRB credit risk RWA was partly offset by a CHF 0.4 billion decrease in RWA under the standardized approach, which is not part of this table.
The RWA increase from model updates of CHF 1.6 billion was driven by the implementation of revised credit conversion factors for unutilized Lombard loan facilities, as well as changes to the probability of default (PD) and loss given default (LGD) parameters for all Lombard exposures. These changes primarily affected Wealth Management and Wealth Management Americas.
Additionally, a decrease of CHF 1.4 billion related to asset size movements was primarily due to client-driven declines in off-balance sheet exposures.
CR8: RWA flow statements of credit risk exposures under IRBa
CHF million RWA
1 RWA as at 31.12.16 62,804
2 Asset size (1,442)
3 Asset quality 474
4 Model updates 1,560
5 Methodology and policy 3,082
5a of which: regulatory add-ons 2,450
6 Acquisitions and disposals 0
7 Foreign exchange movements (258)
8 Other 640
9 RWA as at 31.3.17 66,859
5
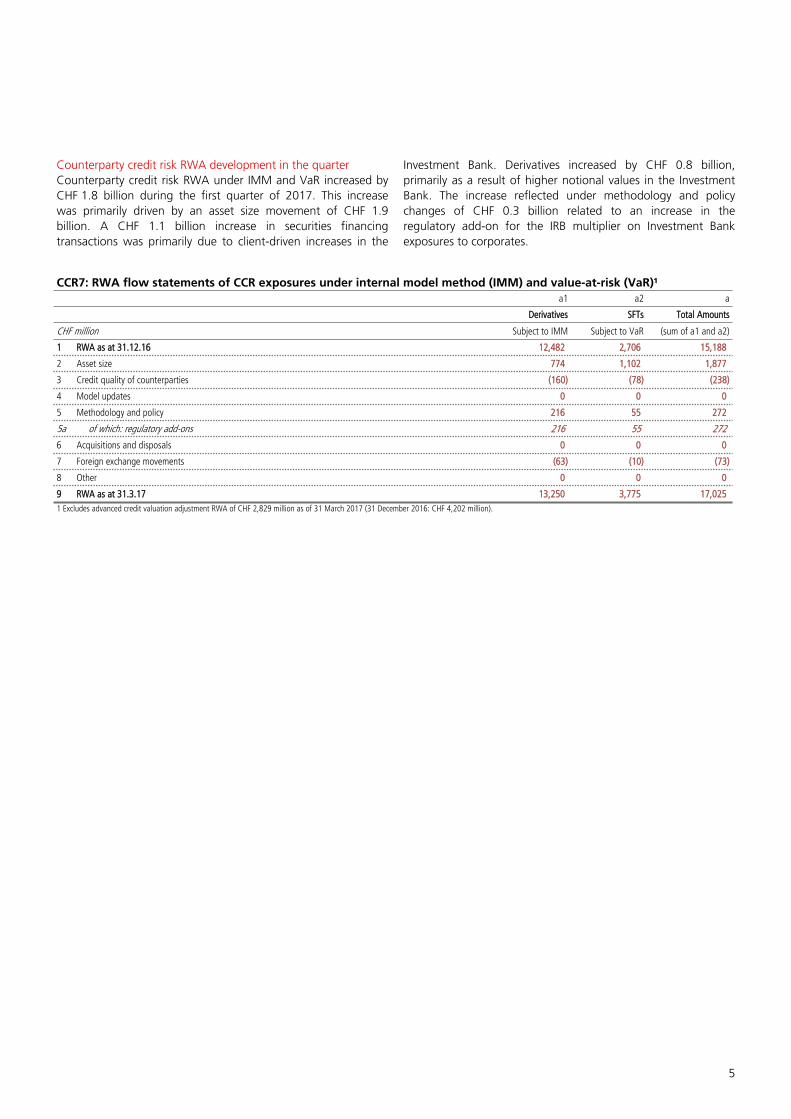
Counterparty credit risk RWA development in the quarterCounterparty credit risk RWA under IMM and VaR increased by CHF 1.8 billion during the first quarter of 2017. This increase was primarily driven by an asset size movement of CHF 1.9 billion. A CHF 1.1 billion increase in securities financing transactions was primarily due to client-driven increases in the
Investment Bank. Derivatives increased by CHF 0.8 billion, primarily as a result of higher notional values in the Investment Bank. The increase reflected under methodology and policy changes of CHF 0.3 billion related to an increase in the regulatory add-on for the IRB multiplier on Investment Bank exposures to corporates.
CCR7: RWA flow statements of CCR exposures under internal model method (IMM) and value-at-risk (VaR)¹a1 a2 a
Derivatives SFTs Total Amounts
CHF million Subject to IMM Subject to VaR (sum of a1 and a2)
1 RWA as at 31.12.16 12,482 2,706 15,188
2 Asset size 774 1,102 1,877
3 Credit quality of counterparties (160) (78) (238)
4 Model updates 0 0 0
5 Methodology and policy 216 55 272
5a of which: regulatory add-ons 216 55 272
6 Acquisitions and disposals 0 0 0
7 Foreign exchange movements (63) (10) (73)
8 Other 0 0 0
9 RWA as at 31.3.17 13,250 3,775 17,0251 Excludes advanced credit valuation adjustment RWA of CHF 2,829 million as of 31 March 2017 (31 December 2016: CHF 4,202 million).
UBS Group AG consolidated
6
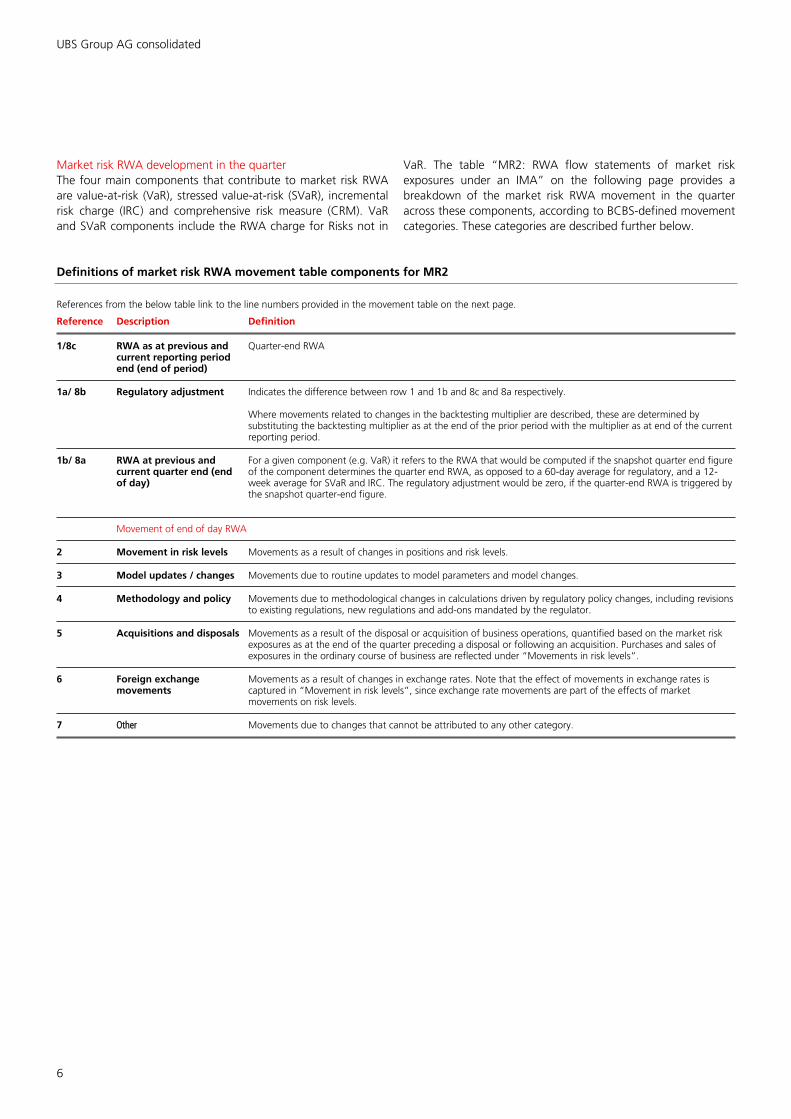
Market risk RWA development in the quarter The four main components that contribute to market risk RWA are value-at-risk (VaR), stressed value-at-risk (SVaR), incremental risk charge (IRC) and comprehensive risk measure (CRM). VaR and SVaR components include the RWA charge for Risks not in
VaR. The table “MR2: RWA flow statements of market risk exposures under an IMA” on the following page provides a breakdown of the market risk RWA movement in the quarter across these components, according to BCBS-defined movement categories. These categories are described further below.
Definitions of market risk RWA movement table components for MR2
References from the below table link to the line numbers provided in the movement table on the next page.
Reference Description Definition
1/8c RWA as at previous and current reporting period end (end of period)
Quarter-end RWA
1a/ 8b Regulatory adjustment Indicates the difference between row 1 and 1b and 8c and 8a respectively.
Where movements related to changes in the backtesting multiplier are described, these are determined by substituting the backtesting multiplier as at the end of the prior period with the multiplier as at end of the current reporting period.
1b/ 8a RWA at previous and current quarter end (end of day)
For a given component (e.g. VaR) it refers to the RWA that would be computed if the snapshot quarter end figure of the component determines the quarter end RWA, as opposed to a 60-day average for regulatory, and a 12-week average for SVaR and IRC. The regulatory adjustment would be zero, if the quarter-end RWA is triggered by the snapshot quarter-end figure.
Movement of end of day RWA
2 Movement in risk levels Movements as a result of changes in positions and risk levels.
3 Model updates / changes Movements due to routine updates to model parameters and model changes.
4 Methodology and policy Movements due to methodological changes in calculations driven by regulatory policy changes, including revisions to existing regulations, new regulations and add-ons mandated by the regulator.
5 Acquisitions and disposals Movements as a result of the disposal or acquisition of business operations, quantified based on the market risk exposures as at the end of the quarter preceding a disposal or following an acquisition. Purchases and sales of exposures in the ordinary course of business are reflected under “Movements in risk levels”.
6 Foreign exchange movements
Movements as a result of changes in exchange rates. Note that the effect of movements in exchange rates is captured in “Movement in risk levels”, since exchange rate movements are part of the effects of market movements on risk levels.
7 Other Movements due to changes that cannot be attributed to any other category.
7
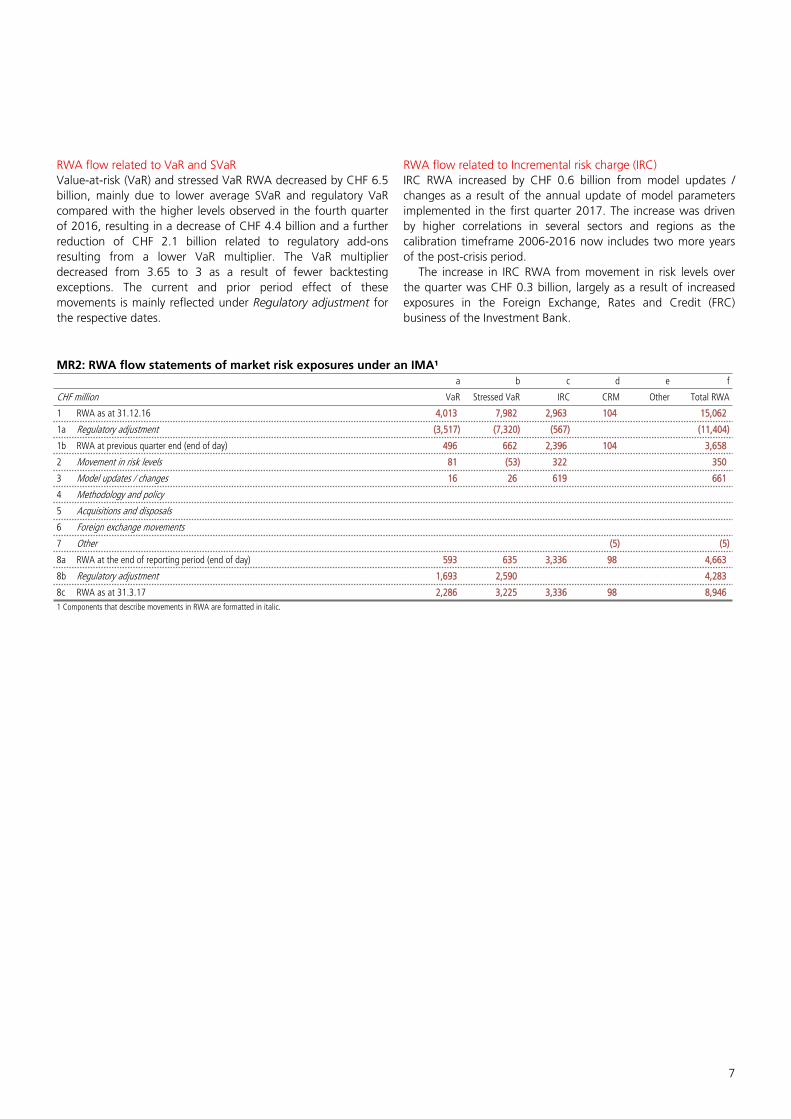
RWA flow related to VaR and SVaR Value-at-risk (VaR) and stressed VaR RWA decreased by CHF 6.5 billion, mainly due to lower average SVaR and regulatory VaR compared with the higher levels observed in the fourth quarter of 2016, resulting in a decrease of CHF 4.4 billion and a further reduction of CHF 2.1 billion related to regulatory add-ons resulting from a lower VaR multiplier. The VaR multiplier decreased from 3.65 to 3 as a result of fewer backtesting exceptions. The current and prior period effect of these movements is mainly reflected under Regulatory adjustment for the respective dates.
RWA flow related to Incremental risk charge (IRC) IRC RWA increased by CHF 0.6 billion from model updates / changes as a result of the annual update of model parameters implemented in the first quarter 2017. The increase was driven by higher correlations in several sectors and regions as the calibration timeframe 2006-2016 now includes two more years of the post-crisis period.
The increase in IRC RWA from movement in risk levels over the quarter was CHF 0.3 billion, largely as a result of increased exposures in the Foreign Exchange, Rates and Credit (FRC) business of the Investment Bank.
MR2: RWA flow statements of market risk exposures under an IMA¹a b c d e f
CHF million VaR Stressed VaR IRC CRM Other Total RWA
1 RWA as at 31.12.16 4,013 7,982 2,963 104 15,062
1a Regulatory adjustment (3,517) (7,320) (567) (11,404)
1b RWA at previous quarter end (end of day) 496 662 2,396 104 3,658
2 Movement in risk levels 81 (53) 322 350
3 Model updates / changes 16 26 619 661
4 Methodology and policy
5 Acquisitions and disposals
6 Foreign exchange movements
7 Other (5) (5)
8a RWA at the end of reporting period (end of day) 593 635 3,336 98 4,663
8b Regulatory adjustment 1,693 2,590 4,283
8c RWA as at 31.3.17 2,286 3,225 3,336 98 8,9461 Components that describe movements in RWA are formatted in italic.
UBS Group AG consolidated
8
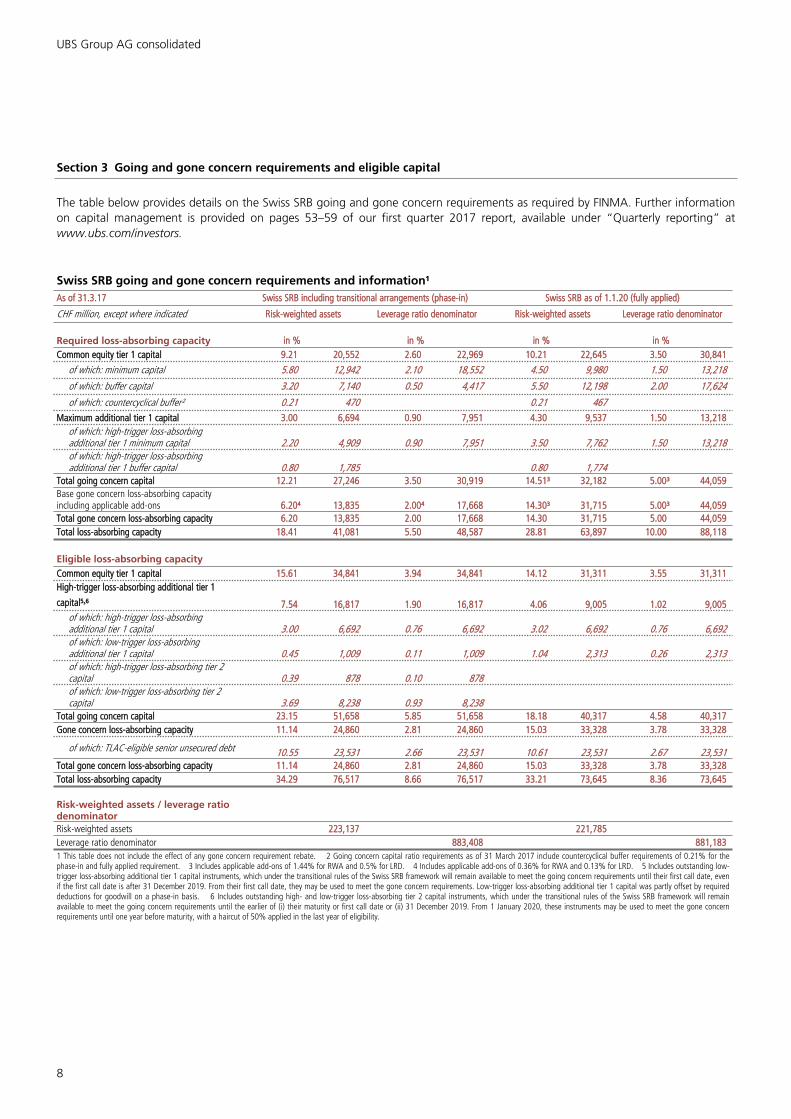
Section 3 Going and gone concern requirements and eligible capital
The table below provides details on the Swiss SRB going and gone concern requirements as required by FINMA. Further information on capital management is provided on pages 53–59 of our first quarter 2017 report, available under “Quarterly reporting” at www.ubs.com/investors.
Swiss SRB going and gone concern requirements and information¹As of 31.3.17 Swiss SRB including transitional arrangements (phase-in) Swiss SRB as of 1.1.20 (fully applied)
CHF million, except where indicated Risk-weighted assets Leverage ratio denominator Risk-weighted assets Leverage ratio denominator
Required loss-absorbing capacity in % in % in % in %Common equity tier 1 capital 9.21 20,552 2.60 22,969 10.21 22,645 3.50 30,841
of which: minimum capital 5.80 12,942 2.10 18,552 4.50 9,980 1.50 13,218
of which: buffer capital 3.20 7,140 0.50 4,417 5.50 12,198 2.00 17,624
of which: countercyclical buffer² 0.21 470 0.21 467Maximum additional tier 1 capital 3.00 6,694 0.90 7,951 4.30 9,537 1.50 13,218
of which: high-trigger loss-absorbing additional tier 1 minimum capital 2.20 4,909 0.90 7,951 3.50 7,762 1.50 13,218of which: high-trigger loss-absorbing additional tier 1 buffer capital 0.80 1,785 0.80 1,774
Total going concern capital 12.21 27,246 3.50 30,919 14.51³ 32,182 5.00³ 44,059Base gone concern loss-absorbing capacity including applicable add-ons 6.20⁴ 13,835 2.00⁴ 17,668 14.30³ 31,715 5.00³ 44,059Total gone concern loss-absorbing capacity 6.20 13,835 2.00 17,668 14.30 31,715 5.00 44,059Total loss-absorbing capacity 18.41 41,081 5.50 48,587 28.81 63,897 10.00 88,118
Eligible loss-absorbing capacityCommon equity tier 1 capital 15.61 34,841 3.94 34,841 14.12 31,311 3.55 31,311High-trigger loss-absorbing additional tier 1
capital⁵˒⁶ 7.54 16,817 1.90 16,817 4.06 9,005 1.02 9,005of which: high-trigger loss-absorbing additional tier 1 capital 3.00 6,692 0.76 6,692 3.02 6,692 0.76 6,692of which: low-trigger loss-absorbing additional tier 1 capital 0.45 1,009 0.11 1,009 1.04 2,313 0.26 2,313of which: high-trigger loss-absorbing tier 2 capital 0.39 878 0.10 878of which: low-trigger loss-absorbing tier 2 capital 3.69 8,238 0.93 8,238
Total going concern capital 23.15 51,658 5.85 51,658 18.18 40,317 4.58 40,317Gone concern loss-absorbing capacity 11.14 24,860 2.81 24,860 15.03 33,328 3.78 33,328
of which: TLAC-eligible senior unsecured debt 10.55 23,531 2.66 23,531 10.61 23,531 2.67 23,531Total gone concern loss-absorbing capacity 11.14 24,860 2.81 24,860 15.03 33,328 3.78 33,328Total loss-absorbing capacity 34.29 76,517 8.66 76,517 33.21 73,645 8.36 73,645
Risk-weighted assets / leverage ratio denominatorRisk-weighted assets 223,137 221,785Leverage ratio denominator 883,408 881,1831 This table does not include the effect of any gone concern requirement rebate. 2 Going concern capital ratio requirements as of 31 March 2017 include countercyclical buffer requirements of 0.21% for the phase-in and fully applied requirement. 3 Includes applicable add-ons of 1.44% for RWA and 0.5% for LRD. 4 Includes applicable add-ons of 0.36% for RWA and 0.13% for LRD. 5 Includes outstanding low-trigger loss-absorbing additional tier 1 capital instruments, which under the transitional rules of the Swiss SRB framework will remain available to meet the going concern requirements until their first call date, even if the first call date is after 31 December 2019. From their first call date, they may be used to meet the gone concern requirements. Low-trigger loss-absorbing additional tier 1 capital was partly offset by required deductions for goodwill on a phase-in basis. 6 Includes outstanding high- and low-trigger loss-absorbing tier 2 capital instruments, which under the transitional rules of the Swiss SRB framework will remain available to meet the going concern requirements until the earlier of (i) their maturity or first call date or (ii) 31 December 2019. From 1 January 2020, these instruments may be used to meet the gone concern requirements until one year before maturity, with a haircut of 50% applied in the last year of eligibility.
9
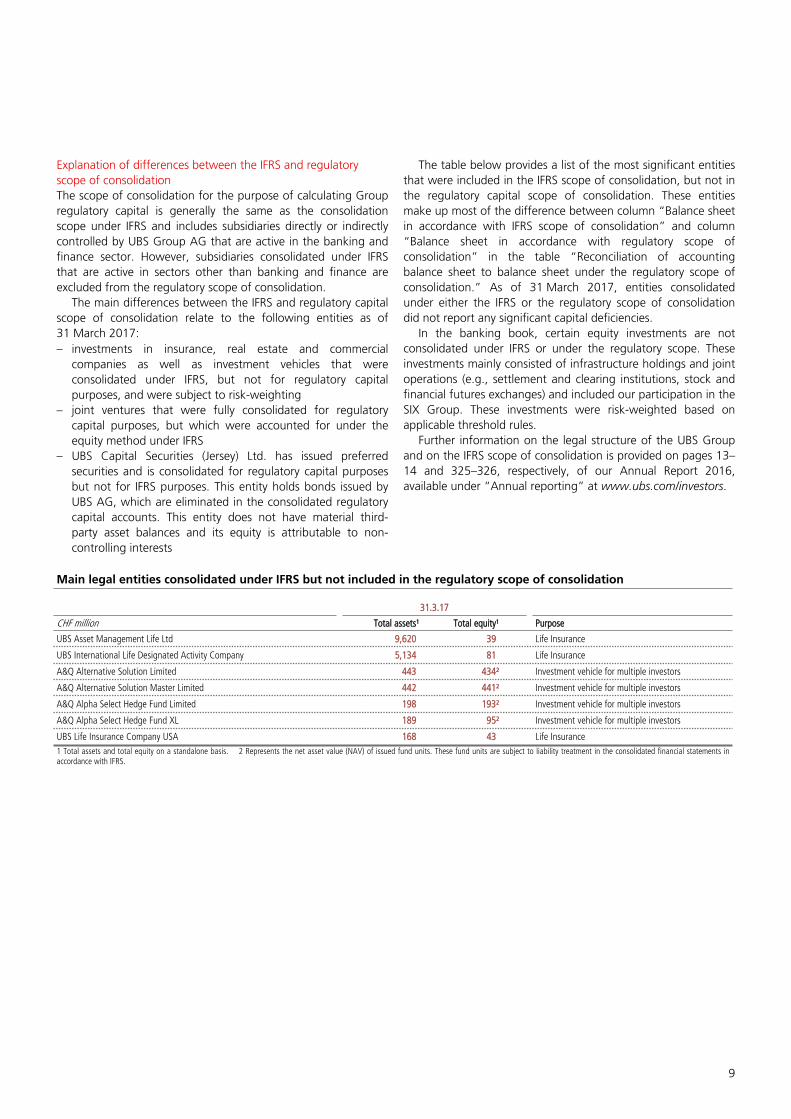
Explanation of differences between the IFRS and regulatory scope of consolidationThe scope of consolidation for the purpose of calculating Group regulatory capital is generally the same as the consolidation scope under IFRS and includes subsidiaries directly or indirectly controlled by UBS Group AG that are active in the banking and finance sector. However, subsidiaries consolidated under IFRS that are active in sectors other than banking and finance are excluded from the regulatory scope of consolidation.
The main differences between the IFRS and regulatory capital scope of consolidation relate to the following entities as of 31 March 2017:– investments in insurance, real estate and commercial
companies as well as investment vehicles that were consolidated under IFRS, but not for regulatory capital purposes, and were subject to risk-weighting
– joint ventures that were fully consolidated for regulatory capital purposes, but which were accounted for under the equity method under IFRS
– UBS Capital Securities (Jersey) Ltd. has issued preferred securities and is consolidated for regulatory capital purposes but not for IFRS purposes. This entity holds bonds issued by UBS AG, which are eliminated in the consolidated regulatory capital accounts. This entity does not have material third-party asset balances and its equity is attributable to non-controlling interests
The table below provides a list of the most significant entities that were included in the IFRS scope of consolidation, but not in the regulatory capital scope of consolidation. These entities make up most of the difference between column “Balance sheet in accordance with IFRS scope of consolidation” and column “Balance sheet in accordance with regulatory scope of consolidation” in the table “Reconciliation of accounting balance sheet to balance sheet under the regulatory scope of consolidation.” As of 31 March 2017, entities consolidated under either the IFRS or the regulatory scope of consolidation did not report any significant capital deficiencies.
In the banking book, certain equity investments are not consolidated under IFRS or under the regulatory scope. These investments mainly consisted of infrastructure holdings and joint operations (e.g., settlement and clearing institutions, stock and financial futures exchanges) and included our participation in the SIX Group. These investments were risk-weighted based on applicable threshold rules.
Further information on the legal structure of the UBS Group and on the IFRS scope of consolidation is provided on pages 13–14 and 325–326, respectively, of our Annual Report 2016, available under “Annual reporting” at www.ubs.com/investors.
Main legal entities consolidated under IFRS but not included in the regulatory scope of consolidation
31.3.17
CHF million Total assets¹ Total equity¹ Purpose
UBS Asset Management Life Ltd 9,620 39 Life Insurance
UBS International Life Designated Activity Company 5,134 81 Life Insurance
A&Q Alternative Solution Limited 443 434² Investment vehicle for multiple investors
A&Q Alternative Solution Master Limited 442 441² Investment vehicle for multiple investors
A&Q Alpha Select Hedge Fund Limited 198 193² Investment vehicle for multiple investors
A&Q Alpha Select Hedge Fund XL 189 95² Investment vehicle for multiple investors
UBS Life Insurance Company USA 168 43 Life Insurance1 Total assets and total equity on a standalone basis. 2 Represents the net asset value (NAV) of issued fund units. These fund units are subject to liability treatment in the consolidated financial statements in accordance with IFRS.
UBS Group AG consolidated
10
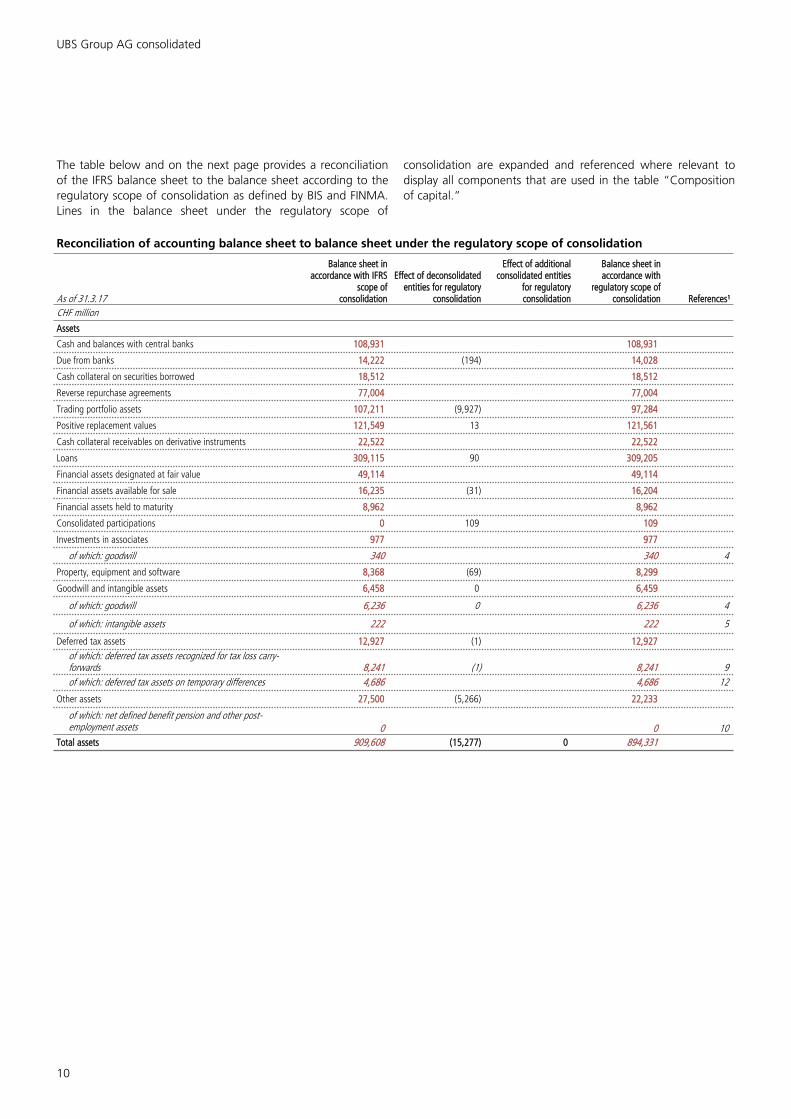
The table below and on the next page provides a reconciliation of the IFRS balance sheet to the balance sheet according to the regulatory scope of consolidation as defined by BIS and FINMA. Lines in the balance sheet under the regulatory scope of
consolidation are expanded and referenced where relevant to display all components that are used in the table “Composition of capital.”
Reconciliation of accounting balance sheet to balance sheet under the regulatory scope of consolidation
As of 31.3.17
Balance sheet in accordance with IFRS
scope of consolidation
Effect of deconsolidated entities for regulatory
consolidation
Effect of additional consolidated entities
for regulatory consolidation
Balance sheet in accordance with
regulatory scope of consolidation References¹
CHF million
Assets
Cash and balances with central banks 108,931 108,931
Due from banks 14,222 (194) 14,028
Cash collateral on securities borrowed 18,512 18,512
Reverse repurchase agreements 77,004 77,004
Trading portfolio assets 107,211 (9,927) 97,284
Positive replacement values 121,549 13 121,561
Cash collateral receivables on derivative instruments 22,522 22,522
Loans 309,115 90 309,205
Financial assets designated at fair value 49,114 49,114
Financial assets available for sale 16,235 (31) 16,204
Financial assets held to maturity 8,962 8,962
Consolidated participations 0 109 109
Investments in associates 977 977
of which: goodwill 340 340 4
Property, equipment and software 8,368 (69) 8,299
Goodwill and intangible assets 6,458 0 6,459
of which: goodwill 6,236 0 6,236 4
of which: intangible assets 222 222 5
Deferred tax assets 12,927 (1) 12,927of which: deferred tax assets recognized for tax loss carry-forwards 8,241 (1) 8,241 9of which: deferred tax assets on temporary differences 4,686 4,686 12
Other assets 27,500 (5,266) 22,233
of which: net defined benefit pension and other post-employment assets 0 0 10
Total assets 909,608 (15,277) 0 894,331
11
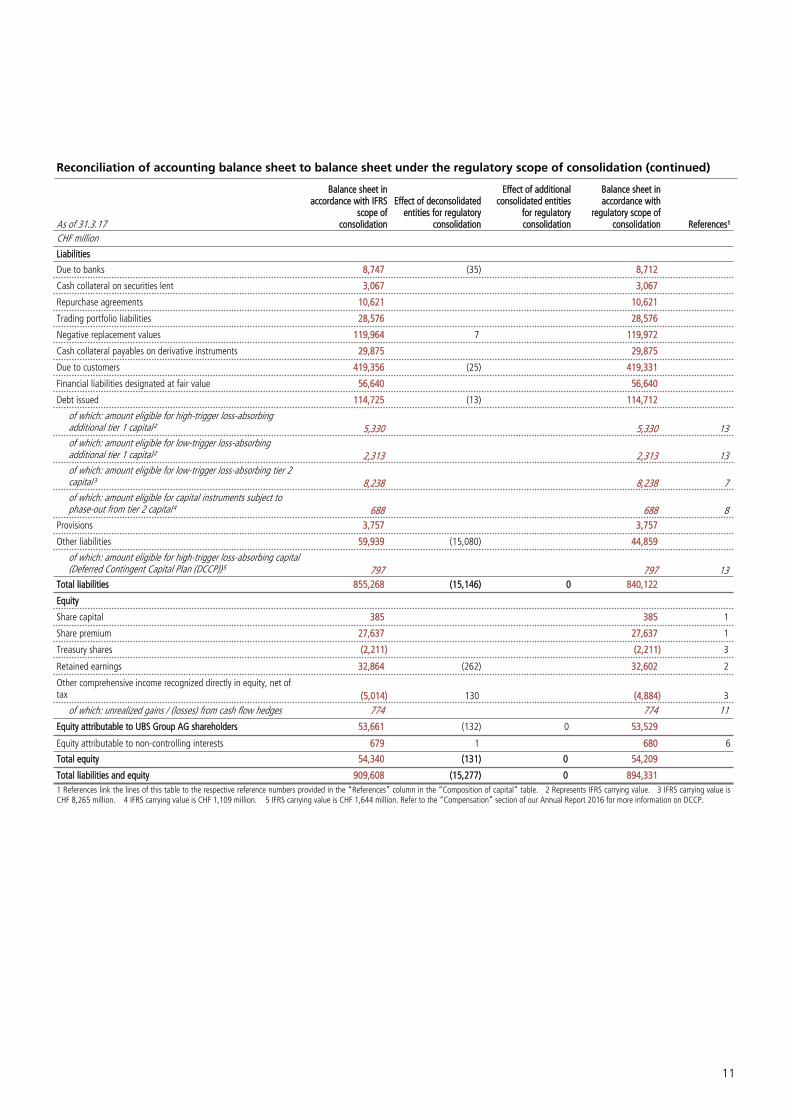
Reconciliation of accounting balance sheet to balance sheet under the regulatory scope of consolidation (continued)
As of 31.3.17
Balance sheet in accordance with IFRS
scope of consolidation
Effect of deconsolidated entities for regulatory
consolidation
Effect of additional consolidated entities
for regulatory consolidation
Balance sheet in accordance with
regulatory scope of consolidation References¹
CHF million
Liabilities
Due to banks 8,747 (35) 8,712
Cash collateral on securities lent 3,067 3,067
Repurchase agreements 10,621 10,621
Trading portfolio liabilities 28,576 28,576
Negative replacement values 119,964 7 119,972
Cash collateral payables on derivative instruments 29,875 29,875
Due to customers 419,356 (25) 419,331
Financial liabilities designated at fair value 56,640 56,640
Debt issued 114,725 (13) 114,712
of which: amount eligible for high-trigger loss-absorbing additional tier 1 capital² 5,330 5,330 13of which: amount eligible for low-trigger loss-absorbing additional tier 1 capital² 2,313 2,313 13of which: amount eligible for low-trigger loss-absorbing tier 2 capital³ 8,238 8,238 7of which: amount eligible for capital instruments subject to phase-out from tier 2 capital⁴ 688 688 8
Provisions 3,757 3,757
Other liabilities 59,939 (15,080) 44,859
of which: amount eligible for high-trigger loss-absorbing capital (Deferred Contingent Capital Plan (DCCP))⁵ 797 797 13
Total liabilities 855,268 (15,146) 0 840,122
Equity
Share capital 385 385 1
Share premium 27,637 27,637 1
Treasury shares (2,211) (2,211) 3
Retained earnings 32,864 (262) 32,602 2
Other comprehensive income recognized directly in equity, net of tax (5,014) 130 (4,884) 3
of which: unrealized gains / (losses) from cash flow hedges 774 774 11
Equity attributable to UBS Group AG shareholders 53,661 (132) 0 53,529
Equity attributable to non-controlling interests 679 1 680 6
Total equity 54,340 (131) 0 54,209
Total liabilities and equity 909,608 (15,277) 0 894,3311 References link the lines of this table to the respective reference numbers provided in the “References” column in the “Composition of capital“ table. 2 Represents IFRS carrying value. 3 IFRS carrying value is CHF 8,265 million. 4 IFRS carrying value is CHF 1,109 million. 5 IFRS carrying value is CHF 1,644 million. Refer to the “Compensation” section of our Annual Report 2016 for more information on DCCP.
UBS Group AG consolidated
12
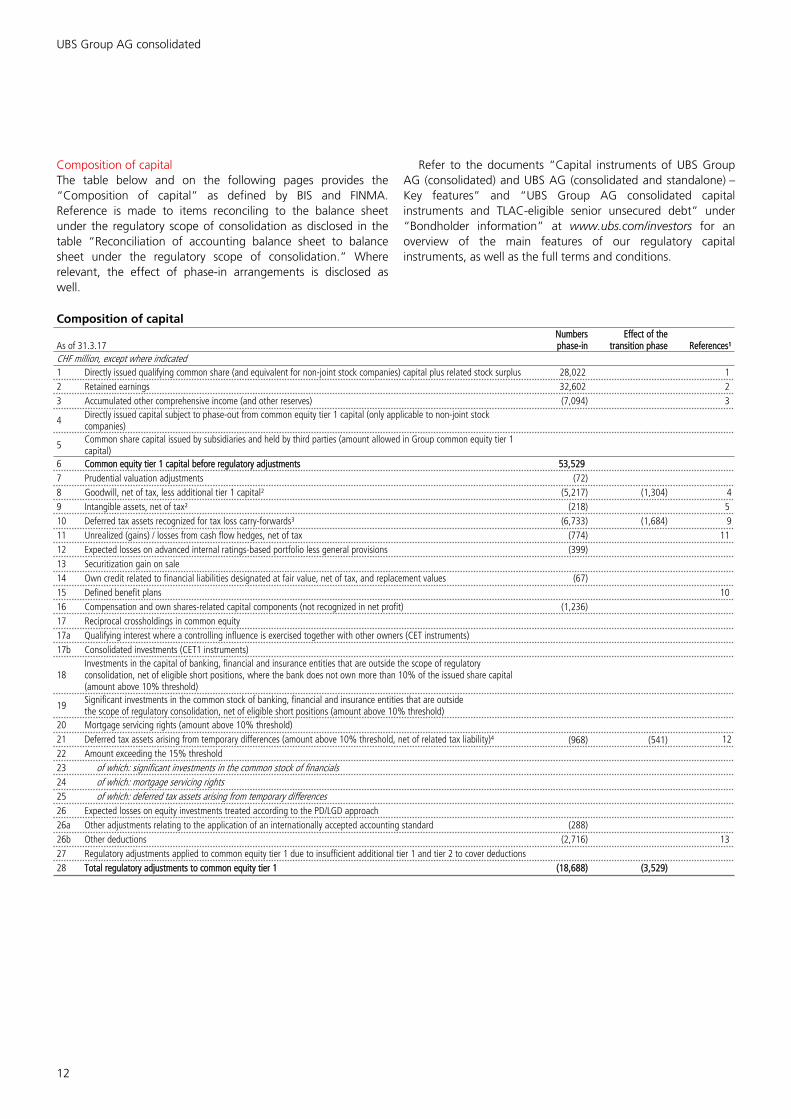
Composition of capital The table below and on the following pages provides the “Composition of capital” as defined by BIS and FINMA. Reference is made to items reconciling to the balance sheet under the regulatory scope of consolidation as disclosed in the table “Reconciliation of accounting balance sheet to balance sheet under the regulatory scope of consolidation.” Where relevant, the effect of phase-in arrangements is disclosed as well.
Refer to the documents “Capital instruments of UBS Group AG (consolidated) and UBS AG (consolidated and standalone) – Key features” and “UBS Group AG consolidated capital instruments and TLAC-eligible senior unsecured debt” under “Bondholder information” at www.ubs.com/investors for an overview of the main features of our regulatory capital instruments, as well as the full terms and conditions.
Composition of capital
As of 31.3.17Numbers phase-in
Effect of the transition phase References¹
CHF million, except where indicated1 Directly issued qualifying common share (and equivalent for non-joint stock companies) capital plus related stock surplus 28,022 12 Retained earnings 32,602 23 Accumulated other comprehensive income (and other reserves) (7,094) 3
4 Directly issued capital subject to phase-out from common equity tier 1 capital (only applicable to non-joint stock companies)
5 Common share capital issued by subsidiaries and held by third parties (amount allowed in Group common equity tier 1 capital)
6 Common equity tier 1 capital before regulatory adjustments 53,5297 Prudential valuation adjustments (72)8 Goodwill, net of tax, less additional tier 1 capital² (5,217) (1,304) 49 Intangible assets, net of tax² (218) 510 Deferred tax assets recognized for tax loss carry-forwards³ (6,733) (1,684) 911 Unrealized (gains) / losses from cash flow hedges, net of tax (774) 1112 Expected losses on advanced internal ratings-based portfolio less general provisions (399)13 Securitization gain on sale14 Own credit related to financial liabilities designated at fair value, net of tax, and replacement values (67)15 Defined benefit plans 1016 Compensation and own shares-related capital components (not recognized in net profit) (1,236)17 Reciprocal crossholdings in common equity17a Qualifying interest where a controlling influence is exercised together with other owners (CET instruments)17b Consolidated investments (CET1 instruments)
18Investments in the capital of banking, financial and insurance entities that are outside the scope of regulatory consolidation, net of eligible short positions, where the bank does not own more than 10% of the issued share capital (amount above 10% threshold)
19 Significant investments in the common stock of banking, financial and insurance entities that are outside the scope of regulatory consolidation, net of eligible short positions (amount above 10% threshold)
20 Mortgage servicing rights (amount above 10% threshold)21 Deferred tax assets arising from temporary differences (amount above 10% threshold, net of related tax liability)⁴ (968) (541) 1222 Amount exceeding the 15% threshold23 of which: significant investments in the common stock of financials24 of which: mortgage servicing rights25 of which: deferred tax assets arising from temporary differences26 Expected losses on equity investments treated according to the PD/LGD approach26a Other adjustments relating to the application of an internationally accepted accounting standard (288)26b Other deductions (2,716) 1327 Regulatory adjustments applied to common equity tier 1 due to insufficient additional tier 1 and tier 2 to cover deductions28 Total regulatory adjustments to common equity tier 1 (18,688) (3,529)
13
Composition of capital (continued)
As of 31.3.17Numbers phase-in
Effect of the transition phase References¹
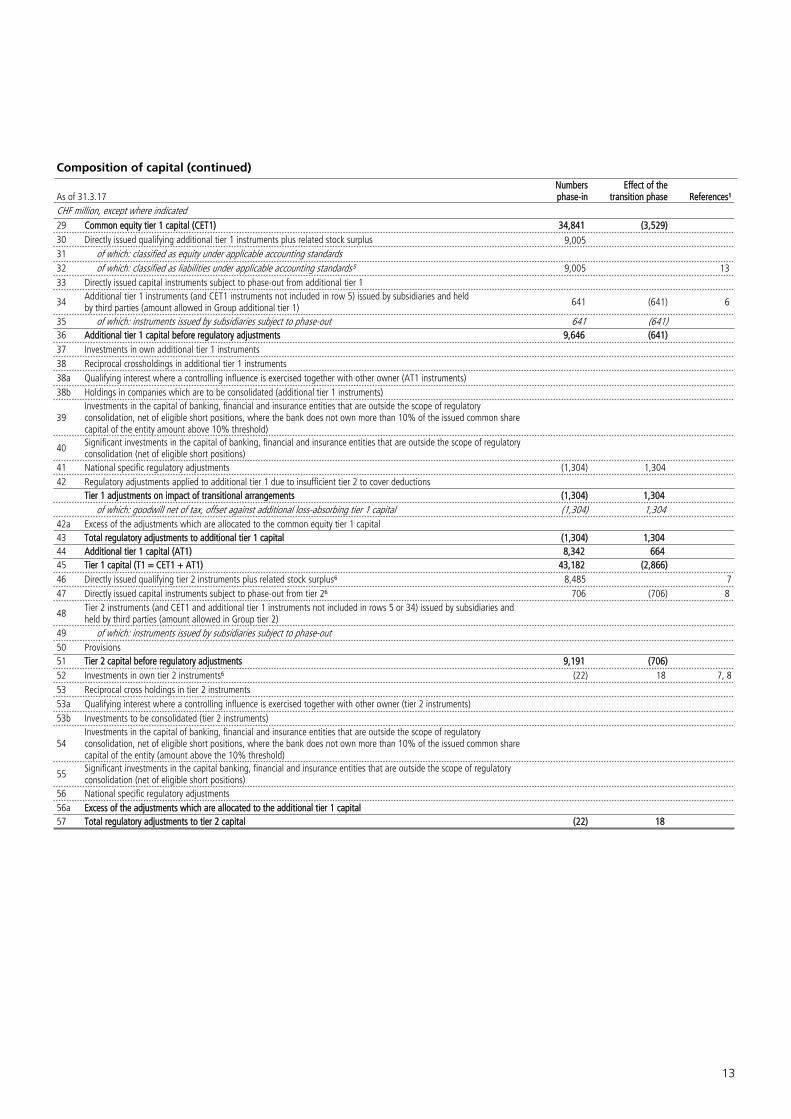
CHF million, except where indicated29 Common equity tier 1 capital (CET1) 34,841 (3,529)30 Directly issued qualifying additional tier 1 instruments plus related stock surplus 9,00531 of which: classified as equity under applicable accounting standards32 of which: classified as liabilities under applicable accounting standards⁵ 9,005 1333 Directly issued capital instruments subject to phase-out from additional tier 1
34 Additional tier 1 instruments (and CET1 instruments not included in row 5) issued by subsidiaries and held by third parties (amount allowed in Group additional tier 1) 641 (641) 6
35 of which: instruments issued by subsidiaries subject to phase-out 641 (641)36 Additional tier 1 capital before regulatory adjustments 9,646 (641)37 Investments in own additional tier 1 instruments38 Reciprocal crossholdings in additional tier 1 instruments38a Qualifying interest where a controlling influence is exercised together with other owner (AT1 instruments)38b Holdings in companies which are to be consolidated (additional tier 1 instruments)
39Investments in the capital of banking, financial and insurance entities that are outside the scope of regulatory consolidation, net of eligible short positions, where the bank does not own more than 10% of the issued common share capital of the entity amount above 10% threshold)
40 Significant investments in the capital of banking, financial and insurance entities that are outside the scope of regulatory consolidation (net of eligible short positions)
41 National specific regulatory adjustments (1,304) 1,30442 Regulatory adjustments applied to additional tier 1 due to insufficient tier 2 to cover deductions
Tier 1 adjustments on impact of transitional arrangements (1,304) 1,304of which: goodwill net of tax, offset against additional loss-absorbing tier 1 capital (1,304) 1,304
42a Excess of the adjustments which are allocated to the common equity tier 1 capital43 Total regulatory adjustments to additional tier 1 capital (1,304) 1,30444 Additional tier 1 capital (AT1) 8,342 66445 Tier 1 capital (T1 = CET1 + AT1) 43,182 (2,866)46 Directly issued qualifying tier 2 instruments plus related stock surplus⁶ 8,485 747 Directly issued capital instruments subject to phase-out from tier 2⁶ 706 (706) 8
48 Tier 2 instruments (and CET1 and additional tier 1 instruments not included in rows 5 or 34) issued by subsidiaries and held by third parties (amount allowed in Group tier 2)
49 of which: instruments issued by subsidiaries subject to phase-out50 Provisions51 Tier 2 capital before regulatory adjustments 9,191 (706)52 Investments in own tier 2 instruments⁶ (22) 18 7, 853 Reciprocal cross holdings in tier 2 instruments53a Qualifying interest where a controlling influence is exercised together with other owner (tier 2 instruments)53b Investments to be consolidated (tier 2 instruments)
54Investments in the capital of banking, financial and insurance entities that are outside the scope of regulatory consolidation, net of eligible short positions, where the bank does not own more than 10% of the issued common share capital of the entity (amount above the 10% threshold)
55 Significant investments in the capital banking, financial and insurance entities that are outside the scope of regulatory consolidation (net of eligible short positions)
56 National specific regulatory adjustments56a Excess of the adjustments which are allocated to the additional tier 1 capital57 Total regulatory adjustments to tier 2 capital (22) 18
UBS Group AG consolidated
14
Composition of capital (continued)
As of 31.3.17Numbers phase-in
Effect of the transition phase References¹
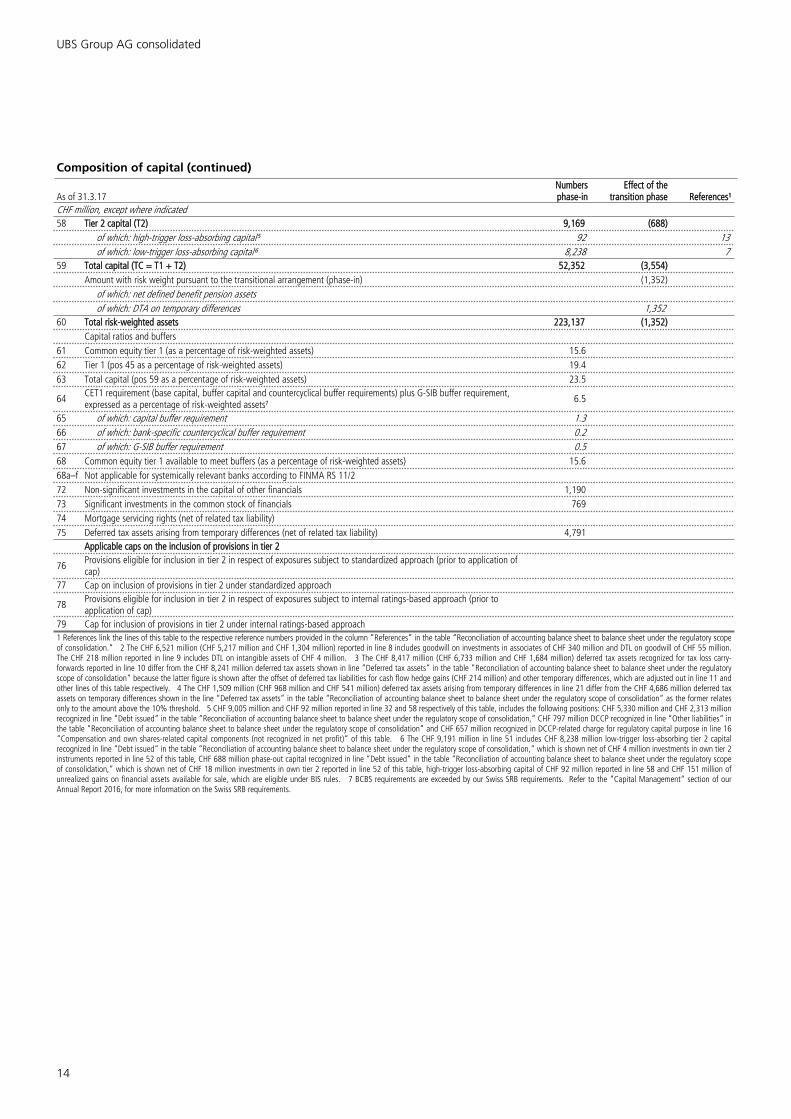
CHF million, except where indicated58 Tier 2 capital (T2) 9,169 (688)
of which: high-trigger loss-absorbing capital⁵ 92 13of which: low-trigger loss-absorbing capital⁶ 8,238 7
59 Total capital (TC = T1 + T2) 52,352 (3,554)Amount with risk weight pursuant to the transitional arrangement (phase-in) (1,352)
of which: net defined benefit pension assetsof which: DTA on temporary differences 1,352
60 Total risk-weighted assets 223,137 (1,352)Capital ratios and buffers
61 Common equity tier 1 (as a percentage of risk-weighted assets) 15.662 Tier 1 (pos 45 as a percentage of risk-weighted assets) 19.463 Total capital (pos 59 as a percentage of risk-weighted assets) 23.5
64 CET1 requirement (base capital, buffer capital and countercyclical buffer requirements) plus G-SIB buffer requirement, expressed as a percentage of risk-weighted assets⁷ 6.5
65 of which: capital buffer requirement 1.366 of which: bank-specific countercyclical buffer requirement 0.267 of which: G-SIB buffer requirement 0.568 Common equity tier 1 available to meet buffers (as a percentage of risk-weighted assets) 15.668a–f Not applicable for systemically relevant banks according to FINMA RS 11/272 Non-significant investments in the capital of other financials 1,19073 Significant investments in the common stock of financials 76974 Mortgage servicing rights (net of related tax liability)75 Deferred tax assets arising from temporary differences (net of related tax liability) 4,791
Applicable caps on the inclusion of provisions in tier 2
76 Provisions eligible for inclusion in tier 2 in respect of exposures subject to standardized approach (prior to application of cap)
77 Cap on inclusion of provisions in tier 2 under standardized approach
78 Provisions eligible for inclusion in tier 2 in respect of exposures subject to internal ratings-based approach (prior to application of cap)
79 Cap for inclusion of provisions in tier 2 under internal ratings-based approach1 References link the lines of this table to the respective reference numbers provided in the column “References” in the table “Reconciliation of accounting balance sheet to balance sheet under the regulatory scope of consolidation.“ 2 The CHF 6,521 million (CHF 5,217 million and CHF 1,304 million) reported in line 8 includes goodwill on investments in associates of CHF 340 million and DTL on goodwill of CHF 55 million. The CHF 218 million reported in line 9 includes DTL on intangible assets of CHF 4 million. 3 The CHF 8,417 million (CHF 6,733 million and CHF 1,684 million) deferred tax assets recognized for tax loss carry-forwards reported in line 10 differ from the CHF 8,241 million deferred tax assets shown in line “Deferred tax assets“ in the table “Reconciliation of accounting balance sheet to balance sheet under the regulatory scope of consolidation“ because the latter figure is shown after the offset of deferred tax liabilities for cash flow hedge gains (CHF 214 million) and other temporary differences, which are adjusted out in line 11 and other lines of this table respectively. 4 The CHF 1,509 million (CHF 968 million and CHF 541 million) deferred tax assets arising from temporary differences in line 21 differ from the CHF 4,686 million deferred tax assets on temporary differences shown in the line “Deferred tax assets” in the table “Reconciliation of accounting balance sheet to balance sheet under the regulatory scope of consolidation“ as the former relates only to the amount above the 10% threshold. 5 CHF 9,005 million and CHF 92 million reported in line 32 and 58 respectively of this table, includes the following positions: CHF 5,330 million and CHF 2,313 million recognized in line “Debt issued“ in the table “Reconciliation of accounting balance sheet to balance sheet under the regulatory scope of consolidation,“ CHF 797 million DCCP recognized in line “Other liabilities“ in the table “Reconciliation of accounting balance sheet to balance sheet under the regulatory scope of consolidation“ and CHF 657 million recognized in DCCP-related charge for regulatory capital purpose in line 16 “Compensation and own shares-related capital components (not recognized in net profit)“ of this table. 6 The CHF 9,191 million in line 51 includes CHF 8,238 million low-trigger loss-absorbing tier 2 capital recognized in line “Debt issued“ in the table “Reconciliation of accounting balance sheet to balance sheet under the regulatory scope of consolidation,“ which is shown net of CHF 4 million investments in own tier 2 instruments reported in line 52 of this table, CHF 688 million phase-out capital recognized in line “Debt issued“ in the table “Reconciliation of accounting balance sheet to balance sheet under the regulatory scope of consolidation,“ which is shown net of CHF 18 million investments in own tier 2 reported in line 52 of this table, high-trigger loss-absorbing capital of CHF 92 million reported in line 58 and CHF 151 million of unrealized gains on financial assets available for sale, which are eligible under BIS rules. 7 BCBS requirements are exceeded by our Swiss SRB requirements. Refer to the “Capital Management“ section of our Annual Report 2016, for more information on the Swiss SRB requirements.
15
Section 4 Leverage ratio
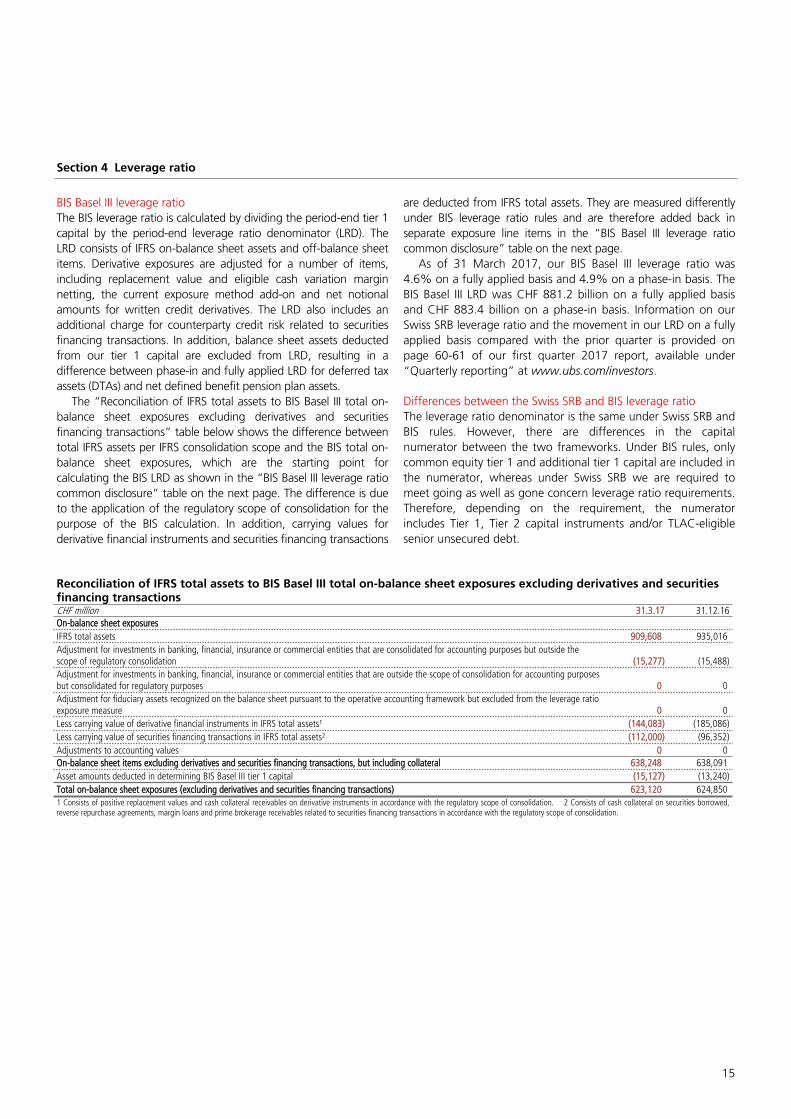
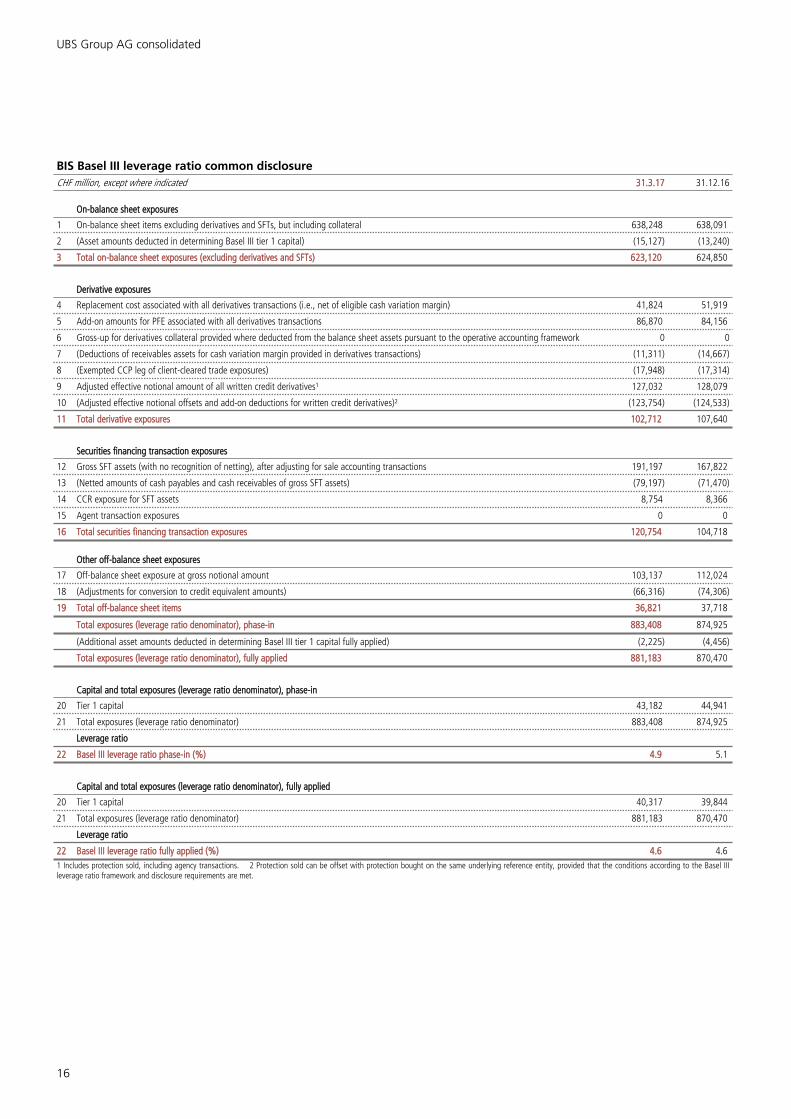
BIS Basel III leverage ratioThe BIS leverage ratio is calculated by dividing the period-end tier 1 capital by the period-end leverage ratio denominator (LRD). The LRD consists of IFRS on-balance sheet assets and off-balance sheet items. Derivative exposures are adjusted for a number of items, including replacement value and eligible cash variation margin netting, the current exposure method add-on and net notional amounts for written credit derivatives. The LRD also includes an additional charge for counterparty credit risk related to securities financing transactions. In addition, balance sheet assets deducted from our tier 1 capital are excluded from LRD, resulting in a difference between phase-in and fully applied LRD for deferred tax assets (DTAs) and net defined benefit pension plan assets.
The “Reconciliation of IFRS total assets to BIS Basel III total on-balance sheet exposures excluding derivatives and securities financing transactions” table below shows the difference between total IFRS assets per IFRS consolidation scope and the BIS total on-balance sheet exposures, which are the starting point for calculating the BIS LRD as shown in the “BIS Basel III leverage ratio common disclosure” table on the next page. The difference is due to the application of the regulatory scope of consolidation for the purpose of the BIS calculation. In addition, carrying values for derivative financial instruments and securities financing transactions
are deducted from IFRS total assets. They are measured differently under BIS leverage ratio rules and are therefore added back in separate exposure line items in the “BIS Basel III leverage ratio common disclosure” table on the next page.
As of 31 March 2017, our BIS Basel III leverage ratio was 4.6% on a fully applied basis and 4.9% on a phase-in basis. The BIS Basel III LRD was CHF 881.2 billion on a fully applied basis and CHF 883.4 billion on a phase-in basis. Information on our Swiss SRB leverage ratio and the movement in our LRD on a fully applied basis compared with the prior quarter is provided on page 60-61 of our first quarter 2017 report, available under “Quarterly reporting” at www.ubs.com/investors.
Differences between the Swiss SRB and BIS leverage ratioThe leverage ratio denominator is the same under Swiss SRB and BIS rules. However, there are differences in the capital numerator between the two frameworks. Under BIS rules, only common equity tier 1 and additional tier 1 capital are included in the numerator, whereas under Swiss SRB we are required to meet going as well as gone concern leverage ratio requirements. Therefore, depending on the requirement, the numerator includes Tier 1, Tier 2 capital instruments and/or TLAC-eligible senior unsecured debt.
Reconciliation of IFRS total assets to BIS Basel III total on-balance sheet exposures excluding derivatives and securities financing transactionsCHF million 31.3.17 31.12.16On-balance sheet exposuresIFRS total assets 909,608 935,016Adjustment for investments in banking, financial, insurance or commercial entities that are consolidated for accounting purposes but outside the scope of regulatory consolidation (15,277) (15,488)Adjustment for investments in banking, financial, insurance or commercial entities that are outside the scope of consolidation for accounting purposes but consolidated for regulatory purposes 0 0Adjustment for fiduciary assets recognized on the balance sheet pursuant to the operative accounting framework but excluded from the leverage ratio exposure measure 0 0Less carrying value of derivative financial instruments in IFRS total assets¹ (144,083) (185,086)Less carrying value of securities financing transactions in IFRS total assets² (112,000) (96,352)Adjustments to accounting values 0 0On-balance sheet items excluding derivatives and securities financing transactions, but including collateral 638,248 638,091Asset amounts deducted in determining BIS Basel III tier 1 capital (15,127) (13,240)Total on-balance sheet exposures (excluding derivatives and securities financing transactions) 623,120 624,8501 Consists of positive replacement values and cash collateral receivables on derivative instruments in accordance with the regulatory scope of consolidation. 2 Consists of cash collateral on securities borrowed, reverse repurchase agreements, margin loans and prime brokerage receivables related to securities financing transactions in accordance with the regulatory scope of consolidation.
UBS Group AG consolidated
16
BIS Basel III leverage ratio common disclosureCHF million, except where indicated 31.3.17 31.12.16
On-balance sheet exposures
1 On-balance sheet items excluding derivatives and SFTs, but including collateral 638,248 638,091
2 (Asset amounts deducted in determining Basel III tier 1 capital) (15,127) (13,240)
3 Total on-balance sheet exposures (excluding derivatives and SFTs) 623,120 624,850
Derivative exposures
4 Replacement cost associated with all derivatives transactions (i.e., net of eligible cash variation margin) 41,824 51,919
5 Add-on amounts for PFE associated with all derivatives transactions 86,870 84,156
6 Gross-up for derivatives collateral provided where deducted from the balance sheet assets pursuant to the operative accounting framework 0 0
7 (Deductions of receivables assets for cash variation margin provided in derivatives transactions) (11,311) (14,667)
8 (Exempted CCP leg of client-cleared trade exposures) (17,948) (17,314)
9 Adjusted effective notional amount of all written credit derivatives¹ 127,032 128,079
10 (Adjusted effective notional offsets and add-on deductions for written credit derivatives)² (123,754) (124,533)
11 Total derivative exposures 102,712 107,640
Securities financing transaction exposures
12 Gross SFT assets (with no recognition of netting), after adjusting for sale accounting transactions 191,197 167,822
13 (Netted amounts of cash payables and cash receivables of gross SFT assets) (79,197) (71,470)
14 CCR exposure for SFT assets 8,754 8,366
15 Agent transaction exposures 0 0
16 Total securities financing transaction exposures 120,754 104,718
Other off-balance sheet exposures
17 Off-balance sheet exposure at gross notional amount 103,137 112,024
18 (Adjustments for conversion to credit equivalent amounts) (66,316) (74,306)
19 Total off-balance sheet items 36,821 37,718
Total exposures (leverage ratio denominator), phase-in 883,408 874,925
(Additional asset amounts deducted in determining Basel III tier 1 capital fully applied) (2,225) (4,456)
Total exposures (leverage ratio denominator), fully applied 881,183 870,470
Capital and total exposures (leverage ratio denominator), phase-in
20 Tier 1 capital 43,182 44,941
21 Total exposures (leverage ratio denominator) 883,408 874,925
Leverage ratio
22 Basel III leverage ratio phase-in (%) 4.9 5.1
Capital and total exposures (leverage ratio denominator), fully applied
20 Tier 1 capital 40,317 39,844
21 Total exposures (leverage ratio denominator) 881,183 870,470
Leverage ratio
22 Basel III leverage ratio fully applied (%) 4.6 4.61 Includes protection sold, including agency transactions. 2 Protection sold can be offset with protection bought on the same underlying reference entity, provided that the conditions according to the Basel III leverage ratio framework and disclosure requirements are met.
17
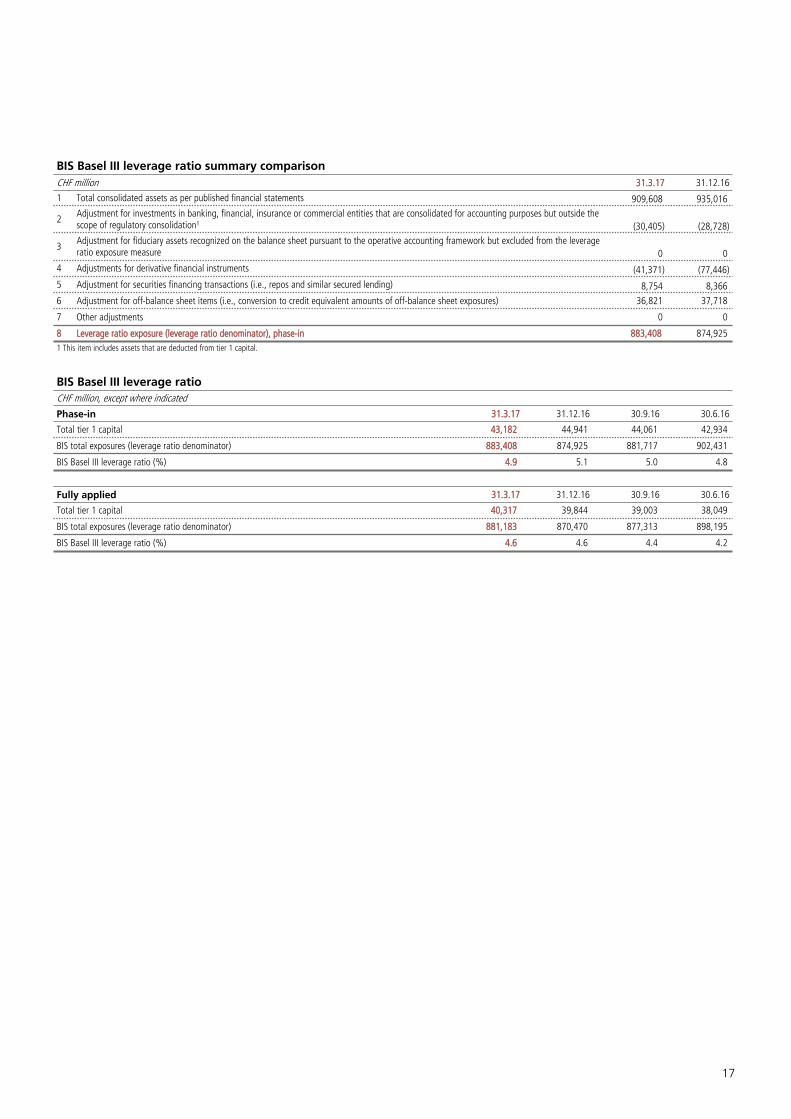
BIS Basel III leverage ratio summary comparisonCHF million 31.3.17 31.12.16
1 Total consolidated assets as per published financial statements 909,608 935,016
2 Adjustment for investments in banking, financial, insurance or commercial entities that are consolidated for accounting purposes but outside the scope of regulatory consolidation¹ (30,405) (28,728)
3 Adjustment for fiduciary assets recognized on the balance sheet pursuant to the operative accounting framework but excluded from the leverage ratio exposure measure 0 0
4 Adjustments for derivative financial instruments (41,371) (77,446)5 Adjustment for securities financing transactions (i.e., repos and similar secured lending) 8,754 8,3666 Adjustment for off-balance sheet items (i.e., conversion to credit equivalent amounts of off-balance sheet exposures) 36,821 37,718
7 Other adjustments 0 0
8 Leverage ratio exposure (leverage ratio denominator), phase-in 883,408 874,9251 This item includes assets that are deducted from tier 1 capital.
BIS Basel III leverage ratioCHF million, except where indicated
Phase-in 31.3.17 31.12.16 30.9.16 30.6.16
Total tier 1 capital 43,182 44,941 44,061 42,934
BIS total exposures (leverage ratio denominator) 883,408 874,925 881,717 902,431
BIS Basel III leverage ratio (%) 4.9 5.1 5.0 4.8
Fully applied 31.3.17 31.12.16 30.9.16 30.6.16
Total tier 1 capital 40,317 39,844 39,003 38,049
BIS total exposures (leverage ratio denominator) 881,183 870,470 877,313 898,195
BIS Basel III leverage ratio (%) 4.6 4.6 4.4 4.2
UBS Group AG consolidated
18
Section 5 Liquidity coverage ratio
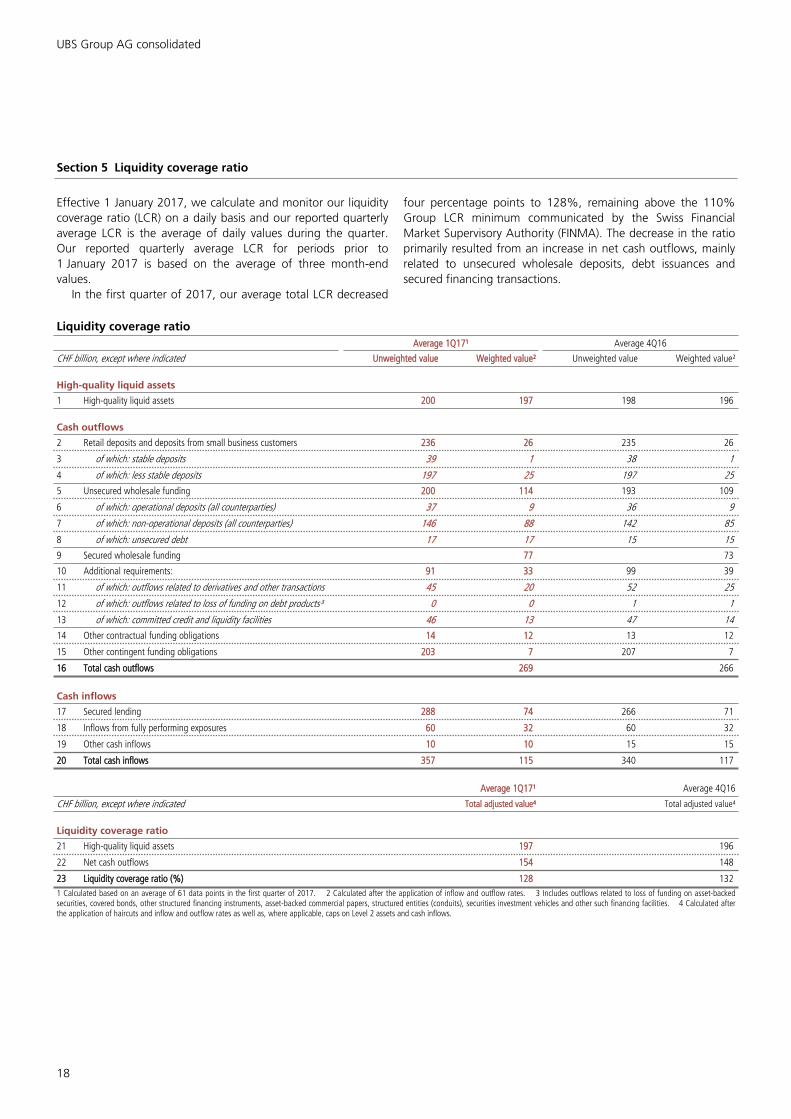
Effective 1 January 2017, we calculate and monitor our liquidity coverage ratio (LCR) on a daily basis and our reported quarterly average LCR is the average of daily values during the quarter. Our reported quarterly average LCR for periods prior to 1 January 2017 is based on the average of three month-end values.
In the first quarter of 2017, our average total LCR decreased
four percentage points to 128%, remaining above the 110% Group LCR minimum communicated by the Swiss Financial Market Supervisory Authority (FINMA). The decrease in the ratio primarily resulted from an increase in net cash outflows, mainly related to unsecured wholesale deposits, debt issuances and secured financing transactions.
Liquidity coverage ratioAverage 1Q17¹ Average 4Q16
CHF billion, except where indicated Unweighted value Weighted value² Unweighted value Weighted value²
High-quality liquid assets
1 High-quality liquid assets 200 197 198 196
Cash outflows
2 Retail deposits and deposits from small business customers 236 26 235 26
3 of which: stable deposits 39 1 38 1
4 of which: less stable deposits 197 25 197 25
5 Unsecured wholesale funding 200 114 193 109
6 of which: operational deposits (all counterparties) 37 9 36 9
7 of which: non-operational deposits (all counterparties) 146 88 142 85
8 of which: unsecured debt 17 17 15 15
9 Secured wholesale funding 77 73
10 Additional requirements: 91 33 99 39
11 of which: outflows related to derivatives and other transactions 45 20 52 25
12 of which: outflows related to loss of funding on debt products³ 0 0 1 1
13 of which: committed credit and liquidity facilities 46 13 47 14
14 Other contractual funding obligations 14 12 13 12
15 Other contingent funding obligations 203 7 207 7
16 Total cash outflows 269 266
Cash inflows
17 Secured lending 288 74 266 71
18 Inflows from fully performing exposures 60 32 60 32
19 Other cash inflows 10 10 15 15
20 Total cash inflows 357 115 340 117
Average 1Q17¹ Average 4Q16
CHF billion, except where indicated Total adjusted value⁴ Total adjusted value⁴
Liquidity coverage ratio
21 High-quality liquid assets 197 196
22 Net cash outflows 154 148
23 Liquidity coverage ratio (%) 128 1321 Calculated based on an average of 61 data points in the first quarter of 2017. 2 Calculated after the application of inflow and outflow rates. 3 Includes outflows related to loss of funding on asset-backed securities, covered bonds, other structured financing instruments, asset-backed commercial papers, structured entities (conduits), securities investment vehicles and other such financing facilities. 4 Calculated after the application of haircuts and inflow and outflow rates as well as, where applicable, caps on Level 2 assets and cash inflows.
19
Significant regulated subsidiaries and sub-groups
Significant regulated subsidiaries and sub-groups
20
Section 1 Introduction
The following sections below include required information on the regulatory capital components and capital ratios, as well as leverage and liquidity coverage ratios where required, of UBS AG standalone, UBS Switzerland AG standalone, UBS Limited standalone and UBS Americas Holding LLC consolidated. UBS AG consolidated capital and leverage ratio information is provided in the UBS AG first quarter 2017 report, which will be available from 3 May 2017 under “Quarterly reporting” at www.ubs.com/investors.
Local regulators may also require publication of Pillar 3 information at a subsidiary or sub-group level. Where applicable, these local disclosures are provided under “Disclosure for legal entities” at www.ubs.com/investors.
Capital information in this section is based on Pillar 1 capital requirements. Entities may be subject to significant additional Pillar 2 requirements, which represent additional amounts of capital considered necessary and agreed with regulators based on the risk profile of the entities.
Section 2 UBS AG standalone
Swiss SRB capital requirements and capital informationUnder Swiss SRB regulations, article 125 “Reliefs for financial groups and individual institutions” of the Capital Adequacy Ordinance (CAO) stipulates that the Swiss Financial Market Supervisory Authority (FINMA) may grant, under certain conditions, capital relief to individual institutions to ensure that an individual institution’s compliance with the capital requirements does not lead to a de facto overcapitalization of the group of which it is a part.
FINMA granted relief concerning the regulatory capital requirements of UBS AG on a standalone basis by means of a decree issued on 20 December 2013, which became effective on 1 January 2014 and is still effective. The resulting capital requirements are:
1. Total capital requirement of 14%, of which 10% must be satisfied with common equity tier 1 (CET1) capital
This represents a relief at UBS AG standalone level compared with the capital requirements set by FINMA for the UBS Group. However, UBS AG standalone has been required to meet this capital requirement with immediate effect since 1 January 2014.
2. Consistent treatment of direct and indirect investments of UBS AG standalone in the equity of its subsidiaries active in banking and finance
The aggregate amount of direct and indirect investments of UBS AG standalone in the equity of its subsidiaries is risk-weighted at
200% up to a threshold determined by FINMA. The total amount exceeding that threshold must be deducted from capital, 50% from CET1 and 50% from other capital. This approach could affect risk-weighted assets (RWA) and / or eligible capital, depending on the threshold defined by FINMA. If all investments are below the threshold, the resulting total capital requirement is 28%. If the threshold is set at zero, all investments would be deducted from capital. While the application of a threshold to directly held investments represents a relief, the inclusion of indirect investments represents a tightening of the requirements.
Overall, the decree provides an important contribution to ensuring that the capital requirements of UBS AG standalone do not result in a de facto overcapitalization of the Group.
The tables in this sub-section provide UBS AG standalone capital information under Swiss SRB regulations, as per the aforementioned FINMA decree. In addition to the 14% total capital requirement set by the decree, UBS AG is required to comply with countercyclical buffer requirements on a standalone basis. The effect of the countercyclical buffer capital requirements was immaterial as of 31 March 2017.
21
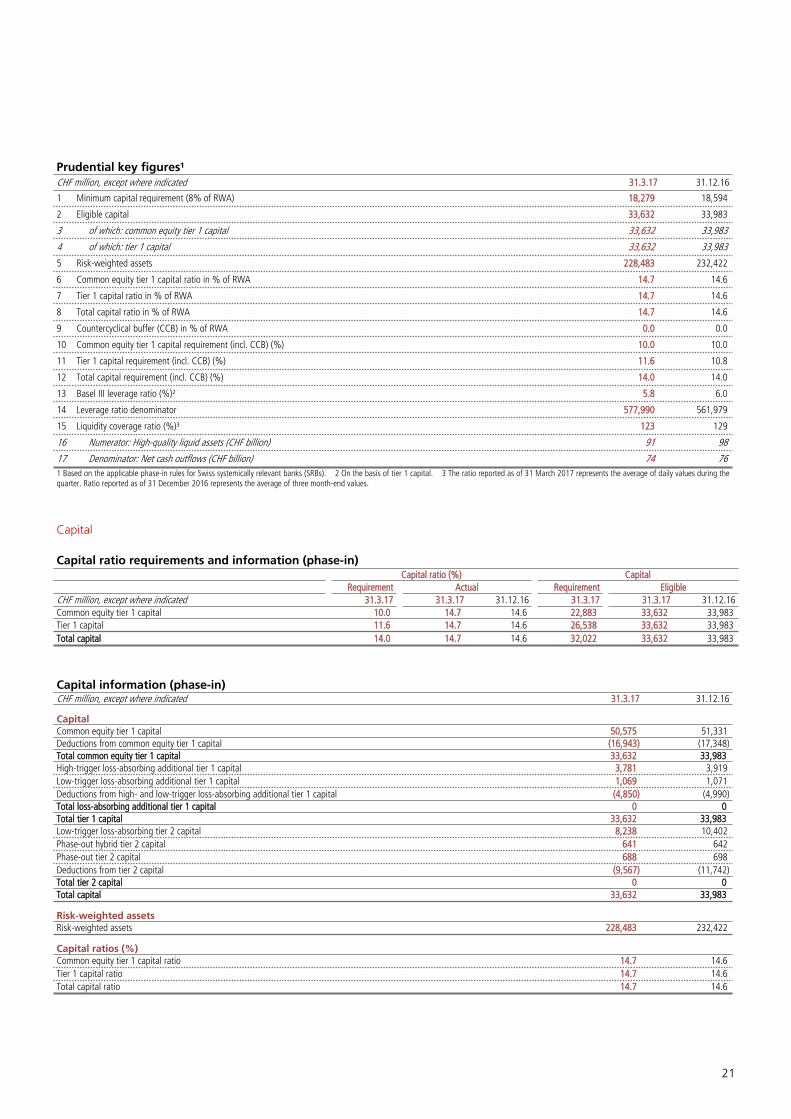
Prudential key figures¹CHF million, except where indicated 31.3.17 31.12.16
1 Minimum capital requirement (8% of RWA) 18,279 18,594
2 Eligible capital 33,632 33,983
3 of which: common equity tier 1 capital 33,632 33,983
4 of which: tier 1 capital 33,632 33,983
5 Risk-weighted assets 228,483 232,422
6 Common equity tier 1 capital ratio in % of RWA 14.7 14.6
7 Tier 1 capital ratio in % of RWA 14.7 14.6
8 Total capital ratio in % of RWA 14.7 14.6
9 Countercyclical buffer (CCB) in % of RWA 0.0 0.0
10 Common equity tier 1 capital requirement (incl. CCB) (%) 10.0 10.0
11 Tier 1 capital requirement (incl. CCB) (%) 11.6 10.8
12 Total capital requirement (incl. CCB) (%) 14.0 14.0
13 Basel III leverage ratio (%)² 5.8 6.0
14 Leverage ratio denominator 577,990 561,979
15 Liquidity coverage ratio (%)³ 123 129
16 Numerator: High-quality liquid assets (CHF billion) 91 98
17 Denominator: Net cash outflows (CHF billion) 74 761 Based on the applicable phase-in rules for Swiss systemically relevant banks (SRBs). 2 On the basis of tier 1 capital. 3 The ratio reported as of 31 March 2017 represents the average of daily values during the quarter. Ratio reported as of 31 December 2016 represents the average of three month-end values.
Capital
Capital ratio requirements and information (phase-in)Capital ratio (%) Capital
Requirement Actual Requirement Eligible CHF million, except where indicated 31.3.17 31.3.17 31.12.16 31.3.17 31.3.17 31.12.16Common equity tier 1 capital 10.0 14.7 14.6 22,883 33,632 33,983Tier 1 capital 11.6 14.7 14.6 26,538 33,632 33,983Total capital 14.0 14.7 14.6 32,022 33,632 33,983
Capital information (phase-in)CHF million, except where indicated 31.3.17 31.12.16
CapitalCommon equity tier 1 capital 50,575 51,331Deductions from common equity tier 1 capital (16,943) (17,348)Total common equity tier 1 capital 33,632 33,983High-trigger loss-absorbing additional tier 1 capital 3,781 3,919Low-trigger loss-absorbing additional tier 1 capital 1,069 1,071Deductions from high- and low-trigger loss-absorbing additional tier 1 capital (4,850) (4,990)Total loss-absorbing additional tier 1 capital 0 0Total tier 1 capital 33,632 33,983Low-trigger loss-absorbing tier 2 capital 8,238 10,402Phase-out hybrid tier 2 capital 641 642Phase-out tier 2 capital 688 698Deductions from tier 2 capital (9,567) (11,742)Total tier 2 capital 0 0Total capital 33,632 33,983
Risk-weighted assetsRisk-weighted assets 228,483 232,422
Capital ratios (%)Common equity tier 1 capital ratio 14.7 14.6Tier 1 capital ratio 14.7 14.6Total capital ratio 14.7 14.6
Significant regulated subsidiaries and sub-groups
22
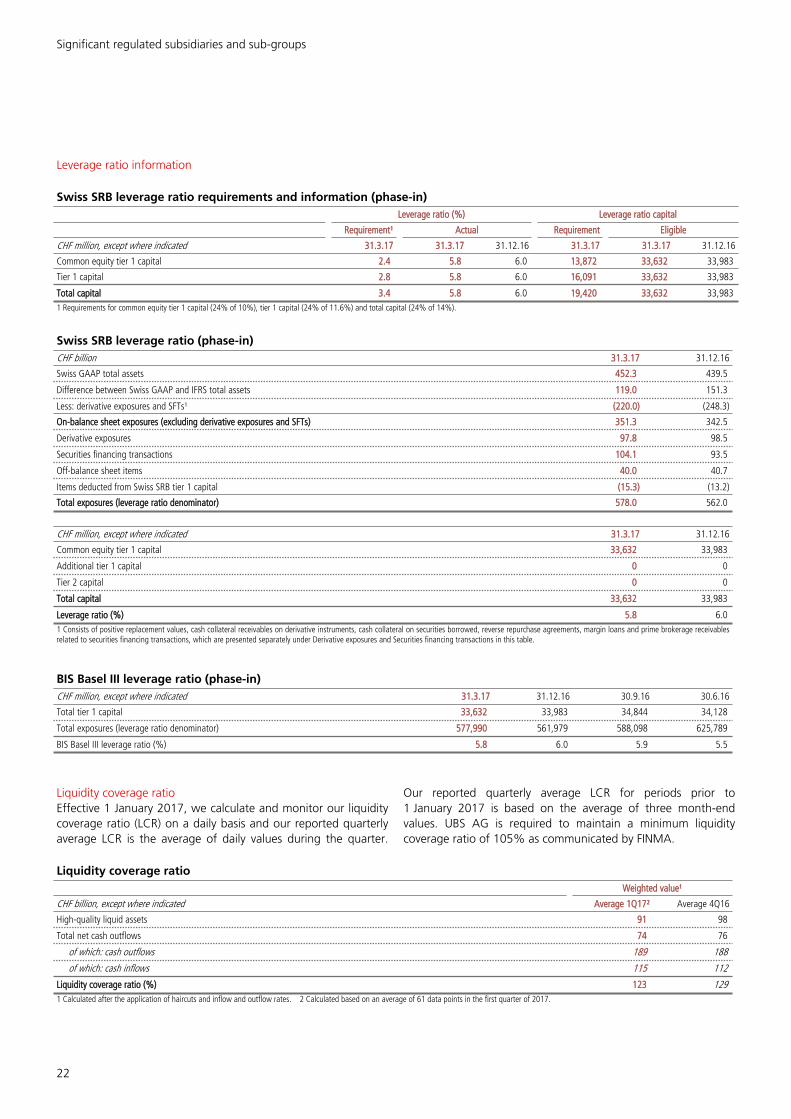
Leverage ratio information
Swiss SRB leverage ratio requirements and information (phase-in)Leverage ratio (%) Leverage ratio capital
Requirement¹ Actual Requirement Eligible
CHF million, except where indicated 31.3.17 31.3.17 31.12.16 31.3.17 31.3.17 31.12.16
Common equity tier 1 capital 2.4 5.8 6.0 13,872 33,632 33,983
Tier 1 capital 2.8 5.8 6.0 16,091 33,632 33,983
Total capital 3.4 5.8 6.0 19,420 33,632 33,9831 Requirements for common equity tier 1 capital (24% of 10%), tier 1 capital (24% of 11.6%) and total capital (24% of 14%).
Swiss SRB leverage ratio (phase-in)CHF billion 31.3.17 31.12.16
Swiss GAAP total assets 452.3 439.5
Difference between Swiss GAAP and IFRS total assets 119.0 151.3
Less: derivative exposures and SFTs¹ (220.0) (248.3)
On-balance sheet exposures (excluding derivative exposures and SFTs) 351.3 342.5
Derivative exposures 97.8 98.5
Securities financing transactions 104.1 93.5
Off-balance sheet items 40.0 40.7
Items deducted from Swiss SRB tier 1 capital (15.3) (13.2)
Total exposures (leverage ratio denominator) 578.0 562.0
CHF million, except where indicated 31.3.17 31.12.16
Common equity tier 1 capital 33,632 33,983
Additional tier 1 capital 0 0
Tier 2 capital 0 0
Total capital 33,632 33,983
Leverage ratio (%) 5.8 6.01 Consists of positive replacement values, cash collateral receivables on derivative instruments, cash collateral on securities borrowed, reverse repurchase agreements, margin loans and prime brokerage receivables related to securities financing transactions, which are presented separately under Derivative exposures and Securities financing transactions in this table.
BIS Basel III leverage ratio (phase-in)CHF million, except where indicated 31.3.17 31.12.16 30.9.16 30.6.16
Total tier 1 capital 33,632 33,983 34,844 34,128
Total exposures (leverage ratio denominator) 577,990 561,979 588,098 625,789
BIS Basel III leverage ratio (%) 5.8 6.0 5.9 5.5
Liquidity coverage ratioEffective 1 January 2017, we calculate and monitor our liquidity coverage ratio (LCR) on a daily basis and our reported quarterly average LCR is the average of daily values during the quarter.
Our reported quarterly average LCR for periods prior to 1 January 2017 is based on the average of three month-end values. UBS AG is required to maintain a minimum liquidity coverage ratio of 105% as communicated by FINMA.
Liquidity coverage ratioWeighted value¹
CHF billion, except where indicated Average 1Q17² Average 4Q16
High-quality liquid assets 91 98
Total net cash outflows 74 76
of which: cash outflows 189 188
of which: cash inflows 115 112
Liquidity coverage ratio (%) 123 1291 Calculated after the application of haircuts and inflow and outflow rates. 2 Calculated based on an average of 61 data points in the first quarter of 2017.
23
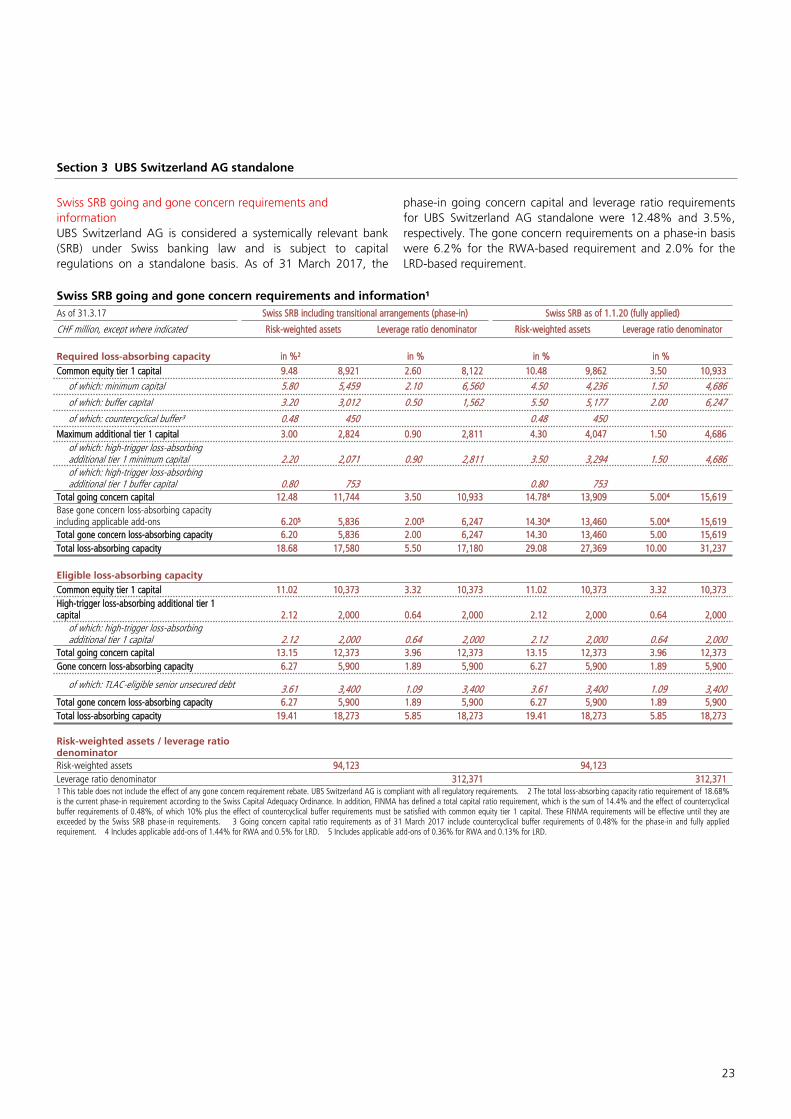
Section 3 UBS Switzerland AG standalone
Swiss SRB going and gone concern requirements and informationUBS Switzerland AG is considered a systemically relevant bank (SRB) under Swiss banking law and is subject to capital regulations on a standalone basis. As of 31 March 2017, the
phase-in going concern capital and leverage ratio requirements for UBS Switzerland AG standalone were 12.48% and 3.5%, respectively. The gone concern requirements on a phase-in basis were 6.2% for the RWA-based requirement and 2.0% for the LRD-based requirement.
Swiss SRB going and gone concern requirements and information¹As of 31.3.17 Swiss SRB including transitional arrangements (phase-in) Swiss SRB as of 1.1.20 (fully applied)
CHF million, except where indicated Risk-weighted assets Leverage ratio denominator Risk-weighted assets Leverage ratio denominator
Required loss-absorbing capacity in %² in % in % in %Common equity tier 1 capital 9.48 8,921 2.60 8,122 10.48 9,862 3.50 10,933
of which: minimum capital 5.80 5,459 2.10 6,560 4.50 4,236 1.50 4,686
of which: buffer capital 3.20 3,012 0.50 1,562 5.50 5,177 2.00 6,247
of which: countercyclical buffer³ 0.48 450 0.48 450Maximum additional tier 1 capital 3.00 2,824 0.90 2,811 4.30 4,047 1.50 4,686
of which: high-trigger loss-absorbing additional tier 1 minimum capital 2.20 2,071 0.90 2,811 3.50 3,294 1.50 4,686of which: high-trigger loss-absorbing additional tier 1 buffer capital 0.80 753 0.80 753
Total going concern capital 12.48 11,744 3.50 10,933 14.78⁴ 13,909 5.00⁴ 15,619Base gone concern loss-absorbing capacity including applicable add-ons 6.20⁵ 5,836 2.00⁵ 6,247 14.30⁴ 13,460 5.00⁴ 15,619Total gone concern loss-absorbing capacity 6.20 5,836 2.00 6,247 14.30 13,460 5.00 15,619Total loss-absorbing capacity 18.68 17,580 5.50 17,180 29.08 27,369 10.00 31,237
Eligible loss-absorbing capacityCommon equity tier 1 capital 11.02 10,373 3.32 10,373 11.02 10,373 3.32 10,373High-trigger loss-absorbing additional tier 1 capital 2.12 2,000 0.64 2,000 2.12 2,000 0.64 2,000
of which: high-trigger loss-absorbing additional tier 1 capital 2.12 2,000 0.64 2,000 2.12 2,000 0.64 2,000
Total going concern capital 13.15 12,373 3.96 12,373 13.15 12,373 3.96 12,373Gone concern loss-absorbing capacity 6.27 5,900 1.89 5,900 6.27 5,900 1.89 5,900
of which: TLAC-eligible senior unsecured debt 3.61 3,400 1.09 3,400 3.61 3,400 1.09 3,400Total gone concern loss-absorbing capacity 6.27 5,900 1.89 5,900 6.27 5,900 1.89 5,900Total loss-absorbing capacity 19.41 18,273 5.85 18,273 19.41 18,273 5.85 18,273
Risk-weighted assets / leverage ratio denominatorRisk-weighted assets 94,123 94,123Leverage ratio denominator 312,371 312,3711 This table does not include the effect of any gone concern requirement rebate. UBS Switzerland AG is compliant with all regulatory requirements. 2 The total loss-absorbing capacity ratio requirement of 18.68% is the current phase-in requirement according to the Swiss Capital Adequacy Ordinance. In addition, FINMA has defined a total capital ratio requirement, which is the sum of 14.4% and the effect of countercyclical buffer requirements of 0.48%, of which 10% plus the effect of countercyclical buffer requirements must be satisfied with common equity tier 1 capital. These FINMA requirements will be effective until they are exceeded by the Swiss SRB phase-in requirements. 3 Going concern capital ratio requirements as of 31 March 2017 include countercyclical buffer requirements of 0.48% for the phase-in and fully applied requirement. 4 Includes applicable add-ons of 1.44% for RWA and 0.5% for LRD. 5 Includes applicable add-ons of 0.36% for RWA and 0.13% for LRD.
Significant regulated subsidiaries and sub-groups
24
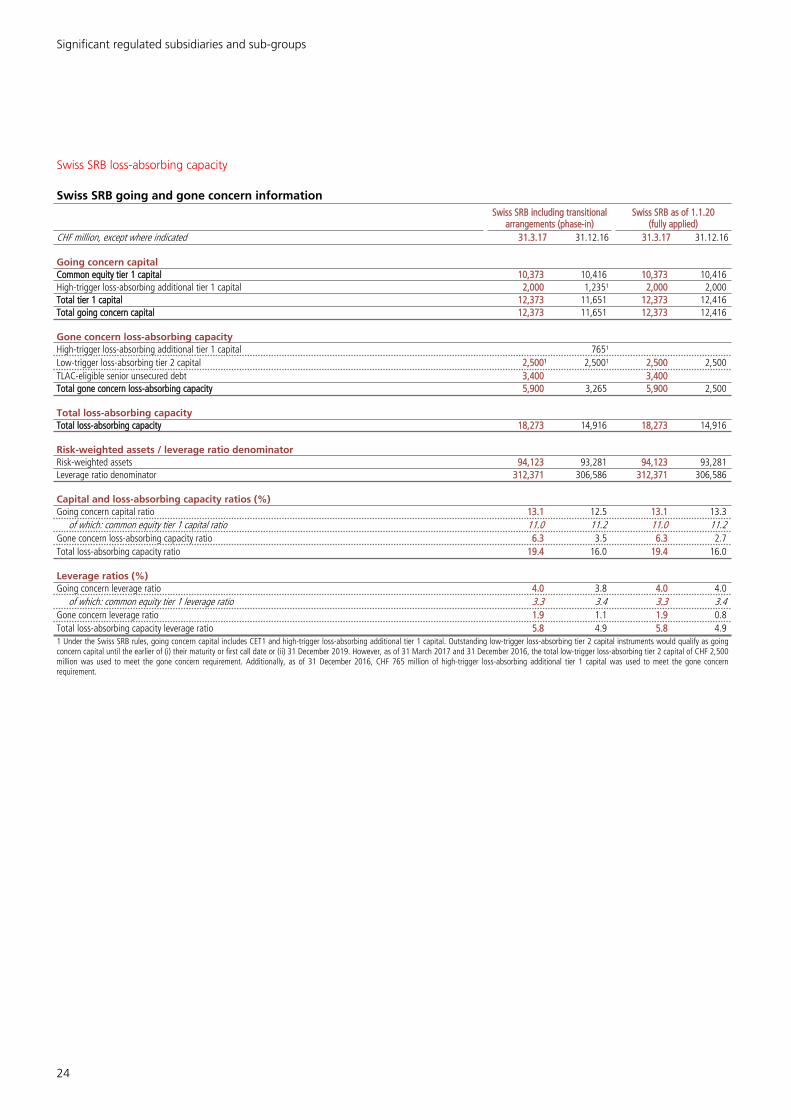
Swiss SRB loss-absorbing capacity
Swiss SRB going and gone concern information Swiss SRB including transitional
arrangements (phase-in)Swiss SRB as of 1.1.20
(fully applied)CHF million, except where indicated 31.3.17 31.12.16 31.3.17 31.12.16
Going concern capitalCommon equity tier 1 capital 10,373 10,416 10,373 10,416High-trigger loss-absorbing additional tier 1 capital 2,000 1,235¹ 2,000 2,000Total tier 1 capital 12,373 11,651 12,373 12,416Total going concern capital 12,373 11,651 12,373 12,416
Gone concern loss-absorbing capacityHigh-trigger loss-absorbing additional tier 1 capital 765¹Low-trigger loss-absorbing tier 2 capital 2,500¹ 2,500¹ 2,500 2,500TLAC-eligible senior unsecured debt 3,400 3,400Total gone concern loss-absorbing capacity 5,900 3,265 5,900 2,500
Total loss-absorbing capacityTotal loss-absorbing capacity 18,273 14,916 18,273 14,916
Risk-weighted assets / leverage ratio denominatorRisk-weighted assets 94,123 93,281 94,123 93,281Leverage ratio denominator 312,371 306,586 312,371 306,586
Capital and loss-absorbing capacity ratios (%)Going concern capital ratio 13.1 12.5 13.1 13.3
of which: common equity tier 1 capital ratio 11.0 11.2 11.0 11.2Gone concern loss-absorbing capacity ratio 6.3 3.5 6.3 2.7Total loss-absorbing capacity ratio 19.4 16.0 19.4 16.0
Leverage ratios (%)Going concern leverage ratio 4.0 3.8 4.0 4.0
of which: common equity tier 1 leverage ratio 3.3 3.4 3.3 3.4Gone concern leverage ratio 1.9 1.1 1.9 0.8Total loss-absorbing capacity leverage ratio 5.8 4.9 5.8 4.91 Under the Swiss SRB rules, going concern capital includes CET1 and high-trigger loss-absorbing additional tier 1 capital. Outstanding low-trigger loss-absorbing tier 2 capital instruments would qualify as going concern capital until the earlier of (i) their maturity or first call date or (ii) 31 December 2019. However, as of 31 March 2017 and 31 December 2016, the total low-trigger loss-absorbing tier 2 capital of CHF 2,500 million was used to meet the gone concern requirement. Additionally, as of 31 December 2016, CHF 765 million of high-trigger loss-absorbing additional tier 1 capital was used to meet the gone concern requirement.
25
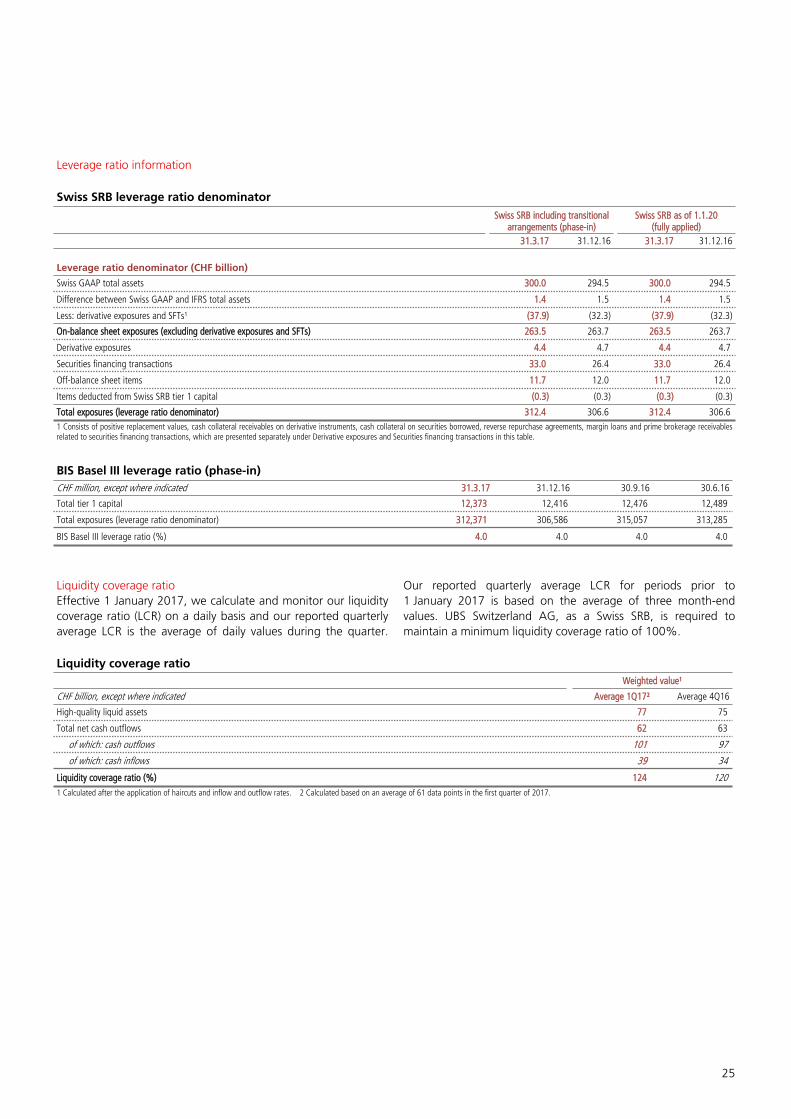
Leverage ratio information
Swiss SRB leverage ratio denominator
Swiss SRB including transitionalarrangements (phase-in)
Swiss SRB as of 1.1.20(fully applied)
31.3.17 31.12.16 31.3.17 31.12.16
Leverage ratio denominator (CHF billion)
Swiss GAAP total assets 300.0 294.5 300.0 294.5
Difference between Swiss GAAP and IFRS total assets 1.4 1.5 1.4 1.5
Less: derivative exposures and SFTs¹ (37.9) (32.3) (37.9) (32.3)
On-balance sheet exposures (excluding derivative exposures and SFTs) 263.5 263.7 263.5 263.7
Derivative exposures 4.4 4.7 4.4 4.7
Securities financing transactions 33.0 26.4 33.0 26.4
Off-balance sheet items 11.7 12.0 11.7 12.0
Items deducted from Swiss SRB tier 1 capital (0.3) (0.3) (0.3) (0.3)
Total exposures (leverage ratio denominator) 312.4 306.6 312.4 306.61 Consists of positive replacement values, cash collateral receivables on derivative instruments, cash collateral on securities borrowed, reverse repurchase agreements, margin loans and prime brokerage receivables related to securities financing transactions, which are presented separately under Derivative exposures and Securities financing transactions in this table.
BIS Basel III leverage ratio (phase-in)CHF million, except where indicated 31.3.17 31.12.16 30.9.16 30.6.16
Total tier 1 capital 12,373 12,416 12,476 12,489
Total exposures (leverage ratio denominator) 312,371 306,586 315,057 313,285
BIS Basel III leverage ratio (%) 4.0 4.0 4.0 4.0
Liquidity coverage ratioEffective 1 January 2017, we calculate and monitor our liquidity coverage ratio (LCR) on a daily basis and our reported quarterly average LCR is the average of daily values during the quarter.
Our reported quarterly average LCR for periods prior to 1 January 2017 is based on the average of three month-end values. UBS Switzerland AG, as a Swiss SRB, is required to maintain a minimum liquidity coverage ratio of 100%.
Liquidity coverage ratioWeighted value¹
CHF billion, except where indicated Average 1Q17² Average 4Q16
High-quality liquid assets 77 75
Total net cash outflows 62 63
of which: cash outflows 101 97
of which: cash inflows 39 34
Liquidity coverage ratio (%) 124 1201 Calculated after the application of haircuts and inflow and outflow rates. 2 Calculated based on an average of 61 data points in the first quarter of 2017.
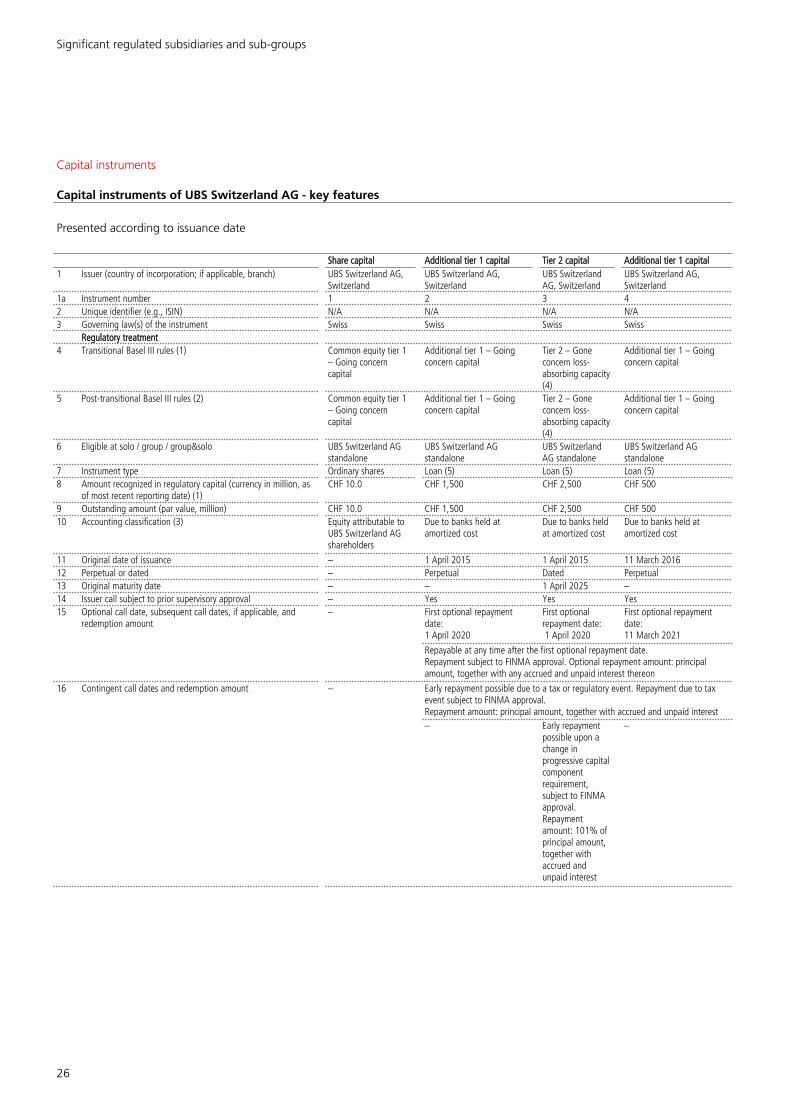
Significant regulated subsidiaries and sub-groups
26
Capital instruments
Capital instruments of UBS Switzerland AG - key features
Presented according to issuance date
Share capital Additional tier 1 capital Tier 2 capital Additional tier 1 capital1 Issuer (country of incorporation; if applicable, branch) UBS Switzerland AG,
SwitzerlandUBS Switzerland AG, Switzerland
UBS Switzerland AG, Switzerland
UBS Switzerland AG, Switzerland
1a Instrument number 1 2 3 42 Unique identifier (e.g., ISIN) N/A N/A N/A N/A3 Governing law(s) of the instrument Swiss Swiss Swiss Swiss
Regulatory treatment4 Transitional Basel III rules (1) Common equity tier 1
– Going concern capital
Additional tier 1 – Going concern capital
Tier 2 – Gone concern loss-absorbing capacity (4)
Additional tier 1 – Going concern capital
5 Post-transitional Basel III rules (2) Common equity tier 1 – Going concern capital
Additional tier 1 – Going concern capital
Tier 2 – Gone concern loss-absorbing capacity (4)
Additional tier 1 – Going concern capital
6 Eligible at solo / group / group&solo UBS Switzerland AG standalone
UBS Switzerland AG standalone
UBS Switzerland AG standalone
UBS Switzerland AG standalone
7 Instrument type Ordinary shares Loan (5) Loan (5) Loan (5)8 Amount recognized in regulatory capital (currency in million, as
of most recent reporting date) (1)CHF 10.0 CHF 1,500 CHF 2,500 CHF 500
9 Outstanding amount (par value, million) CHF 10.0 CHF 1,500 CHF 2,500 CHF 50010 Accounting classification (3) Equity attributable to
UBS Switzerland AG shareholders
Due to banks held at amortized cost
Due to banks held at amortized cost
Due to banks held at amortized cost
11 Original date of issuance – 1 April 2015 1 April 2015 11 March 201612 Perpetual or dated – Perpetual Dated Perpetual13 Original maturity date – – 1 April 2025 –14 Issuer call subject to prior supervisory approval – Yes Yes Yes
First optional repayment date: 1 April 2020
First optional repayment date: 1 April 2020
First optional repayment date: 11 March 2021
15 Optional call date, subsequent call dates, if applicable, and redemption amount
–
Repayable at any time after the first optional repayment date.Repayment subject to FINMA approval. Optional repayment amount: principal amount, together with any accrued and unpaid interest thereon
Early repayment possible due to a tax or regulatory event. Repayment due to tax event subject to FINMA approval.Repayment amount: principal amount, together with accrued and unpaid interest
16 Contingent call dates and redemption amount –
– Early repayment possible upon a change in progressive capital component requirement, subject to FINMA approval. Repayment amount: 101% of principal amount, together with accrued and unpaid interest
–
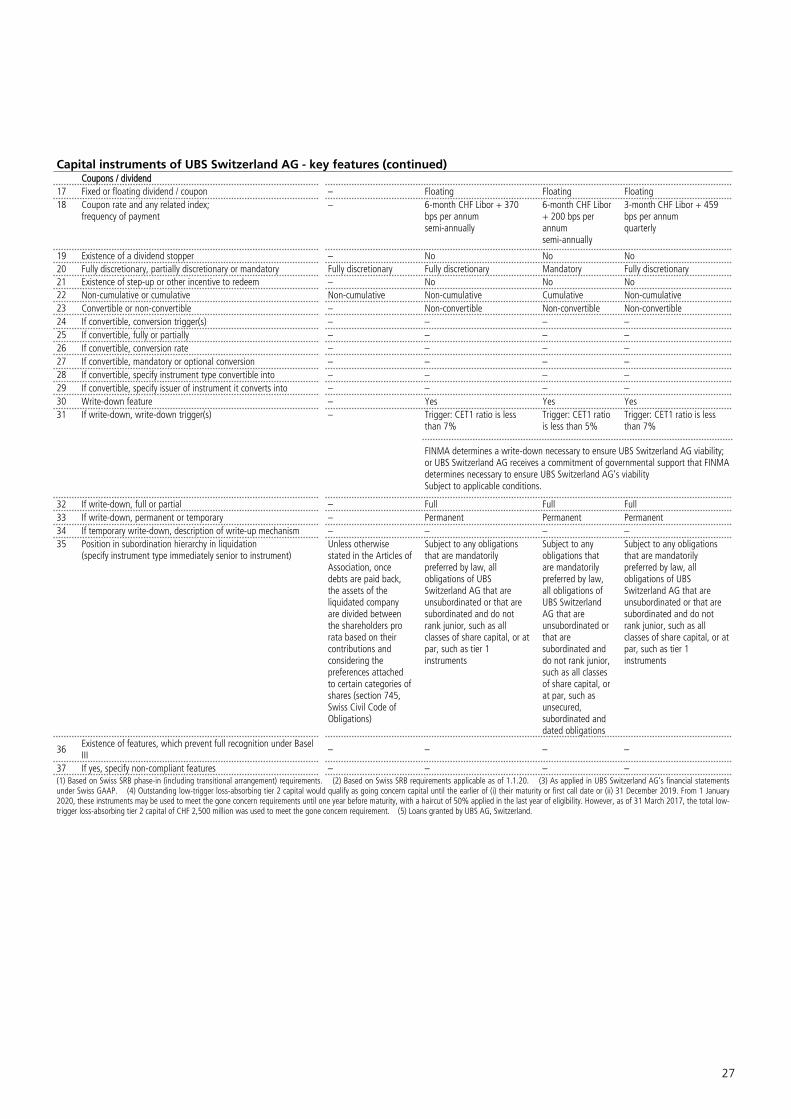
27
Capital instruments of UBS Switzerland AG - key features (continued)Coupons / dividend
17 Fixed or floating dividend / coupon – Floating Floating Floating18 Coupon rate and any related index;
frequency of payment– 6-month CHF Libor + 370
bps per annumsemi-annually
6-month CHF Libor + 200 bps per annumsemi-annually
3-month CHF Libor + 459 bps per annumquarterly
19 Existence of a dividend stopper – No No No20 Fully discretionary, partially discretionary or mandatory Fully discretionary Fully discretionary Mandatory Fully discretionary21 Existence of step-up or other incentive to redeem – No No No22 Non-cumulative or cumulative Non-cumulative Non-cumulative Cumulative Non-cumulative23 Convertible or non-convertible – Non-convertible Non-convertible Non-convertible24 If convertible, conversion trigger(s) – – – –25 If convertible, fully or partially – – – –26 If convertible, conversion rate – – – –27 If convertible, mandatory or optional conversion – – – –28 If convertible, specify instrument type convertible into – – – –29 If convertible, specify issuer of instrument it converts into – – – –30 Write-down feature – Yes Yes Yes
Trigger: CET1 ratio is less than 7%
Trigger: CET1 ratio is less than 5%
Trigger: CET1 ratio is less than 7%
31 If write-down, write-down trigger(s) –
FINMA determines a write-down necessary to ensure UBS Switzerland AG viability; or UBS Switzerland AG receives a commitment of governmental support that FINMA determines necessary to ensure UBS Switzerland AG‘s viabilitySubject to applicable conditions.
32 If write-down, full or partial – Full Full Full33 If write-down, permanent or temporary – Permanent Permanent Permanent34 If temporary write-down, description of write-up mechanism – – – –35 Position in subordination hierarchy in liquidation
(specify instrument type immediately senior to instrument)Unless otherwise stated in the Articles of Association, once debts are paid back, the assets of the liquidated company are divided between the shareholders pro rata based on their contributions and considering the preferences attached to certain categories of shares (section 745, Swiss Civil Code of Obligations)
Subject to any obligations that are mandatorily preferred by law, all obligations of UBS Switzerland AG that are unsubordinated or that are subordinated and do not rank junior, such as all classes of share capital, or at par, such as tier 1 instruments
Subject to any obligations that are mandatorily preferred by law, all obligations of UBS Switzerland AG that are unsubordinated or that are subordinated and do not rank junior, such as all classes of share capital, or at par, such as unsecured, subordinated and dated obligations
Subject to any obligations that are mandatorily preferred by law, all obligations of UBS Switzerland AG that are unsubordinated or that are subordinated and do not rank junior, such as all classes of share capital, or at par, such as tier 1 instruments
36 Existence of features, which prevent full recognition under Basel III – – – –
37 If yes, specify non-compliant features – – – –(1) Based on Swiss SRB phase-in (including transitional arrangement) requirements. (2) Based on Swiss SRB requirements applicable as of 1.1.20. (3) As applied in UBS Switzerland AG‘s financial statements under Swiss GAAP. (4) Outstanding low-trigger loss-absorbing tier 2 capital would qualify as going concern capital until the earlier of (i) their maturity or first call date or (ii) 31 December 2019. From 1 January 2020, these instruments may be used to meet the gone concern requirements until one year before maturity, with a haircut of 50% applied in the last year of eligibility. However, as of 31 March 2017, the total low-trigger loss-absorbing tier 2 capital of CHF 2,500 million was used to meet the gone concern requirement. (5) Loans granted by UBS AG, Switzerland.
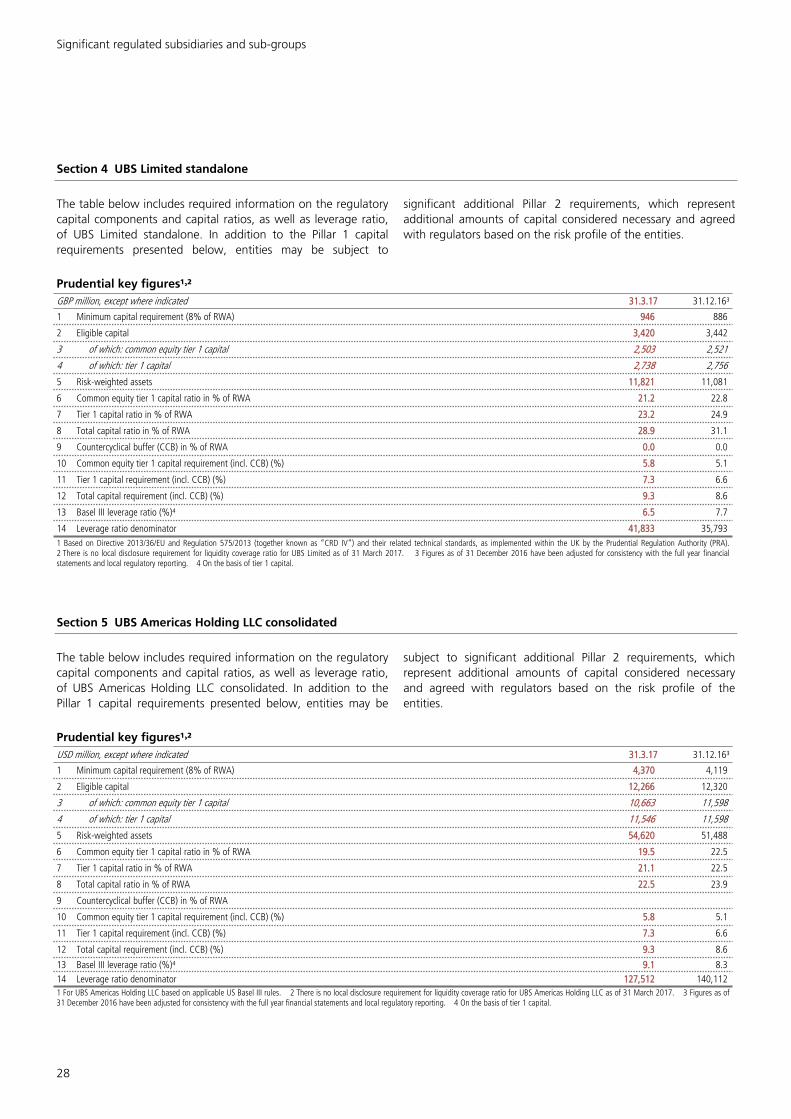
Significant regulated subsidiaries and sub-groups
28
Section 4 UBS Limited standalone
The table below includes required information on the regulatory capital components and capital ratios, as well as leverage ratio, of UBS Limited standalone. In addition to the Pillar 1 capital requirements presented below, entities may be subject to
significant additional Pillar 2 requirements, which represent additional amounts of capital considered necessary and agreed with regulators based on the risk profile of the entities.
Prudential key figures¹˒²GBP million, except where indicated 31.3.17 31.12.16³
1 Minimum capital requirement (8% of RWA) 946 886
2 Eligible capital 3,420 3,442
3 of which: common equity tier 1 capital 2,503 2,521
4 of which: tier 1 capital 2,738 2,756
5 Risk-weighted assets 11,821 11,081
6 Common equity tier 1 capital ratio in % of RWA 21.2 22.8
7 Tier 1 capital ratio in % of RWA 23.2 24.9
8 Total capital ratio in % of RWA 28.9 31.1
9 Countercyclical buffer (CCB) in % of RWA 0.0 0.0
10 Common equity tier 1 capital requirement (incl. CCB) (%) 5.8 5.1
11 Tier 1 capital requirement (incl. CCB) (%) 7.3 6.6
12 Total capital requirement (incl. CCB) (%) 9.3 8.6
13 Basel III leverage ratio (%)⁴ 6.5 7.7
14 Leverage ratio denominator 41,833 35,7931 Based on Directive 2013/36/EU and Regulation 575/2013 (together known as “CRD IV”) and their related technical standards, as implemented within the UK by the Prudential Regulation Authority (PRA). 2 There is no local disclosure requirement for liquidity coverage ratio for UBS Limited as of 31 March 2017. 3 Figures as of 31 December 2016 have been adjusted for consistency with the full year financial statements and local regulatory reporting. 4 On the basis of tier 1 capital.
Section 5 UBS Americas Holding LLC consolidated
The table below includes required information on the regulatory capital components and capital ratios, as well as leverage ratio, of UBS Americas Holding LLC consolidated. In addition to the Pillar 1 capital requirements presented below, entities may be
subject to significant additional Pillar 2 requirements, which represent additional amounts of capital considered necessary and agreed with regulators based on the risk profile of the entities.
Prudential key figures¹˒²USD million, except where indicated 31.3.17 31.12.16³
1 Minimum capital requirement (8% of RWA) 4,370 4,119
2 Eligible capital 12,266 12,320
3 of which: common equity tier 1 capital 10,663 11,598
4 of which: tier 1 capital 11,546 11,598
5 Risk-weighted assets 54,620 51,488
6 Common equity tier 1 capital ratio in % of RWA 19.5 22.5
7 Tier 1 capital ratio in % of RWA 21.1 22.5
8 Total capital ratio in % of RWA 22.5 23.9
9 Countercyclical buffer (CCB) in % of RWA
10 Common equity tier 1 capital requirement (incl. CCB) (%) 5.8 5.1
11 Tier 1 capital requirement (incl. CCB) (%) 7.3 6.6
12 Total capital requirement (incl. CCB) (%) 9.3 8.6
13 Basel III leverage ratio (%)⁴ 9.1 8.314 Leverage ratio denominator 127,512 140,1121 For UBS Americas Holding LLC based on applicable US Basel III rules. 2 There is no local disclosure requirement for liquidity coverage ratio for UBS Americas Holding LLC as of 31 March 2017. 3 Figures as of 31 December 2016 have been adjusted for consistency with the full year financial statements and local regulatory reporting. 4 On the basis of tier 1 capital.
29
Abbreviations frequently used in our financial reports
AABS asset-backed securityAGM annual general meeting of
shareholdersA-IRB advanced internal ratings-
basedAIV alternative investment
vehicleAMA advanced measurement
approachASFA advanced supervisory
formula approachAT1 additional tier 1
BBCBS Basel Committee on
Banking SupervisionBD business divisionBIS Bank for International
SettlementsBoD Board of Directors
CCC Corporate CenterCAO Capital Adequacy
OrdinanceCCAR Comprehensive Capital
Analysis and ReviewCCB Countercyclical bufferCCF credit conversion factorCCP central counterpartyCCR counterparty credit riskCDO collateralized debt
obligationCDR constant default rateCDS credit default swapCEA Commodity Exchange ActCEM current exposure methodCEO Chief Executive OfficerCET1 common equity tier 1CFO Chief Financial OfficerCHF Swiss francCLN credit-linked noteCLO collateralized loan
obligation
CMBS commercial mortgage-backed security
CM credit risk mitigationCOP close-out periodCRM credit risk mitigation (credit
risk) or comprehensive risk measure (market risk)
CVA credit valuation adjustment
DDBO defined benefit obligationDCCP Deferred Contingent
Capital Plan DOJ Department of JusticeDTA deferred tax assetDTL deferred tax liabilityDVA debit valuation adjustment
EEAD exposure at defaultEC European CommissionECAI external credit assessment
institutionsECB European Central BankEEPE effective expected positive
exposureEPE expected positive exposureEIR effective interest rateEL expected lossEMEA Europe, Middle East and
AfricaEOP Equity Ownership PlanEPS earnings per shareETD exchange-traded derivativesETF exchange-traded fundEU European UnionEUR euroEURIBOR Euro Interbank Offered Rate
FFCA UK Financial Conduct
AuthorityFCT foreign currency translationFDIC Federal Deposit Insurance
CorporationFINMA Swiss Financial Market
Supervisory Authority
FRA forward rate agreementFSA UK Financial Services
AuthorityFSB Financial Stability BoardFTD first to defaultFTP funds transfer priceFVA funding valuation
adjustmentFX foreign exchange
GGAAP generally accepted
accounting principlesGBP British poundGEB Group Executive BoardGIIPS Greece, Italy, Ireland,
Portugal and Spain Group ALM Group Asset and Liability
ManagementG-SIB global systemically
important bank
HHQLA high-quality liquid assets
IIAA internal assessment
approachIAS International Accounting
StandardsIASB International Accounting
Standards BoardIFRS International Financial
Reporting StandardsIMM internal model methodIMA internal models approachIRB internal ratings-basedIRC incremental risk chargeISDA International Swaps and
Derivatives Association
Appendix
30
Abbreviations frequently used in our financial reports (continued)
KKPI key performance indicator
LLAC loss-absorbing capitalLAS liquidity-adjusted stressLCR liquidity coverage ratioLGD loss given defaultLIBOR London Interbank Offered
RateLLC Limited liability companyLRD leverage ratio denominatorLTV loan-to-value
MMTN medium-term note
NNAV net asset valueNCPA non-counterparty-related
riskNPA non-prosecution agreementNRV negative replacement valueNSFR net stable funding ratio
OOCI other comprehensive
incomeOTC over-the-counter
PPD probability of defaultPFE potential future exposureP&L profit and lossPRA UK Prudential Regulation
AuthorityPRV positive replacement value
QQRRE qualifying revolving retail
exposures
RRBA ratings-based approachRLN reference-linked noteRMBS residential mortgage-
backed securityRniV risks-not-in-VaRRoAE return on attributed equityRoE return on equityRoTE return on tangible equityRV replacement valueRW risk weightRWA risk-weighted assets
SSA standardized approachSA-CCR standardized approach for
counterparty credit riskSE structured entitySEC US Securities and Exchange
CommissionSEEOP Senior Executive Equity
Ownership PlanSSFA simplified supervisory
formula approachSFA supervisory formula
approachSFT securities financing
transactionSME small and medium
enterprisesSNB Swiss National BankSRB systemically relevant bankSRM specific risk measureSVaR stressed value-at-risk
TTBTF too big to failTLAC total loss-absorbing capacityTRS total return swap
UUSD US dollar
VVaR value-at-risk

31
Cautionary Statement | This report and the information contained herein are provided solely for information purposes, and are not to be construed as solicitation of an offer to buy or sell any securities or other financial instruments in Switzerland, the United States or any other jurisdiction. No investment decision relating to securities of or relating to UBS Group AG, UBS AG or their affiliates should be made on the basis of this report. Refer to UBS’s first quarter 2017 report and its Annual Report 2016, available at www.ubs.com/investors, for additional information.
Rounding | Numbers presented throughout this report may not add up precisely to the totals provided in the tables and text. Percentages, percent changes and absolute variances are calculated on the basis of rounded figures displayed in the tables and text and may not precisely reflect the percentages, percent changes and absolute variances that would be calculated on the basis of figures that are not rounded.
Tables | Within tables, blank fields generally indicate that the field is not applicable or not meaningful, or that information is not available as of the relevant date or for the relevant period. Zero values generally indicate that the respective figure is zero on an actual or rounded basis. Percentage changes are presented as a mathematical calculation of the change between periods.
UBS Group AGP.O. BoxCH-8098 Zurich
www.ubs.com


