Page 1
______________________________________________________
________________________________________________________________________________________ http://www.e2analytics.com
Sub-region (District) and Sector Level SO2 and NOX Emissions for India:
Assessment of Inventories and Mitigation Flexibility
Amit Garg and P.R. Shukla Indian Institute of Management, Ahmedabad,
Sumana Bhattacharya
National Physical Laboratory, New Delhi
V.K. Dadhwal Space Applications Centre, Ahmedabad
Paper Published in Atmospheric Environment, Vol. 35/4, pp. 703-713
Page 2
________________________________________________________
http://www.e2analytics.com
1
Sub-region (District) and Sector Level SO2 and NOX Emissions for India:
Assessment of Inventories and Mitigation Flexibility By
Amit Garg*, P.R. Shukla*, Sumana Bhattacharya** and V.K. Dadhwal*** (* Indian Institute of Management, Ahmedabad, ** National Physical Laboratories, New Delhi, ***
Space Applications Centre, Ahmedabad)
Abstract
Sub-regional and sector level distribution of SO2 and NOX emissions inventories for India
have been estimated for all the 466 Indian districts using base data for years 1990 and 1995.
Although, national level emissions provide general guidelines for assessing mitigation
alternatives, but significant regional and sectoral variability exist in Indian emissions.
Districts reasonably capture this variability to a fine grid as 80% of these districts are
smaller than 1ox1o resolution with 60% being smaller than even 1/2ox1/2o. Moreover,
districts in India have well established administrative and institutional mechanisms that
would be useful for implementing and monitoring mitigation measures. District level
emission estimates thus offer a (A.1.1) finer regional scale inventory covering the combined
interests of the scientific community and policy makers. The inventory assessment
methodology adopted is similar to that prescribed by the Intergovernmental Panel on
Climate Change (IPCC) for greenhouse gas (GHG) emissions. The sectoral decomposition
at district level includes emissions from fossil fuel combustion, non-energy emissions from
industrial activities and agriculture. Total SO2 and NOX emissions from India were 3542
and 2636 Gg respectively [1990] and 4638 and 3462 Gg [1995] growing at annual rate of
around 5.5%. The sectoral composition of SO2 emissions indicates a predominance of
electric power generation sector [46%]. Power and transport sector emissions equally
dominate NOX emissions contributing nearly 30% each. However, majority of power plants
are situated in predominantly rural districts while the latter are concentrated in large urban
centers. Mitigation efforts for transport sector NOX emissions would therefore be higher.
The district level analysis indicates diverse spatial distribution with the top 5% emitting
districts contributing 46.5% and 33.3% of total national SO2 and NOX emissions
respectively. This skewed emission pattern, with a few districts, sectors and point sources
Page 3
________________________________________________________
http://www.e2analytics.com
2
emitting significant SO2 and NOx, offers mitigation flexibility to policy makers for cost-
effective mitigation.
Keywords: Emissions Inventory, SO2 Emissions, NOx Emissions, Emissions Mitigation
1. Introduction
India has large variability in regional population distribution [Census of India, 1992]
and energy consumption patterns [CMIE, 1999; TEDDY, 1999]. Rapid economic growth
and industrialization are enhancing this variability further creating pockets of heavy
pollutant emitting regions like metro-cities which have seen rapid rise in the fleet of
vehicles in the last decade [CMIE, 1998a]. Similarly many thermal power plants have
become operational in this decade, which are consuming coal for electricity generation.
Therefore, a need arises for the policy makers to specially identify these regions of high
pollution and target the sectors for mitigation, which are causing it. In association with the
rising coal use, emissions of SO2 and NOx have increased to levels, which pose serious
threat to public health and sensitive ecosystems [Chameides et. al., 1994].
The emissions inventories are traditionally reported in gridded formats. Bhatti and
Streets [1991] report SO2 emission inventories for most of Asian nations. Kato and Akimoto
[1992] have estimated SO2 and NOx inventories for 25 Asian countries for some selected
years. Akimoto and Narita [1994] estimate the emissions for a 1ox1o [110 km x 110 km]
grid. Aardene et al. [1999] have reported NOx emissions for 1990 to 2020 for entire Asia in
1ox1o resolution using the RAINS Asia model [Foelle et. al., 1995]. Arndt et al. [1997] also
report SO2 inventory for the same region and period using the same model. Gaps in grid
level energy consumption information, and therefore emissions estimates, are mostly filled
in by allocating emissions to grids in proportion to the population assigned to these grids.
In this paper, we are first presenting the all India emission scenario of SO2 and NOX,
their emission trends and the sectoral shares followed by emission estimates for each of the
Page 4
________________________________________________________
http://www.e2analytics.com
3
466 Indian districts [Census of India, 1992] for 1990 and 1995. The aim of this exercise is
to identify the largest contributing regions and sectors that can be targeted for mitigation.
Although, national level inventory estimates provide general guidelines for assessing
mitigation alternatives, significant regional and sectoral variability exist. Estimates of
emission magnitudes on a sub-regional site-specific scale allow more focused and efficient
mitigation strategies by exploiting this variability. Districts can reasonably capture this
variability to a fine grid since 80% of these districts are smaller than 1ox1o resolution with
60% being smaller than even 1/2ox1/2o. The largest district is about 20x20 size but the larger
districts have much lower population densities and lower emissions as well. Data for fossil
fuel consumption, industrial activities and agriculture are available at district levels. Since
the districts have well-established administrative and institutional mechanisms, this analysis
would be useful for implementing and monitoring local pollutant mitigation measures.
Hence, district level emission estimates offer a (A.1.1) finer regional scale inventory
covering the combined interests of the scientific community and policy makers. The largest
25-emitter districts in each source category have been termed as hotspot districts for that
category for a more focussed analysis of large emitter districts. Such a study offers
mitigation flexibility to policy makers by identifying the specific regions, sectors and
sources, which require mitigation.
2. Data
We have used diverse data sources covering various sectors and fuels. These energy
and non-energy sources have been captured at district level giving a profound richness and
robustness to the base data for national inventory estimates. For example, plant level coal
consumption data has been captured for all the power, steel, cement and fertiliser plants in
India. Similarly, plant level production data of sulfuric acid, smelting of lead, zinc and
Page 5
________________________________________________________
http://www.e2analytics.com
4
copper ores have been captured. District level consumption of different petroleum oil
products has also been captured. The district level data on livestock population by category
has been used to estimate production of dry dung cakes, used as energy sources. Similarly
production of various crops in each districts has been used to estimate agricultural crop
residue burnt. The depth and richness of these base data also implies that more accurate
future inventory projections can be made. Most of the data sources are published documents
of the government of India. The data used are that of coal [MoC, 93; MoC, 1998], oil
production and natural gas consumption [MoPNG, 1992; CMIE, 1995a; CMIE, 1996; IPD,
1996; MoPNG, 1996; OCC, 1998; SAKET, 1998; TEDDY, 1998], electric power
generation [CEA, 1987; CMIE, 1996; IBC 1996; CEA, 1997; TEDDY, 1997; CMIE,
1998b], biomass [CMIE, 1995b; FAI, 1996a; Ravindranath et al, 1995; FAI, 1997; TERI,
1997], brick [Census of India, 1992; Shukla, 1994; CMIE, 1996], cement [ICRA, 1995;
CIER, 1998], steel [SAIL, 1994; CII, 1996; SAIL, 1996], fertilizer [CMIE, 1995b; CMIE,
1996; FAI, 1991; FAI, 1995; FAI, 1996b, CMIE, 1998c], sulfuric acid production [GoI,
1986; GoI, 1989; CIER, 1994; CIER, 1998; CMIE, 1998c; CMIE, 1998d] and smelting of
zinc, lead and copper [CIER, 1998]. We have tried to cross verify all these data sources as
much as possible.
3. Methodology and Emission Coefficients
The basic methodology to estimate the total emissions of a particular gas from the
country uses the following formula, which is in line with the IPCC methodology [1997]:
Total emissions = ∑ ∑ ∑ [Activity level * Emission coefficient]
Districts Source Sectors Categories
Source categories are in Million metric tons [MT] per year except for natural gas
consumption [Billion cubic meters]. This methodology follows the same approach as used
Page 6
________________________________________________________
http://www.e2analytics.com
5
by Li et al. [1999], except that one more level of disaggregation [namely district] has been
incorporated in our methodology. The sectors that have been considered are energy,
transport, industry, agriculture and residential. The energy sector captures emissions from
consumption of fossil fuels [source categories] such as coal, petroleum oil products and
natural gas for electric power generation, steel, cement, brick, paper, sugar, chemicals etc.
Transport sector mainly consumes oil products with use of coal being limited to railways
and that too almost negligible due to phasing out of steam traction from Indian Railways.
The industrial sector includes emissions from non-energy activities namely cement
production, zinc, lead, copper smelting, nitric and sulfuric acid production. Agriculture and
residential sectors include emissions arising out of animal manure and consumption of
biomass [agricultural crop residue, dung-cakes and fuelwood]. The district level sectoral
petroleum oil product consumption is assumed to follow the national consumption pattern.
The sectoral SO2 emission coefficients have been Indianised depending upon the
sulfur content of different fuels. The Indian coal has low sulfur content and it has been
taken to be 0.51% sulfur by weight [IPCC, 1997; URBAIR, 1997]. The Indian petroleum oil
products have higher sulfur, as the level of sulfur removal by Indian refineries is not high
presently. The sulfur content is eight times more than the European standards and 250 times
more than the Swiss norms [Down to Earth, 1998; Down to Earth, 1999a; Down to Earth,
1999b; Down to Earth, 1999c]. However, there is sufficient evidence of recent policy
decisions in India that are aimed at controlling local pollution levels and would reduce SO2
emission coefficients from fuel combustion activities in near future. These include
mandatory washing of coal that is used 500 Kms away from the mine mouth. This measure
is aimed at reducing fly ash and also simultaneously reduces sulfur. Since, over a third of
coal is used beyond 500 Kms, this measure is expected to start reducing SO2 from coal use
Page 7
________________________________________________________
http://www.e2analytics.com
6
in near future. The second decision is about reducing the sulfur contents of diesel oil
coming out of the Indian refineries. Official claim in India is that government has spent
$1.34 billion to reduce the sulfur content in diesel from 1 percent to 0.25 percent by weight
[Down to Earth, 1999a]. Besides these, there has been recent Supreme Court judgement
which has ordered Euro II standards to be followed for cars in India. While this is not very
significant for SO2 control, it shows the mind-set of the judiciary and policymakers to
control local pollution. The SO2 emission coefficients from biomass are based on studies
made by Ravindranath et. al. [1995]. These coefficients may, however, have scope for
further refinements since the type of biomass consumed in India has wide regional and
seasonal variations, which are not captured in these coefficients. NOx emission coefficients
are as per the IPCC guidelines [1997]. For NOx emissions from nitric acid production, we
have used the IPCC default value of 12 Kg NOx per ton of acid production. Table 1 and 2
give the SO2 and NOx emission coefficients used in this paper.
The district level emissions have been linked to the district topology available with
the Space Application Centre, Ahmedabad, India. These data were then converted into per
unit area for each of the 466 districts and plotted [except for the state of Jammu and
Kashmir where state level averages have been plotted].
4.0 Inventory Assessment
4.1 SO2 emissions
All India SO2 emissions are estimated at 3.54 Tg in 1990 and 4.64 Tg in 1995. In
1990, coal consumption contributed 64% of total SO2 emissions in India, oil products 29%,
biomass 4.5% and non-energy consumption 2.5%. Emissions from natural gas are
negligible. It is interesting to note that composition of emissions from different fuels
remained almost the same in 1990 and 1995 with a marginal increase in the share of
Page 8
________________________________________________________
http://www.e2analytics.com
7
emissions from coal and a corresponding reduction in emission from biomass, which have
almost stagnated. Two thirds of the increase in all India SO2 emissions during 1990-95 has
been due to consumption of coal and the rest from oil products. The increase in coal based
SO2 has been entirely due to increased electric power generation. Oil product SO2 increase
is almost entirely due to a 50% increase in high-speed diesel and fuel oil consumption
indicating expansion of transport and industry sectors.
Sector specific emissions indicate dominance of electric power generation sector
contributing 46% of all India SO2 emissions in 1995 [figure 1]. Industry is the second
largest SO2 emitter at 36% followed by transport [7.8%], biomass consumption [6%] and
other sectors [3.8%]. Almost a quarter of industrial emissions come from steel sector and
10% from cement manufacturing. The non-energy share is 7% including emissions due to
H2SO4 manufacturing and smelting of zinc, lead and copper ores. Other industries including
(B6) petroleum refining, fertilizer, brick, sugar, chemicals, textiles, non-ferrous metal
manufacturing etc. contributed 56% of industrial emissions [figure 2].
(A.1.2; B1) The regional spread of SO2 emissions from various sectors varies. The
present paper includes emission estimates from 94 power plants (81 coal, 12 gas and one
oil based), 11 steel plants, 92 cement plants, 31 fertilizer plants, 12 petroleum refineries and
26 other sources including petrochemicals and smelting units. These cover almost all the
major point sources in India. Mapping them using satellite data will be the next phase of
research activity, which will also include the stack heights to understand the local spread.
Our estimates indicate that the largest 57-point source emissions contribute 50% of all India
SO2 emissions and 10% NOx emissions. About two-thirds of these are power plants.
India’s power sector is mainly growing on coal with its total coal and lignite
consumption increasing by above 60% between 1990-95. However since the Indian coal has
Page 9
________________________________________________________
http://www.e2analytics.com
8
lower sulfur content, the impact of increased coal usage is not so pronounced in absolute
terms. There has been only a marginal improvement in overall performance of Indian power
sector, which continues to be dominated by sub critical pulverized coal technology with
about 7.0 tons SO2 emissions per GWh during 1990-95. Cement industry is much more
scattered but concentration is more in districts of Madhya Pradesh, Karnataka and Tamil
Nadu provinces. For SO2 emissions from non-energy sectors, sulfuric acid manufacturing is
wide spread over almost 15 provinces in India and Madhya Pradesh is the biggest emitter.
Copper ore smelting is spread over only eight districts, Lead over five districts and Zinc ore
smelting is done mainly in two districts in India. Rajasthan province is the largest SO2
emitter for all these categories, contributing about 35% of the all India SO2 emissions from
non-energy sector, followed by Madhya Pradesh [20%].
The regional spread of overall SO2 emissions per unit area varies widely across the
Indian districts and has a close correspondence with coal consumption pattern [figure 3a
and 3b]. The emissions from a province also indicate a good correlation with its population
and level of economic activity. Higher population implies higher level of economic
activities and correspondingly higher energy consumption as the energy elasticity of the
Indian GDP has been above unity for the last twenty years [ESI, 1999; CMIE, 1999]. Uttar
Pradesh happens to be the most populous province of the country and heads the list of SO2
emissions as well. Net State Domestic Product [NSDP] captures the level of economic
activity of a province and the eight provinces with highest NSDP [CMIE, 1994; CMIE,
1997] are also the top SO2 emitters in the country.
Range analysis of SO2 emissions from Indian districts indicates that the top five-
hotspot districts contributed almost 16% of all India SO2 emissions in 1995 and these have
grown at 11.7% annually between 1990-95 [table 3]. All of these have more than 90%
Page 10
________________________________________________________
http://www.e2analytics.com
9
emissions due to coal combustion. Similarly 35 of the top 47-hotspot districts also have
predominant coal based SO2 emissions [above 60%]. The emission shares of large emitter
districts have increased between 1990-95. There is a reduction in number of districts in
lower emission ranges while there is an increase in those in higher ranges. 350 districts had
individual emissions less than 6 Gg in 1990. Their number decreased to 336 in 1995.
Districts emitting more than 20 Gg SO2 increased from 46 to 57 in the interim period. Our
analysis indicates an upward shift in SO2 emission from Indian districts and is more
pronounced in higher ranges. The percentage contribution by least 400 emitters has gone
down over 1990-95. This is not due to a reduction in their absolute emissions, which have in
fact marginally grown, but it is due to the high growth rates of the largest 10% emitter
districts.
The total SO2 emissions from seven of the top ten hotspots have grown faster than
the national Compounded Annual Growth Rate (CAGR) of 5.5% per annum. These districts
are not the largest urban centers of India and do not even include any state capital district.
All of these districts are near coal mine mouths and have more than 90% of their SO2
emissions due to coal consumption for power generation. Bilaspur district [MP], the largest
SO2 emitter district in India, had almost 95% of its emissions due to this source. This
picture changes considerably if we analyze hotspot districts for SO2 emissions per unit area
[table 5]. The four Indian metropolis districts appear in this list along with three other state
capital districts. Their average annual ambient SO2 concentration levels, as measured by the
Central Pollution Control Board of India [CPCB], are also indicated. CPCB regularly
monitors these values for (B2) 92 Indian cities using 290 observation points. World Health
Organization has specified that annual average SO2 concentrations should not be more than
100-150 micro gm/mt3, while the CPCB norms for India are stricter and are pegged at 60
Page 11
________________________________________________________
http://www.e2analytics.com
10
micro gm/mt3 for residential areas and 80 micro gm/mt3 for industrial areas. It is to be noted
that only two cities [Howrah and Surat] crossed the safe residential emission concentration
level CPCB norms in 1995 while only Surat crossed even the industrial area limits. Many
other cities do however cross these limits many times in a year if their eight hourly CPCB
emission data is analyzed for the whole year.
The national average per capita SO2 emission was 4.2 kg/person in 1990, which rose
to 5 kg in 1995, an increase of almost 20% in 5 years. The top 25 hotspots for per capita
SO2 emission do not include the four Indian metropolis districts. The per unit area [table 5]
and per capita hotspot lists do not have much overlap and only eleven out of largest 25
hotspot districts are common to both the categories. However, total SO2 and per capita SO2
hotspot lists have a good overlap since the districts in former list have relatively lower
population densities as compared to those appearing in per area list.
Table 6 lists the largest five-hotspot districts for some important sectors based on
total SO2 emissions. Sonbhadra and Bilaspur are the two largest SO2 emitting districts in
India and this is mainly due to their SO2 emissions from electric power generation. In fact
for 1995, the five largest SO2 emitters for all India happen to be the same as those in the
electric power sector. For 1990, Greater Mumbai comes at all India fourth place since
corresponding electric power generating districts had lower emission levels comparatively.
Delhi was also in the top five emitter's list for 1990 due to its high transport sector SO2
emissions.
4.2 NOx emissions
India emitted 3.46 Tg NOX in 1995 as per our estimates and these grew at about
5.6% per annum between 1990-95. Coal and oil product combustion have almost equal
Page 12
________________________________________________________
http://www.e2analytics.com
11
shares in total NOx emissions growing around 7.2% per annum. The shares were 36% in
1990 and marginally increased in 1995 [41% for coal and 38% for oil products].
The sectoral composition indicates that transport sector is the predominant source of
NOX emissions in India contributing 32%, out of which road transport contributed around
28% [figure 4]. Electric power generation [28%], industry [19%], biomass consumption
[19%] and other industries [2%] follow. All India NOX emissions have risen by one-third
between 1990-95 at a CAGR of 5.6%, however sectoral emissions have wide variations.
These increased by 63%, 46%, 19% and 10% for electric power generation, transport,
industry and other sectors respectively.
The regional distribution indicates a close relationship with coal and oil products
consumption [figure 5]. Districts with big thermal power plants and large vehicular
population emit more NOx. Dark spots indicate high emission areas with more than 75
thousand-ton emissions per year. These are Bilaspur district of Madhya Pradesh [MP], the
national capital Delhi and Sonbhadra district of Uttar Pradesh [UP]. UP, Maharashtra, MP,
AP and TN were the largest five NOX emitting provinces in 1995. These five states together
accounted for more than half of India’s NOX emissions both in 1990 and 1995. In addition
to human population and the level of economic activity, NOX emissions also have a close
correlation with vehicular population. The top five-emitter provinces account more than half
of all India registered vehicular population [CMIE, 1996]. It should however be noted that
all of the registered vehicles might not be in active use. The composition of total vehicle
population and their shares in passenger-km and ton-km of traffic moved are also important
since heavy duty and/or diesel driven vehicles emit much more NOX per unit passenger-km
(or ton-km) as compared to light duty and/or petrol driven vehicles.
The range analysis indicate that the top 1% emitter districts covered 11% of all India
Page 13
________________________________________________________
http://www.e2analytics.com
12
NOX emissions and the next 1% districts another 9% emissions. The top 5% districts
covered 33% of total emissions while the least 233-emitter districts together emitted 13% of
India’s total NOX [table 7]. This pattern, even though skewed, is more evenly distributed
than SO2 [table 3] since transport sector plays a dominant role in NOX emissions. Transport
activities are more evenly distributed across the country and are more concentrated in and
around the large urban centres. The top ten-hotspot districts for NOX emissions [table 8]
include Delhi and Mumbai, which were not there in the SO2 list. State capital districts
encompass big urban centres, most of which have large vehicular population while some
have big electric power plants as well [Delhi, Gandhinagar and Mumbai]. These two
sources together result in high NOX emissions from state capital districts. In fact nine of
these capital districts figure in top 25-NOX hotspots in India in 1995.
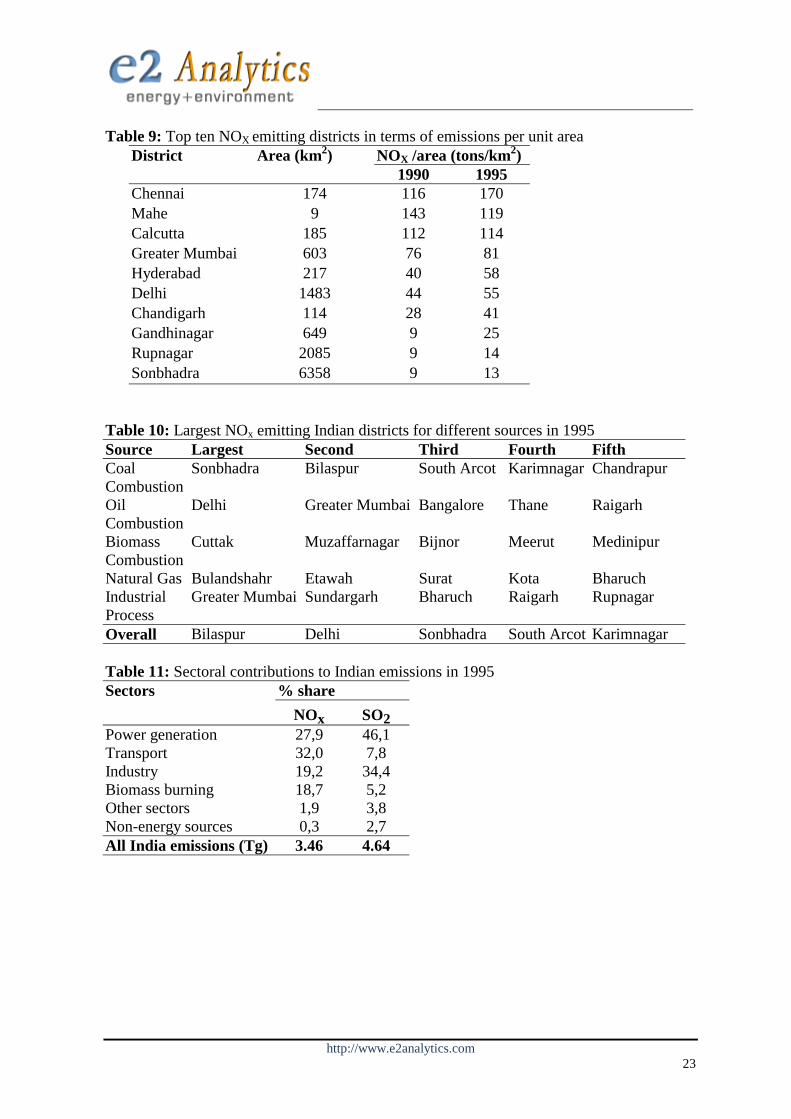
The NOX emission hotspot districts are different for total emissions, per unit area
emissions [table 9] and per capita emissions for 1995. While Bilaspur and Delhi occupy top
positions for total NOX emissions, Chennai heads the list for per unit area NOX emissions
and Sonbhadra has the highest per capita emissions. The source category based top five
hotspot districts in India are indicated in table 10. Coal and oil consumption drive all India
NOX emission almost equally. The five largest hotspots from coal use correspond to electric
power generation sector and those for oil use correspond to transport and industrial sector.
Biomass consumption is partially accounted for in agriculture sector and partly in
residential sector. Natural gas hotspots correspond to gas based electric power plants while
industrial process is nothing but production of nitric acid.
Page 14
________________________________________________________
http://www.e2analytics.com
13
5.0 Mitigation flexibility
Although local pollution standards across regions and sectors are often useful as
overall policy targets, the marginal mitigation cost for achieving each target varies. The
present work on regional and sector specific inventories of gases contributes to
effectiveness of emissions mitigation by indicating the hotspot locations and sectors where
controls can lead to maximum benefits. Table 11 gives the shares of various sectors for SO2
and NOX emissions in India in 1995. SO2 hotspots are driven by power sector emissions
while NOX hotspots are equally driven by transport and power sector emissions. (B4)
Transport, being ground level source, has more adverse impact on the ambient environment
as compared to power plants and should be kept in mind while formulating mitigation
policies. Power sector emissions are mainly concentrated from about 40 large power plants,
five steel plants and 15 large cement plants in India; thus mitigation efforts would be quite
focussed. Transport sector sources are extremely dispersed, large in numbers and
concentrated at urban centres thus necessitating different mitigation approach. The extent of
NOX emissions also depends upon traffic patterns, driving habits and condition of vehicles.
Improving fuel quality, mainly diesel and gasoline, will have considerable reductions in
transport sector emissions.
While the impacts of climate change from greenhouse gas emissions are large and
felt over a long duration, local pollution impacts on health and ecology are felt much earlier.
Mitigating local pollutant emissions therefore is a more urgent task. Often, mitigation of
local pollution causes reduction in associated GHG emissions and vice versa, even though
the level of reductions in each direction may vary substantially. Reductions in GHG
emissions by efficiency improvements in fuel combustion processes, switching over to
cleaner fuels and employing cleaner production technologies will reduce local pollutants
Page 15
________________________________________________________
http://www.e2analytics.com
14
almost in the same proportion as GHG. However, measures aimed at reducing local
pollutants alone, for example employing technologies like flue gas desulfurisation [FGD]
which reduces 90 to 95% SO2 emissions, do not result in equivalent GHG reductions.
Pursuing cleaner local environment policies alone, therefore, may not provide any
substantive reduction in GHG emissions.
There is another dimension to this discussion, which is the relative cost of GHG and
local pollutant mitigation efforts. While SO2 emissions from the power sector may be
mitigated at around US$ 300 per ton of SO2 by employing technologies like FGD, those for
NOX would be around US$ 250 per ton using low-NOX burners etc [WB, 1997; Shukla et
al., 1999]. On the other hand if we reduce SO2 and NOX as ancillary benefits of GHG
mitigation measures like fuel switching from coal to gas and adopting cleaner production
technologies, the per unit costs would be much higher. Cost effectiveness requires equal
marginal mitigation cost across various mitigation options. Therefore in a developing
country perspective, where resources are competing for allocation, controlling local
pollution directly may serve India’s purpose better than taking the GHG route for tackling
local pollution problem.
The third reason to focus on mitigating local pollution problem alone in India is the
historical dependence of India's energy sector on coal, which is not likely to change in near
future [Shukla et al., 1997]. The local pollutant hotspot districts have a major dominance of
coal consumption. Most of these districts are in hinterland and hence there would be
reasonable possibilities of acid rains in the surrounding areas if the generating capacities of
these power plants were increased much. A similar situation would arise if future mega-coal
based thermal power plants were situated near the mine mouths alone, which even presently
have many big plants. However, both these problems can be addressed in a cost-effective
Page 16
________________________________________________________
http://www.e2analytics.com
15
manner if suitable measures are adopted to control local pollutant emissions alone as
discussed above. Since, India has no GHG reductions commitment at present, GHG
emissions reductions may only remain an ancillary benefit of mitigating local pollutant
emissions and may have to be done for its own sake in India.
6.0 Summary
Our study indicates that per area SO2 emissions have increased from 1.08 tons/km2
in 1990 to 1.41 tons/km2 in 1995. The hotspot SO2 emitting districts in both the years are
the ones where power plants for electric generation are located. Similarly, per area NOX
emissions have increased from 0.8 tons/km2 to 1.05 tons/km2. Power and transport sectors
contribute about 30% each to NOX emissions. However, transport being ground level
source, has more adverse impact on the ambient environment as compared to power plants
and should be kept in mind while formulating mitigation policies. The rapidly rising SO2
and NOX emission trajectories in hotspot districts (CAGR above 7.5%) require early
mitigation measures, even though majority of the Indian districts are relatively clean
(CAGR below 4%). The present paper captures the diversity and variability of Indian
emissions, therefore providing inputs to strengthen scientific and policy-making processes.
Page 17
________________________________________________________
http://www.e2analytics.com
16
References
Aardene A J. A. van , Carmichael, G. R., Hiram, L., Streets, D. and Hordijk, L, 1999b. Anthropogenic NOX emission in Asia in the period 1990-2020. Atmospheric Environment 33, 633-646. Akimoto and Narita 1994. Distribution of SO2, NOX, and CO2 emissions from fuel combustion and industrial activities in Asia with 1ox1o resolution. Atmospheric Environment 28, 213-225. ALGAS, 1998 – India National Report on Asia Least Cost Greenhouse Gas Abatement Strategy, ADB. Arndt, R. L., Charmichael, G. R., Streets, D. G. and Bhatti N., 1997. Sulphur dioxide Emissions and Sectoral Contributions to Sulfur Deposition in Asia. Atmospheric Environment, 31, 1553-1572. Bhatti N. and Streets, D. G., 1991. Preliminary grid by grid emission inventory for Asia. Third annual workshop on acid rain in Asia, 18-22, November, Asian Institute of Technology, Bangkok. CEA, 1987. National Power Plan: A Long-term Development Profile 1985-2000. Central Electricity Authority, Ministry of Energy, New Delhi. CEA, 1997. Fourth National Power Plan 1997-2012: Central Electricity Authority, Ministry of Energy, New Delhi. Census of India, 1992. Final Population Totals: Vol I, Series-1, Paper 1 of 1992. Ministry of Home Affairs, Government of India, New Delhi. Chameides, W., Kasabhatla, P., Yienger, J., Levy, H., 1994. Regional ozone pollution and food production. Science 264, 74-77. CIER, 1994. CIER’s Industrial Data Book 1994. Center for Industrial & Economic Research, Sage Publications, New Delhi. CIER, 1998. CIER’s Industrial Data Book 1998……………………………………………. CII, 1996. Handbook of statistics 1996. Confederation of Indian Industry, New Delhi. CMIE, 1995a. India’s Energy Sector. Center for Monitoring Indian Economy, Mumbai. CMIE, 1995b. India’s Agricultural Sector. Sept 1995. Center for Monitoring Indian Economy, Mumbai. CMIE, 1996. India’s Energy Sector. Center for Monitoring Indian Economy, Mumbai.
Page 18
________________________________________________________
http://www.e2analytics.com
17
CMIE, 1997. Profiles of States. March, 1997. Center for Monitoring Indian Economy, Mumbai CMIE, 1998a. Infrastructure. Center for Monitoring Indian Economy, Mumbai. CMIE, 1998b. India’s Energy Sector. Center for Monitoring Indian Economy, Mumbai. CMIE, 1998c. Agriculture. Center for Monitoring Indian Economy, Mumbai. CMIE, 1998d. Prowess databank. Center for Monitoring Indian Economy, Mumbai. CMIE, 1999. India’s Energy Sector. Center for Monitoring Indian Economy, Mumbai. CPCB, 1991. Status report on Ambient air quality. Central Pollution Control Board, Government of India, New Delhi. CPCB, 1996. Status report on Ambient air quality………………………………………….. CPCB, 1997. Status of Water Supply and Wastewater Generation, Collection, Treatment and Disposal in Metro cities 1994-95. Central Pollution Control Board, Government of India, New Delhi. Down to Earth ,1999b. Cheap Fuel, High Cost. Feb 15, New Delhi, pp15. Down to Earth ,1999c. Editorial. March 31, New Delhi, pp7. Down to Earth, 1998. Dying due to diesel. Dec 31, New Delhi, pp 15-16. Down to Earth, 1999a. When wealth is not health. Jan 31, New Delhi, pp 32-40. ESI, 1999. Economic Survey of India 1998-99. Ministry of Finance, Government of India, New Delhi. FAI, 1991. Fertilizer Statistics 1990-91. The Fertilizer Association of India, New Delhi. FAI, 1995. Fertilizer Statistics 1994-95 --------------------------------------------------------- FAI, 1996b. Fertilizer and Allied Agricultural Statistics 1995-1996 (Northern Region). The Fertilizer Association of India, New Delhi. FAI, 1996a. Fertilizer Statistics 1995-96. The Fertilizer Association of India, New Delhi. FAI, 1997. Fertiliser and Allied Agricultural Statistics 1996-97 (Northern Region). The Fertilizer Association of India, New Delhi. FAI, 1998. Fertilizer Statistics 1997-98. The Fertilizer Association of India, New Delhi.
Page 19
________________________________________________________
http://www.e2analytics.com
18
Foelle et al., 1995. Rains Asia: An assessment model for Air pollution in Asia. Report on the World Bank sponsored project " Acid Rain and Emission Reduction in Asia", December 1995. GoI, 1986. Handbook of Indigenous Manufacturers (Chemical & Miscellaneous Stores). Ministry of Industry, Government of India, New Delhi. GoI, 1989. Perspective Plan for Chemical Industry (Upto Year 2000 AD). Ministry of Industry, Department of Chemicals & Petrochemicals, Government of India. New Delhi. ICRA, 1995. The Indian Cement Industry Update: 1995. ICRA Industry Watch Series # 1, ICRA Investment Information Publications , New Delhi. IPCC, 1997. Revised IPCC guidelines for national greenhouse gas inventories: Reference Manual, vol. 3. Inter Governmental Panel on Climate Change, Bracknell, USA. IPD, 1996. Indian Petroleum Directory. Indian Petroleum Publishers, Dehradun, India. Kato N. and Akimoto H., 1992. Anthropogenic emissions of SO2 and NOX in Asia: Emission inventories (plus errata), Atmospheric Environment 26 A (16), 2997-3017. Li Y. F., Zhang Y. J., Cao G. L., Liu J. H. and Barrie L. A., 1999. Distribution of seasonal SO2 emission from fuel combustion and industrial activities in Shanxi province, China, with 1/6ox1/4o longitude/latitude resolution. Atmospheric Environment 33, pp 257-265. MoC, 1993. Coal Directory of India: 1991-92. Ministry of Coal, Government of India, Calcutta. MoC, 1998. Coal Directory of India: 1996-97 ------------------------------------------------------- MoPNG, 1992. Indian Petroleum and Natural Gas Statistics: 1990-91. Ministry of Petroleum and Natural Gas, Government of India, New Delhi. MoPNG, 1996. Indian Petroleum and Natural Gas Statistics: 1994-95 -------------------------- OCC, 1998. Oil Coordination Committee Data (restricted access), Ministry of Petroleum and Natural Gas, Government of India, New Delhi, 1998. Ravindranath N. H. and Hall D. O., 1995. Biomass, Energy & Environment: A Developing Country Perspective from India. Oxford University Press, New York. SAIL, 1994. Statistics for Iron & Steel Industry in India. Steel Authority of India, New Delhi. SAIL, 1996. Statistics for Iron & Steel Industry in India ------------------------------------------ SAKET, 1998. SAKET Petrochemical Handbook, Saket Projects Ltd, Ahmedabad.
Page 20
________________________________________________________
http://www.e2analytics.com
19
Shukla P. R., 1994. Brick Making in India 1993: A Draft Report. Indian Institute of Management, Ahmedabad. Shukla P.R., Loulou R., and Kanudia A., 1997. Energy and Environment Strategies for a Sustainable Future: Analysis with the Indian MARKAL model. Allied Publishers, New Delhi. Shukla, P. R., Ghosh, Debyani, Chandler, W. and Logan, J., 1999. Developing Countries and Global Climate Change: Electric Power Option in India. PEW Center on Global Climate Change, Arlington, US. TEDDY, 1997. Teri Energy Directory and Data Yearbook 1996-97. Tata Energy Research Institute, New Delhi. TEDDY, 1998. Teri Energy Directory and Data Yearbook 1997-98 ----------------------------- TEDDY, 1999. Teri Energy Directory and Data Yearbook 1998-99 ----------------------------- TERI, 1997. Rural and Renewable Energy: Perspectives from Developing Countries. Tata Energy Research Institute, New Delhi. URBAIR, 1997. Urban Air Quality Management Strategy in Asia: Greater Mumbai Report. Edited by Jitendra J. Shah and Tanvi Nagpal, Wolrld Bank Technical Paper No. 381, Washington D. C. WB, 1997. A Planner’s Guide for Selecting Clean Coal Technologies for Power Plants, World Bank Technical Paper No. 387. The World Bank, Washington D. C. Acknowledgements
The authors are grateful to Dr Jae Edmonds, Dr Murari Lal, Dr A. P. Mitra, Dr Morita T.
Suneyuki and Dr Jayant Sathaye for their suggestions and valuable comments.
Page 21
________________________________________________________
http://www.e2analytics.com
20
Tables Table 1: Sulfur Dioxide emission coefficients Source categories Emission Coefficient Energy combustion Ton/Ton Ton/PJ Coal 0.0102 549.1 High Speed Diesel 0.02 465.2 Motor Spirit 0.01 108.7 Kerosene 0.005 116.2 Light Diesel Oil 0.04 837.4 Fuel Oil 0.08 1993.6 Naphtha 0.01 111.1 Aviation Turbine Fuel 0.001 23.2 Low Sulfur Heavy Stock 0.04 995.2 Natural gas Negligible 0 Fuel wood 0.0008 53.3 Dung cakes 0.0006 42.9 Agriculture crop residue 0.0006 46.2 Non-energy sources Sulfuric acid production 0.012 - Copper smelting * 0.33 - Lead Smelting * 0.2 - Zinc smelting * 0.2 - Cement production 0.0003 - * Sources: IPCC, 1997; Xiulian et al., 1997. Table 2: NOx Emission coefficients for various fuels in India (Kg/TJ)
Sectors \ Source categories
Coal Natural Gas
Oil Wood/ Wood Waste
Charcoal Other Biomass (b)
Energy Sector (a) 300 150 200 100 100 100 Manufacturing and Construction (a) 300 150 200 100 100 100
Aviation 300 Road 600 600
800 (c)
Railways 300 1200
Transport
Navigation 300 1500 Commercial 100 50 100 100 100 100 Residential 100 50 100 100 100 100 Agriculture Stationary 100 50 100 100 100 100
Other Sectors
Mobile 1000 1200
Note: (a) NOX emission factors for small combustion facilities tend to be much smaller than for large facilities due to lower combustion temperatures. (b) Includes animal dung, agricultural, municipal and industrial waste (c) It assumes that heavy-duty vehicles running on diesel consume the major part.
Source: IPCC, 1997.
Page 22
________________________________________________________
http://www.e2analytics.com
21
Table 3: Range analysis of SO2 emissions
% of total emissions No. of largest emitter districts 1990 1995
% CAGR (1990-95)
1-5 14.7 15.5 11.7 1-15 31.9 33.4 7.7 1-25 43.1 46.5 7.9 1-47 59.1 63.8 8.1 1-233 92.1 94.3 6.1 All India (1-466) 100 100 5.5 Table 4: Top ten SO2 emitting districts in terms of total emissions
Total SO2 (Gg) District 1990 1995
% CAGR (1990-95)
Bilaspur 156 176 2,4 Sonbhadra 119 174 8,0 South Arcot 10 138 69,1 Karimnagar 84 127 8,4 Chandrapur 49 112 18,0 Mirzapur 83 105 4,7 Giridih 83 96 3,1 Tirunelveli-Kattabomman 49 89 12,6 Krishna 44 86 14,2 Nagpur 62 85 6,4
Table 5: Top ten SO2 emitting districts in terms of emissions per unit area
SO2/area (tons/km2) Average annual concentration (Micro grams/m3) #
District Area (km2)
1990 1995 1990 1995 Chennai 174 206,2 330,3 19 23 Calcutta 185 197,2 177,1 30 36 Greater Mumbai 603 118,4 112,0 37 31 Mahe 9 88,9 75,6 NM NM Gandhinagar 649 16,7 49,6 21* 32* Delhi 1483 47,9 46,7 16 24 Hyderabad 217 33,5 41,0 9 17 Chandigarh 114 23,1 35,7 7 11 Rupnagar 2085 21,8 31,6 NM NM Sonbhadra 6358 18,7 27,4 NM NM # Source: (B5) CPCB (1991 and 1996) NM indicates not monitored. * For Gandhinagar district, we have taken the CPCB measured values for Ahmedabad city.
Page 23
________________________________________________________
http://www.e2analytics.com
22
Table 6: Top 5 top SO2 emitting districts for different sectors in 1995 Sector Largest Second Third Fourth Fifth
Power generation Sonbhadra Bilaspur South Arcot Karimnagar Chandrapur Transport Delhi Greater
Mumbai Bangalore Chennai Pune
Steel Raipur Giridih Visakhapatnam Barddhaman Purbi Singhbhum
Cement Gulbarga Satna Chandrapur Chittaurgarh Raipur Other industries Dhenkanal Karimnagar Kanpur Puri Calcutta Sulfuric acid Ernakulam Vadodara Visakhapatnam Greater
Mumbai Chidambaranar
Copper Smelting Jhunjhuna Balagat Purbi Singhbhum
Alwar Sundargarh
Lead smelting Udaipur Sundargarh Bilwara Guntur East Sikkim Zinc Smelting Udaipur Bilwara East Sikkim Other sectors Greater
Mumbai Delhi Medinipur North
Twenty Barddhaman
Overall Sonbhadra Bilaspur South Arcot Karimnagar Chandrapur Table 7: Range analysis of NOX emissions
% of total emissions No. of largest emitter districts 1990 1995
% CAGR (1990-95)
1-5 10.73 10.98 8.8 1-15 22.75 24.04 7.64 1-25 31.01 33.26 7.66 1-47 43.74 46.6 7.4 1-233 84.7 86.9 6 All India (1-466) 100 100 5.6 Table 8: Top ten NOX emitting districts in terms of total emissions
Total NOX (Gg) District 1990 1995
% CAGR (1990-95)
Bilaspur 74 85 2.6 Delhi 66 82 4.5 Sonbhadra 56 81 7.8 South Arcot 13 70 40.9 Karimnagar 41 63 8.7 Chandrapur 25 54 16.9 Mirzapur 39 50 4.9 Greater Mumbai 46 49 1.2 Krishna 27 48 12.6 Giridih 40 46 3.1
Page 24
________________________________________________________
http://www.e2analytics.com
23
Table 9: Top ten NOX emitting districts in terms of emissions per unit area NOX /area (tons/km2) District Area (km2)
1990 1995 Chennai 174 116 170 Mahe 9 143 119 Calcutta 185 112 114 Greater Mumbai 603 76 81 Hyderabad 217 40 58 Delhi 1483 44 55 Chandigarh 114 28 41 Gandhinagar 649 9 25 Rupnagar 2085 9 14 Sonbhadra 6358 9 13
Table 10: Largest NOx emitting Indian districts for different sources in 1995 Source Largest Second Third Fourth Fifth Coal Combustion
Sonbhadra Bilaspur South Arcot Karimnagar Chandrapur
Oil Combustion
Delhi Greater Mumbai Bangalore Thane Raigarh
Biomass Combustion
Cuttak Muzaffarnagar Bijnor Meerut Medinipur
Natural Gas Bulandshahr Etawah Surat Kota Bharuch Industrial Process
Greater Mumbai Sundargarh Bharuch Raigarh Rupnagar
Overall Bilaspur Delhi Sonbhadra South Arcot Karimnagar Table 11: Sectoral contributions to Indian emissions in 1995
% share Sectors NOx SO2
Power generation 27,9 46,1 Transport 32,0 7,8 Industry 19,2 34,4 Biomass burning 18,7 5,2 Other sectors 1,9 3,8 Non-energy sources 0,3 2,7 All India emissions (Tg) 3.46 4.64