34

M-1772|2020
Cold venting and fugitive emissions from Norwegian oil and gas activities
Sub-report 3B Abatement opportunities and reduction potentials
Prepared for the Norwegian Environment Agency
Geir Husdal
Lene Osenbroch Özlem Yetkinoglu
15 March 2016

COLOPHON
Executive institution
Add Novatech AS
Project manager for the contractor Contacts at the Norwegian Environment Agency
Geir Husdal Sissel Wiken Sandgrind/Bjørn A Christensen
M number Year Pages Norwegian Environment Agency contract no
M-1772|2020
2016 34 14088187
Publisher Financed by
Norwegian Environment Agency Norwegian Environment Agency
Authors
Geir Husdal, Lene Osenbroch, Özlem Yetkinoglu and Andreas Østebrøt
Title
Cold venting and fugitive emissions from Norwegian oil and gas activities Sub-report 3B - Abatement opportunities and reduction potentials
Summary
Techniques (technologies and methods) have been identified which can eliminate a number of sources of direct methane and nmVOC emissions. These techniques are already in use on production facilities off Norway today. Adopting the identified emission-free techniques on new facilities will sharply reduce direct methane and nmVOC emissions from these compared with the amounts released from facilities currently on stream. The additional cost of implementing such measures on new facilities is expected to be small or non-existent. Where existing facilities are concerned, the position is completely different. While it is also technically feasible to implement emission-free techniques on these, this would call for fairly extensive modification work with a correspondingly high abatement cost.
Four subject words
Direct emissions, methane, nmVOC, mitigation [4 subject words]
Front cover photo
Heimdal. Source: Statoil, photographer: Øyvind Hagen

Cold venting and fugitive emissions from Norwegian oil and gas activities
Sub-report 3B – Abatement opportunities and reduction potentials
3
Summary and conclusions
Measures for reducing direct methane and nmVOC emissions from facilities on the
Norwegian continental shelf (NCS) have been surveyed, the opportunities and potential
for reducing emissions have been assessed, and abatement costs have been addressed.
In this report, direct emissions mean waste gases released unburnt through
atmospheric/cold vents or as fugitive emissions.
Techniques (technologies and methods) have been identified which can eliminate a
number of sources of direct methane and nmVOC emissions. These are already in use on
production facilities on the NCS today.
Where emission sources which cannot be eliminated are concerned, measures have been
identified which can reduce the amounts released from a number of them to some
extent. However, sources of direct emissions also exist which can only be reduced to a
small extent or not at all. Emission quantities from most of these sources are well
mapped and relatively small. Where one is concerned (small leaks through flanges,
valves and forth), the quantities emitted are so far partly unclarified but could be
substantial. A new quantification method has been proposed here which should be able to
provide more reliable emission estimates (ref 2).
Adopting the identified emission-free techniques on new facilities will sharply reduce
direct methane and nmVOC emissions compared with the amounts released from
facilities currently on stream. The additional cost of implementing such measures on new
facilities is expected to be small or non-existent, but there could be facility-specific
exceptions. Ignoring sources such as small leaks and emissions in connection with flare
ignition (where the amount involved remains unclarified at present), it could be possible
to achieve emission quantities below 10 tonnes of hydrocarbon (HC) gas (methane plus
nmVOC) per facility for those without crude oil storage tanks. Where facilities have such
tanks (such as floating production, storage and offloading (FPSO) units), emissions are
likely to be somewhat higher because of gas-freeing from the tanks in connection with
their regular inspections.
Where existing facilities are concerned, the position is completely different. While it is
also technically feasible to implement emission-free techniques on these, that would call
for fairly extensive modification work with a correspondingly high abatement cost.
Because the scope of such modification could vary considerably between facilities as a
result of differing preconditions, abatement costs cannot be calculated for the individual
facility/measure as part of this project module. As a result, no basis exists for calculating
a realistic emission reduction potential. However, qualitative estimates made on a
source-by-source basis indicate that it could realistically be possible to reduce emissions
on existing facilities by about 10 per cent. But the level of uncertainty in this estimate is
high.
Abatement costs are difficult to calculate because methane and nmVOC emissions have
no defined price. However, the project has proposed using a “fictive” price based on
methane’s global warming potential (GWP) measured in CO2 equivalent, combined with a
CO2 price based on tax and the emission trading rate. It is recommended that the
abatement cost for the individual facility/measure be assessed by each operator.
Cold venting and fugitive emissions from Norwegian oil and gas activities
Sub-report 3B – Abatement opportunities and reduction potentials
4
Contents
Summary and conclusions ................................................................................................................................ 3
1 Introduction .............................................................................................................................................. 5
2 Direct emissions of HC gases ..................................................................................................................... 6
3 Abatement opportunities and reduction potentials .................................................................................. 7
3.1 Introduction ............................................................................................................................................... 7
3.2 General emission-reduction methods ........................................................................................................ 7
3.3 Reduction measures source by source ....................................................................................................... 8 3.3.1 Introduction ....................................................................................................................................... 8 3.3.2 TEG regeneration ............................................................................................................................... 9 3.3.3 Treatment of produced water.......................................................................................................... 11 3.3.4 Emissions from compressor seal oil ................................................................................................. 13 3.3.5 Emissions from dry compressor seals .............................................................................................. 15 3.3.6 Emissions from reciprocating compressors ..................................................................................... 17 3.3.7 Emissions from depressurising process equipment ......................................................................... 18 3.3.8 HC purge and blanket gas ................................................................................................................ 18 3.3.9 Unburnt flare gas ............................................................................................................................. 19 3.3.10 Leaks .............................................................................................................................................. 20 3.3.11 Emissions from drilling ................................................................................................................... 22 3.3.12 MEG regeneration .......................................................................................................................... 23 3.3.13 Amine regeneration ....................................................................................................................... 24 3.3.14 Gas analysers ................................................................................................................................. 25 3.3.15 Crude oil storage tanks – FPSO ...................................................................................................... 25 3.3.16 Emissions from minor sources ....................................................................................................... 26
3.4 Emissions from sources with no abatement opportunities ..................................................................... 27 3.4.1 Emissions from gas-freeing of process equipment and tanks .......................................................... 28 3.4.2 Emissions from drilling operations ................................................................................................... 28 3.4.3 Emissions from amine regeneration ................................................................................................ 28 3.4.4 Emission sources with limited reduction potential .......................................................................... 28
3.5 Realistic emission reductions ................................................................................................................... 29 3.5.1 New facilities .................................................................................................................................... 29 3.5.2 Realistic emission reductions from facilities on stream ................................................................... 30
4 Modification and abatement costs .......................................................................................................... 33
4.1 Modification costs ................................................................................................................................... 33
4.2 Basis for calculating abatement cost ...................................................................................................... 33
5 References .............................................................................................................................................. 34
Cold venting and fugitive emissions from Norwegian oil and gas activities
Sub-report 3B – Abatement opportunities and reduction potentials
5
1 Introduction
Petroleum operations on the NCS involve the release of methane and non-methane
volatile organic compounds (nmVOC) to the air from a number of sources. Reported
direct emissions represented about 71 and 18 per cent of the total amount of methane
and nmVOC respectively released from the sector in 2012.
The Norwegian Environment Agency has commissioned Add Novatech AS to improve the
knowledge base for these emissions. This assignment originally involved three modules,
but has recently been extended to a fourth covering a comparison of emission sources/
calculation methods on offshore facilities and at petroleum plants on land.
Module 1 of the project involved a survey of possible emission sources. This was done
through full-day meetings with operators for a total of 15 producing facilities on the NCS,
where all process systems which could function as sources for direct methane and
nmVOC emissions were reviewed. In addition, potential emission sources on the
remaining facilities were surveyed through a questionnaire completed by the operators.
It transpired that the number of sources far exceeded those which emissions had
previously been reported for.
The project’s module 2 drew up proposals on quantification methods for methane and
nmVOC emissions from each of the identified sources. As far as possible, new emission
estimates were compiled on the basis of the proposed methods. Although the amounts
released from some of the sources are still unclarified, the estimates indicated that
overall direct methane and nmVOC emissions from NCS facilities are unlikely to deviate
much from the figures reported previously.
Module 3 of this project has addressed opportunities for reducing these emissions. The
assessments are based on the estimates provided in the module 2 sub-report. Work on
module 3 has been documented in two sub-reports.
• Sub-report 3A: BAT assessment. This evaluates which emission reduction
measures for the individual sources meet the requirements for best available
techniques (BAT).
• Sub-report 3B: Abatement opportunities and reduction potentials.
This sub-report covers module 3B.
Cold venting and fugitive emissions from Norwegian oil and gas activities
Sub-report 3B – Abatement opportunities and reduction potentials
6
2 Direct emissions of HC gases
HC gases are divided into two emission groups – methane (CH4) and nmVOC. A number
of processes and sub-processes involved in oil and gas production produce waste gases
which wholly or partly contain HC gases. If these waste gases are released to the air
through atmospheric/cold vents or as fugitive emissions, they are described as direct
emissions.
Atmospheric vents are dedicated emission pipes with a defined release point (point
emission). The point emission may collect waste gases from a number of sources. In
such cases, they are often called a common atmospheric vent. These often (but not
always) have their emission point some way up the flare boom on the facility – in some
cases right at its top, alongside the flare tip.
Some processes/sub-processes emit waste gas from the source directly to the air without
mixing with waste gases from other sources. Such emissions occur in safe areas on the
facility, and are often termed local vents.
Leaks occur from the process plant. Such escapes, which are usually too small to be
measured, occur at the leak site and are termed fugitive emissions.
Cold venting and fugitive emissions from Norwegian oil and gas activities
Sub-report 3B – Abatement opportunities and reduction potentials
7
3 Abatement opportunities and
reduction potentials
3.1 Introduction
Forty-eight potential sources (termed processes/sub-processes) of methane and nmVOC
emissions were identified in sub-report 1 of this project (ref 1). The amounts emitted are
listed and commented on in sub-report 2, Emission estimates and quantification methods
(ref 2). A couple of sources had no good emission data because usable quantification
methods were not in place. Work on this is continuing at the individual operators.
Technology and methods which make it possible to reduce and, in a number of cases,
eliminate emissions are available for many of the potential sources. This can be achieved
by selecting practical solutions where the waste gas is either recycled to the process or
sent for flaring. Recycling is a better measure in environmental terms than flaring,
because the latter releases combustion gases such as CO2 and NOx as well as soot (black
carbon) and small quantities of unburnt HCs.
These measures are implemented to a great extent on many NCS facilities. The 3A sub-
report on BAT describes them.
Identified possible emission-reducing measures are listed and commented on in this
chapter. Most can be implemented fairly simply on new facilities, to some extent without
significant extra costs. The position is completely different for existing facilities. Technical
and safety obstacles and constraints on certain of these could complicate or block the
adoption of some listed emission-reducing measures, and the cost of implementing them
may be so high that they would be difficult to justify in terms of abatement cost. Detailed
facility-specific studies will be needed to secure an overview of which measures could be
feasible on each existing facility.
3.2 General emission-reduction methods
Methane and nmVOC emissions can be eliminated from many of the potential sources. In
principle, this can be accomplished in three ways.
1. Removing the source process. Examples include replacing fuel gas with nitrogen
for purge, blanket and stripping gas, or opting for dry compressor seals rather
than oil versions.
2. Recycling waste gas to the process. This is easier for those gases which are under
pressure than for those at atmospheric pressure. In the latter case, access to a
low-pressure compressor would normally be required.
3. Flaring the waste gas. The conditions are the same as for recycling. A precondition
for this solution is that the facility has a continuously lit low-pressure flare.
Methods 1 and 2 can eliminate methane and nmVOC emissions and are the best solutions
environmentally since flaring waste gases (method 3) would emit CO2, NOX, soot and
small quantities of unburnt natural gas. Conditions on a facility could mean that one or
more of these options cannot be implemented.
Measures have also been identified which can only reduce emissions, such as changing
process parameters (eg, produced water) or routines (eg, flaring). Some emission
sources can only be reduced, not completely eliminated. For some sources, no measures
have been found which could reduce emissions.

Cold venting and fugitive emissions from Norwegian oil and gas activities
Sub-report 3B – Abatement opportunities and reduction potentials
8
3.3 Reduction measures source by source
3.3.1 Introduction
Identified measures are described for the individual emission sources/sub-sources. In
addition, they are listed in a table for both new facilities and those on stream. Where the
latter are concerned, a maximum potential emission reduction for each source has also
been specified by this project. This estimate indicates what reduction could be attainable
for the NCS as a whole if the measure were implemented on all facilities with emissions
from the source. It must be emphasised that this target is unrealistic for virtually all
sources. Implementing identified measures at an acceptable abatement cost is unlikely
for a number of the sources and facilities. Establishing a realistic goal for possible
emission cuts will only be possible after the individual operator has evaluated abatement
opportunities (and costs) on its facilities.
This report places its main emphasis on the sources and measures with the greatest
potential for emission reductions. These sources are presented in table 1 with estimates
of annual amounts emitted for the NCS as a whole. Some of the sources are only present
on a few facilities and some lack emission data.
Table 1 Overview of sources with large emissions. Estimates are for the NCS as a whole
(2014 figures).
Process/sub-process Emissions (t/y)
Methane nmVOC
TEG degassing tank 0 0
TEG regenerator 220 660
TEG stripping gas 310 260
Produced-water degassing tank 300 40
Produced-water flotation tank/CFU 50 50
Produced-water flotation gas 200 50
Produced-water discharge caisson 1 730 440
Oil seals degassing tank Note 1
Oil seals - oil holding and storage tanks 160 160
Dry seals – primary barrier 2 280 1 000
Dry seals – HC as secondary barrier 20 10
Dry seals – leaks from primary to secondary seal 180 90
Reciprocating compressor – separator chamber and crankshaft
housing 750 130
Decompression of process equipment 18 16
HC gas for purge and blanket 1 100 1300
Extinguished flare and flare ignition Note 2
Non-flammable flare gas Note 3
Inert-gas-flushed open flare 1 510 580
Leaks, small/fugitive emissions 1 250 950
Drilling 57 57
MEG regenerator 25 70
Amine regeneration 95 40
Gas analysers and test stations 71 54
FPSO crude oil storage tanks – inspection 71 55

Cold venting and fugitive emissions from Norwegian oil and gas activities
Sub-report 3B – Abatement opportunities and reduction potentials
9
Note 1: Both emission and base data are lacking. On most facilities (perhaps all), the
waste gas is led to recycling or flaring. The operators are continuing to look at
this, and are expected to have an overview ready around 1 May 2016.
Note 2: Data lacking. Emissions are estimated to be in the order of 10-100 tonnes per
year (t/y – methane plus nmVOC).
Note 3: Emissions registered under other processes (produced water and amine
regeneration).
A simple assessment has been made of measures for reducing emissions from the small
sources. See section 3.3.16.
In addition come some sources where no possible emission-reducing measures have
been identified. These are listed in section 3.4, with an explanation of why no possible
measures have been found.
3.3.2 TEG regeneration
Three sub-sources for possible emissions from TEG regeneration have been identified:
Table 2 Facilities with emissions from TEG regeneration, with emission quantities.
Sub-source Facilities with
emissions
Emissions CH4
(t/y)
Emissions nmVOC
(t/y)
Degassing tank 0 0 0
Regenerator1 12 220 660
Stripping gas 8 310 260
Emission estimates shown in this table and corresponding tables below all refer to 2014.
Using HC stripping gas contributes to emissions from the regenerator
A number of NCS facilities recycle waste gas to the process from both degassing tank
and regenerator (including stripping gas). Many facilities also flare the waste gas.
3.3.2.1 Emissions from the TEG degassing tank
Recycling should be an obvious choice for new facilities. The fact that this solution has
been chosen for all the facilities provides an indication that it does not involve particularly
high costs. Recycling the waste gas is regarded as BAT (see ref 3).
3.3.2.2 Emissions from the TEG regenerator
Dissolved HC gas is boiled out of the TEG solution, together with dissolved water at
200oC, in the TEG regenerator (also known as the TEG boiler). The waste gas mainly
comprises water vapour, but also contains methane and nmVOC. On some facilities, it is
released directly to the air. On others, it is cooled down in a condenser to separate out
the water. The vapour phase, comprising methane, nmVOC and some water, is released
to the air, sent for flaring or recycled to the process. The liquid phase, comprising water
and small quantities of nmVOC, is often discharged via the produced-water system.
On new facilities, recycling waste gases from the TEG regenerator will be a natural
technology choice and is proposed as BAT. The survey found no information to suggest
that recycling involves higher investment and operating costs than emission. This is
supported by the fact that waste-gas recycling has been chosen on nine existing NCS
1 Excluding the contribution from stripping gas.

Cold venting and fugitive emissions from Norwegian oil and gas activities
Sub-report 3B – Abatement opportunities and reduction potentials
10
facilities, compared with emission by cold venting on 12 (the rest of the facilities with
TEG regeneration route the waste gas to the low-pressure flare).
The position will be different for existing facilities where methane and nmVOC are
emitted from the TEG regenerator. To avoid returning large quantities of water to the
process, condensing and removing water in the waste gas from the regenerator would be
advantageous. Facilities which lack a waste gas condenser and water separator may have
to install these in order to recycle. On some facilities, a new low-pressure separator may
also be required to meet minimum pressure requirements for recycling. Moreover, more
or less extensive changes to the piping systems must be expected. These considerations
indicate that abatement costs will be lowest on facilities which already have a waste gas
condenser and associated vapour-liquid separator, along with a low-pressure (VRU)
compressor which can be used for this purpose.
Flaring waste gas from the liquid separator (for plants which have this) offers another
mitigation opportunity for facilities with an active low-pressure flare. On facilities which
emit waste gas and lack a waste-gas condenser and vapour-liquid separator, the water
content in the waste gas could be an obstacle for flaring if the HC concentration in the
flare gas becomes too low to ensure stable burning.
Since such measures will, in many cases, need a production shutdown to make
modifications, a precondition will be that this work is done in conjunction with a
turnaround to avoid high costs from lost output.
Because both technical conditions and emission reductions can differ substantially from
facility to facility, big variations in abatement costs must be expected. Similarly, a
generic assessment of abatement costs will be difficult to do and fairly meaningless.
Abatement assessments and calculations must therefore be made by each operator.
3.3.2.3 Emissions of stripping gas
Gas is used on certain facilities to strip dissolved water residues from the TEG
regenerator. HC gas (primarily fuel gas), internally vaporised HC gas (the Drizo process)
or nitrogen (N2) is utilised as stripping gas. Once used, this is sent as waste gas from the
boiler with HC gas boil-off from the latter. This means that emissions can be eliminated if
waste gas from the boiler is recycled or sent to flaring (see section 3.3.2.2).
HC gas emissions only rise if external HC stripping gas (normally fuel gas) is added.
Emissions from the use of stripping gas can thereby be eliminated through:
1. opting for nitrogen (which must be very pure since oxygen residues in the
stripping gas could otherwise oxidise and break down the TEG solution) or
internally generated stripping gas (like the Drizo process)
2. recycling (or flaring) waste gas from the TEG boiler (see section 3.3.2.2).
This is proposed as BAT for new facilities.
Since this is a significant source of direct methane and nmVOC emissions, operators are
recommended to assess measures on facilities which directly emit stripping (HC) gas,
including those currently in operation.
Additional costs should be small for new facilities. On existing installations, however, the
measures could be expensive. Each operator must assess this in relation to facility-
specific conditions.
Cold venting and fugitive emissions from Norwegian oil and gas activities
Sub-report 3B – Abatement opportunities and reduction potentials
11
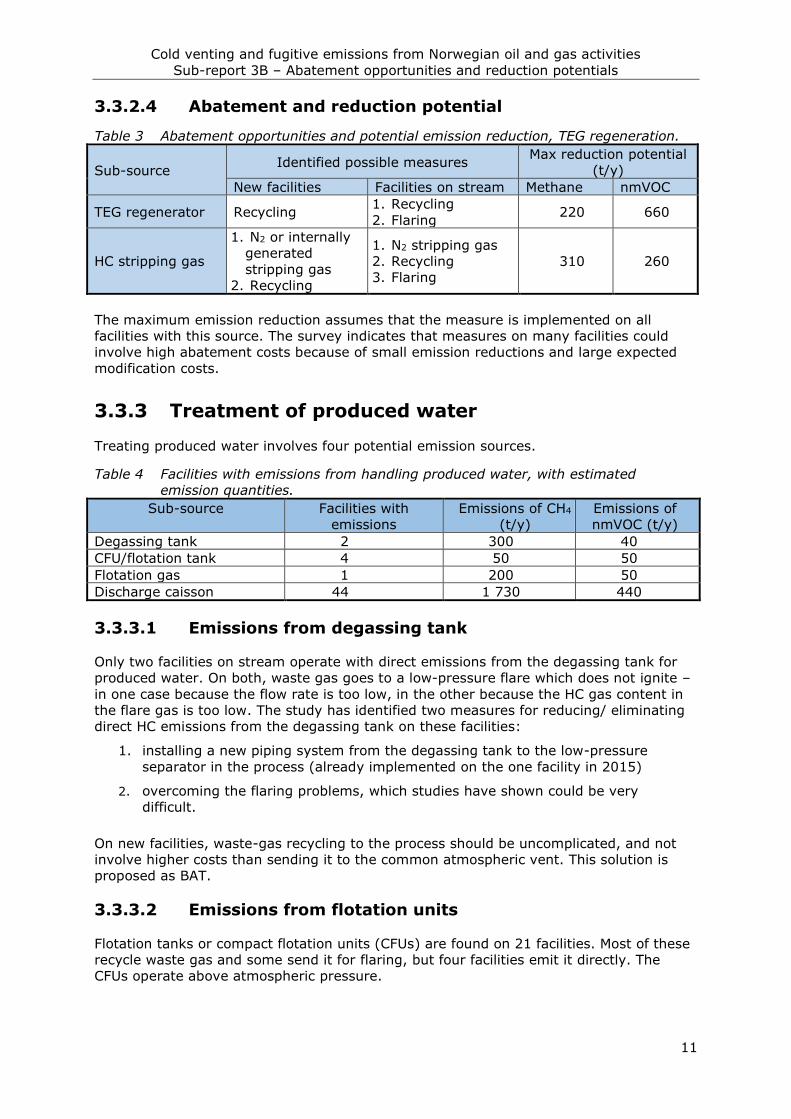
3.3.2.4 Abatement and reduction potential
Table 3 Abatement opportunities and potential emission reduction, TEG regeneration.
Sub-source Identified possible measures
Max reduction potential
(t/y)
New facilities Facilities on stream Methane nmVOC
TEG regenerator Recycling 1. Recycling
2. Flaring 220 660
HC stripping gas
1. N2 or internally
generated
stripping gas
2. Recycling
1. N2 stripping gas
2. Recycling
3. Flaring
310 260
The maximum emission reduction assumes that the measure is implemented on all
facilities with this source. The survey indicates that measures on many facilities could
involve high abatement costs because of small emission reductions and large expected
modification costs.
3.3.3 Treatment of produced water
Treating produced water involves four potential emission sources.
Table 4 Facilities with emissions from handling produced water, with estimated
emission quantities.
Sub-source Facilities with
emissions
Emissions of CH4
(t/y)
Emissions of
nmVOC (t/y)
Degassing tank 2 300 40
CFU/flotation tank 4 50 50
Flotation gas 1 200 50
Discharge caisson 44 1 730 440
3.3.3.1 Emissions from degassing tank
Only two facilities on stream operate with direct emissions from the degassing tank for
produced water. On both, waste gas goes to a low-pressure flare which does not ignite –
in one case because the flow rate is too low, in the other because the HC gas content in
the flare gas is too low. The study has identified two measures for reducing/ eliminating
direct HC emissions from the degassing tank on these facilities:
1. installing a new piping system from the degassing tank to the low-pressure
separator in the process (already implemented on the one facility in 2015)
2. overcoming the flaring problems, which studies have shown could be very
difficult.
On new facilities, waste-gas recycling to the process should be uncomplicated, and not
involve higher costs than sending it to the common atmospheric vent. This solution is
proposed as BAT.
3.3.3.2 Emissions from flotation units
Flotation tanks or compact flotation units (CFUs) are found on 21 facilities. Most of these
recycle waste gas and some send it for flaring, but four facilities emit it directly. The
CFUs operate above atmospheric pressure.

Cold venting and fugitive emissions from Norwegian oil and gas activities
Sub-report 3B – Abatement opportunities and reduction potentials
12
The natural solution for new facilities planned with a CFU (or atmospheric flotation unit)
will be to send the waste gas (including flotation gas) to recycling (alternatively to a low-
pressure flare), eliminating methane and nmVOC emissions from this sub-source.
Several methods could be available for reducing or eliminating emissions from flotation
tanks on facilities in operation.
• Waste gas emitted from an CFU (directly or via the spill oil tank) can be rerouted
to the low-pressure side of the process or the low-pressure flare. Pressure
conditions on the facility could require installation of a low-pressure compressor.
• A similar solution could eliminate emissions on the two facilities with conventional
atmospheric flotation units.
• Reinjecting produced water could also eliminate emissions entirely or almost
entirely (this could quickly prove an expensive solution).
Since conditions may differ considerably between the facilities, so may abatement costs.
Only the operators can therefore estimate implementation and abatement costs.
3.3.3.3 Emissions of HC flotation gas
Fifteen facilities use HC gas for flotation. On one, waste gas from the flotation unit is
directly emitted. All the others send the waste to recycling or flaring.
This indicates that recycling HC flotation gas is not only technically feasible but also does
not add particularly to costs. Recycling the waste gas is therefore recommended as the
solution for all new facilities. On existing facilities, modification costs will be crucial in
determining whether this is an acceptable solution.
3.3.3.4 Emissions from the discharge caisson
This is one of the dominant sources of direct methane emissions on the NCS.
The discharge pipe (caisson) for produced water functions as a separator. To prevent
underpressure in the caisson, a relief pipe is fitted on its upper part where the gas phase
(which comprises water vapour and freed HC gas) is released. Based on the information
acquired from the operators, this gas is recycled on only one NCS facility. On the others,
it is directly emitted either via a common atmospheric vent or from local point vents.
Emissions of HC gases from discharge caisson on facilities with atmospheric flotation
tanks will be equal to zero. This is because the HC gases are freed upstream in the
flotation unit (which operates at atmospheric pressure).
Methane and nmVOC emissions from the discharge caisson can be dealt with as follows.
• Eliminated by recycling to the process. The low (atmospheric) gas pressure would
in many cases require provision of a low-pressure compressor (if not already in
place). On new facilities, the extra costs would be relatively moderate. They could
be substantially higher on existing facilities, particularly if a new low-pressure
compressor must be installed.
• Eliminated/reduced by sending the gas to a low-pressure flare (or an atmospheric
one if installed). This requires the facility to have a low-pressure flare lit
continuously, and to be designed so that gas does not flow back the other way
(from low-pressure flare manifold to discharge caisson.
• Reduced by lowering the degassing-tank pressure (emissions are an almost linear
function of the gauge pressure (Pg) in the tank). This is an opportunity for new
facilities which should be assessed in the concept design phase. How far

Cold venting and fugitive emissions from Norwegian oil and gas activities
Sub-report 3B – Abatement opportunities and reduction potentials
13
degassing-tank pressure could be lowered on existing facilities depends on the
design of the gas-handling system, which may vary from facility to facility. Only
facility-specific systems analysis could determine how feasible this is. If
degassing-tank pressure can be reduced to almost zero barg, emissions from the
discharge caisson could be virtually eliminated.
On facilities which can lower degassing-tank pressure, this would be cost-effective
and have the lowest abatement cost.
• Reduced or eliminated through produced-water injection. This would be expensive
on facilities which do not have such injection already.
The technically or economically preferred solution(s) will depend on the technical
conditions found on the facility. How far any of the measures will yield an acceptable
abatement cost depends entirely on how much modification work is required.
3.3.3.5 Abatement and reduction potentials
Table 5 Abatement opportunities and potential emission cuts from treating produced
water.
Sub-source Identified possible measures
Max reduction
potential (t/y)
New facilities Facilities on stream Methane nmVOC
Produced-water
degassing tank
1. Recycling
2. Flaring
1. Recycling
2. Flaring 0 0
Flotation unit 1. Recycling
2. Flaring
1. Recycling
2. Flaring 50
50
Flotation gas 1. Recycling 1. Recycling 200 50
Discharge
caisson
1. Inject produced
water
2. Lowest possible
degassing-tank
pressure
3. Recycling
4. Flaring
1. Reduce degassing-
tank pressure
2. Recycling
3. Flaring
4. Inject (all)
produced water
1 730
440
The maximum emission reduction assumes that the measure is implemented on all
facilities with this source. Lowering degassing-tank operating pressure will only reduce
emissions, so the maximum reduction potential is not achieved. The survey indicates that
the abatement cost of this measure could be high on many facilities because of relatively
low emission reductions and high expected modification costs.
3.3.4 Emissions from compressor seal oil
Big gas compressors using seal oil are found only on older facilities. Since dry seals are
considered BAT for new compressors, big units with seal oil systems are unlikely to be
used on new facilities. An exception here is small low-pressure vapour recovery unit
(VRU) compressors.
Two emissions sources have been identified with such seal oil systems:
• degassing pots (also known as sour gas pots)
• storage and holding tanks for seal oil.
Table 6 Facilities with emissions from seal oil systems with emission quantities.
Sub-source Facilities with emissions Emissions CH4
(t/y)
emissions
nmVOC (t/y)
Degassing pots 4 Unclarified Unclarified
Storage and holding tanks 14 160 160

Cold venting and fugitive emissions from Norwegian oil and gas activities
Sub-report 3B – Abatement opportunities and reduction potentials
14
The survey showed that available information is insufficient to produce a useful estimate
of degassing-pot emissions. Emission figures for storage/holding tanks are both
inadequate and uncertain, and the relatively substantial amounts released come from a
few facilities. The operators are continuing to work on this.
3.3.4.1 Emissions from degassing pots
Most facilities which have compressors with oil seals (13 of 17) recycle or recover waste
gases from the degassing pots. This shows that technology is available for eliminating or
reducing emissions from this sub-source.
Centrifugal compressors with oil seals are unlikely to be relevant for new facilities.
Should they nevertheless be chosen, recycling waste gas from the degassing pots would
be a natural technology choice. Flaring would also eliminate/reduce methane and nmVOC
emissions, and could be an option if, for various reasons, recycling is not applicable or
appropriate, or involves high costs.
Modifying compressors on existing facilities to use dry seals is considered so expensive
that the abatement cost would be unattractive. Two measures then remain: recycling the
waste gas to the process or rerouting it to the low-pressure flare.
Costs associated with rerouting pipework, possible installation of a low-pressure
compressor and so forth on existing facilities will depend on pressure conditions in the
degassing pots and the location of pipework (on some facilities, waste gas is led today to
local emission below deck). Such conditions can vary substantially from facility to facility.
Modification work would require a production shutdown, which can impose additional
costs unless it can be done during a planned turnaround.
Abatement costs are uncertain, and will depend on the emission cuts attainable through
the modifications. This means it is important to secure an overview of emissions first.
3.3.4.2 Emissions from storage/holding tanks
Recycling the waste gas through recirculation to the process and burning it in the low-
pressure flare are the only identified measures for eliminating/reducing emissions. This is
also the chosen solution for some facilities currently on stream. Conditions here will be
the same as for degassing pots. The survey showed that emission data from this source
are so far inadequate and poor. The operators are working to obtain a better overview.
3.3.4.3 Abatement and reduction potentials
Table 7 Abatement opportunities and potential emission cuts from compressor seal oil
systems.
Sub-source Identified possible measures
Max reduction
potential (t/y)
New facilities Facilities on stream Methane nmVOC
Degassing pots
1. Dry compressor
seals
2. Recycling
3. Flaring
1. Recycling
2. Flaring
Unclar-
ified
Unclar-
ified
Storage and
holding tanks
1. Recycling
2. Flaring
1. Recycling
2. Flaring 160
160
Cold venting and fugitive emissions from Norwegian oil and gas activities
Sub-report 3B – Abatement opportunities and reduction potentials
15
3.3.5 Emissions from dry compressor seals
Dry compressor seals have the potential to eliminate the emissions associated with oil
seals. But this requires that the seal gas system is correctly configured.
However, the surveys in phases 1 and 2 of this project showed the dry compressor seals
have become a dominant source of direct methane and nmVOC emissions. This is caused
by poor design and configuration of the seal gas system.
Table 8 Facilities which have emissions from dry seals with emission quantities.
Sub-source Facilities with
emissions
Emissions CH4
(t/y)
Emissions
nmVOC (t/y)
Primary barrier gas 12 2 280 1 000
Secondary barrier gas 3 20 10
Leaks primary to → secondary
barriers
19 180 90
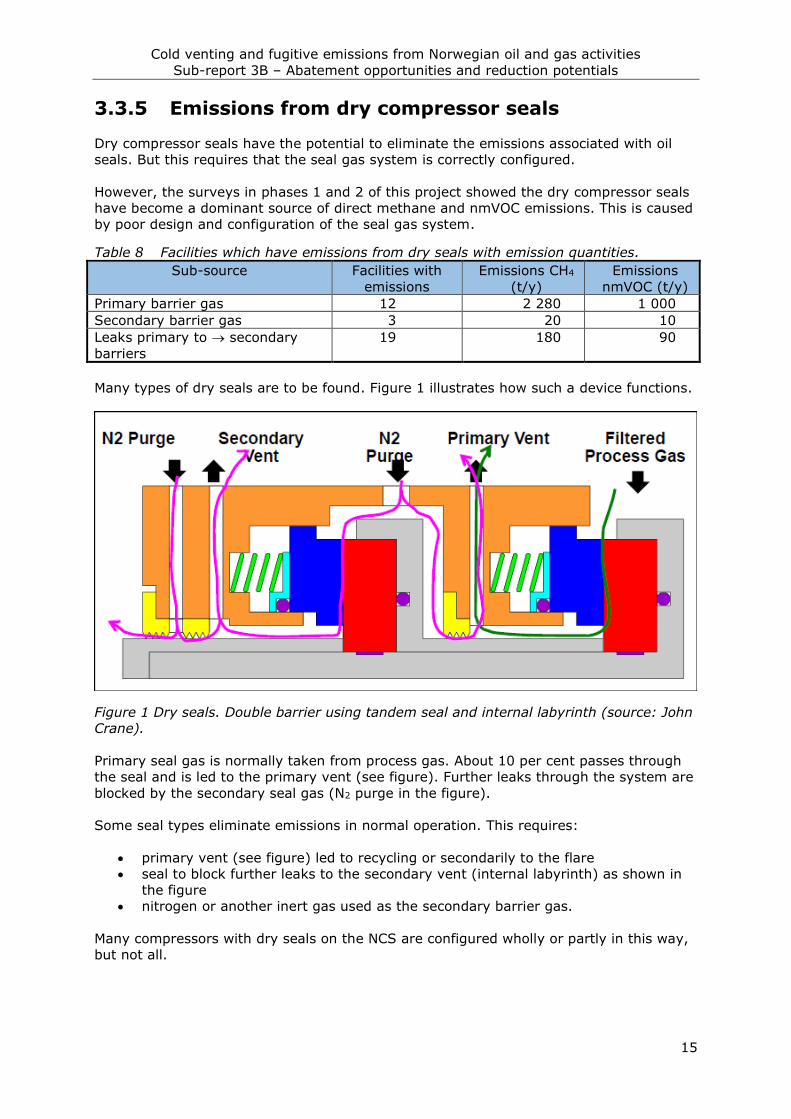
Many types of dry seals are to be found. Figure 1 illustrates how such a device functions.
Figure 1 Dry seals. Double barrier using tandem seal and internal labyrinth (source: John
Crane).
Primary seal gas is normally taken from process gas. About 10 per cent passes through
the seal and is led to the primary vent (see figure). Further leaks through the system are
blocked by the secondary seal gas (N2 purge in the figure).
Some seal types eliminate emissions in normal operation. This requires:
• primary vent (see figure) led to recycling or secondarily to the flare
• seal to block further leaks to the secondary vent (internal labyrinth) as shown in
the figure
• nitrogen or another inert gas used as the secondary barrier gas.
Many compressors with dry seals on the NCS are configured wholly or partly in this way,
but not all.

Cold venting and fugitive emissions from Norwegian oil and gas activities
Sub-report 3B – Abatement opportunities and reduction potentials
16
3.3.5.1 Leaks of primary barrier gas
The survey showed that primary barrier gas (primary vent in the figure) is directly
emitted (mainly via a common atmospheric vent) on 12 facilities. This represents a
substantial emission quantity.
On new facilities, the waste gas (primary vent) should be recycled or alternatively flared.
The relatively high gas pressure means that the additional cost compared with the
emission solution will be marginal or non-existent. This is proposed as BAT.
With existing facilities where the waste gas is emitted, the relevant measures will also be
rerouting to the low-pressure side of the process, alternatively to the flare. This will
almost certainly require a production shutdown in the modification period. Costs could
vary considerably from facility to facility, depending on how much modification work is
needed and how far this will require extra downtime for oil and gas production.
3.3.5.2 Emissions of secondary (HC) barrier gas
As shown in table 8, a relatively large number of facilities also use fuel or process gas as
secondary barrier gas and emit the waste gas. Nitrogen is used on several facilities,
preventing methane and nmVOC emissions from this sub-source.
HC gas rather than nitrogen may be used as barrier gas here for several reasons. The
survey showed that the dominant factor is the lack of satisfactorily clean nitrogen on the
facility. If this gas contains impurities or minor amounts of oxygen, the seal can be
damaged (corrosion, etc). Nitrogen for use as a barrier gas must accordingly be very
pure, which operators must be aware of when planning and designing new facilities. This
also means that converting from HC gas to nitrogen as a secondary barrier on producing
facilities may require replacement of the nitrogen unit with one which delivers a purer
product.
Other options in cases where HC gas is used as a secondary barrier could be recycling or
flaring. That would eliminate methane and nmVOC emissions from this sub-source.
3.3.5.3 Leak of primary barrier gas to secondary barrier
Certain dry seals are configured in such a way that some of the primary HC seal gas
leaks through the seal to the secondary vent (see figure 1) and is released from there to
the air. The overview provided by table 8 could be rather conservative, since certain of
the operators did not have a full overview during the survey. In such cases, it was
assumed that primary barrier gas leaked to the secondary vent. As a rule of thumb, this
project has assumed that 10 per cent of the gas to the primary vent (corresponding to
one per cent of total primary barrier gas) leaked on to the secondary vent. This estimate
is the seal supplier’s warranty figure, and could be somewhat conservative.
On new facilities, the simplest solution is to use seals with double barriers and an internal
labyrinth. This is also proposed as BAT.
Several solutions are available for facilities on stream.
1. Replace the double barrier seal with an internal labyrinth or other seal type which
prevents primary barrier gas leaking to the secondary vent.
2. Recycle by sending the waste gas to the low-pressure side of the process.
3. Send the waste gas from the secondary vent to the low-pressure flare. This is only
recommended if the nitrogen content is not so high that it affects flare ignition or
combustion conditions. If a closed flare is used, this option is more uncertain since

Cold venting and fugitive emissions from Norwegian oil and gas activities
Sub-report 3B – Abatement opportunities and reduction potentials
17
the gas is recycled to the process and will mean a higher nitrogen content in the
sales gas.
3.3.5.4 Abatement and reduction potentials
Table 9 Abatement opportunities and potential emission cuts, dry compressor seals.
Sub-source Identified possible measures
Max reduction
potential (t/y)
New facilities Facilities on stream Methane nmVOC
Primary barrier
gas
1. Recycling
2. Flaring
1. Recycling
2. Flaring 2 280 1 000
Secondary
barrier gas
1. Pure N2 as barrier
gas
2. Recycling (HC gas)
3. Flaring (HC gas)
1. Convert to pure N2
as barrier gas
2. Recycling (HC gas)
3. Flaring (HC gas)
20 10
Leaks from
primary to
secondary
barrier
1. Double barrier with
internal labyrinth
1. Change seal to one
with internal
labyrinth
2. Recycling
3. Flaring
180
90
3.3.6 Emissions from reciprocating compressors
Four of the surveyed facilities had reciprocating gas compressors. A couple of them used
such equipment on the whole gas compression train.
Seals on reciprocating compressors are stuffing boxes on the piston rods. Gas leaking
past the boxes collects in one or more separator chambers in series. Supplier information
indicates that about one per cent of the gas from the first chamber is led to the second.
Some gas may also leak from the separator chambers to the crankshaft housing, but is
not normally supposed to occur. The separator chambers are therefore the dominant
emission source. Operator estimates of emissions vary substantially from facility to
facility and are regarded as highly uncertain.
On one facility, waste gas is led from the separator chamber to the flare. Technology is
available both to send the gas to the flare and to recycle it. On new facilities, the
additional cost of these solutions is considered insignificant. Facilities on stream will
require rerouting of piping systems in the process area and perhaps the installation of an
extra low-pressure compressor. Such modifications will need a full or partial production
shutdown, but could eliminate/reduce emissions from this source.
Table 10 Abatement opportunities and potential emission cuts, reciprocating
compressors.
Sub-source
Facilities
with
emissions
Identified possible measures Emissions and max
reduction potential (t/y)
New facilities Facilities on
stream
Methane nmVOC
Reciprocating
compressor’s
separator
chamber
4 Recycling
Flaring
Recycling
Flaring 750 130

Cold venting and fugitive emissions from Norwegian oil and gas activities
Sub-report 3B – Abatement opportunities and reduction potentials
18
3.3.7 Emissions from depressurising process equipment
Emissions from depressurisation and gas-freeing of process equipment occur on all the
facilities handling/processing oil and gas. They occur when all or large parts of the
process are gas-freed – primarily for turnarounds. This source accounts for a relatively
small share of total direct methane og nmVOC emissions from NCS facilities.
Table 11 Facilities with emissions from depressurisation of process plants.
Source Facilities with
emissions
Emissions
CH4 (t/y)
Emissions
nmVOC (t/y)
Gas-freeing of process plants 54 18 16
A total of 54 facilities in 2015 processed oil and gas on the NCS. All had emissions
related to depressurisation and gas-freeing in the process plants.
The project has failed to identify any opportunities for eliminating these emission within a
reasonable cost estimate. Increasing the time between turnarounds is the only possible
measure identified for reducing emissions. This could have negative effects for other
aspects, such as production regularity, safety and so forth.
The project has not calculated the possible potential for emission reductions. Moreover,
the amounts released are small.
3.3.8 HC purge and blanket gas
Purge and blanket requirements are mainly met by inert (nitrogen) gas. Where HC (fuel)
gas is used, it is normally recycled to the process and in some cases flared. Six facilities
using HC gas for purge and blanket emit waste gas via a common atmospheric vent.
Table 12 Facilities with emissions of HC purge and blanket gas.
Source Facilities with
emissions
Emissions
CH4 (t/y)
Emissions
nmVOC (t/y)
HC purge and blanket gas 6 1 100 1 300
Basically, three measures are available which could reduce or eliminate the emissions:
1. convert to using nitrogen as purge and blanket gas
2. reclaim purge/blanket gas through recycling
3. burn this waste gas in the flare.
A number of existing facilities have adopted these solutions, which would therefore be a
natural choice for new installations. Where the latter are concerned, the cost of using one
of the measures is not expected to vary significantly from a solution with direct waste-
gas emission. Possible modifications to the few existing facilities emitting HC purge and
blanket gas would have to be adapted to the opportunities and limitations on each of
them.
Converting to nitrogen for purge/blanket gas could require an upgrading/upscaling of the
facility’s nitrogen unit. This solution would function for purging the common atmospheric
vent.
Recycling HC purge/blanket gas could work for most applications, but not with purge gas
from the common atmospheric vent and continuously lit flare systems. Some facilities
might need to install a small low-pressure compressor to use this solution.
Flaring waste purge/blanket gas is only possible if the facility has a lit atmospheric flare.
This solution could not be used on facilities with a closed flare.

Cold venting and fugitive emissions from Norwegian oil and gas activities
Sub-report 3B – Abatement opportunities and reduction potentials
19
Table 13 Abatement opportunities and potential emission reductions, purge/blanket gas.
Identified possible measures Max reduction potential (t/y)
New facilities Facilities on stream Methane nmVOC
1. HC gas: recycling of
waste gas
2. N2 as purge/blanket gas
3. Flaring
1. HC gas: recycling of
waste gas
2. N2 as purge/blanket gas
3. Flaring
Unclarified
3.3.9 Unburnt flare gas
Direct methane and nmVOC emissions from unburnt flare gas have various causes:
• extinguished flare and flare ignition (occurs on all NCS flares)
• inflammable flare gas owing to its low HC fraction (occurs on one facility)
• inert-gas-purged open flare (found on six facilities).
No emission data at all are available for the first of these sources. Emissions from non-
flammable flare gas and inert-gas-purged open flare are calculated using flow data from
the flare gas meter and gas analyses.
Table 14 Facilities with emissions from the flare system.
Sub-source Facilities with emissions Emissions
CH4(t/y)
Emissions
nmVOC (t/y)
Extinguished flare and flare
ignition
All facilities with flares
ignited or ignitable Unknown Unknown
Inert-gas-purged open flare 6 1 510 580
Non-flammable flare gas 1 abt 300 abt 40
Flaring therefore represents a substantial emission source, particularly for the few
facilities which emit from an inert-gas-purged open flare or non-flammable flare gas.
3.3.9.1 Extinguished flare and flare ignition
The survey showed that flares are almost never extinguished. However, it also found that
considerable emissions occurred during flare ignition because of the time lag between the
start to flaring and igniting the flare gas. How far this represents a significant emission
source is unclear, since the gas emitted has not been measured and recorded. The
problem is greater on facilities with a closed flare than for those where the flare is
continuously lit. Eliminating these emissions is unlikely to be possible. But introducing
faster-acting and more reliable ignition systems than those used today should reduce the
emissions somewhat. The operators are urged to compare ignition systems used on the
NCS on the basis of how quickly and reliably they can ignite the flare.
Table 15 Abatement opportunities and potential emission reductions from extinguished
flare and flare ignition.
Identified possible measure Max reduction potential (t/y)
Methane nmVOC
Faster-acting and more reliable ignition systems Unclarified
3.3.9.2 Non-flammable flare gas
Only one facility contributes to these emissions. In principle, three methods are available
for reducing them.

Cold venting and fugitive emissions from Norwegian oil and gas activities
Sub-report 3B – Abatement opportunities and reduction potentials
20
1. Rendering the flare gas flammable. This can theoretically be done by adding
enough flammable gas to the flare gas, which would increase CO2 emissions and
reduce revenues from gas sales. However, the CO2 content in waste gas from the
relevant facility is so high that this solution would never give an environmental
gain (500 times more CO2 than methane).
2. Routing some of the sub-sources to recycling in the process (already done by the
relevant operator).
3. Technically, the waste gas can also be injected in a separate, isolated sub-surface
formation. This is likely to be very expensive in relation to the attainable emission
reduction.
Non-flammable flare gas is a special case which seldom occurs, and then primarily in
relation to CO2 removal. With the latter required on possible new facilities, problems
posed by waste gas containing HC should therefore be carefully considered as early as
the initial planning phase.
Table 16 Abatement opportunities and potential emission reductions from non-
flammable flare gas.
Identified possible measures Max reduction
potential (t/y)
New facilities Facility on stream Methane nmVOC
Set minimising emissions as a
goal in the whole design phase,
including when choosing process
for CO2 (and H2S) removal
Reroute waste gas from
sub-sources with no CO2
content to recycling
~ 0 ~ 0
The emissions are registered under amine regeneration (section 3.3.13).
3.3.9.3 Inert-gas-flushed open flare
Six NCS facilities have a cold flare instead of one which is normally lit. Four of these have
an open cold flare which is normally purged with inert gas but which can be lit in special
circumstances or when the gas flow exceeds a specified minimum. On one facility, all
waste gas is emitted unburnt through the flare without purge gas being used. This means
that possible measures could vary between the six.
Recycling waste gas to the process could be a good solution, but is not possible on all the
facilities. A lit flare might be an option, but is not feasible on every facility either.
Individual facility-specific solutions are therefore required here to cut emissions.
3.3.10 Leaks
For practical reasons, this source has been split into large and small leaks.2 The large
category covers those which prompt an investigation and are therefore quantified and
reported pursuant to Norway’s health, safety and environmental (HSE) regulations. Small
leaks are all the other process system escapes and fugitive emissions from flanges, valve
stems and so forth.
Process systems on all NCS facilities are regularly inspected for leaks on a daily and
weekly basis. Those identified with an emission rate above a certain level are listed and
prioritised for mitigating measures, depending on their rate and criticality otherwise.
2 Smaller leaks refer here to those which are so minor that each leak is difficult or impossible to record. However, total emissions from this source could be substantial.
Cold venting and fugitive emissions from Norwegian oil and gas activities
Sub-report 3B – Abatement opportunities and reduction potentials
21
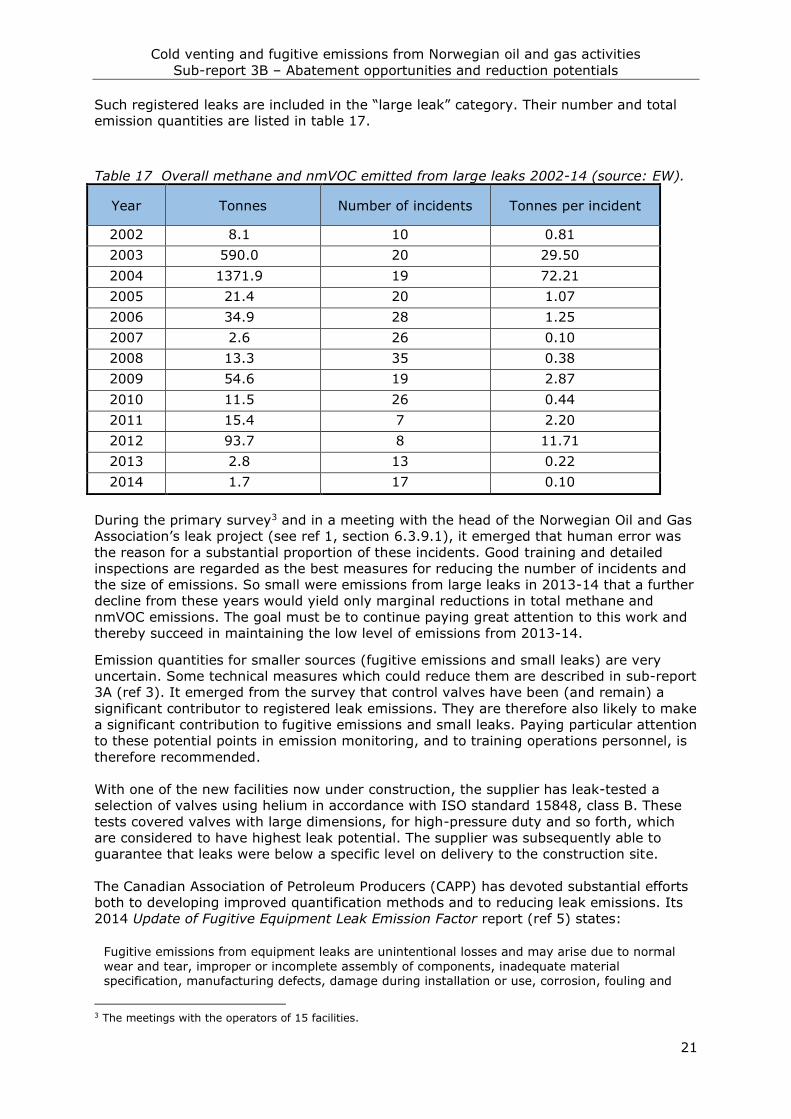
Such registered leaks are included in the “large leak” category. Their number and total
emission quantities are listed in table 17.
Table 17 Overall methane and nmVOC emitted from large leaks 2002-14 (source: EW).
Year Tonnes Number of incidents Tonnes per incident
2002 8.1 10 0.81
2003 590.0 20 29.50
2004 1371.9 19 72.21
2005 21.4 20 1.07
2006 34.9 28 1.25
2007 2.6 26 0.10
2008 13.3 35 0.38
2009 54.6 19 2.87
2010 11.5 26 0.44
2011 15.4 7 2.20
2012 93.7 8 11.71
2013 2.8 13 0.22
2014 1.7 17 0.10
During the primary survey3 and in a meeting with the head of the Norwegian Oil and Gas
Association’s leak project (see ref 1, section 6.3.9.1), it emerged that human error was
the reason for a substantial proportion of these incidents. Good training and detailed
inspections are regarded as the best measures for reducing the number of incidents and
the size of emissions. So small were emissions from large leaks in 2013-14 that a further
decline from these years would yield only marginal reductions in total methane and
nmVOC emissions. The goal must be to continue paying great attention to this work and
thereby succeed in maintaining the low level of emissions from 2013-14.
Emission quantities for smaller sources (fugitive emissions and small leaks) are very
uncertain. Some technical measures which could reduce them are described in sub-report
3A (ref 3). It emerged from the survey that control valves have been (and remain) a
significant contributor to registered leak emissions. They are therefore also likely to make
a significant contribution to fugitive emissions and small leaks. Paying particular attention
to these potential points in emission monitoring, and to training operations personnel, is
therefore recommended.
With one of the new facilities now under construction, the supplier has leak-tested a
selection of valves using helium in accordance with ISO standard 15848, class B. These
tests covered valves with large dimensions, for high-pressure duty and so forth, which
are considered to have highest leak potential. The supplier was subsequently able to
guarantee that leaks were below a specific level on delivery to the construction site.
The Canadian Association of Petroleum Producers (CAPP) has devoted substantial efforts
both to developing improved quantification methods and to reducing leak emissions. Its
2014 Update of Fugitive Equipment Leak Emission Factor report (ref 5) states:
Fugitive emissions from equipment leaks are unintentional losses and may arise due to normal
wear and tear, improper or incomplete assembly of components, inadequate material specification, manufacturing defects, damage during installation or use, corrosion, fouling and
3 The meetings with the operators of 15 facilities.
Cold venting and fugitive emissions from Norwegian oil and gas activities
Sub-report 3B – Abatement opportunities and reduction potentials
22
environmental effects (eg, vibrations and thermal cycling). The potential for such emissions depends on a variety of factors including the type, style and quality of components, type of service (gas/vapour, light liquid or heavy liquid), age of component, frequency of use, maintenance history, process demands, whether the process fluid is highly toxic or malodorous
and operating practices.
This indicates that external conditions can be at least as significant for emissions as the
component’s properties when it leaves the factory.
A number of conditions could accordingly affect leak frequency and emission quantities.
Emission reductions should therefore be attainable by devoting great attention to the
conditions mentioned here, and leak testing by the supplier could be one of several
factors able to help reduce fugitive emissions and small leaks through valve stems and
flanges. Because such escapes are hard to measure, documenting the effect of individual
measures is difficult.
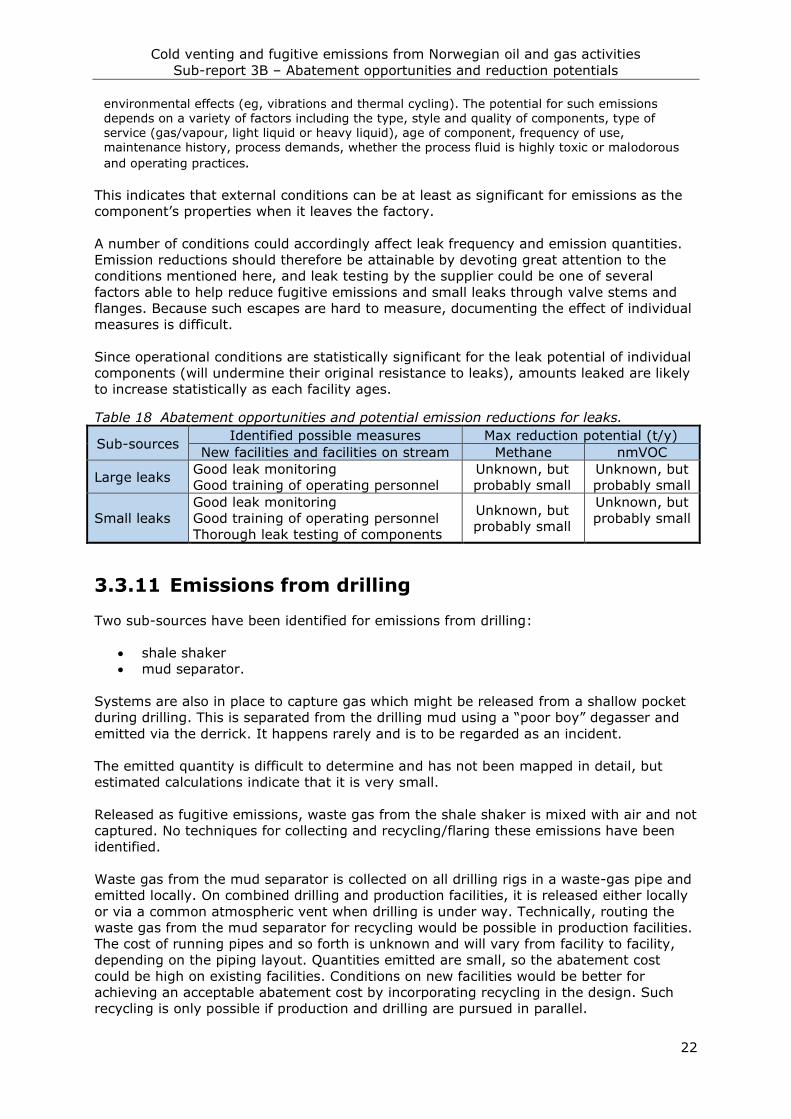
Since operational conditions are statistically significant for the leak potential of individual
components (will undermine their original resistance to leaks), amounts leaked are likely
to increase statistically as each facility ages.
Table 18 Abatement opportunities and potential emission reductions for leaks.
Sub-sources Identified possible measures Max reduction potential (t/y)
New facilities and facilities on stream Methane nmVOC
Large leaks Good leak monitoring
Good training of operating personnel
Unknown, but
probably small
Unknown, but
probably small
Small leaks
Good leak monitoring
Good training of operating personnel
Thorough leak testing of components
Unknown, but
probably small
Unknown, but
probably small
3.3.11 Emissions from drilling
Two sub-sources have been identified for emissions from drilling:
• shale shaker
• mud separator.
Systems are also in place to capture gas which might be released from a shallow pocket
during drilling. This is separated from the drilling mud using a “poor boy” degasser and
emitted via the derrick. It happens rarely and is to be regarded as an incident.
The emitted quantity is difficult to determine and has not been mapped in detail, but
estimated calculations indicate that it is very small.
Released as fugitive emissions, waste gas from the shale shaker is mixed with air and not
captured. No techniques for collecting and recycling/flaring these emissions have been
identified.
Waste gas from the mud separator is collected on all drilling rigs in a waste-gas pipe and
emitted locally. On combined drilling and production facilities, it is released either locally
or via a common atmospheric vent when drilling is under way. Technically, routing the
waste gas from the mud separator for recycling would be possible in production facilities.
The cost of running pipes and so forth is unknown and will vary from facility to facility,
depending on the piping layout. Quantities emitted are small, so the abatement cost
could be high on existing facilities. Conditions on new facilities would be better for
achieving an acceptable abatement cost by incorporating recycling in the design. Such
recycling is only possible if production and drilling are pursued in parallel.

Cold venting and fugitive emissions from Norwegian oil and gas activities
Sub-report 3B – Abatement opportunities and reduction potentials
23
Mobile drilling units have no production and therefore lack opportunities to recycle the
gas. Nor do they have a normal flare. Burning waste gas from the mud separator on such
facilities is therefore possible if it can be led to the flare boom. Since waste gas rates are
very small, it is uncertain whether the gas is flammable.
Table 19 Abatement opportunities and potential emission reductions from drilling.
Sub-source Identified possible measures
Max reduction potential
(t/y)
New facilities Facilities on stream Methane nmVOC
Shale shaker No technique identified N/A N/A
Mud separator4 1. Recycling
2. Flaring
1. Recycling
2. Flaring
Unknown,
but small
Unknown,
but small
3.3.12 MEG regeneration
Three sub-sources for emissions have been identified.
Table 20 Facilities with emissions from MEG regeneration with emission quantities
Sub-source Facilities with
emissions
Emissions CH4
(t/y)
Emissions nmVOC
(t/y)
Degassing tank 0 0 0
Regenerator (boiler)5 3 26 71
Stripping gas 1 Included in emissions from regenerator
Using HC stripping gas contributes to emissions from the regenerator.
3.3.12.1 Emissions from MEG degassing tank
None of the facilities on stream have emissions from an MEG degassing tank. On new
facilities, recycling or flaring the waste gas will be low-cost measures.
3.3.12.2 Emissions from regenerator (boiler)
Three of the existing facilities have emissions from the MEG regenerator (from the
downstream scrubber). Routing waste gas from this to recycling or flaring is technically
feasible. Abatement costs for these facilities will depend on facility-specific conditions and
must be calculated by the respective operators.
The abatement cost on new facilities will be determined by the difference in cost between
recycling/flaring and emission. It will be significantly lower than for facilities on stream.
3.3.12.3 Emissions of stripping gas
Stripping gas is emitted from one NCS facility on stream. The quantity involved is not
known (included in regenerator emissions). Technically, used blanket gas will be
captured with boil-off from the regenerator. This means that both recycling and flaring
are feasible measures. Nitrogen can moreover be used as stripping gas in place of fuel
gas. This requires high-purity nitrogen.6
4 Measures only possible on facilities with drilling and production in parallel. 5 Excluding the contribution from stripping gas. 6 Oxygen contamination in the nitrogen gas can oxidise and break down the MEG solution.
Cold venting and fugitive emissions from Norwegian oil and gas activities
Sub-report 3B – Abatement opportunities and reduction potentials
24
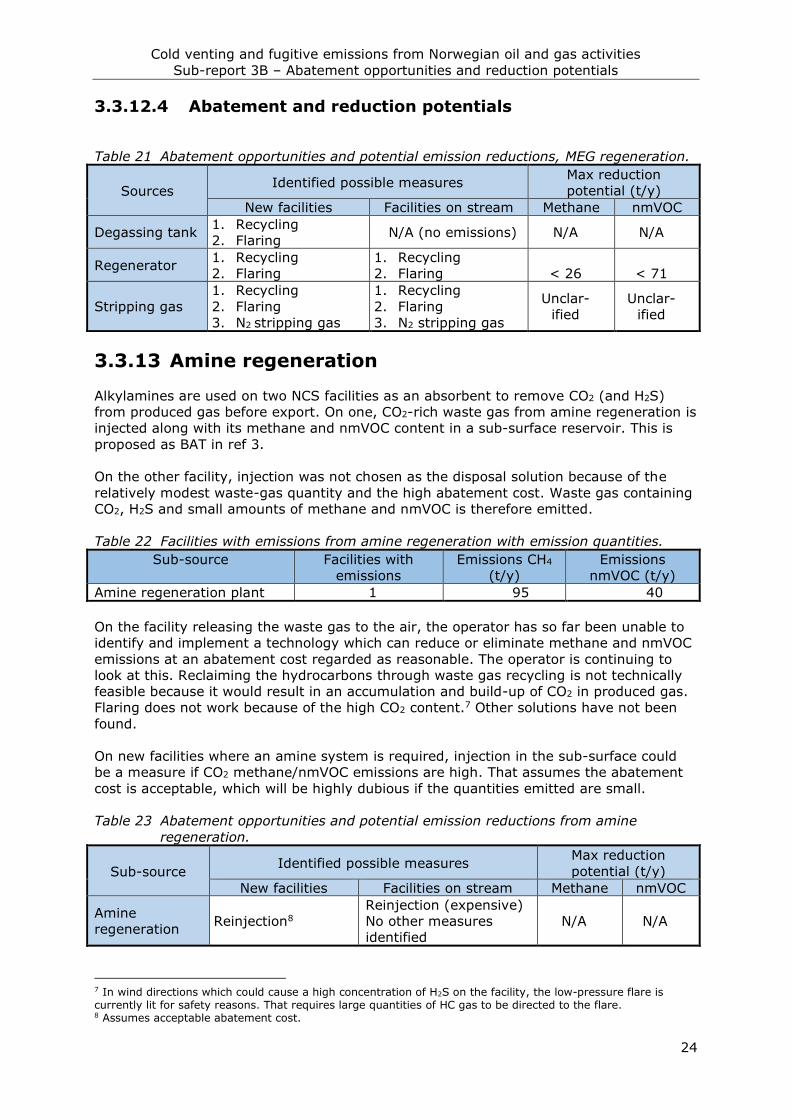
3.3.12.4 Abatement and reduction potentials
Table 21 Abatement opportunities and potential emission reductions, MEG regeneration.
Sources Identified possible measures
Max reduction
potential (t/y)
New facilities Facilities on stream Methane nmVOC
Degassing tank 1. Recycling
2. Flaring N/A (no emissions) N/A N/A
Regenerator 1. Recycling
2. Flaring
1. Recycling
2. Flaring
< 26
< 71
Stripping gas
1. Recycling
2. Flaring
3. N2 stripping gas
1. Recycling
2. Flaring
3. N2 stripping gas
Unclar-
ified
Unclar-
ified
3.3.13 Amine regeneration
Alkylamines are used on two NCS facilities as an absorbent to remove CO2 (and H2S)
from produced gas before export. On one, CO2-rich waste gas from amine regeneration is
injected along with its methane and nmVOC content in a sub-surface reservoir. This is
proposed as BAT in ref 3.
On the other facility, injection was not chosen as the disposal solution because of the
relatively modest waste-gas quantity and the high abatement cost. Waste gas containing
CO2, H2S and small amounts of methane and nmVOC is therefore emitted.
Table 22 Facilities with emissions from amine regeneration with emission quantities.
Sub-source Facilities with
emissions
Emissions CH4
(t/y)
Emissions
nmVOC (t/y)
Amine regeneration plant 1 95 40
On the facility releasing the waste gas to the air, the operator has so far been unable to
identify and implement a technology which can reduce or eliminate methane and nmVOC
emissions at an abatement cost regarded as reasonable. The operator is continuing to
look at this. Reclaiming the hydrocarbons through waste gas recycling is not technically
feasible because it would result in an accumulation and build-up of CO2 in produced gas.
Flaring does not work because of the high CO2 content.7 Other solutions have not been
found.
On new facilities where an amine system is required, injection in the sub-surface could
be a measure if CO2 methane/nmVOC emissions are high. That assumes the abatement
cost is acceptable, which will be highly dubious if the quantities emitted are small.
Table 23 Abatement opportunities and potential emission reductions from amine
regeneration.
Sub-source Identified possible measures
Max reduction
potential (t/y)
New facilities Facilities on stream Methane nmVOC
Amine
regeneration
Reinjection8
Reinjection (expensive)
No other measures
identified
N/A N/A
7 In wind directions which could cause a high concentration of H2S on the facility, the low-pressure flare is currently lit for safety reasons. That requires large quantities of HC gas to be directed to the flare. 8 Assumes acceptable abatement cost.

Cold venting and fugitive emissions from Norwegian oil and gas activities
Sub-report 3B – Abatement opportunities and reduction potentials
25
3.3.14 Gas analysers
Table 24 Facilities with emission from gas analysers.
Sub-source Facilities with emissions Emissions CH4
(t/y)
Emissions
nmVOC (t/y)
Gas analysers Not included in secondary review
Based on primary survey 71 54
About half the NCS facilities with gas analysers recycle or flare the waste gas from the
analysis instruments and thereby eliminate emissions from this source. On new facilities,
the extra costs of such a solution are expected to be marginal or zero. Costs for existing
facilities will relate primarily to rerouting pipe systems.
Emissions from gas analysers are dominated by facilities where analysis gas is routed
from a slipstream which is constantly emptied to an atmospheric vent. Such a solution
should be avoided for new facilities where used gas cannot be recycled. If an emission
solution is chosen, the analysis gas should be drawn directly from the main pipe or a
slipstream which is closed between each withdrawal. That would sharply reduce waste
gas volumes. On existing facilities, this would mean modifications which could be
expensive for some.
Table 25 Abatement opportunities and potential emission reduction, gas analysers.
Sub-source Identified possible measures
Max reduction
potential (t/y)
New facilities Facilities on stream Methane nmVOC
Gas analysers
1. Recycling 1. Recycling < 71 < 54
2. Take analysis gas
direct from main pipe
2. Take analysis gas
direct from main pipe < 71 < 54
3.3.15 Crude oil storage tanks – FPSO
Table 26 Facilities with emissions from crude oil storage tanks on FPSOs.
Sub-source Facilities with
emissions9
Emissions CH4
(t/y)
Emissions
nmVOC (t/y)
Storage-tank inspection 7 71 55
Pursuant the regulations on supervision and certificates for Norwegian ships and mobile
offshore units, storage tanks on floating production, storage and offloading (FPSO) units
must be inspected every five years.10 This requires them to be emptied of oil and HC gas.
The tanks are filled with fuel (blanket) gas after emptying, and prepared through a two-
stage gas-freeing process. In stage 1, the fuel gas is displaced with inert (normally
exhaust) gas. Stage 2 involves replacing this with air. The displaced gas is emitted.
During stage 1, the waste gas will comprise a mix of fuel and inert gases where the share
of the latter steadily rises. It cannot be recycled if exhaust gases are present. And, if
flared, the inert gas content will eventually cause the flare to extinguish.
No technologies or methods for eliminating or radically reducing these emissions have
been identified by this project. The lowest emissions are achieved by sending waste gas
from the stage 1 gas-freeing process to flaring until the flare extinguishes.
9 Facilities on stream in 2014. A number of such facilities are under construction. 10 https://lovdata.no/dokument/SF/forskrift/2014-12-22-1893#KAPITTEL_3

Cold venting and fugitive emissions from Norwegian oil and gas activities
Sub-report 3B – Abatement opportunities and reduction potentials
26
All FPSO have low-pressure (VRU) compressors. A possible measure is to modify the
waste-gas piping system by installing a vent system which allows the gas to be routed to
the flare when gas-freeing of the tanks begins. Flaring conditions will determine how
large a proportion of the emissions can be flared. No data are available for estimating
this. The environmental gain is therefore uncertain, and a precondition for the measure
working is that it does not involve HC gas emissions through the flare from other sources
(HC gas intentionally sent to flaring). Some of the FPSOs may already have installed
direct coupling to the flare. This method requires that FPSOs with a closed flare must
light it. That might cause ignition problems which can be mitigated by adding fuel gas,
which would increase CO2 emissions.
Table 27 Abatement opportunities and potential emission reductions from crude oil
storage on FPSOs.
Sub-source Identified possible measures
Max reduction
potential (t/y)
New facilities Facilities on stream Methane nmVOC
Inspection Connect waste gas to
flare
Connect waste gas to
flare Small Small
3.3.16 Emissions from minor sources
A number of minor sources add to methane and nmVOC emissions, but the quantities are
so small that they make a negligible contribution to the overall figure. These sources are
presented in table 28.
Table 28 Overview of small sources with estimated emission contribution (referenced to
2013).
Process/sub-process Emissions
methane (t/y)
Emissions
nmVOC (t/y)
Screw compressors < 0.1 < 0.1
Purging and maintaining instruments and
instrument manifolds <0.1 < 0.1
Bleeding gas from production-riser annulus Unclarified, but small
Gas turbines (at startup and shutdown) 0.5 0.5
Pig traps 3.6 2.3
Withdrawal of corrosion coupons <0.1 < 0.1
Flexible risers 1.8 1.9
Double block and bleed (DBB) valves 1.2 1.2
Storage tanks for diesel and other consumable oils 0 3.5
Although these sources have little effect on total direct methane and nmVOC emissions,
it is technically feasible to reduce or eliminate the amounts released from some of them.
On new facilities, this can be done without significant extra cost. The cost of modifying
existing facilities is uncertain, with abatement costs expected to be high.
Screw compressors: In principal, HC gas dissolved in the seal oil can be recycled.
Assessing this for new facilities is recommended. Modifying existing facilities is unlikely to
yield an acceptable cost/benefit.
Purging and maintaining instruments and instrument manifolds: This is subject to good
control. Emissions can theoretically be reduced by connecting more instruments to flaring
or recycling, but that would increase complexity on the facilities.

Cold venting and fugitive emissions from Norwegian oil and gas activities
Sub-report 3B – Abatement opportunities and reduction potentials
27
Bleeding gas from the production-riser annulus: Recycling waste gas to the process is
possible where the latter is in operation. Considering this when building new facilities is
recommended.
Gas turbines (purging before start-up and depressurisation): Recycling waste gas to the
process is possible where the latter is in operation. Considering this when building new
facilities is recommended.
Pig traps: Routing waste gas to flaring or recycling is possible, and done on many
facilities. Assessing this for new facilities is recommended.
Withdrawal of corrosion coupons: Emission-free technology is now available and utilised
on existing facilities. Implementing these when building new facilities is recommended.
Flexible risers: A number of facilities recycle waste gas from the annulus to the process.
Implementing this when building new facilities is recommended.
DBB valves: Waste gas from big DBB valves is routed to recycling or flaring. Recycling
from smaller valves could also achieve some emission reduction. How far down in valve
size this should be taken will be a trade-off between reduced emissions and costs.
Implementing this on producing facilities will cost substantially more than on newbuilds.
Basically, assessing the above-mentioned measures is recommended in connection with
the construction of new facilities. Where existing facilities are concerned, giving priority
to sources with potentially higher emission than these small sources is recommended.
3.4 Emissions from sources with no abatement
opportunities
Where some sources are concerned, no emission-reducing measures have been found or
their abatement costs are expected to be unreasonably high.
Table 29 Emission sources without abatement opportunities (approx emissions/year).
Process/sub-process Emissions
methane (t/y)
Emissions
nmVOC (t/y)
Emissions from gas-freeing when depressurising
and tank emptying
- depressurisation of process equipment 18 16
- crude oil tanks on FPSOs – tank inspection 71 55
- crude oil tanks on FPSOs – abnormal operation Note 1
Emissions from drilling operations
- emissions from mud separator on mobile units < 57 < 57
- emissions from shale shaker Unclarified,
small
Unclarified,
small
Emissions from amine regeneration 95 40
Note 1: no registered emissions so far.
Uncertainty in the estimated emission quantities from depressurisation and tank
emptying is relatively moderate (+/- 20 per cent or better). While uncertainty over
emissions from drilling is high, the calculated figures are based on conservative
assumptions and are expected to be higher than actual quantities. Uncertainty in the
emission figures for amine regeneration is expected to be high.

Cold venting and fugitive emissions from Norwegian oil and gas activities
Sub-report 3B – Abatement opportunities and reduction potentials
28
3.4.1 Emissions from gas-freeing of process equipment and tanks
The only possible measure seen for reducing emissions related to gas-freeing from
depressurising process equipment (see section 3.3.7) and from inspections/abnormal
operating conditions for crude oil tanks on FPSOs (see section 3.3.15) is to separate the
HC and inert gases before they are emitted. This will call for advanced technology
involving large and complex process systems. Separated HC gas would have to be
condensed for storage. The costs and associated abatement costs would be so high that
this measure should not be given further consideration.
3.4.2 Emissions from drilling operations
See section 3.3.11.
When drilling from mobile units and predrilling from fixed facilities, waste gas from the
mud separator cannot be recycled or flared because no produced gas or flare is available.
Waste gas from the shale shaker is mixed with large quantities of air. Separating these
gases (and condensing the HC gas on mobile drilling units) will be technically challenging
and very expensive. The share of emissions deriving from the shale shaker is also small
(the HC content of the air in the shaker area is monitored for health reasons).
3.4.3 Emissions from amine regeneration
See section 3.3.13.
One NCS facility has emissions from this source. Injecting the waste gas in the sub-
surface is technically feasible and could eliminate the emissions. This technology requires
a sub-surface formation suited for secure CO2 storage – in other words, with a
sufficiently low risk of leakage to the air. Furthermore, a separate injection well would
have to be drilled and compressors installed to compress the gas. Even if geological
conditions permit, the abatement cost would be substantial. No other technology or
technique has been identified for mitigating emissions from the amine plant on the
relevant facility.
3.4.4 Emission sources with limited reduction potential
With some sources, abatement opportunities exist but possible emission reductions are
very small. That applies particularly to leaks (see section 3.3.10) and flare ignition (see
section 3.3.9.1).
Emission quantities from leaks can be substantial, but time and effort are needed to
produce credible estimates. It would also be very difficult (virtually impossible) to
determine the effect of measures related to this emission source.
Emissions associated with flare ignition are not estimated to be particularly large, but an
overview cannot be obtained without improved measurement routines. Better and more
reliable ignition methods must be developed to reduce emissions from this source.

Cold venting and fugitive emissions from Norwegian oil and gas activities
Sub-report 3B – Abatement opportunities and reduction potentials
29
3.5 Realistic emission reductions 3.5.1 New facilities
Talking about emission reductions is not very relevant for new facilities. A review has
therefore been conducted of sources which could be eliminated on one new production
facility through an emission-reducing design, and a realistic goal for sources where
elimination is difficult or impossible. See table 30.
Table 30 Possible level of emissions for a single new production facility.
Process/sub-process Measures Emission goal (t/y)
methane nmVOC
TEG degassing tank Recycling 0 0
TEG regenerator Recycling 0 0
TEG stripping gas N2 stripping gas or recycling 0 0
Produced-water degassing tank Recycling 0 0
Produced-water flotation
tank/CFU Recycling/N2 flotation gas 0 0
Produced-water discharge
caisson
PW injection, one barg in
degassing tank11 4 1
Oil seals in degassing tank Dry compressor seals only 0 0
Oil seals in oil tank Dry compressor seals only 0 0
Dry seals as primary barrier Recycling 0 0
Dry HC seals as secondary
barrier Pure N2 as barrier gas 0 0
Dry seals – leaks from primary
to secondary barrier Internal labyrinth 0 0
Reciprocating compressors –
separator chamber Recycling 0 0
Depressurising process
equipment No measures identified12 1.2 0.8
HC gas as purge/blanket Recycling/N2 as purge/blanket
gas 0 0
Extinguished flare and flare
ignition More efficient seal systems Unclarified13
Non-flammable flare gas Not normally relevant14 0 0
Inert-gas-purged open flare Not normally relevant 15 0 0
Large leaks Incident emissions only16 0 0
Small leaks Better leak detection Unclarified17
Drilling Assuming four wells per year18 1.2 0.8
MEG degassing tank Recycling 0 0
11 The emission figures are based on a total produced-water (PW) volume of five million m3/y, PW injection
with 95 per cent regularity, and one barg operating pressure in the PW degassing tank. A smaller PW quantity, lower irregularity in PW injection and less overpressure (barg) in the degassing tank would reduce emissions proportionately. 12 For a large process plant of 2 000 m3. The emissions figures are for a turnaround year (every three years). 13 Depending on ignition frequency. Unlikely to be more than a couple of t/y (CH4 + nmVOC). 14 Only relevant for fields with a high CO2 and H2S content. 15 Only relevant for fields with special conditions. 16 Zero large leaks should be a target. 17 Unclarified at present. Max 50 tonnes of HC gas or less should be a target. 18 Assumes HC-bearing layer of 100 metres.
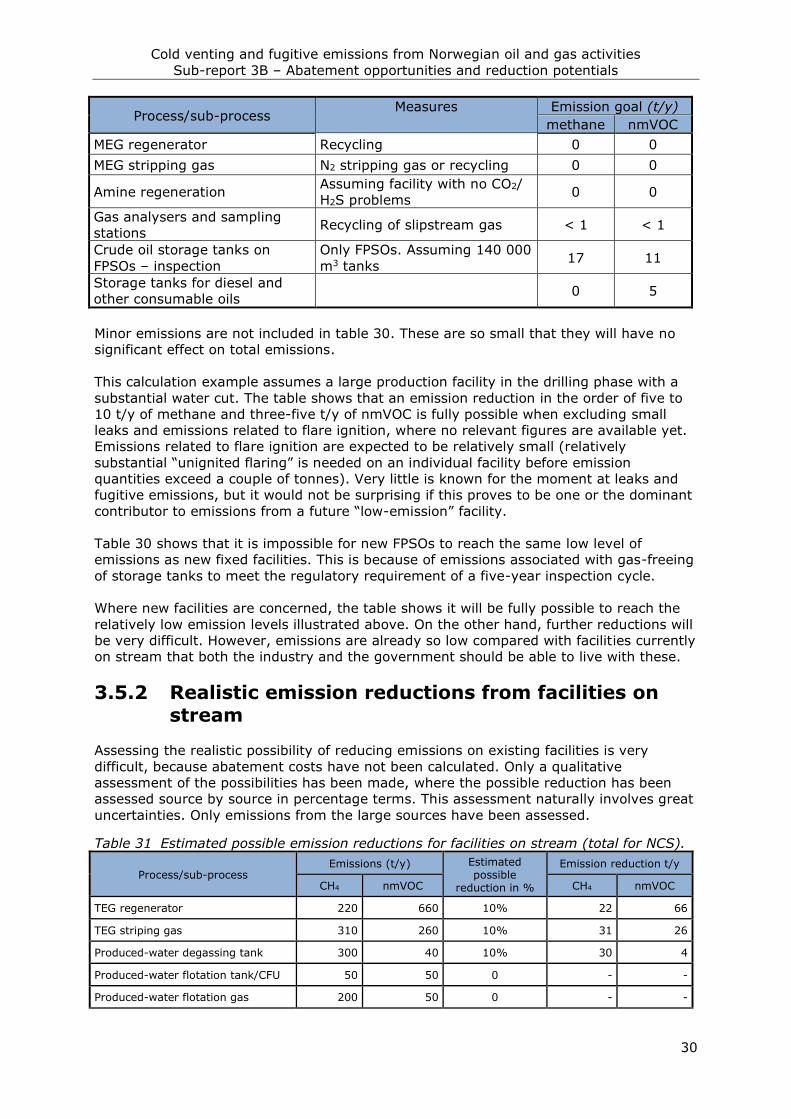
Cold venting and fugitive emissions from Norwegian oil and gas activities
Sub-report 3B – Abatement opportunities and reduction potentials
30
Process/sub-process Measures Emission goal (t/y)
methane nmVOC
MEG regenerator Recycling 0 0
MEG stripping gas N2 stripping gas or recycling 0 0
Amine regeneration Assuming facility with no CO2/
H2S problems 0 0
Gas analysers and sampling
stations Recycling of slipstream gas < 1 < 1
Crude oil storage tanks on
FPSOs – inspection
Only FPSOs. Assuming 140 000
m3 tanks 17 11
Storage tanks for diesel and
other consumable oils 0 5
Minor emissions are not included in table 30. These are so small that they will have no
significant effect on total emissions.
This calculation example assumes a large production facility in the drilling phase with a
substantial water cut. The table shows that an emission reduction in the order of five to
10 t/y of methane and three-five t/y of nmVOC is fully possible when excluding small
leaks and emissions related to flare ignition, where no relevant figures are available yet.
Emissions related to flare ignition are expected to be relatively small (relatively
substantial “unignited flaring” is needed on an individual facility before emission
quantities exceed a couple of tonnes). Very little is known for the moment at leaks and
fugitive emissions, but it would not be surprising if this proves to be one or the dominant
contributor to emissions from a future “low-emission” facility.
Table 30 shows that it is impossible for new FPSOs to reach the same low level of
emissions as new fixed facilities. This is because of emissions associated with gas-freeing
of storage tanks to meet the regulatory requirement of a five-year inspection cycle.
Where new facilities are concerned, the table shows it will be fully possible to reach the
relatively low emission levels illustrated above. On the other hand, further reductions will
be very difficult. However, emissions are already so low compared with facilities currently
on stream that both the industry and the government should be able to live with these.
3.5.2 Realistic emission reductions from facilities on stream
Assessing the realistic possibility of reducing emissions on existing facilities is very
difficult, because abatement costs have not been calculated. Only a qualitative
assessment of the possibilities has been made, where the possible reduction has been
assessed source by source in percentage terms. This assessment naturally involves great
uncertainties. Only emissions from the large sources have been assessed.
Table 31 Estimated possible emission reductions for facilities on stream (total for NCS).
Process/sub-process Emissions (t/y) Estimated
possible reduction in %
Emission reduction t/y
CH4 nmVOC CH4 nmVOC
TEG regenerator 220 660 10% 22 66
TEG striping gas 310 260 10% 31 26
Produced-water degassing tank 300 40 10% 30 4
Produced-water flotation tank/CFU 50 50 0 - -
Produced-water flotation gas 200 50 0 - -
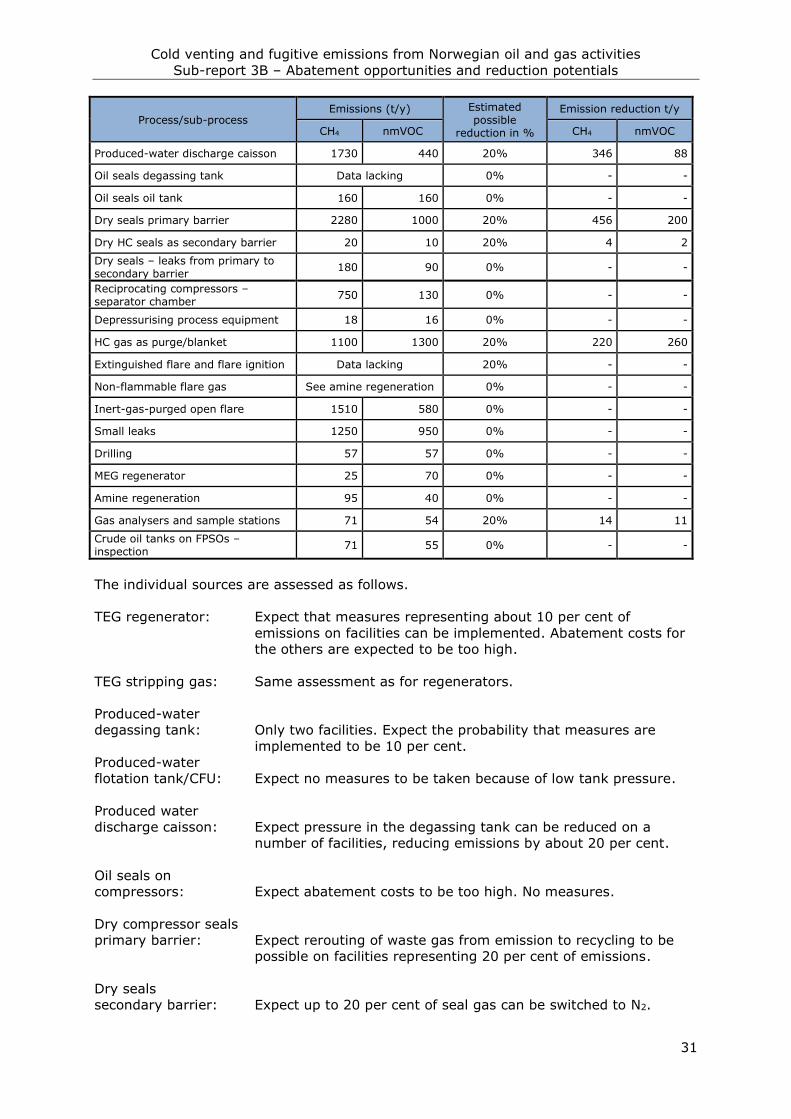
Cold venting and fugitive emissions from Norwegian oil and gas activities
Sub-report 3B – Abatement opportunities and reduction potentials
31
Process/sub-process Emissions (t/y) Estimated
possible reduction in %
Emission reduction t/y
CH4 nmVOC CH4 nmVOC
Produced-water discharge caisson 1730 440 20% 346 88
Oil seals degassing tank Data lacking 0% - -
Oil seals oil tank 160 160 0% - -
Dry seals primary barrier 2280 1000 20% 456 200
Dry HC seals as secondary barrier 20 10 20% 4 2
Dry seals – leaks from primary to secondary barrier
180 90 0% - -
Reciprocating compressors – separator chamber
750 130 0% - -
Depressurising process equipment 18 16 0% - -
HC gas as purge/blanket 1100 1300 20% 220 260
Extinguished flare and flare ignition Data lacking 20% - -
Non-flammable flare gas See amine regeneration 0% - -
Inert-gas-purged open flare 1510 580 0% - -
Small leaks 1250 950 0% - -
Drilling 57 57 0% - -
MEG regenerator 25 70 0% - -
Amine regeneration 95 40 0% - -
Gas analysers and sample stations 71 54 20% 14 11
Crude oil tanks on FPSOs – inspection
71 55 0% - -
The individual sources are assessed as follows.
TEG regenerator: Expect that measures representing about 10 per cent of
emissions on facilities can be implemented. Abatement costs for
the others are expected to be too high.
TEG stripping gas: Same assessment as for regenerators.
Produced-water
degassing tank: Only two facilities. Expect the probability that measures are
implemented to be 10 per cent.
Produced-water
flotation tank/CFU: Expect no measures to be taken because of low tank pressure.
Produced water
discharge caisson: Expect pressure in the degassing tank can be reduced on a
number of facilities, reducing emissions by about 20 per cent.
Oil seals on
compressors: Expect abatement costs to be too high. No measures.
Dry compressor seals
primary barrier: Expect rerouting of waste gas from emission to recycling to be
possible on facilities representing 20 per cent of emissions.
Dry seals
secondary barrier: Expect up to 20 per cent of seal gas can be switched to N2.

Cold venting and fugitive emissions from Norwegian oil and gas activities
Sub-report 3B – Abatement opportunities and reduction potentials
32
Dry seals, leak of
primary seal gas to
secondary vent: Expect changing seals to be too expensive.
Reciprocating
compressors: Expect costs to be too high.
Depressurising
process equipment: No measures identified.
HC gas as purge/
blanket: Expect measures could reduce emissions by 20 per cent.
Extinguished flare: Expect measures could reduce emissions by 20 per cent.
Emission figures currently lacking.
Non-flammable
flare gas: No measures identified.
Inert-gas-purged
open flares: No measures identified.
Leaks: Measures which only offer marginal reductions identified. Cannot
be checked.
Drilling: Measures only relevant for combined drilling and production
facilities. Not expected to have a significant effect.
MEG regeneration: Expected to be unlikely that measures will have an acceptable
abatement cost.
Amine regeneration: No measures identified.
Gas analysers and
sampling stations: Expect a couple of facilities to reroute slipstreams to recycling.
Crude oil tanks on
FPSOs: No measures identified.
Storage tanks for
diesel and other
consumable oil: Doubtful whether the measures have an acceptable abatement
cost.
In summary, this corresponds to an annual emission reduction of about 10 per cent
(roughly 1 100 tonnes for methane and 500-600 tonnes of nmVOC). Although these
assessments rest on weak foundations, it is considered very unlikely that emission
reductions much over this are feasible at an acceptable abatement cost. However,
uncertainty is great.
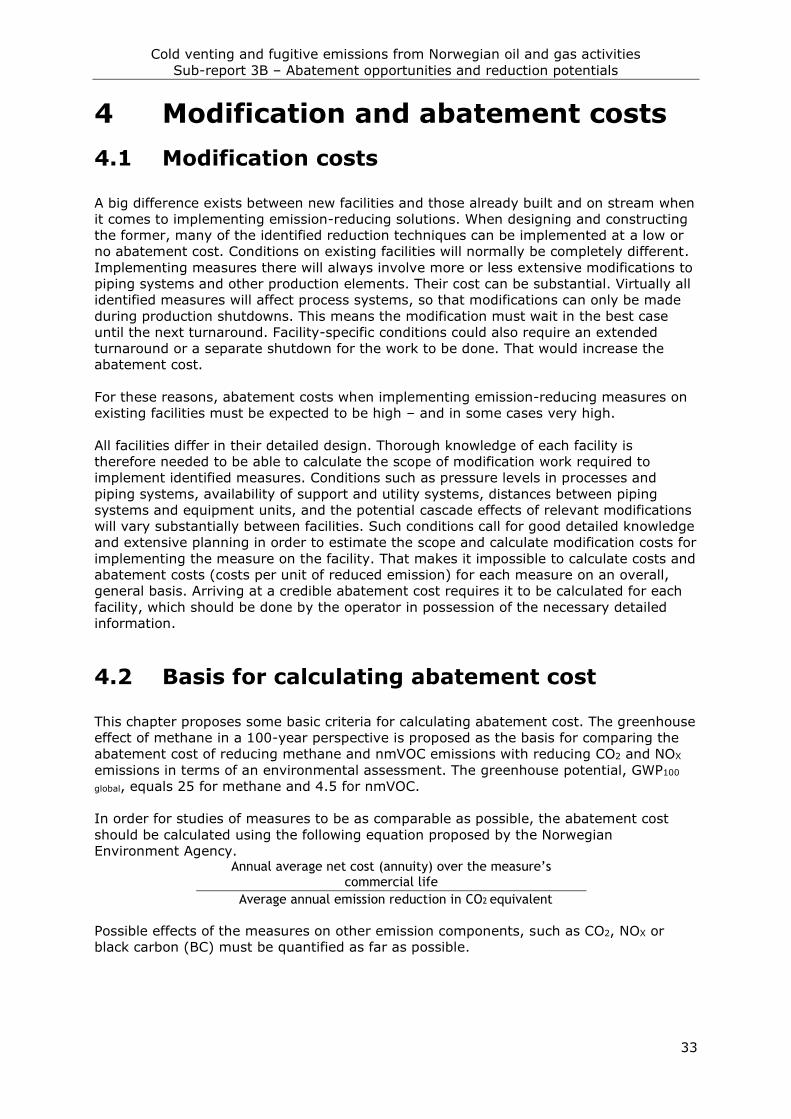
Cold venting and fugitive emissions from Norwegian oil and gas activities
Sub-report 3B – Abatement opportunities and reduction potentials
33
4 Modification and abatement costs
4.1 Modification costs
A big difference exists between new facilities and those already built and on stream when
it comes to implementing emission-reducing solutions. When designing and constructing
the former, many of the identified reduction techniques can be implemented at a low or
no abatement cost. Conditions on existing facilities will normally be completely different.
Implementing measures there will always involve more or less extensive modifications to
piping systems and other production elements. Their cost can be substantial. Virtually all
identified measures will affect process systems, so that modifications can only be made
during production shutdowns. This means the modification must wait in the best case
until the next turnaround. Facility-specific conditions could also require an extended
turnaround or a separate shutdown for the work to be done. That would increase the
abatement cost.
For these reasons, abatement costs when implementing emission-reducing measures on
existing facilities must be expected to be high – and in some cases very high.
All facilities differ in their detailed design. Thorough knowledge of each facility is
therefore needed to be able to calculate the scope of modification work required to
implement identified measures. Conditions such as pressure levels in processes and
piping systems, availability of support and utility systems, distances between piping
systems and equipment units, and the potential cascade effects of relevant modifications
will vary substantially between facilities. Such conditions call for good detailed knowledge
and extensive planning in order to estimate the scope and calculate modification costs for
implementing the measure on the facility. That makes it impossible to calculate costs and
abatement costs (costs per unit of reduced emission) for each measure on an overall,
general basis. Arriving at a credible abatement cost requires it to be calculated for each
facility, which should be done by the operator in possession of the necessary detailed
information.
4.2 Basis for calculating abatement cost
This chapter proposes some basic criteria for calculating abatement cost. The greenhouse
effect of methane in a 100-year perspective is proposed as the basis for comparing the
abatement cost of reducing methane and nmVOC emissions with reducing CO2 and NOX
emissions in terms of an environmental assessment. The greenhouse potential, GWP100
global, equals 25 for methane and 4.5 for nmVOC.
In order for studies of measures to be as comparable as possible, the abatement cost
should be calculated using the following equation proposed by the Norwegian
Environment Agency. Annual average net cost (annuity) over the measure’s
commercial life
Average annual emission reduction in CO2 equivalent
Possible effects of the measures on other emission components, such as CO2, NOX or
black carbon (BC) must be quantified as far as possible.

Cold venting and fugitive emissions from Norwegian oil and gas activities
Sub-report 3B – Abatement opportunities and reduction potentials
34
5 References
Ref 1 Surveying installations to identify potential emission sources. Sub-report 1, Cold
venting and fugitive emissions from Norwegian oil and gas activities, Add
Novatech, Norwegian Environment Agency, 2015
Ref 2 Emission estimates and quantification methods. Sub-report 2, Cold venting and
fugitive emissions from Norwegian oil and gas activities, Add Novatech,
Norwegian Environment Agency, 2015
Ref 3 BAT, Add Novatech, Norwegian Environment Agency, 2015
Ref 4 Annual report 5, Intergovernmental panel on climate change, 2013: p 714 (with
climate-carbon feedbacks)
Ref 5 Update of Fugitive Equipment Leak Emission Factor, Canadian Association of
Petroleum Producers (CAPP), 2014


