Sub-Saharan African Cities: Five-City Network to Pioneer Climate Adaptation through Participatory Research and Local Action *Title: Using Climate Projections for Assessing Impacts at the City Scale *By: Mark Tadross & Peter Johnston (Climate System Analysis Group, University of Cape Town) *Report Type: Research Paper *Date: September 2012 *IDRC Project Number-Component Number: 105868-001 *IDRC Project Title: Sub-Saharan African Cities: A Five-City Network to Pioneer Climate Adaptation through Participatory Research and Local Action. *Country/Region: Namibia, South Africa, Mozambique, Tanzania, Mauritius *Full Name of Research Institution: ICLEI – Local Governments for Sustainability - Africa *Address of Research Institution: P.O. Box 5319, Tygervalley, 7536, Cape Town, South Africa *Name(s) of Researcher/Members of Research Team: *Contact Information of Researcher/Research Team members: [email protected]; +27 21 487 2312 *This report is presented as received from project recipient(s). It has not been subjected to peer review or other review processes. *This work is used with the permission of ICLEI – Local Governments for Sustainability - Africa *Copyright: 2012, ICLEI – Local Governments for Sustainability - Africa *Abstract: This project addresses knowledge, resource, capacity and networking gaps on the theme: 'Strengthening urban governments in planning adaptation.' The main objective of this project is to develop an adaptation framework for managing the increased risk to African local government and their communities due to climate change impact. The ultimate beneficiaries of this project will be African local governments and their communities. The guiding and well-tested ICLEI principle of locally designed and owned projects for the global common good, specifically in a developing world context, will be applied throughout project design, inception and delivery. Additionally, the research will test the theory that the most vulnerable living and working in different geographical, climatic and ecosystem zones will be impacted differently and as such, will require a different set of actions to be taken. Potential commonalities will be sought towards regional participatory learning and wider applicability. The five urban centres chosen for this study, based on selection criteria, include: Cape Town, South Africa, Dar es Salaam, Tanzania; Maputo, Mozambique; Windhoek, Namibia; and Port St. Louis, Mauritius. Through a participatory process, this project will carry out a desk-top study, long-term, multi-discipline, multi-sectoral stakeholder platforms in five Southern African cities comprising of academics, communities and the local government in order to facilitate knowledge-sharing, promote proactive climate adaptation and resource opportunities available for African cities, develop five tailor-made Adaptation Frameworks and explore regional applicability. A network of stakeholders within each urban centre will be established, feeding into a larger regional network of local authorities and partners in Sub-Saharan Africa, and globally through existing ICLEI global (e.g. the ICLEI Cities for Climate Protection programme), ICLEI Africa and UCLG-A members and networks, ensuring global best practice, roll-out, and long-term sustainability. Key words: Adaptation, Africa, Climate Change, Local Governments, Participatory Action Research, Policy.
Transcript
Sub-Saharan African Cities: Five-City Network to Pioneer Climate Adaptation through Participatory Research and Local
Action
*Title: Using Climate Projections for Assessing Impacts at the City Scale *By: Mark Tadross & Peter Johnston (Climate System Analysis Group, University of Cape Town) *Report Type: Research Paper *Date: September 2012 *IDRC Project Number-Component Number: 105868-001 *IDRC Project Title: Sub-Saharan African Cities: A Five-City Network to Pioneer Climate Adaptation through Participatory Research and Local Action. *Country/Region: Namibia, South Africa, Mozambique, Tanzania, Mauritius *Full Name of Research Institution: ICLEI – Local Governments for Sustainability - Africa *Address of Research Institution: P.O. Box 5319, Tygervalley, 7536, Cape Town, South Africa *Name(s) of Researcher/Members of Research Team: *Contact Information of Researcher/Research Team members: [email protected]; +27 21 487 2312 *This report is presented as received from project recipient(s). It has not been subjected to peer review or other review processes. *This work is used with the permission of ICLEI – Local Governments for Sustainability - Africa *Copyright: 2012, ICLEI – Local Governments for Sustainability - Africa *Abstract: This project addresses knowledge, resource, capacity and networking gaps on the theme: 'Strengthening urban governments in planning adaptation.' The main objective of this project is to develop an adaptation framework for managing the increased risk to African local government and their communities due to climate change impact. The ultimate beneficiaries of this project will be African local governments and their communities. The guiding and well-tested ICLEI principle of locally designed and owned projects for the global common good, specifically in a developing world context, will be applied throughout project design, inception and delivery. Additionally, the research will test the theory that the most vulnerable living and working in different geographical, climatic and ecosystem zones will be impacted differently and as such, will require a different set of actions to be taken. Potential commonalities will be sought towards regional participatory learning and wider applicability. The five urban centres chosen for this study, based on selection criteria, include: Cape Town, South Africa, Dar es Salaam, Tanzania; Maputo, Mozambique; Windhoek, Namibia; and Port St. Louis, Mauritius. Through a participatory process, this project will carry out a desk-top study, long-term, multi-discipline, multi-sectoral stakeholder platforms in five Southern African cities comprising of academics, communities and the local government in order to facilitate knowledge-sharing, promote proactive climate adaptation and resource opportunities available for African cities, develop five tailor-made Adaptation Frameworks and explore regional applicability. A network of stakeholders within each urban centre will be established, feeding into a larger regional network of local authorities and partners in Sub-Saharan Africa, and globally through existing ICLEI global (e.g. the ICLEI Cities for Climate Protection programme), ICLEI Africa and UCLG-A members and networks, ensuring global best practice, roll-out, and long-term sustainability. Key words: Adaptation, Africa, Climate Change, Local Governments, Participatory Action Research, Policy.
Sub-Saharan African Cities: Five-City Network to Pioneer Climate Adaptation through Participatory Research and Local
Action
Using Climate Projections for Assessing Impacts at the City Scale Mark Tadross & Peter Johnston (Climate System Analysis Group, University of Cape Town)
Introduction
Local Governments for Sustainability recently launched a project entitled Sub-Saharan
African Cities: A Five-City Network to Pioneer Climate Adaptation through Participatory
Research and Local Action. One of the aims of this project was to establish a standardised
approach for the collection and analyses of climatic base-line data, which will assist in the
generation of future localised projections, which, in turn, will assist in planning and decision
making.
As Global Climate Model (GCM) climate projections, and their associated downscaled data,
are routinely used to infer impacts at a regional and sometimes local level, the question
arises as to whether downscaling is useful, in terms of additional insights it may provide
regarding the likely direction and magnitude of change, as well as the confidence in those
changes.
This paper looks at the results from applying a downscaling methodology, developed at the
University of Cape Town, to nine suitable GCMs1 (forced with the A2 emissions scenario)
and the observed rainfall and temperature data from the Cape Town station (only one
sample station in one city will be referenced here). The downscaling relates daily weather
systems to the observed rainfall and temperature at a particular location on each day. Taking
the simulated changes in daily weather systems from each GCM, the expected changes in
daily rainfall and temperature were then simulated for each location. The Priestly-Taylor
method was used to calculate reference evapotranspiration (ET0) based on simulated
temperatures, solar radiation and altitude.
Attributes of GCMs The resolving scale of GCMs has improved significantly in the last 10 years with many state-
of-the-art GCMs able to resolve at a scale of around 100km. However, most of the GCMs
used for seasonal forecasting are at a scale of the order of 200km, with the skill of the model
at this resolution typically low, due to the GCM’s simplified topography and representation of 1 The suitability of GCMs depends on the frequency of data and the type of variable
Sub-Saharan African Cities: Five-City Network to Pioneer Climate Adaptation through Participatory Research and Local
Action
regional processes. GCM skill is often higher when aggregated to large scales such 500km
to 1000km.
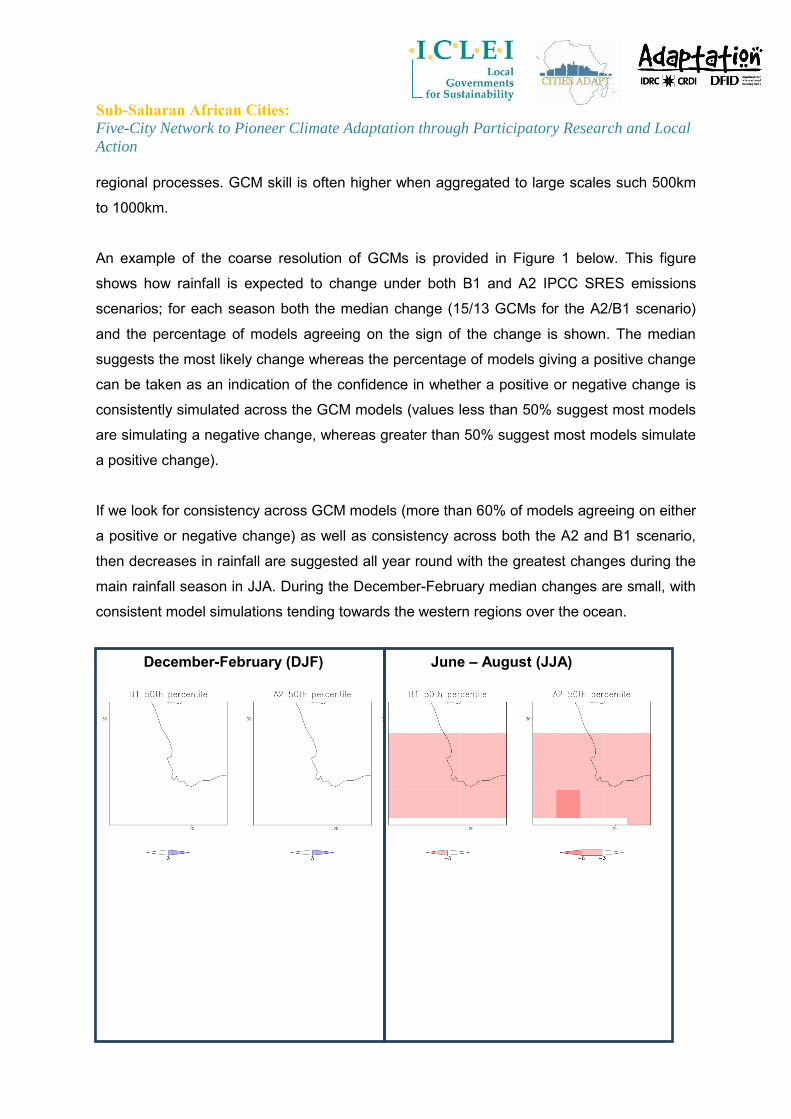
An example of the coarse resolution of GCMs is provided in Figure 1 below. This figure
shows how rainfall is expected to change under both B1 and A2 IPCC SRES emissions
scenarios; for each season both the median change (15/13 GCMs for the A2/B1 scenario)
and the percentage of models agreeing on the sign of the change is shown. The median
suggests the most likely change whereas the percentage of models giving a positive change
can be taken as an indication of the confidence in whether a positive or negative change is
consistently simulated across the GCM models (values less than 50% suggest most models
are simulating a negative change, whereas greater than 50% suggest most models simulate
a positive change).
If we look for consistency across GCM models (more than 60% of models agreeing on either
a positive or negative change) as well as consistency across both the A2 and B1 scenario,
then decreases in rainfall are suggested all year round with the greatest changes during the
main rainfall season in JJA. During the December-February median changes are small, with
consistent model simulations tending towards the western regions over the ocean.
December-February (DJF) June – August (JJA)
Sub-Saharan African Cities: Five-City Network to Pioneer Climate Adaptation through Participatory Research and Local
Action
Figure 1: Median GCM simulations of change by 2050 under A2 and B1 emissions scenarios for the summer (DJF) and winter (JJA) seasons. The confidence of the model ensemble simulations is indicated by the percentage of models simulating a positive change.
Downscaling
The problem is that the scales used above are far too coarse for most users dealing with
regional issues such as water management and agriculture. Society and ecosystems
typically operate at much finer scales. Downscaling of these GCM simulations is therefore
often applied to produce data that is useful at the local level. This is based on the
assumption that local scale climate is largely a function of the large scale climate modified by
local influences such as topography, surface water bodies and proximity to the coast etc.
There are two main types of downscaling; dynamical and statistical.
Dynamical downscaling utilises a higher resolution, limited domain, dynamical model that
follows the same principles as a GCM but, because of the limited domain, is able to be run at
much higher spatial resolutions with moderate computation costs. Dynamical downscaling
offers a physically based regional response to the large scale forcing. However, dynamical
modelling is complicated by similar problems to those of GCMs, namely bias and errors due
to parameterisations and scale, as well as being computationally expensive and difficult to
downscale more than one or two GCMs. This latter reason makes it difficult to account for
much of the uncertainty in the future projections, which is represented by the many different
projections coming from many GCMs.
Box 1. The resolvable scale of a projection indicates the size of the discrete grid boxes that are produced by the models. Within each grid cell there is only value, thus the smaller the grid box (and larger the scale) the greater the variation can be displayed over the same area. Thus GCMs have small (or coarse) scales and downscaling’s intention is to increase this scale, or making it finer.
Sub-Saharan African Cities: Five-City Network to Pioneer Climate Adaptation through Participatory Research and Local
Action
Statistical downscaling utilises statistical methods to approximate the regional scale
response to the large scale forcing (Wilby et al., 2004). Various methods have been
developed, including the SOMD (Self Organising Map based Downscaling) developed at the
University of Cape Town which is used in this report. Details of the method can be found in
Hewitson and Crane (2006). The method recognises that the regional response is both
stochastic as well as a function of the large scale synoptic features. As such it generates a
statistical distribution of observed responses to past large scale observed daily synoptic
states. These distributions are then sampled based on the GCM generated daily synoptic
states in order to produce a time series of GCM downscaled daily values for the observed
variables on which it is trained (typically temperature and rainfall). An advantage of this
method is that the relatively poorly resolved grid scale GCM precipitation and surface
temperature are not used by the downscaling, but the relatively better simulated large scale
circulation (pressure, wind and humidity) fields are used. Because the method is easily
applied to multiple GCMs it can allow a sampling of the uncertainty within an ensemble of
multiple GCMs (Mearns et al., 2003).
In the following example for a station situated in the city of Cape Town, 9 GCMs forced
using an SRES A2 emissions scenario was obtained (from the CMIP3 archive) for the
periods 1961-2000 and 2046-2065. These coarse scale climate projections were used to
downscale available observations of rainfall and minimum/maximum temperature from
climate stations, using the statistical downscaling technique described below.
For each day of the observations, the daily synoptic state was classified using a SOM
of 10m u and v winds, 700 hPa u and v winds, 500-850hPa lapse rate, 2m surface
temperature, relative humidity and specific humidity taken from the NCEP reanalysis;
A cumulative distribution function (CDF) of the observed variable for each synoptic
type was created;
Map the GCM daily synoptic states to the SOM using the same variables as above;
A Random sample taken from CDF of each synoptic state.
This, then, allows a stochastic sampling of the local observed variable, conditioned by the
large-scale synoptic state.
Sub-Saharan African Cities: Five-City Network to Pioneer Climate Adaptation through Participatory Research and Local
Action
Downscaled results Taking the median of all the statistically downscaled GCMs, the maps for winter and summer
rainfall change over South Africa are shown in figures 2 and 3
Figure 2 Winter (JJA) rainfall anomaly projections (2046-2065) for SA (Hewitson, in South African Risk and Vulnerability Atlas (SARVA), 2010)
Sub-Saharan African Cities: Five-City Network to Pioneer Climate Adaptation through Participatory Research and Local
Action
Figure 3 Summer (DJF) rainfall anomaly projections (2046-2065) for SA Hewitson, in South African Risk and Vulnerability Atlas (SARVA), 2010)
Comparing the downscaled figures (2 and 3) with figure 1 demonstrates how the
downscaling is able to improve on the large-scale information provided by the GCMs. This is
particularly apparent during the winter JJA season where figure 1 indicates a median
decrease in rainfall across the whole of the western Cape region, whereas figure 2 suggests
that the negative changes will be confined to the far western regions of the western Cape.
There is an implied level of detail in the downscaled results that suggests the local response
to the large scale forcing in the GCMs is different between the western and eastern regions
of the western Cape. However, it is still unclear how confident the downscaled model
ensemble is – do most of the models suggest a decrease or is there still a wide range of
model results, some of which suggest negative and some positive change? In order to
investigate this the following section examines the downscaled GCMs for a single station
near Cape Town (SA Astronomical observatory), the location for which is given in figure 4.
Several stations were available in the vicinity of Cape Town and of these the SA
Astronomical Observatory has the longest record, including data for the last 10 years which
gives a longer time-series for which to train the downscaling model.
Sub-Saharan African Cities: Five-City Network to Pioneer Climate Adaptation through Participatory Research and Local
Action
Figure 4: Location of SA Astronomical Observatory (Googlemaps)
Rainfall
Figure 5 below compares the downscaled GCM control climates (1961-2000) with the
observed climate for Cape Town. The GCM control climates are close to the observed
climate (black line), replicating the observed seasonal cycle and peak rainfall during June.
This gives us confidence that the downscaling methodology applied to these GCMs is
simulating the local climates correctly, though it is worth noting that the downscaled climates
tend to underestimate the observed rainfall and shift the peak rainfall month later.
Figure 6 presents the simulated changes in rainfall for the SA observatory site. The shaded
regions indicate the spread between the different downscaled GCMs; between the 10th and
90th percentiles, which indicates the range between the lowest 10% and highest 10% of the
GCM downscaled values. This range is provided so that the range of different changes
simulated by the different downscaled GCMs, ignoring the outlying extreme model changes
(i.e. the 0 and 100 percentiles), can easily be see. Where the range straddles the 0 change
Sub-Saharan African Cities: Five-City Network to Pioneer Climate Adaptation through Participatory Research and Local
Action
line then some models simulate positive changes and others simulate negative changes.
However, the tendency of the distribution of models (the majority of models) to simulate
positive or negative change is indicated by the solid lines, which represent the median
downscaled response i.e. the equivalent of the 50th percentile of the distribution simulated by
the downscaled GCMs. The green line and shading is for the change (median and range
between the 10th and 90th percentiles) simulated for the 2046-2065 period and blue shading
and line similarly for the 2081-2100 period (relative to 1961-2000). The median models
suggest an increase in rainfall during late June / early July for the 2046-2065 period but a
decrease for other months and all months during the 2081-2100 period. There is significant
spread between the 10th and 90th percentile models, particularly during the rainfall months.
On the whole these changes are not dissimilar to those simulated by the GCMs, though the
slightly wetter simulations on average may be due to the downscaling process, or the
influence of Table Mountain on rainfall which is better resolved in the downscaled climate.
Figure 5: GCM downscaled control rainfall climates (mm per day), for the period 1961-2000 at Cape Town. Black line is observed climate and coloured lines are downscaled GCM climates.
Sub-Saharan African Cities: Five-City Network to Pioneer Climate Adaptation through Participatory Research and Local
Action
Figure 6: Downscaled rainfall anomalies (mm day-1) for the 2046-2065 period (green) and 2081-2100 period (blue). Shading indicates model spread (10th to 90th percentile change) and solid lines the median model response.
Temperature
The downscaled changes in temperature are similar to those from the GCMs presented
earlier and are similar for both minimum and maximum temperatures. Maximum temperature
changes are shown in figure 7. Increases are similar during all months, with median changes
for the 2081-2100 period as high as 3.4°C and changes for the 2046-2065 period peaking at
1.9°C during May.
Sub-Saharan African Cities: Five-City Network to Pioneer Climate Adaptation through Participatory Research and Local
Action
Figure 7: Downscaled maximum temperature anomalies (°C) for the 2046-2065 period (green) and 2081-2100 period (blue). Shading indicates model spread (10th and 90th percentile) and solid lines the median model response.
Evaporation and effective rainfall
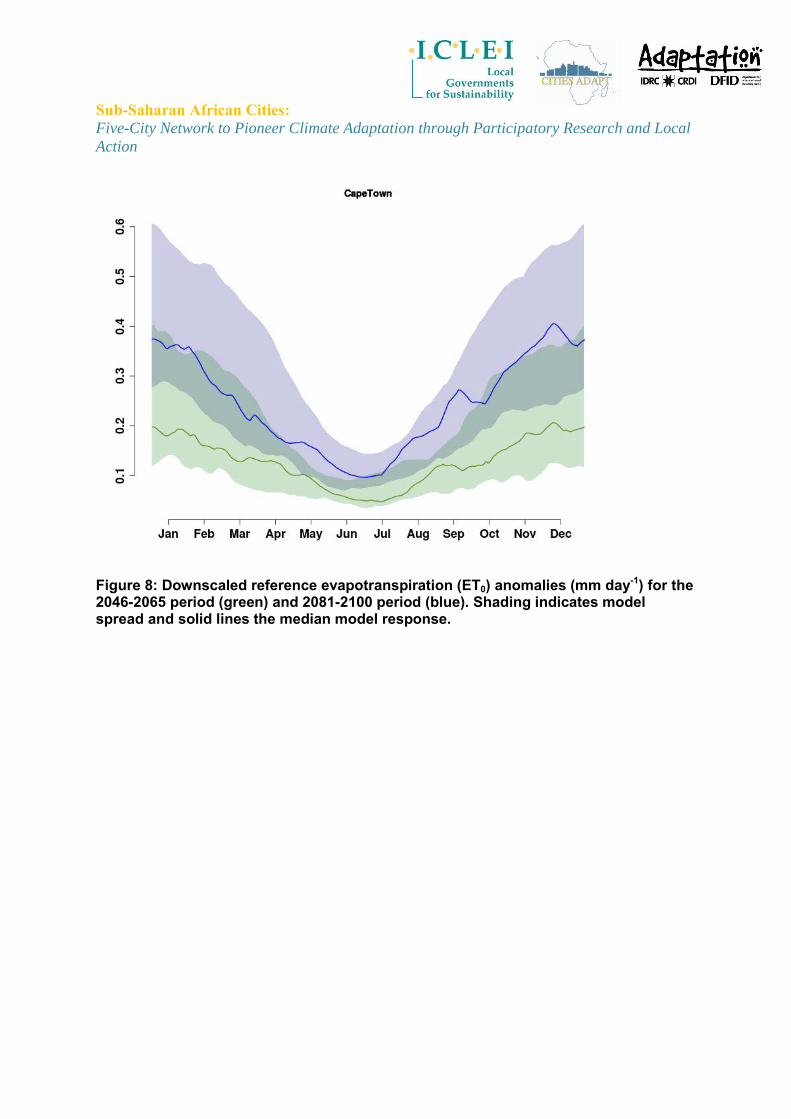
One major consequence of the changes in temperature is to increase reference
evapotranspiration (ET0) – assuming only small changes in winds, humidity and solar
radiation - the changes for which are shown in figure 8. Increases are highest during
December and the peak summer months, with highest median increases of 0.4 mm day-1
during the 2081-2100 period and 0.2 mm day-1 during the 2046-2065 period.
Sub-Saharan African Cities: Five-City Network to Pioneer Climate Adaptation through Participatory Research and Local
Action
Figure 8: Downscaled reference evapotranspiration (ET0) anomalies (mm day-1) for the 2046-2065 period (green) and 2081-2100 period (blue). Shading indicates model spread and solid lines the median model response.
Sub-Saharan African Cities: Five-City Network to Pioneer Climate Adaptation through Participatory Research and Local
Action
Figure 9: Downscaled effective rainfall (ppt - ET0) anomalies (mm day-1) for the 2046-2065 period (green) and 2081-2100 period (blue). Shading indicates model spread (10th and 90th percentiles) and solid lines the median model response. One consequence of these increases in ET0 is that effective rainfall (rainfall – evaporation)
decreases, even without a decrease in rainfall. Assuming that evaporation occurs at the
reference level (typical of a surface covered in short grass), figure 9 shows the change in
effective rainfall. Comparing it with figure 10, it can be seen that the change in evaporation
results in reductions in effective rainfall in nearly all simulations and all months, with the
exception of the earlier 2046-2065 period during the peak of the winter rainfall season. This
implies less surface water available for dams, plants and agriculture at most times of the
year, except, potentially, during the peak of the rainfall season in the mid-century period.
Climate extremes are harder to simulate than changes in the mean climate, largely because
GCMs are low resolution parameterised versions of the real climate and may fail to capture
important mechanisms e.g. intense and localised convective rainfall. Whilst the downscaling
here relates the large scale atmospheric GCM fields to observed rainfall and temperature,
and is therefore good at projecting realistic climate on average, it still relies on the GCM
simulations to model the change in atmospheric dynamics. This, and the infrequent nature of
Sub-Saharan African Cities: Five-City Network to Pioneer Climate Adaptation through Participatory Research and Local
Action
extreme events (poor sampling in the historical record), means that it is difficult to project
future changes.
Until there are fundamental improvements in the GCMs, better estimates of extreme climate
events will be difficult; new simulations from the CORDEX programme will offer some high
resolution dynamic simulations from multiple regional climate models (RCMs) for the first
time, and these simulations may be able to better simulate the complex dynamics of extreme
events leading to improved estimates of change.
Changes in extreme temperatures
Changes in extreme temperatures are likely to rise in all simulations from GCMs and the
statistical downscaling used here. Figure 10 indicates the cumulative probability of
exceeding different maximum daily temperatures for different periods at Cape Town under
an assumed A2 emissions scenario. The risk of exceeding high values (e.g. 35°C) is higher
during future periods, though this might be an underestimate given that the GCM control
climates slightly underestimate the observed exceedance. Table 1 below shows the
probability of exceeding several temperatures for Cape Town, as well as for each period.
Box 2. Probability in this context is a measure of the expectation that an event will occur. Probabilities are given a value between 0 (will not occur) and 1 (will occur). The higher the probability of an event, the more certain it is that the event will occur. The cumulative probability is the probability of observing less than or equal to the observed value. The graph shows how this probability of exceeding a maximum temperature increases over the 3 time periods
Sub-Saharan African Cities: Five-City Network to Pioneer Climate Adaptation through Participatory Research and Local
Action
Figure 10: Cumulative probability of exceeding maximum temperatures under current (black), downscaled control (orange), downscaled 2046-2065 (green) and downscaled 2081-2100 (blue) periods at Cape Town.
Temperature threshold
Probability of exceedance under present climate
(1960-2000)
Probability of exceedance under future climate (2046-
2065)
Probability of exceedance under future climate (2081-
2100) 30°C 5% 11% 19% 32°C 2% 5% 9% 35°C 0% 1% 3%
Table 1. The probability of exceeding several temperatures for Cape Town for the 3 periods As a rough rule we can therefore expect the frequency of days exceeding these different
thresholds to more than double by 2055 and approximately quadruple by 2090 under the A2
emissions scenario.
Sub-Saharan African Cities: Five-City Network to Pioneer Climate Adaptation through Participatory Research and Local
Action
One improvement on these estimates of change for the future would be to downscale using
a higher resolution RCM which would be better able to resolve graded temperature changes
in regions of steep topography (Tadross et al., 2005), something that the GCMs and
statistical downscaling used here is not able to do. The multiple RCM simulations generated
as part of the CORDEX programme (Jones et al., 2011) could be used in this regard.
Changes in extreme rainfall
Changes in extreme rainfall will be at least partly difficult to estimate due to the problems in
simulating extreme atmospheric conditions mentioned earlier. Additionally the statistical
downscaling technique used here can only simulate daily rainfall values seen in the historical
record. This means that it may underestimate increases in rainfall due to increases in
intensity, especially at the extreme tail of the distribution. Given that increases in intensity
are possible in a hotter climate with more moisture for rainfall, this is a shortcoming of the
downscaling methodology employed here. Using RCMs (which are not restricted by such
limits) is currently not an option as there are not enough RCM simulations for multiple GCMs
available for the region (in order to construct envelopes of change and assess the
probability/risk of particular changes). Again this may change when the CORDEX data
becomes available.
Analysis
Whilst using an ensemble of GCMs to project change at the large scale is clearly a viable
option, it seems to be clear from the work presented here, that this is not the case when
smaller regions are considered. In the case of the western Cape and the simulation of
rainfall this may be a consequence of several factors:
1. the dominant rainfall mechanism during winter are mid-latitude cyclones which are
crudely resolved by the GCMs;
2. rainfall is too simply parameterised in the GCMs;
3. the varied topography and coast is only crudely represented in the GCMs
A downscaled model is shown to be able to provide an enhanced ability to resolve some of
these differences, though it is still based on the information and simulations provided by the
GCM. In particular, it is able to suggest different regions of positive and negative rainfall
change. This is largely a consequence of being able to improve on aspects 2 and 3 above,
Sub-Saharan African Cities: Five-City Network to Pioneer Climate Adaptation through Participatory Research and Local
Action
though it is still fundamentally dependent on the GCMs ability to simulate the first aspect
above.
Conclusion
The question posed at the outset was whether a downscaling technique such as the one
used here could be used to assist decision-making on the localised scale compared to lower
scale GCM output. Whilst there is an indication that the downscaling improves on the ability
of the model ensemble to distinguish between regions where different changes might be
expected, it still produces an ensemble which is characterised by a wide range of simulated
change (both positive and negative rainfall changes). So it remains a possibility that the
downscaling does not necessarily reduce uncertainty, but rather simulates a more realistic
range of changes given the large scale changes simulated by the GCMs. If this is the case
then this is an important improvement, especially when it comes to simulating realistic
impacts, either in hydrology or agriculture. In this respect it is especially important to note
that the downscaled changes in rainfall need to be realistic, especially if we are to
understand whether more or less water will be available in the future – even increases in
rainfall may be insufficient to overcome potential increases in evaporation.
Changes in rainfall extremes were shown to be difficult to simulate using the statistical
downscaling technique used in this study, though this does not necessarily apply to all
downscaling techniques. However, changes in extreme temperatures were easier to
estimate and provided useful estimates which can be important for estimating impacts on
human and animal health, damages to crops and vegetation etc.
The utility of downscaled data therefore depends on the application of the data and it is not a
product free from the problems associated with GCMs. It is rather a translation of the GCM
data that is able to provide potentially more realistic changes (in the mean climate) that can
better serve as input to an impact analysis, whilst still being limited by methodological
constraints. Any use of this data for assessing impacts at the local scale should therefore
bear in mind both its advantages and constraints.
REFERENCES
Sub-Saharan African Cities: Five-City Network to Pioneer Climate Adaptation through Participatory Research and Local
Action
Hewitson, B.C, and R.G.Crane, , 2006. Consensus between GCM climate change projections with empirical downscaling: precipitation downscaling over South Africa. Int. J. Clim., 26, 1315-1337. Jones, C. F. Giorgi, G. Asrar 2011. The Coordinated Regional Downscaling Experiment: CORDEX. An international downscaling link to CMIP5, CLIVAR Exchanges No. 56, Vol. 16, No.2, May 2011 Mearns L. O., F. Giorgi, P. Whetton, D. Pabon, M. Hulme, M. Lal, 2003: Guidelines for use of climate scenarios developed from regional climate model experiments. TGCIA-IPCC report. Available from http://ipcc-ddc.cru.uea.ac.uk/guidelines/RCM6.Guidelines.October03.pdf, 38 pp. South African Risk and Vulnerability Atlas (SARVA): 2010 Department of Science and Technology (http://www.sarva.org.za) Tadross, M.A., C. Jack and B. Hewitson, 2005. On RCM-based projections of change in southern African summer climate. Geophys. Res. Lett., 32, L23713, doi:10.1029/2005GL024460 Wilby, R. L., S.P. Charles, E. Zorita, B. Timbal, P. Whetton and L.O. Mearns. 2004. Guidelines for use of climate scenarios developed from statistical downscaling methods, Supporting material of the Intergovernmental Panel on Climate Change, available from the DDC of IPCC TGCIA, 27. www.ipcc-data.org/guidelines/dgm_no2_v1_09_2004.pdf