Article Volume 11, Number 8 20 August 2010 Q08016, doi:10.1029/2010GC003172 ISSN: 1525‐2027 Subducting slabs: Jellyfishes in the Earth’s mantle Christelle Loiselet Géosciences Rennes, UMR 6118, Université de Rennes 1, CNRS, F‐35042 Rennes, France Now at Mineral Resources Division, BRGM, 3 avenue Claude Guillemin, BP 6009, F‐45060 Orleans CEDEX 2, France ([email protected]) Jean Braun Géosciences Rennes, UMR 6118, Université de Rennes 1, CNRS, F‐35042 Rennes, France Now at Laboratoire de Géodynamique des Chaînes Alpines, Université Joseph Fourier de Grenoble, F‐38041 Grenoble, France ([email protected]) Laurent Husson Géosciences Rennes, UMR 6118, Université de Rennes 1, CNRS, F‐35042 Rennes, France Also at Laboratoire de Planétologie et Géodynamique de Nantes, UMR 6112, CNRS, F‐44322 Nantes, France ([email protected]) Christian Le Carlier de Veslud Géosciences Rennes, UMR 6118, Université de Rennes 1, CNRS, F‐35042 Rennes, France ([email protected]) Cedric Thieulot Department of Earth Science, University of Bergen, N‐5020 Bergen, Norway ([email protected]) Philippe Yamato Géosciences Rennes, UMR 6118, Université de Rennes 1, CNRS, F‐35042 Rennes, France ([email protected]) Djordje Grujic Department of Earth Sciences, Dalhousie University, Halifax, Nova Scotia B3H 4J1, Canada ([email protected]) [1] The constantly improving resolution of geophysical data, seismic tomography and seismicity in particular, shows that the lithosphere does not subduct as a slab of uniform thickness but is rather thinned in the upper mantle and thickened around the transition zone between the upper and lower mantle. This observation has traditionally been interpreted as evidence for the buckling and piling of slabs at the boundary between the upper and lower mantle, where a strong contrast in viscosity may exist and cause resistance to the penetration of slabs into the lower mantle. The distribution and character of seismicity reveal, however, that slabs undergo vertical extension in the upper mantle and compression near the transition zone. In this paper, we demonstrate that during the subduction process, the shape of low viscosity slabs (1 to 100 times more viscous than the surrounding mantle) evolves toward an inverted plume shape that we coin jellyfish. Results of a 3D numerical model show that the leading tip of slabs deform toward a rounded head skirted by lateral tentacles that emerge from the sides of the jellyfish head. The head is linked to the body of the subducting slab by a thin tail. A complete parametric study reveals that subducting slabs may achieve a variety of shapes, in good agreement Copyright 2010 by the American Geophysical Union 1 of 21
Transcript
Article
Volume 11, Number 8
20 August 2010
Q08016, doi:10.1029/2010GC003172
ISSN: 1525‐2027
Subducting slabs: Jellyfishes in the Earth’s mantle
Christelle LoiseletGéosciences Rennes, UMR 6118, Université de Rennes 1, CNRS, F‐35042 Rennes, France
Now at Mineral Resources Division, BRGM, 3 avenue Claude Guillemin, BP 6009, F‐45060 Orleans CEDEX 2,France ([email protected])
Jean BraunGéosciences Rennes, UMR 6118, Université de Rennes 1, CNRS, F‐35042 Rennes, France
Now at Laboratoire de Géodynamique des Chaînes Alpines, Université Joseph Fourier de Grenoble,F‐38041 Grenoble, France ([email protected])
Laurent HussonGéosciences Rennes, UMR 6118, Université de Rennes 1, CNRS, F‐35042 Rennes, France
Also at Laboratoire de Planétologie et Géodynamique de Nantes, UMR 6112, CNRS, F‐44322 Nantes, France([email protected])
Christian Le Carlier de VesludGéosciences Rennes, UMR 6118, Université de Rennes 1, CNRS, F‐35042 Rennes, France([email protected])
Cedric ThieulotDepartment of Earth Science, University of Bergen, N‐5020 Bergen, Norway ([email protected])
Philippe YamatoGéosciences Rennes, UMR 6118, Université de Rennes 1, CNRS, F‐35042 Rennes, France([email protected])
Djordje GrujicDepartment of Earth Sciences, Dalhousie University, Halifax, Nova Scotia B3H 4J1, Canada ([email protected])
[1] The constantly improving resolution of geophysical data, seismic tomography and seismicity in particular,shows that the lithosphere does not subduct as a slab of uniform thickness but is rather thinned in the uppermantle and thickened around the transition zone between the upper and lower mantle. This observation hastraditionally been interpreted as evidence for the buckling and piling of slabs at the boundary between theupper and lower mantle, where a strong contrast in viscosity may exist and cause resistance to the penetrationof slabs into the lower mantle. The distribution and character of seismicity reveal, however, that slabs undergovertical extension in the upper mantle and compression near the transition zone. In this paper, we demonstratethat during the subduction process, the shape of low viscosity slabs (1 to 100 times more viscous than thesurrounding mantle) evolves toward an inverted plume shape that we coin jellyfish. Results of a 3D numericalmodel show that the leading tip of slabs deform toward a rounded head skirted by lateral tentacles that emergefrom the sides of the jellyfish head. The head is linked to the body of the subducting slab by a thin tail. Acomplete parametric study reveals that subducting slabs may achieve a variety of shapes, in good agreement
Copyright 2010 by the American Geophysical Union 1 of 21
with the diversity of natural slab shapes evidenced by seismic tomography. Our work also suggests that theslab to mantle viscosity ratio in the Earth is most likely to be lower than 100. However, the sensitivity of slabshapes to upper and lower mantle viscosities and densities, which remain poorly constrained by independentevidence, precludes any systematic deciphering of the observations.
Received 13 April 2010; Revised 8 June 2010; Accepted 23 June 2010; Published 20 August 2010.
Loiselet, C., J. Braun, L. Husson, C. Le Carlier de Veslud, C. Thieulot, P. Yamato, and D. Grujic (2010), Subducting slabs:Jellyfishes in the Earth’s mantle, Geochem. Geophys. Geosyst., 11, Q08016, doi:10.1029/2010GC003172.
1. Introduction
[2] The wide range of shapes observed among sub-ducting oceanic lithospheres [Isacks and Molnar,1971; Kárason, 2002; Li et al., 2008] suggests acomplex dynamical behavior for the penetration ofslabs into the mantle. The lack of earthquake activitybelow 700 km depth and the compressive nature ofthe focal mechanisms of the deep earthquakes alongthe surface of the slabs have been interpreted as aneffect of the resistance of slabs to penetration into thelower mantle [Isacks and Molnar, 1971]. Such ob-servations are at least compatible with dynamicmodels of the long wavelength geoid anomaliesassociated with slabs requiring an increase in vis-cosity from the upper to the lower mantle by a factor10–100 [Hager and Richards, 1989; Lambeck andJohnston, 1998; Moresi and Gurnis, 1996; Peltier,1996; Ricard et al., 1993] or more [Kido andCadek, 1997]. But travel time tomography has alsorevealed that positive seismic anomalies attributedto slabs often extend into the lower mantle [Creagerand Jordan, 1986; Grand, 1994; Jordan, 1977;Jordan and Lynn, 1974]. In the last decade, imagesfrom seismic tomography have improved in resolu-tion and accuracy, and have revealed that slabs tendto thicken during penetration into the lower mantle,i.e., from the transition zone to mid‐mantle depths[Bijwaard et al., 1998; Fukao et al., 2001; Grandet al., 1997]. Examples thereof include the Centraland South Americas [Ren et al., 2007], southernAsia [Kárason, 2002; Li et al., 2008] or the Hellenicslab [Piromallo and Morelli, 2003; Wortel andSpakman, 2000]. Slab thickening in the mid‐lowermantle is often interpreted as evidence for periodicbuckling of cold and stiff lithosphere as it penetrates
into the mantle [Gaherty and Hager, 1994;Guillou‐Frottier et al., 1995; Loubet et al., 2009; Ribe et al.,2007]. However, the deformation of slabs goingsinking through the mantle has also been interpretedas evidence that subducting plates could be veryweak [Bevis, 1986; Čížková et al., 2002; Giardiniand Woodhouse, 1984; Tao and O’Connell, 1993].Indeed, although they have not emphasized thisaspect before, previous authors [e.g., Christensenand Yuen, 1984; Zhong and Gurnis, 1995; Funicielloet al., 2003] do simulate (via numerical and analogmodeling) comparable spherical shapes for weakdescending plates. Only Kárason [2002] effectivelyassociated the seismically observed morphology ofslabs penetrating into the deep mantle to that ofa thickened isoviscous slabs. He showed that thethickening of weak subducting slabs changes sys-tematically with the viscosity contrast between theupper and lower mantles.
[3] Furthermore, the viscosity of the subductingplate strongly influences plate deformation andtherefore its dynamics. In the literature, the range ofassumed and predicted viscosity ratios between theslab and the surrounding mantle is large, comprisedbetween 106 [Kincaid and Griffiths, 2003] and 1[Husson, 2006; Kárason, 2002]. The values used inrecent models are comprised between 102 and 103
[Clark et al., 2008;Faccenna et al., 2001;Funicielloet al., 2003; Schellart, 2004; Stegman et al., 2006;Yamato et al., 2009]. Previous work from Loiseletet al. [2009] suggested that the viscosity ratioshould be smaller than 102.
[4] In view of these most recent estimates of theviscosity ratio between the subducting plate and thesurrounding mantle, we expanded on Kárason’s
GeochemistryGeophysicsGeosystems G3G3 LOISELET ET AL.: SUBDUCTING SLABS 10.1029/2010GC003172
2 of 21
[2002] work, exploring the possibility that a platesinking into the mantle deforms and naturallythickens at mid‐depths, without the need for a stifflithosphere or a viscosity or density jump in thelower mantle. To demonstrate this point, we inves-tigate here the role of the viscosity ratio between theplate and the surrounding fluid and, subsequently,the role of mantle stratification (corresponding to aviscosity or density jump) in forming awide range ofshapes, ranging from that of an undeformed slab tothe characteristic shape of a downwelling plume thatwe refer to as a jellyfish. In the latter part of thispaper, we further discuss our results in light ofobserved slab geometries, which we extract fromseismic tomography images.
2. Methodology
[5] In order to explore the dynamic interactionsbetween the subducting lithosphere and the sur-rounding viscous mantle, we evaluate the deforma-tion pattern of a slab sinking into the mantle bymeans of a three‐dimensional numerical model thatis designed to track sharp, dynamically deforminginterfaces. The 3D finite element code DOUAR[Braun et al., 2008] solves for the conservationequations for mass, momentum and energy in theBoussinesq approximation, assuming that the man-tle is an incompressible viscous medium.DOUAR isan ALE (Arbitrary Lagrangian Eulerian) FiniteElement code based on an adaptive octree grid[Thieulot et al., 2008] that is highly suited to solvegeometry problems in three dimensions. An octree isthe simplest hierarchical division of the unit cubeinto smaller cubes, obtained by dividing, wherehigher resolution is required, each cube into 8 smal-ler cubes, up to a given or desired resolution. Thesmallest or undivided cubes are called the “leaves”of the octree. InDOUAR, the computational domainis therefore a unit cube, the finite elements are theleaves of the octree and their density is adapted torepresent the various material, density and viscosityinterfaces with optimum accuracy. The flow isdriven by the internal density differenceDr betweenthe subducting lithosphere and the surroundingmantle. We simplify our analysis by assuming aninfinite Prandtl number in a fluid with very lowReynolds number (Re = 0) and a linear rheology forall components of the system. Under such condi-tions, the velocity field u and pressure p obey thefollowing simplified form of Navier–Stokes equa-tions, referred to as the Stokes equations:
r:� ruþruT� ��rp ¼ �g ð1Þ
and
r:u ¼ 0 ð2Þ
where r is the density, g the gravitational accelera-tion, p the pressure field, m the dynamic viscosityand u the velocity.
[6] Interfaces (between the slab, upper mantle andlower mantle) are advected by using the computedvelocity field and are tracked by a dual methodcombining Lagrangian particles for accuracy andlevel set functions for efficiency (see Braun et al.[2008] for further details on this method).
[7] The model setup is shown in Figure 1a andparameters are given in Table 1. The computationalnumerical domain is a unit cube (i.e., 1 × 1 × 1 in x, y,z directions) representing a ∼2750 kmCartesian box,corresponding to the Earth’s mantle. The mantle isdivided between an upper and lower mantle where amaterial discontinuity (i.e., that is advected with theflow) is imposed at z660 = 0.24 (∼660 km). The gridcounts (64)3 (or level 6 octree) regularly spacedelements (or leaves) everywhere but in and aroundthe slab where the resolution is increased to level 8,i.e., the element size is 1/256 of the size of the unitcube. Free slip is assumed on all boundaries. Theexperiment is initiated by placing a vertical (unlessotherwise specified) plate of length, l = 0.066(∼182 km) and thickness h = 0.03 (∼83 km) in themantle between depths of 0.03 and 0.096 (∼83 kmto 264 km, Figure 1a).
[8] To ensure that the plate falling is controlled onlyby the buoyancy forces arising from the densitycontrast and by the viscosity ratio between the plateand the surrounding viscous fluid, the velocity at thetop boundary of the plate is not fixed (i.e., not set tozero for the calculation of the velocity field). For thesame raison, the top boundary of the slab is notattached to the top of the model box where thevelocity component in the z‐direction vanishes(free‐slip conditions). However, since the slab isconsidered “infinite” in our simulation, slab materialis constantly added from the top. To simulate that,we do not update the geometry of the upperboundary of the slab from the computed velocityfield, such that it stays at the same level through time(i.e., at z = 0.03 from the top of the model box).Consequently, plate volume increases with time. Inthis way we discard any resistance to sinking thatmay arise in nature from the relative horizontalmovement between the plate and the mantle. Weassign a constant density contrast between theslab and the surrounding mantle. All viscositiesare Newtonian and uniform within the slab and the
GeochemistryGeophysicsGeosystems G3G3 LOISELET ET AL.: SUBDUCTING SLABS 10.1029/2010GC003172
3 of 21
mantle; the upper mantle viscosity is taken as thereference viscosity ( = 1). More complex rheologiesmay prevail in nature, especially rheologies thataccount for the influence of temperature on viscosity
[e.g., Billen and Gurnis, 2005], but we chose to keepthe model as simple as possible in order to quantifyits behavior as a function of the effective slab tomantle viscosity ratio that we vary from ms = 0.01 to
Table 1. Parameters Used in the Models
Description Parameter Model Nature
SlabThickness h 0.03 ∼83 kmWidth w 0.125/0.25a/0.5 344/688/1375 kmDip angle a 90a/70/45/30 90a/70/45/30Density rs 0.1024 ∼3328 kg. m−3
Viscosity ratio ms 10−2/100/101a/102 10−2/100/101a/102
Uniform octree level Ls 8 (0.0039) ∼10.72 km
Upper Mantle660 km boundary z660 0.24 660 kmDensity rum 0.1 ∼3250 km.m−3
Figure 1. Reference model. (a) Model setup and variables: h is plate thickness, w is plate width, l is initial plate pen-etration. The black parallelepiped is the initial slab geometry and the gray body is a typical slab shape after subduction tomid‐depth. (b) x‐ (black) and y‐ (gray) cross‐section series of the plate at different stages (uniform time steps). Boldprofiles denote notable stages (see text). (c) Vertical cross section along the x‐ (black) and y‐ (gray) sections of the lead-ing edge of the subducting plate. Rw (black) (measured along the width w of the plate) and Rh (gray) (measured along itsthickness h) give the radii of the circles that circumscribe the dotted triangles.
GeochemistryGeophysicsGeosystems G3G3 LOISELET ET AL.: SUBDUCTING SLABS 10.1029/2010GC003172
4 of 21
100. In our study, plate width,w, and initial slab dip,a, are also varied between 1/8, 1/4, and 1/2 of thebox width and 90, 70, 60, 45 and 30° respectively.
3. Results
[9] We performed a series of 27 experiments toexplore the dependence of the slab deformation onslab to lower mantle density contrastDr, slab widthw, slab dip a, slab to mantle viscosity ratio ms, andlower to upper mantle viscosity ratio ml. Someinteresting features prevail regardless of the param-eter values that we review below. To illustrate thispoint, we first show the results of a simple experi-ment (reference model) in which the plate viscosityis 10 times that of the upper mantle and where thereis no viscosity or density contrast between the upperand lower mantle. The initial plate width is 0.25 (i.e.,1/4 of the box width) and the slab is vertical.
3.1. General Evolution of the Models
[10] During the sinking of the plate into the mantle,its shape evolves in a comparable way, to a largeextent, to that of a reverse or descending plume(Figures 1a and 1b) [Christensen and Yuen, 1984;Kárason, 2002]. Note however that in most of ourmodels the viscosity ratio is inverted in comparisonto that of a typical rising mantle plume, which ischaracterized by a lower viscosity than the sur-rounding mantle. The shape of the slab is charac-terized by a rounded head at its leading tip, withtwo trailing “tentacles” along each narrow edge(Figure 1b), and connected to the surface by a longrectangular section tail. The initial rectangular shapeprobably promotes the development of the tentacles,but even when using plates with smooth edges, theystill form. To a minor extent, the mantle also dragsthe longer edges and gently wraps them over thebody of the slab (Figure 1b). In the following, werefer to the deformed shape of the slab as that of ajellyfish, for both our model slabs and real jellyfishesare characterized by comparable shapes that shouldminimize the viscous dissipation of energy whilethey move through the fluid. The jellyfish shape canbe characterized by the longitudinal radius of cur-vature Rw and the lateral radius of curvature Rh (seeFigure 1c). In practice, to calculate Rw and Rh, wecompute the equation of the circle that circumscribesthe triangle defined by the three vertices made bythe leading tip (deepest point of the greatest z‐value)and the two tips of the tentacles in the longitudinaldirection (points of maximum andminimum x‐value
for Rw and y‐value for Rh,). To further characterizethe shape of the jellyfish and the flow it engenders inthe mantle, we compute for each of the numericalexperiments: (a) the velocity of the jellyfish head(measured on the slab at its maximum z‐position)and its radius of curvature, (b) the maximum strainrate along the central vertical axis z, (c) the surfacearea of horizontal sections of the plate (distant by0.03) as a function of depth and (d) the total viscousdissipation in the mantle.
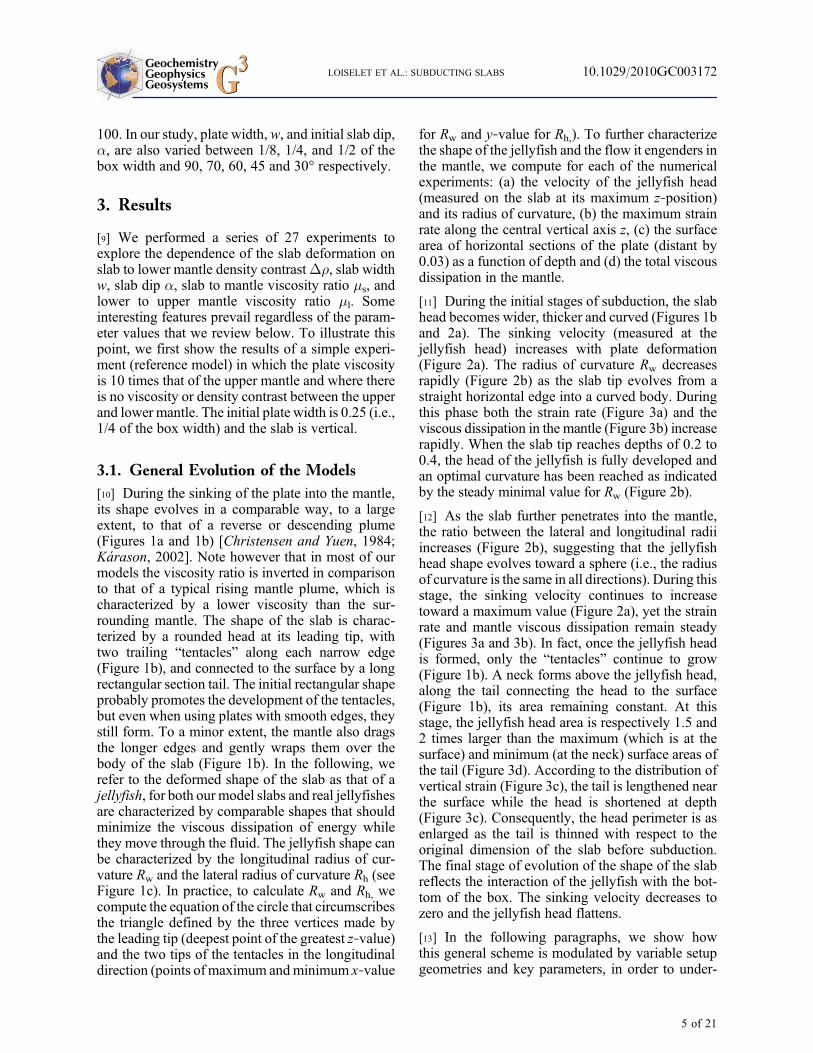
[11] During the initial stages of subduction, the slabhead becomes wider, thicker and curved (Figures 1band 2a). The sinking velocity (measured at thejellyfish head) increases with plate deformation(Figure 2a). The radius of curvature Rw decreasesrapidly (Figure 2b) as the slab tip evolves from astraight horizontal edge into a curved body. Duringthis phase both the strain rate (Figure 3a) and theviscous dissipation in the mantle (Figure 3b) increaserapidly. When the slab tip reaches depths of 0.2 to0.4, the head of the jellyfish is fully developed andan optimal curvature has been reached as indicatedby the steady minimal value for Rw (Figure 2b).
[12] As the slab further penetrates into the mantle,the ratio between the lateral and longitudinal radiiincreases (Figure 2b), suggesting that the jellyfishhead shape evolves toward a sphere (i.e., the radiusof curvature is the same in all directions). During thisstage, the sinking velocity continues to increasetoward a maximum value (Figure 2a), yet the strainrate and mantle viscous dissipation remain steady(Figures 3a and 3b). In fact, once the jellyfish headis formed, only the “tentacles” continue to grow(Figure 1b). A neck forms above the jellyfish head,along the tail connecting the head to the surface(Figure 1b), its area remaining constant. At thisstage, the jellyfish head area is respectively 1.5 and2 times larger than the maximum (which is at thesurface) and minimum (at the neck) surface areas ofthe tail (Figure 3d). According to the distribution ofvertical strain (Figure 3c), the tail is lengthened nearthe surface while the head is shortened at depth(Figure 3c). Consequently, the head perimeter is asenlarged as the tail is thinned with respect to theoriginal dimension of the slab before subduction.The final stage of evolution of the shape of the slabreflects the interaction of the jellyfish with the bot-tom of the box. The sinking velocity decreases tozero and the jellyfish head flattens.
[13] In the following paragraphs, we show howthis general scheme is modulated by variable setupgeometries and key parameters, in order to under-
GeochemistryGeophysicsGeosystems G3G3 LOISELET ET AL.: SUBDUCTING SLABS 10.1029/2010GC003172
5 of 21
stand the processes that control the behavior of theslab as it penetrates into the mantle.
3.2. Slab Width
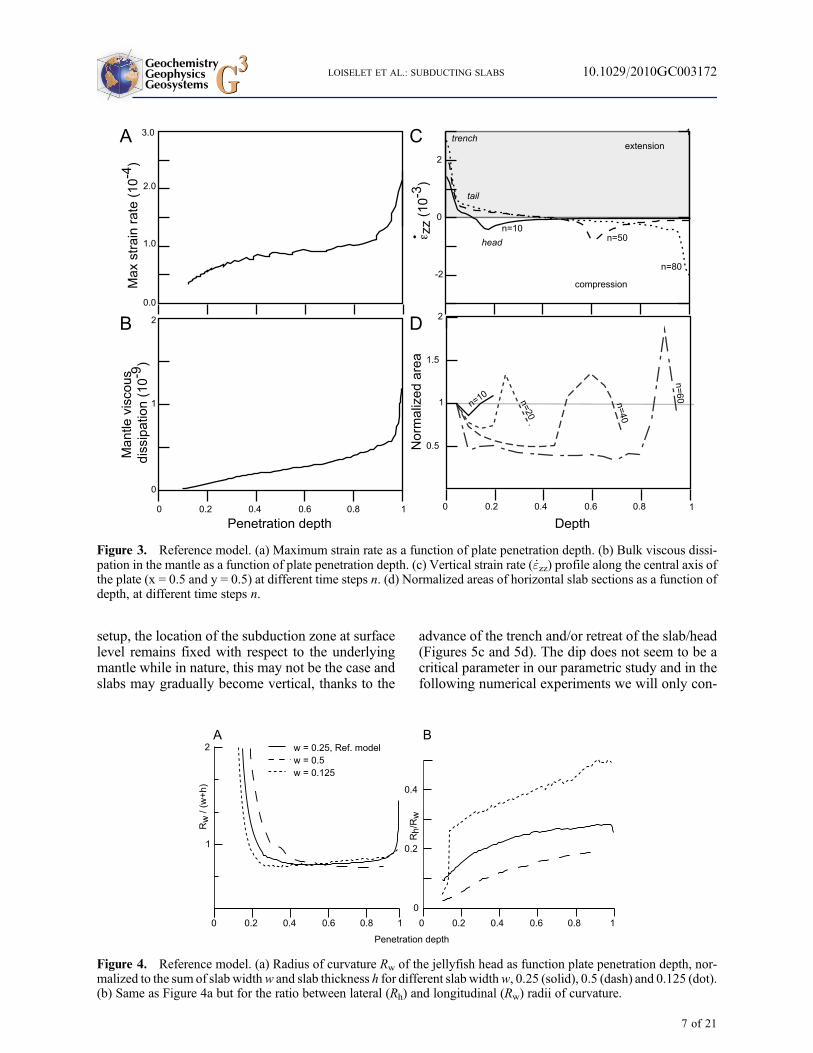
[14] Plate width is known to influence the kinemat-ics of subduction [Di Giuseppe et al., 2008; Loiseletet al., 2009; Piromallo et al., 2006; Schellart et al.,2007]. We evaluate its impact on the shape of thejellyfish by varying the plate widthw between 0.125and 0.5 (1/8 and 1/2 of the box width) while leavingthe box size and plate thickness unchanged. Resultsshow that, in all cases, the radius of curvature Rw ofthe jellyfish head decreases through time and tendstoward a minimal value (Figure 4a). When normal-ized to slab widthw and slab thickness h, Rw reachesa value comprised within a narrow range (∼3/4)proportional to the sum of the width and thickness,i.e., the jellyfish head evolves toward a locally reg-ular, spherical shape with a diameter proportional to1.5 * (w+h). This is better illustrated by consideringthe Rh/Rw ratio (Figure 4b), which increases withslab penetration. Of course, the ratio between theinitial slab width and thickness influences the cur-
vature of the jellyfish head. If the plate has an initialsquare horizontal cross section, the slab diametertends to 1 and Rw is always equal to Rh. Implicitly,the rate of formation of the jellyfish shape dependson the initial plate shape (i.e., w/h ratio): a narrowplate adopts the jellyfish shape faster than a wideplate.
3.3. Slab Dip
[15] In most natural cases, subduction does notinitiate vertically: slabs tend to dip at a finite angleunderneath the overriding plate. We explore theimpact of slab dip on the jellyfish evolution byvarying its value between 30 and 90°. Boundaryconditions are the same as for the referencemodel. InFigure 5, we present results from two experiments,characterized by slab dips of 60 and 30°, respec-tively. The radius of the jellyfish head decreases andtends toward a minimal Rw value, regardless of theinitially imposed slab dip. However, the morphol-ogy gets highly asymmetrical for shallow dippingslabs and the jellyfish shape transforms into a spoonshape (Figures 5a and 5b). Note that in our numerical
Figure 2. Reference model. (a) Velocity of the slab head as a function of penetration depth. (b) Radius of curvature Rw
of the slab head across the x‐profile (solid) and ratio between lateral (Rh) to longitudinal (Rw) radii of curvature of thejellyfish head (dashed).
GeochemistryGeophysicsGeosystems G3G3 LOISELET ET AL.: SUBDUCTING SLABS 10.1029/2010GC003172
6 of 21
setup, the location of the subduction zone at surfacelevel remains fixed with respect to the underlyingmantle while in nature, this may not be the case andslabs may gradually become vertical, thanks to the
advance of the trench and/or retreat of the slab/head(Figures 5c and 5d). The dip does not seem to be acritical parameter in our parametric study and in thefollowing numerical experiments we will only con-
Figure 4. Reference model. (a) Radius of curvature Rw of the jellyfish head as function plate penetration depth, nor-malized to the sum of slab widthw and slab thickness h for different slab widthw, 0.25 (solid), 0.5 (dash) and 0.125 (dot).(b) Same as Figure 4a but for the ratio between lateral (Rh) and longitudinal (Rw) radii of curvature.
Figure 3. Reference model. (a) Maximum strain rate as a function of plate penetration depth. (b) Bulk viscous dissi-pation in the mantle as a function of plate penetration depth. (c) Vertical strain rate ( _"zz) profile along the central axis ofthe plate (x = 0.5 and y = 0.5) at different time steps n. (d) Normalized areas of horizontal slab sections as a function ofdepth, at different time steps n.
GeochemistryGeophysicsGeosystems G3G3 LOISELET ET AL.: SUBDUCTING SLABS 10.1029/2010GC003172
7 of 21
sider a 90° dip angle (or vertical slab), as set up inthe reference model.
3.4. Slab to Mantle Viscosity Ratio
[16] We test different viscosity ratios (from 10−2
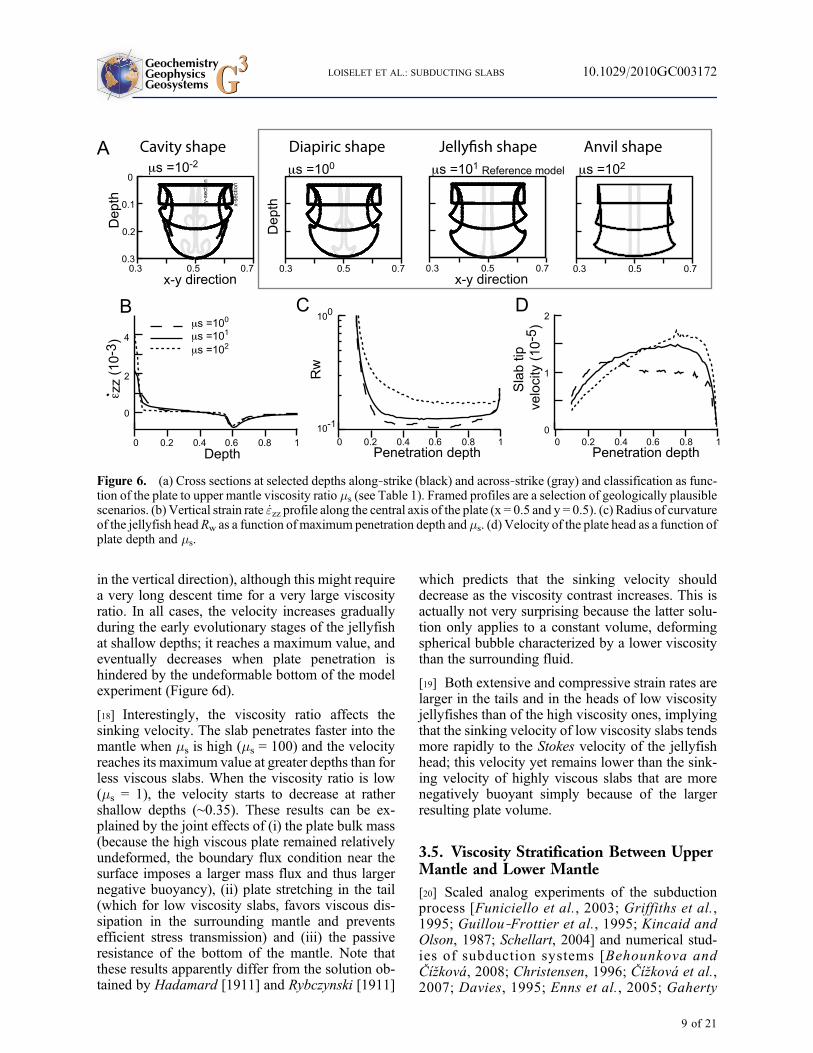
to 102) between the lithosphere slab and the sur-rounding mantle (Figure 6a). Note that in theabsence of any viscosity difference between the slaband mantle, the flow is that of a Stokes sinker. Fur-thermore, because we neglect the potential andhighly unknown dependence of mantle and litho-spheric rock viscosity on pressure, temperature orstress, our viscositiesmust be considered as effectivevalues. Expanding the work of Olson and Singer[1985] on creeping, rising plumes, we identifythree classes of jellyfishes based on the developmentof the jellyfish head: (i) Cavity jellyfishes, for whichthe plate viscosity is lower than that of the mantle;they feature well rounded heads connected to tailsupon which tentacles are retracted (Figure 6a, ms =10−2). (ii) Diapiric jellyfishes develop when thesystem is isoviscous or close to it. They differ from
cavity jellyfishes by their well‐individualizedtentacles and even better rounded head (Figure 6a,ms = 1). (iii) Anvil jellyfishes develop when theviscosity ratio is much larger than 1. In this case, theslab grows into an inverted anvil‐shaped cap (i.e.,jellyfish head) along its leading edge (Figure 6a, ms =101–102). Because slab viscosity is higher than thatof the surrounding mantle, anvil jellyfishes morelikely apply to the Earth better than the other classesand in the following, we focus on this class. Thedeformation highly depends on the viscosity ratio, asillustrated by the strain rates along the vertical z‐axisof the jellyfish (Figure 6b). The lower the viscosityratio is, the higher the strain rates are, but they arealways extensional in the tail and compressional inthe head. Obviously, when ms � 100, the slab doesnot deform and the head and tail do not develop.
[17] For high viscosity contrast, the radius ofcurvature Rw also decreases through time until itreaches a minimum value (Figure 6c). This indicatesthat, regardless of the viscosity ratio, the plate willtend toward an optimal shape (for an infinite domain
Figure 5. Geometry of the plate when subducted with an initial slab dip a: (a and c) a = 60° and (b and d) a = 30°.Figures 5a and 5b show across‐strike profiles, regularly sampled in time (n = 20), and Figures 5c and 5d give a 3D viewof the plate geometry when it reaches ∼660 km depth. The y‐velocity on the surface of the plate is color‐coded.
GeochemistryGeophysicsGeosystems G3G3 LOISELET ET AL.: SUBDUCTING SLABS 10.1029/2010GC003172
8 of 21
in the vertical direction), although this might requirea very long descent time for a very large viscosityratio. In all cases, the velocity increases graduallyduring the early evolutionary stages of the jellyfishat shallow depths; it reaches a maximum value, andeventually decreases when plate penetration ishindered by the undeformable bottom of the modelexperiment (Figure 6d).
[18] Interestingly, the viscosity ratio affects thesinking velocity. The slab penetrates faster into themantle when ms is high (ms = 100) and the velocityreaches its maximum value at greater depths than forless viscous slabs. When the viscosity ratio is low(ms = 1), the velocity starts to decrease at rathershallow depths (∼0.35). These results can be ex-plained by the joint effects of (i) the plate bulk mass(because the high viscous plate remained relativelyundeformed, the boundary flux condition near thesurface imposes a larger mass flux and thus largernegative buoyancy), (ii) plate stretching in the tail(which for low viscosity slabs, favors viscous dis-sipation in the surrounding mantle and preventsefficient stress transmission) and (iii) the passiveresistance of the bottom of the mantle. Note thatthese results apparently differ from the solution ob-tained by Hadamard [1911] and Rybczynski [1911]
which predicts that the sinking velocity shoulddecrease as the viscosity contrast increases. This isactually not very surprising because the latter solu-tion only applies to a constant volume, deformingspherical bubble characterized by a lower viscositythan the surrounding fluid.
[19] Both extensive and compressive strain rates arelarger in the tails and in the heads of low viscosityjellyfishes than of the high viscosity ones, implyingthat the sinking velocity of low viscosity slabs tendsmore rapidly to the Stokes velocity of the jellyfishhead; this velocity yet remains lower than the sink-ing velocity of highly viscous slabs that are morenegatively buoyant simply because of the largerresulting plate volume.
3.5. Viscosity Stratification Between UpperMantle and Lower Mantle
[20] Scaled analog experiments of the subductionprocess [Funiciello et al., 2003; Griffiths et al.,1995; Guillou‐Frottier et al., 1995; Kincaid andOlson, 1987; Schellart, 2004] and numerical stud-ies of subduction systems [Behounkova andČížková, 2008; Christensen, 1996; Čížková et al.,2007; Davies, 1995; Enns et al., 2005; Gaherty
Figure 6. (a) Cross sections at selected depths along‐strike (black) and across‐strike (gray) and classification as func-tion of the plate to upper mantle viscosity ratio ms (see Table 1). Framed profiles are a selection of geologically plausiblescenarios. (b) Vertical strain rate _"zz profile along the central axis of the plate (x = 0.5 and y = 0.5). (c) Radius of curvatureof the jellyfish headRw as a function of maximum penetration depth and ms. (d) Velocity of the plate head as a function ofplate depth and ms.
GeochemistryGeophysicsGeosystems G3G3 LOISELET ET AL.: SUBDUCTING SLABS 10.1029/2010GC003172
9 of 21
and Hager, 1994; Goes et al., 2008; Houseman andGubbins, 1997; Schellart et al., 2007; Tackley,1993; Tao and O’Connell, 1993; Yoshioka andWortel, 1995; Zhong and Gurnis, 1995] havealready illustrated themodes of deformation of a stiffsubducted slab reaching a fluid interface character-ized by a viscosity and/or density increase. Thesestudies have shown the importance of the densitycontrast [Christensen and Yuen, 1984] and viscosityratio [Kárason, 2002; Kincaid and Olson, 1987] ingoverning whether the slab will lie along the inter-face, sink through it, or buckle and pile up at theinterface [Ribe, 2003]. Here, we study the evolutionof the jellyfish shape (i.e., low viscous slab) whenthe slabmeets the 660 km boundary, whichwe eitherdefine as a viscosity or density contrast between theupper and lower mantle.
[21] Figure 7 summarizes the behavior of the plate asit forms a jellyfish shape and/or penetrates into thelower mantle as a function of ms, the viscosity ratio
between the slab and the upper mantle, and ml, theviscosity ratio between the lower and upper mantle.
[22] We observe a range of subducting plate shapes,with or without stratification boundary penetration,an indication that several factors are involved in thestyle of slab deformation when a fluid interface ispresent. We can define four different cases:
[23] (a) Jellyfishing (i.e., formation of a jellyfishshape) and penetration (ms < 100 and ml < 100). Theplate has a sufficiently low viscosity to transforminto a jellyfish. The jellyfish head radius of curvatureRw is low (Figure 8a). The stratification is weakenough to permit the slab to sink into the lowermantle with minor deformation of the mantle strat-ification discontinuity. The plate continues to sinkwith a velocity decrease but without any interruption(Figure 8b). The interface deflects around the slabto form a blob and slowly collapses at the platesinking velocity.
Figure 7. Different cases of slab geometry and slab penetration at the interface between the upper and lower mantle.Along‐strike (black) and across‐strike (gray) sections of the slab, as a function of the slab to upper mantle viscosity ratioms and the lower mantle to upper mantle viscosity ratio ml. Solid black lines show the upper/lower mantle boundary.
GeochemistryGeophysicsGeosystems G3G3 LOISELET ET AL.: SUBDUCTING SLABS 10.1029/2010GC003172
10 of 21
[24] (b) Jellyfishing and no penetration (ms < 100 andml > 100). The plate transforms into jellyfish butdoes not penetrate the lower mantle. The plate stopsclose to the stratification boundary and the jellyfishhead flattens. This case is also characterized by arapid increase in Rw when the plate reaches theinterface, followed by a phase of decreasing Rw
(Figure 8a).
[25] (c) No jellyfishing and penetration (ms > 100and ml < 100). The plate is too viscous and cannotevolve toward a jellyfish shape before it reaches theupper/lower mantle boundary but crosses it becausethe viscosity ratio ml is low enough. Consequently,the deflected interface collapses around the quasi‐rigid slab. The viscosity ratio between the plate andthe fluid decreases in the lower mantle allowingplate thickening in the lower fluid.
[26] (d) No jellyfishing and no penetration (ms > 100and ml > 100). The plate does not cross the stratifi-cation boundary and keeps a slab shape because theviscosity ratio with the surrounding mantle is toohigh. Furthermore the strong viscosity contrast withlower mantle does not permit slab deformation andslab penetration. The interface stays straight.
[27] Our results therefore demonstrate that the pen-etration of the plate into the lower mantle mainlydepends on mantle stratification while the wideningof the slab tip and jellyfish formation mostlydepends on the slab strength (i.e., viscosity ratiobetween the subducting plate and the surroundingmantle).
[28] Note that all slabs should ultimately penetrate ifgiven sufficient time. Here, we define penetration
mode when the characteristic slab sinking velocity iscomparable to the characteristic penetration veloc-ity, i.e., the slab does not pile up on the upper mantle/lower mantle interface.
3.6. Density Stratification Between Upperand Lower Mantle
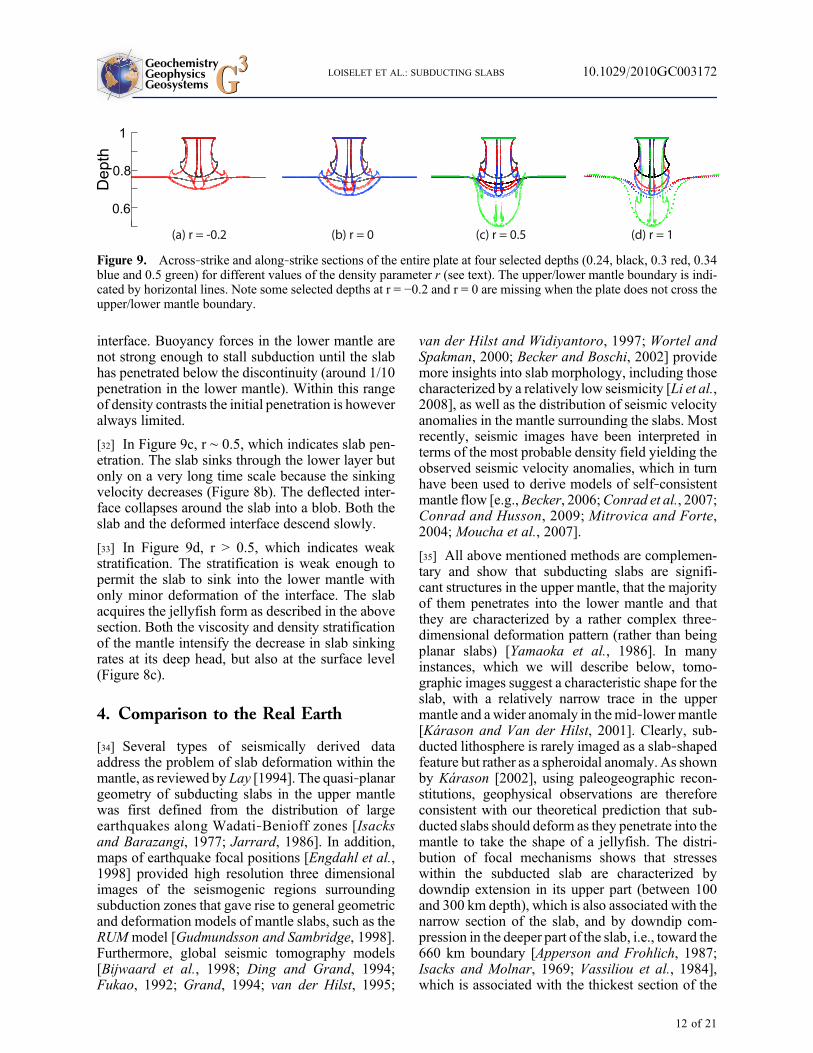
[29] To investigate the influence of the variousdensity contrasts between the sinking slab, uppermantle and lower mantle, we used the criticaldimensionless parameter r defined by Kincaid andOlson [1987] (Figure 9) in which the slab/lowermantle density contrast is normalized by the slab/upper mantle density contrast: r = (rs − rlm)/(rs −rum). r = 1 corresponds to a uniformly dense fluid(no density contrast between the upper and lowermantle), while negative values of r correspond to adenser lower mantle than the sinking slab. Resultsare given for −0.2 < r < 1.0 (Figures 8 and 9). Weidentify four cases in Figure 9:
[30] In Figure 9a, r = −0.2, which indicates strongstratification and no slab penetration. While the slabsinks through the upper mantle and reaches thediscontinuity, its deformation is controlled by theviscosity ratio between the slab and the uppermantle. The leading edge thickens when it meets theundeformable interface. Rw increases and the sink-ing velocity decreases (Figures 8a and 8b).
[31] In Figure 9b, r ∼ 0, which indicates partial slabpenetration into the lower mantle. Sinking rates arelower than when r = −0.2. Rw increases (Figures 8aand 8b) when the slab reaches the mantle disconti-nuity. The leading edge of the slab reclines onto the
Figure 8. (a) Radius of curvature Rw, (b) velocity of slab tip, and (c) velocity of slab top measured as a function of themaximum plate penetration depth for different lower to upper mantle viscosity ratio ml (black), and density indices r (seetext). The slab to upper mantle viscosity ratio ms is set to 10.
GeochemistryGeophysicsGeosystems G3G3 LOISELET ET AL.: SUBDUCTING SLABS 10.1029/2010GC003172
11 of 21
interface. Buoyancy forces in the lower mantle arenot strong enough to stall subduction until the slabhas penetrated below the discontinuity (around 1/10penetration in the lower mantle). Within this rangeof density contrasts the initial penetration is howeveralways limited.
[32] In Figure 9c, r ∼ 0.5, which indicates slab pen-etration. The slab sinks through the lower layer butonly on a very long time scale because the sinkingvelocity decreases (Figure 8b). The deflected inter-face collapses around the slab into a blob. Both theslab and the deformed interface descend slowly.
[33] In Figure 9d, r > 0.5, which indicates weakstratification. The stratification is weak enough topermit the slab to sink into the lower mantle withonly minor deformation of the interface. The slabacquires the jellyfish form as described in the abovesection. Both the viscosity and density stratificationof the mantle intensify the decrease in slab sinkingrates at its deep head, but also at the surface level(Figure 8c).
4. Comparison to the Real Earth
[34] Several types of seismically derived dataaddress the problem of slab deformation within themantle, as reviewed by Lay [1994]. The quasi‐planargeometry of subducting slabs in the upper mantlewas first defined from the distribution of largeearthquakes along Wadati‐Benioff zones [Isacksand Barazangi, 1977; Jarrard, 1986]. In addition,maps of earthquake focal positions [Engdahl et al.,1998] provided high resolution three dimensionalimages of the seismogenic regions surroundingsubduction zones that gave rise to general geometricand deformation models of mantle slabs, such as theRUM model [Gudmundsson and Sambridge, 1998].Furthermore, global seismic tomography models[Bijwaard et al., 1998; Ding and Grand, 1994;Fukao, 1992; Grand, 1994; van der Hilst, 1995;
van der Hilst and Widiyantoro, 1997; Wortel andSpakman, 2000; Becker and Boschi, 2002] providemore insights into slab morphology, including thosecharacterized by a relatively low seismicity [Li et al.,2008], as well as the distribution of seismic velocityanomalies in the mantle surrounding the slabs. Mostrecently, seismic images have been interpreted interms of the most probable density field yielding theobserved seismic velocity anomalies, which in turnhave been used to derive models of self‐consistentmantle flow [e.g.,Becker, 2006;Conrad et al., 2007;Conrad and Husson, 2009; Mitrovica and Forte,2004; Moucha et al., 2007].
[35] All above mentioned methods are complemen-tary and show that subducting slabs are signifi-cant structures in the upper mantle, that the majorityof them penetrates into the lower mantle and thatthey are characterized by a rather complex three‐dimensional deformation pattern (rather than beingplanar slabs) [Yamaoka et al., 1986]. In manyinstances, which we will describe below, tomo-graphic images suggest a characteristic shape for theslab, with a relatively narrow trace in the uppermantle and a wider anomaly in themid‐lowermantle[Kárason and Van der Hilst, 2001]. Clearly, sub-ducted lithosphere is rarely imaged as a slab‐shapedfeature but rather as a spheroidal anomaly. As shownby Kárason [2002], using paleogeographic recon-stitutions, geophysical observations are thereforeconsistent with our theoretical prediction that sub-ducted slabs should deform as they penetrate into themantle to take the shape of a jellyfish. The distri-bution of focal mechanisms shows that stresseswithin the subducted slab are characterized bydowndip extension in its upper part (between 100and 300 km depth), which is also associated with thenarrow section of the slab, and by downdip com-pression in the deeper part of the slab, i.e., toward the660 km boundary [Apperson and Frohlich, 1987;Isacks and Molnar, 1969; Vassiliou et al., 1984],which is associated with the thickest section of the
Figure 9. Across‐strike and along‐strike sections of the entire plate at four selected depths (0.24, black, 0.3 red, 0.34blue and 0.5 green) for different values of the density parameter r (see text). The upper/lower mantle boundary is indi-cated by horizontal lines. Note some selected depths at r = −0.2 and r = 0 are missing when the plate does not cross theupper/lower mantle boundary.
GeochemistryGeophysicsGeosystems G3G3 LOISELET ET AL.: SUBDUCTING SLABS 10.1029/2010GC003172
12 of 21
slab. Such a distribution of stress, and thus strainrate, along the subducting plate is identical to thatpredicted in our models of a slab transforming intoa jellyfish (Figure 3c).
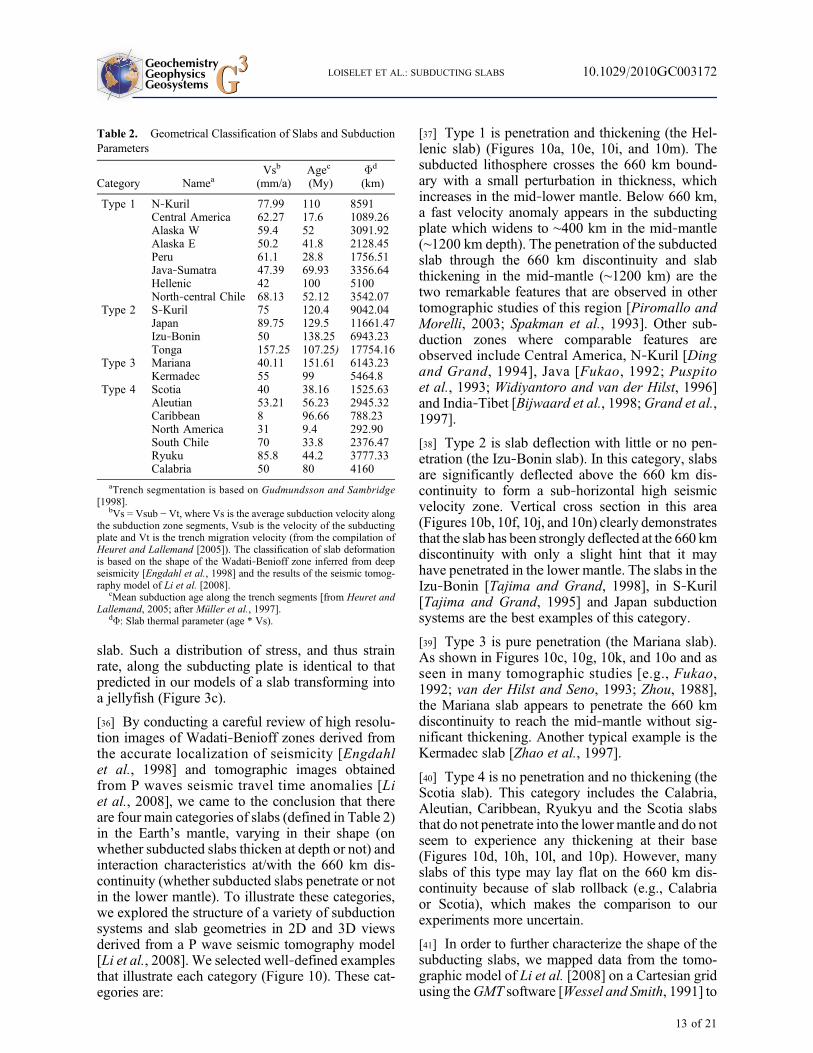
[36] By conducting a careful review of high resolu-tion images of Wadati‐Benioff zones derived fromthe accurate localization of seismicity [Engdahlet al., 1998] and tomographic images obtainedfrom P waves seismic travel time anomalies [Liet al., 2008], we came to the conclusion that thereare four main categories of slabs (defined in Table 2)in the Earth’s mantle, varying in their shape (onwhether subducted slabs thicken at depth or not) andinteraction characteristics at/with the 660 km dis-continuity (whether subducted slabs penetrate or notin the lower mantle). To illustrate these categories,we explored the structure of a variety of subductionsystems and slab geometries in 2D and 3D viewsderived from a P wave seismic tomography model[Li et al., 2008]. We selected well‐defined examplesthat illustrate each category (Figure 10). These cat-egories are:
[37] Type 1 is penetration and thickening (the Hel-lenic slab) (Figures 10a, 10e, 10i, and 10m). Thesubducted lithosphere crosses the 660 km bound-ary with a small perturbation in thickness, whichincreases in the mid‐lower mantle. Below 660 km,a fast velocity anomaly appears in the subductingplate which widens to ∼400 km in the mid‐mantle(∼1200 km depth). The penetration of the subductedslab through the 660 km discontinuity and slabthickening in the mid‐mantle (∼1200 km) are thetwo remarkable features that are observed in othertomographic studies of this region [Piromallo andMorelli, 2003; Spakman et al., 1993]. Other sub-duction zones where comparable features areobserved include Central America, N‐Kuril [Dingand Grand, 1994], Java [Fukao, 1992; Puspitoet al., 1993; Widiyantoro and van der Hilst, 1996]and India‐Tibet [Bijwaard et al., 1998;Grand et al.,1997].
[38] Type 2 is slab deflection with little or no pen-etration (the Izu‐Bonin slab). In this category, slabsare significantly deflected above the 660 km dis-continuity to form a sub‐horizontal high seismicvelocity zone. Vertical cross section in this area(Figures 10b, 10f, 10j, and 10n) clearly demonstratesthat the slab has been strongly deflected at the 660 kmdiscontinuity with only a slight hint that it mayhave penetrated in the lower mantle. The slabs in theIzu‐Bonin [Tajima and Grand, 1998], in S‐Kuril[Tajima and Grand, 1995] and Japan subductionsystems are the best examples of this category.
[39] Type 3 is pure penetration (the Mariana slab).As shown in Figures 10c, 10g, 10k, and 10o and asseen in many tomographic studies [e.g., Fukao,1992; van der Hilst and Seno, 1993; Zhou, 1988],the Mariana slab appears to penetrate the 660 kmdiscontinuity to reach the mid‐mantle without sig-nificant thickening. Another typical example is theKermadec slab [Zhao et al., 1997].
[40] Type 4 is no penetration and no thickening (theScotia slab). This category includes the Calabria,Aleutian, Caribbean, Ryukyu and the Scotia slabsthat do not penetrate into the lowermantle and do notseem to experience any thickening at their base(Figures 10d, 10h, 10l, and 10p). However, manyslabs of this type may lay flat on the 660 km dis-continuity because of slab rollback (e.g., Calabriaor Scotia), which makes the comparison to ourexperiments more uncertain.
[41] In order to further characterize the shape of thesubducting slabs, we mapped data from the tomo-graphic model of Li et al. [2008] on a Cartesian gridusing theGMT software [Wessel and Smith, 1991] to
Table 2. Geometrical Classification of Slabs and SubductionParameters
Category NameaVsb
(mm/a)Agec
(My)Fd
(km)
Type 1 N‐Kuril 77.99 110 8591Central America 62.27 17.6 1089.26Alaska W 59.4 52 3091.92Alaska E 50.2 41.8 2128.45Peru 61.1 28.8 1756.51Java‐Sumatra 47.39 69.93 3356.64Hellenic 42 100 5100North‐central Chile 68.13 52.12 3542.07
aTrench segmentation is based on Gudmundsson and Sambridge[1998].
bVs = Vsub − Vt, where Vs is the average subduction velocity alongthe subduction zone segments, Vsub is the velocity of the subductingplate and Vt is the trench migration velocity (from the compilation ofHeuret and Lallemand [2005]). The classification of slab deformationis based on the shape of the Wadati‐Benioff zone inferred from deepseismicity [Engdahl et al., 1998] and the results of the seismic tomog-raphy model of Li et al. [2008].
cMean subduction age along the trench segments [from Heuret andLallemand, 2005; after Müller et al., 1997].
dF: Slab thermal parameter (age * Vs).
GeochemistryGeophysicsGeosystems G3G3 LOISELET ET AL.: SUBDUCTING SLABS 10.1029/2010GC003172
13 of 21
compute horizontal cross‐sections at 100 km inter-vals of the seismic velocity anomalies from whichwe estimated the surface area of the slabs as theypenetrate into the mantle, from 100 to 1400 kmdepths. In that way, we optimize the accuracy ofestimates of the slab thinning/thickening with depth.In fact, at each depth, we considered three contoursof the velocity anomaly contrast (minimum, meanand maximum relative velocities) to avoid artifactsarising from the inherent resolution of tomographicmodels. Note that no unique values for the seismicvelocity contrasts can be selected for they vary withdepth, in particular because of the thermal relaxationof the slabs during their downward route; contouring
is therefore arbitrary and to some extent, subjective.We normalized the surface areas comprised insideeach of the contours by the contour area at the sur-face to obtain dimensionless vertical profiles of theslab thickness (extracted from horizontal section).This procedure was also performed on some of ournumerical model results (Figure 10).
[42] These values for slab thickness as they penetratein the mantle are more relevant qualitatively thanquantitatively. Although Li et al. [2008] suggest thatthe deep mantle parts of the slab structures are wellresolved and are not affected by artifacts arisingfrom the uneven distribution of seismic sources and
Figure 10. (a–d) Vertical profiles across seismic tomographymodel of Li et al. [2008] (global P wavemodel) and (e–p)slab thickening illustrated by the evolution of the predicted sectional area (by numerical models, color curves) andsectional area inferred from geophysical data (gray areas) as a function of maximum penetration depth. This is shown forranges of slab to upper mantle viscosity ratio (red curves, Figures 10e–10h), lower to upper mantle viscosity ratio (bluecurves, Figures 10i–10l), and density contrast between the slab and the lower mantle (green curves, Figures 10m–10p),for the Hellenic (Figures 10a, 10e, 10i, and 10m), Izu‐Bonin (Figures 10b, 10f, 10j, and 10n),Mariana (Figures 10c, 10g,10k, and 10o) and Scotia (Figures 10d, 10h, 10l, and 10p) subduction zones which are type 1, 2, 3 and 4 respectively. It isonly for visualization/illustration purpose that the vertical sections of seismic tomography models are provided, and thecomparison remains qualitative.
GeochemistryGeophysicsGeosystems G3G3 LOISELET ET AL.: SUBDUCTING SLABS 10.1029/2010GC003172
14 of 21
receivers, which suggest some robustness, we em-phasize that the comparison of experiments to realEarth should be taken with care.
[43] For each of the four slab categories, wecompared thickness profiles from the tomographicmodel to those obtained from numerical modelsin which we varied the viscosity ratio ms between1 and 100, the viscosity ratio ml between 1 and 1000and the density parameter r between −0.2 and 1(Figure 10). To facilitate the comparison betweendata and models, we show model‐predicted surfacearea profiles for model times that best correspond tosubduction/penetration level suggested by each ofthe four tomographic images. The tentacles from thepredicted model as described in results part arenot considered (i.e., we include tentacles in surfacearea calculations) because the resolution of seismictomography models is not sufficient to characterizetheir geometry.
[44] We first notice that, in both the numericalmodels, where the viscosity mantle stratification(ml > 1) or the density mantle stratification (r < 1)impacts on plate penetration and on its deformation,and in some of the tomographic images, the forma-tion of the jellyfish head and the correspondingthickening of the slab usually occurs deeper than theimposed viscosity/density jump at 660 km depth.This implies that, if in some cases the discontinuityimpacts the thickening of the subducting slab, theformation of the jellyfish may take place at greaterdepths and is thus likely to result from an indepen-dent process, as advocated by our numerical modelresults.
[45] Then, in the first two categories, slab thickeningoccurs at (i.e., type 2, Izu Bonin slab, Figures 10b,10f, 10j, and 10n) or below the 660 km discontinuity(i.e., type 1, Hellenic slab, Figures 10a, 10e, 10i, and10m); comparing tomographic models and theresults of the numerical models suggests that theformation of the jellyfish head is best explainedeither by a low increase in viscosity from upper tolower mantle (ml ∼ 10), consistent with previousstudies based on the interpretation of the geoid[Moresi and Gurnis, 1996] or by a weak jump indensity between the upper and lower mantle (r ∼ 0.5),as suggested by other model results [Christensenand Yuen, 1984]. In nature, we found it impossibleto discriminate the two causes; a combination ofboth is probably responsible for slab thickening. Theobserved surface area versus depth profiles are bestexplained with a relatively low slab viscosity (only∼10–100 times the mantle viscosity), which con-firms the results of Loiselet et al. [2009].
[46] In the third category, theMariana slab displays arather different behavior that suggests that the slabmay be stronger than slabs belonging to type 1, anddoes not evolve into a jellyfish shape as it descendsthrough the upper mantle. The slight thickening thatappears in the slab cross‐sectional area observed atdepths between 1100 and 1650 kmmay be due to therelatively poor resolution of the tomographic imagesat those depths or to a mild density or viscositystratification as suggested by Čížková et al. [1996],Hager and Richards [1989], and Lambeck andJohnston [1998].
[47] In the fourth category, thickening of the Scotiaslab as it approaches the 660 km discontinuity couldbe explained by the formation of a jellyfish head,which in turns requires a relatively low viscosity/strength subducting plate.
[48] In order to evaluate the relationship between thegeometries derived from the analysis of a tomo-graphic model, and the factors that might control itsuch as the density and/or viscosity of subductedslabs, we use the parameter F, introduced byWorteland Vlaar [1988], defined as F = age * Vs (whereage is the average age of lithosphere at the time ofsubduction and Vs is the average velocity of sub-duction along trench segments) (see Table 2). Thisparameter can be interpreted as a proxy for thethermal maturation of the slab, which affects boththe viscosity and density of the slab. There is a cleardistribution of slab categories (type 1, 2, 3 or 4) as afunction of F (Figure 11): (i) slabs with small ther-mal parameters F (or hot slabs) more easily jellyfish(i.e., type 1) than those with larger values for F (i.e.,type 3); and (ii) slabs with large values of F tend tosubduct more easily for they are presumably stifferand denser. For very small thermal parameters,thermal diffusion may have had enough time to heatup the slabs so that they do not show up in seismictomography. Alternatively, heated slabs may havelost their initial negative buoyancy and are no longerable to continue to subduct to greater depths than thetransition zone (type 4, Calabria, Scotia slabs). Last,slabs of type 2 seem to be at odds with our previousanalysis, for they appear to pond on the 660 kmdiscontinuity, whereas in our models stiff slabs arepredicted to penetrate into the lower mantle and notto deform. The departure between our models andthe predictions given by the thermal parameter Fmay however reflect the fact that this proxy does notapply for slabs of type 2 (Izu‐Bonin, S‐Kuril, Japanand Tonga slabs).
[49] In our numerical models, and thus in our inter-pretation of the various slab geometries suggested by
GeochemistryGeophysicsGeosystems G3G3 LOISELET ET AL.: SUBDUCTING SLABS 10.1029/2010GC003172
15 of 21
tomographic models, we have assumed that slabmotion is primarily driven by its buoyancy, i.e., themain force acting on the subducting oceanic litho-sphere is the gravitational force arising from the highdensity of the plate with respect to the surroundingmantle. This has led us to interpret the observedthickening of weak slabs in the vicinity of the660 km discontinuity as resulting from the for-mation of a jellyfish head in response to viscousdrag between the slab and the mantle, potentiallyenhanced by the presence of a viscosity and/ordensity contrast between the upper and lower man-tle. The former process (jellyfishing), in turn impliesthat the viscosity ratio between the slab and themantle is relatively small (order 10), in other wordsthat slabs are relatively weak. The latter process(interaction with the 660 km discontinuity) is sup-ported by the compressive nature of the focal mech-anisms of deep earthquakes [Isacks and Molnar,1969], which clearly indicates the presence ofresisting forces deeper than the transition zone,resulting from an increase in viscosity or a decreasein the density contrast between the slab and thesurrounding mantle, and thus a decrease in thedriving force.
[50] However, another explanation for the thicken-ing of the slab along the 660 km discontinuity relieson the subduction (or penetration) velocity beingimposed to the slab by other forces, either originat-ing at the mid‐ocean ridge (i.e., ridge push) or alongother segments of the subducting lithosphere. If thisis true and the trench migration velocity is signifi-cantly higher than the penetration velocity of the slabin the lower mantle (due to resistance force), slabswill have to deform on the 660 km discontinuity, toflatten and lie horizontally on it [Christensen, 1996;Enns et al., 2005; Griffiths et al., 1995; Guillou‐
Frottier et al., 1995; Olbertz et al., 1997; Tagawaet al., 2007]. This scenario may explain why theIzu‐Bonin slab flattens on the 660 km discontinuity[van der Hilst and Seno, 1993] whereas the Marianaslab penetrates it; similarly, the change in the styleof subduction from the northern to southern Kuril[Ding and Grand, 1994; Fukao, 1992] is a potentialillustration.
5. Discussion
[51] Seismic tomography images provide evidencefor a strong deformation of some sections of thesubducted lithosphere in the Earth’s mantle. In thedeep Earth’s interior, some slabs may flatten andpond above or within the transition zone, suchas beneath the Chilean Andes, the Aleutian, theS‐Kuril, Japan, and Izu‐Bonin. Other slabs tend tobe deflected and lie sub‐horizontally on the upper tolower mantle transition region before (at least forsome of them) penetrating into themid‐lowermantle(such as in the N‐Kuril, Hellenic, and the Philippinessubduction systems), or well into the lower mantle(such as beneath the Peruvian Andes, Java, Marianaand Kermadec). In the latter case, slabs narrow in theupper mantle and anomalously thicken in the mid‐lower mantle. Some authors explain this feature asresulting from a buckling instability [Griffiths andTurner, 1988; Ribe et al., 2007]. Alternatively,Christensen and Yuen [1984] and Kárason [2002]showed that the large mid‐mantle seismic anomalycould either be explained by geochemical and min-eralogical changes in the slab as a function of depthor by the presence of a substantial viscosity jumpat the 660 km discontinuity that modulates thepenetration of an isoviscous plate.
Figure 11. Geometrical classification of slabs (types 1 (green), 2 (black), 3 (red) and 4 (blue), see text) and correlationto the thermal parameter � [Wortel and Vlaar, 1988]. F is the product of the average age of lithosphere and of thesubduction rate (age * Vs) along the trench segment (defined from Gudmundsson and Sambridge [1998]).
GeochemistryGeophysicsGeosystems G3G3 LOISELET ET AL.: SUBDUCTING SLABS 10.1029/2010GC003172
16 of 21
[52] Here we propose, on the basis of the results of alarge number of numerical experiments and theircomparison to tomographic images, that the defor-mation of the subducting lithosphere mainly resultsfrom the interaction of a relatively weak slab withthe surrounding viscous mantle, leading to thedeformation of the planar lithosphere into a jellyfish.
[53] For each of the four subduction categoriesconsidered here, the comparison with model sce-narios suggests that the viscosity ratios between theslab and the upper mantle ranges between 10 and100. This is in accordance with Husson [2006] whofound a good agreement between the topographyobserved above subduction zones and the dynamictopography computed assuming isoviscous flow inthe mantle. Čížková et al. [2002] also found thatslabs must be relatively weak in order to be deflectedin the transition zone. Based on the results of analogexperiments, [Funiciello et al., 2008; Schellart,2009] suggested that the observed trench and platevelocities and slab bending respectively are indica-tive of relatively weak slabs. More comprehensivereviews are given by Billen [2008] and Becker andFaccenna [2009].
[54] The low slab strength we predict here is at oddswith the setup of many other analog and numericalmodels [Capitanio et al., 2007; Clark et al., 2008;Conrad and Hager , 1999; Funiciello et al. ,2003; Morra et al., 2006; Royden and Husson,2006; Schellart, 2004; Stegman et al., 2006; Zhongand Gurnis, 1994] where the viscosity ratio be-tween the subducted lithosphere and the surroundingmantle is set between 102 and 105. Although rockstrength experiments also predict stiffer slabs thansuggested here [see, e.g., Kohlstedt et al., 1995], ourpredicted range of viscosity ratios is in accordancewith global models [Zhong and Davies, 1999] thatsuggest that slabs should be 100 times more viscousthan the upper mantle in order to fit geoid anddynamic topography data. Loiselet et al. [2009]independently suggest that the longitudinal curva-ture of slabs can only be achieved if the slab tomantle viscosity ratio is at most 102.
[55] In summary, any model that predicts a signifi-cant thickening of slabs descending in the uppermantle requires a weak subducted lithosphere, i.e., atmost two orders of magnitude stiffer than the uppermantle. Higher than that, slabs are too strong todeform at the length‐scale of the upper mantle. Thisresult in turn indicates that slabs have limited time toacquire a characteristic jellyfish shape. Our inter-pretation of the seismically inferred thickening of
slabs in the upper mantle applies well to youngsubduction zones, such as Scotia. In contrast, Loubetet al. [2009] have interpreted the apparent thicken-ing of slabs in older, longer‐lasting subductionzones as resulting from the periodic buckling of arelatively weak slab at the 660 km discontinuity bysimple accumulation of subducting material.
[56] The comparison between our model predictionsand seismic tomography data also suggests that thesubducting plate should slow down and pond at the660 km discontinuity if a viscosity or density con-trast exists between upper and lower mantle, asalready proposed by for example Enns et al. [2005].The apparent slab widening at depth suggests thatthe slab is indeed stronger than the mantle butunfortunately an accurate estimate of the viscositycontrast cannot be obtained independently of anydensity variation that might exist across the 660 kmdiscontinuity.
[57] Once the jellyfish penetrates into the lowermantle, the velocity of the subducting plate appearsto remain constant, seemingly in contradiction withZhong and Gurnis [1995] and Christensen [1996]who predicted an acceleration of the slab after pen-etrating the 660 km discontinuity. The difference ininterpretation may occur because in their modelsthere are (i) phase transitions with a negativeClapeyron slope along the 660‐kmdiscontinuity thatfoster subduction, or, (ii) alternatively, because thetrench is actively retreating, while in our models,slabs subduct vertically.
6. Conclusions
[58] We have investigated the behavior of a slabsubducting in the Earth’s mantle driven by its neg-ative buoyancy. We have showed that a relativelyweak plate (at most two orders of magnitude timesstiffer than the surrounding mantle) will form acharacteristic jellyfish shape as it falls through themantle. This is the optimal shape that a deform-able object falling in a viscous fluid will acquire,regardless of its original shape, in order to probablyminimize the viscous dissipation in the fluid. Thejellyfish consists of a wide head experiencing ver-tical shortening and a long tail experiencing verticallengthening. This pattern of deformation is con-sistent with the observed distribution of downdipextensional and compressional stresses along sub-ducting slabs and with observed slab geometriesat mid‐mantle depths that are derived from tomo-graphic images. This characteristic jellyfish shape
GeochemistryGeophysicsGeosystems G3G3 LOISELET ET AL.: SUBDUCTING SLABS 10.1029/2010GC003172
17 of 21
naturally evolves from that of a planar subductingplate, but the few other initial shapes that we testednumerically or in analog models also adopt similarbehaviors and all tend to jellyfish shape. We haveused a linear viscosity for both the slab and themantle, which implies that strain rate and, subse-quently, subduction velocity linearly scales with theimposed density contrast between the slab and themantle. The value of the density contrast betweenthe slab and the surrounding mantle thus does notinfluence the geometry of the subduction processnor the depth range over which the jellyfish headforms.
[59] The plate to mantle viscosity ratio is importantto the deformation of the plate. Lithosphere strengthis crucial physical parameter that controls thedynamics of subduction zone.
[60] By comparing model predictions with obser-vations (inferred from seismic tomography andearthquake focal mechanism solutions) we thereforeprovide additional constrains on the viscosity con-trast between subducting slabs and the surroundingmantle by suggesting that slabs are weak. The finaljellyfish shape also depends on the initial slab width,or more precisely, its aspect ratio. Furthermore, incases where the initial slab is not vertical, we haveshown that the slab turns into an asymmetricaljellyfish. This “spoon” shape is consistent withmany observed geometries (derived from seismictomography and from the distribution of earth-quakes in Wadati‐Benioff zones); the Hellenic slabis one of the most striking examples of such spoon‐shaped subducting slabs.
[61] Last, one way to reconcile the observation thatsome slabs are thickened around the 660 km dis-continuity while others seem to thicken at mid‐ tolower mantle depths or deeper, is to consider (i) thatthe subducted plate is in general sufficiently weak tobecome a jellyfish during its fall in the upper mantleand (ii) that it meets at the 660 km depth a low vis-cosity and/or high density jump that lowers itssinking velocity.
Acknowledgments
[62] This work was supported by the College doctoral deBretagne (Université Européenne de Bretagne) (C.L.) and by a“Chaire d’Excellence Senior de l’ANR” (J.B.). We thankP. Fullsack for stimulating discussions. Suggestions by anony-mous reviewers and by Editor Thorsten Becker helped to greatlyimprove this paper.
References
Apperson, K. D., and C. Frohlich (1987), The relationshipbetween Wadati‐Benioff zone geometry and P, T and B axesof intermediate and deep focus earthquakes, J. Geophys.Res., 92, 13,821–13,831.
Becker, T. W. (2006), On the effect of temperature and strain‐rate dependent viscosity on global mantle flow, net rotation,and plate‐driving forces, Geophys. J. Int., 167, 943–957,doi:10.1111/j.1365-246X.2006.03172.x.
Becker, T. W., and L. Boschi (2002), A comparison of tomo-graphic and geodynamic mantle models, Geochem. Geophys.Geosyst., 3(1), 1003, doi:10.1029/2001GC000168.
Becker, T. W., and C. Faccenna (2009), A review of the role ofsubduction dynamics for regional and global plate motions,in Subduction Zone Geodynamics, edited by S. Lallemandand F. Funiciello, pp. 3–34, doi:10.1007/978-3-540-87974-9_1, Springer, Berlin.
Behounkova, M., and H. Čížková (2008), Long‐wavelengthcharacter of subducted slabs in the lower mantle, EarthPlanet. Sci. Lett., 275, 43–53, doi:10.1016/j.epsl.2008.07.059.
Bevis, M. (1986), The curvature of Wadati‐Benioff zones andthe torsional rigidity of subducting plates,Nature, 323, 52–53,doi:10.1038/323052a0.
Bijwaard, H., W. Spakman, and E. R. Engdahl (1998), Closingthe gap between regional and global travel time tomography,J. Geophys. Res., 103(B12), 30,055–30,078.
Billen, M. I. (2008), Modeling the dynamics of subductingslabs, Annu. Rev. Earth Planet. Sci., 36(1), 325–356,doi:10.1146/annurev.earth.36.031207.124129.
Billen, M. I., and M. Gurnis (2005), Constraints on subductingplate strength within the Kermadec trench, J. Geophys. Res.,110, B05407, doi:10.1029/2004JB003308.
Braun, J., C. Thieulot, P. Fullsack, M. DeKool, C. Beaumont,and R. Huismans (2008), DOUAR: A new three‐dimensionalcreeping flow numerical model for the solution of geologicalproblems, Phys. Earth Planet. Inter., 171(1–4), 76–91,doi:10.1016/j.pepi.2008.05.003.
Capitanio, F. A., G. Morra, and S. Goes (2007), Dynamicmodels of downgoing plate‐buoyancy driven subduction:Subduction motions and energy dissipation, Earth Planet.Sci. Lett., 262(1–2), 284–297, doi:10.1016/j.epsl.2007.07.039.
Christensen, U. R. (1996), The influence of trench migrationon slab penetration into the lower mantle, Earth Planet.Sci. Lett., 140, 27–39, doi:10.1016/0012-821X(96)00023-4.
Christensen, U., and D. Yuen (1984), The interaction of asubducting lithosphere slab with a chemical or phase bound-ary, J. Geophys. Res., 89, 4389–4402, doi:10.1029/JB089iB06p04389.
Čížková, H., O. Čadek, D. A. Yuen, and H. Zhou (1996),Slope of the geoid spectrum and constraints on mantle vis-cosity stratification, Geophys. Res. Lett., 23(21), 3063–3066, doi:10.1029/96GL02257.
Čížková, H., J. van Hunen, A. P. van den Berg, and N. J. Vlaar(2002), The influence of rheological weakening and yieldstress on the interaction of slabs with the 670 km discontinu-ity, Earth Planet. Sci. Lett., 199, 447–457, doi:10.1016/S0012-821X(02)00586-1.
Čížková, H., J. van Hunen, and A. van den Berg (2007), Stressdistribution within subducting slabs and their deformation inthe transition zone, Phys. Earth Planet. Inter., 161(3–4),202–214, doi:10.1016/j.pepi.2007.02.002.
GeochemistryGeophysicsGeosystems G3G3 LOISELET ET AL.: SUBDUCTING SLABS 10.1029/2010GC003172
18 of 21
Clark, S. R., D. Stegman, and R. D. Muller (2008), Episodicityin back‐arc tectonic regimes, Phys. Earth Planet. Inter.,171(1–4), 265–279, doi:10.1016/j.pepi.2008.04.012.
Conrad, C. P., and B. H. Hager (1999), Effect of plate bendingand fault strength at subduction zones on plate dynamics,J. Geophys. Res., 104, 17,551–17,571, doi:10.1029/1999JB900149.
Conrad, C. P., and L. Husson (2009), Influence of dynamictopography on sea level and its rate of change, Lithosphere,1(2), 110–120, doi:10.1130/L32.1.
Conrad, C. P., M. D. Behn, and P. G. Silver (2007), Globalmantle flow and the development of seismic anisotropy: Dif-ferences between the oceanic and continental upper mantle,J. Geophys. Res., 112, B07317, doi:10.1029/2006JB004608.
Creager, K. C., and T. H. Jordan (1986), Slab penetration intothe lower mantle beneath the Mariana and other island arcsof the northwest Pacific, J. Geophys. Res., 91(B3), 3573–3589, doi:10.1029/JB091iB03p03573.
Davies, G. F. (1995), Penetration of plates and plumes throughthe mantle transition, Earth Planet. Sci. Lett., 133, 507–516,doi:10.1016/0012-821X(95)00039-F.
Di Giuseppe, E., J. van Hunen, F. Funiciello, C. Faccenna, andD. Giardini (2008), Slab stiffness control of trench motion:Insights from numerical models, Geochem. Geophys. Geo-syst., 9, Q02014, doi:10.1029/2007GC001776.
Ding, X.‐Y., and S. P. Grand (1994), Seismic structure of thedeep Kurile subduction zone, J. Geophys. Res., 99(B12),23,767–23,786, doi:10.1029/94JB02130.
Engdahl, E. R., R. van der Hilst, and R. Buland (1998), Globalteleseismic earthquake relocation with improved travel timesand procedures for depth determination, Bull. Seismol. Soc.Am., 88(3), 722–743.
Enns, A., T. W. Becker, and H. Schmeling (2005), Thedynamics of subduction and trench migration for viscositystratification, Geophys. J. Int., 160, 761–775, doi:10.1111/j.1365-246X.2005.02519.x.
Faccenna, C., F. Funiciello, D. Giardini, and P. Lucente(2001), Episodic back‐arc extension during restricted mantleconvection in central Mediterranean, Earth Planet. Sci. Lett.,187, 105–116, doi:10.1016/S0012-821X(01)00280-1.
Fukao, Y. (1992), Seismic tomogram of the Earth’s mantle:Geodynamic implications, Science, 258(5082), 625–630,doi:10.1126/science.258.5082.625.
Fukao, Y., S. Widiyantoro, and M. Obayashi (2001), Stagnantslabs in the upper and lower mantle transition region, Rev.Geophys., 39(3), 291–323, doi:10.1029/1999RG000068.
Funiciello, F., C. Faccenna, D. Giardini, and K. Regenauer‐Lieb (2003), Dynamics of retreating slabs: 2. Insights fromthree‐dimensional laboratory experiments, J. Geophys.Res., 108(B4), 2207, doi:10.1029/2001JB000896.
Funiciello, F., C. Faccenna, A. Heuret, S. Lallemand, E. DiGiuseppe, and T. W. Becker (2008), Trench migration, netrotation and slab‐mantle coupling, Earth Planet. Sci. Lett.,271(1–4), 233–240, doi:10.1016/j.epsl.2008.04.006.
Gaherty, J. B., and B. H. Hager (1994), Compositional vs.thermal buoyancy and the evolution of subducted litho-sphere, Geophys. Res. Lett., 21(2), 141–144, doi:10.1029/93GL03466.
Giardini, D., and J. H. Woodhouse (1984), Deep seismicityand modes of deformation in Tonga subduction zone,Nature, 307, 505–509, doi:10.1038/307505a0.
Goes, S., F. Capitanio, and G. Morra (2008), Evidence oflower‐mantle slab penetration phases in plate motions,Nature, 451, 981–984.
Grand, S. P. (1994), Mantle shear structure beneath the Amer-icas and surrounding oceans, J. Geophys. Res., 99(B6),11,591–11,621, doi:10.1029/94JB00042.
Grand, S. P., R. D. Van der Hilst, and S. Widiyantoro (1997),Global seismic tomography: A snapshot of convection in theEarth, GSA Today, 7, 1–7.
Griffiths, R. W., and S. Turner (1988), Folding of viscousplumes impinging on a density or viscosity interface, Geo-phys. J., 95(2), 397–419, doi:10.1111/j.1365-246X.1988.tb00477.x.
Griffiths, R. W., R. I. Hackney, and R. D. Van Der Hilst(1995), A laboratory investigation of effects of trench migra-tion on the descent of subducted slabs, Earth Planet. Sci.Lett., 133, 1–17, doi:10.1016/0012-821X(95)00027-A.
Gudmundsson, Ó., and M. Sambridge (1998), A regionalizedupper mantle (RUM) seismic model, J. Geophys. Res.,103(B4), 7121–7136, doi:10.1029/97JB02488.
Guillou‐Frottier, L., J. Buttles, and P. Olson (1995), Labora-tory experiments on the structure of subducted lithosphere,Earth Planet. Sci. Lett., 133, 19–34, doi:10.1016/0012-821X(95)00045-E.
Hadamard, J. S. (1911), Mouvement permanent lent d’unesphere liquide et visqueuse dans un fluide visqueux, C. R.Acad. Sci., 152, 1735.
Hager, B. H., and M. A. Richards (1989), Long wavelengthvariation in Earth’s geoid: Physical models and dynamicalimplications, Philos. Trans. R. Soc. London, 328, 309–327,doi:10.1098/rsta.1989.0038.
Heuret, A., and S. Lallemand (2005), Plate motions, slabdynamics and back arc deformation, Phys. Earth Planet.Inter., 149, 31–51, doi:10.1016/j.pepi.2004.08.022.
Houseman, G. A., and D. Gubbins (1997), Deformation ofsubducted oceanic lithosphere, Geophys. J. Int., 131(3),535–551, doi:10.1111/j.1365-246X.1997.tb06598.x.
Isacks, B., and M. Barazangi (1977), Geometry of Benioffzones: Lateral segmentation and downwards bending of thesubducted lithosphere, in Island Arcs, Deep Sea Trenchesand Back‐Arc Basins, Maurice Ewing Ser., vol. 1, editedby M. Talwani and W. C. Pitman III, pp. 99–144, AGU,Washington, D. C.
Isacks, B., and P. Molnar (1969), Mantle earthquake mech-anisms and the sinking of the lithosphere, Nature, 223,1121–1124.
Isacks, B., and P. Molnar (1971), Distribution of stresses in thedescending lithosphere from a global survey of focal mech-anism solutions of mantle earthquakes, Rev. Geophys., 9,103–174, doi:10.1029/RG009i001p00103.
Jarrard, R. D. (1986), Relations among subduction parameters,Rev. Geophys., 24, 217–284, doi:10.1029/RG024i002p00217.
Jordan, T. H. (1977), Lithospheric slab penetration into thelower mantle beneath the Sea of Okhots, J. Geophys., 43,473–496.
Jordan, T. H., and W. S. Lynn (1974), A velocity anomaly inthe lower mantle, J. Geophys. Res., 79, 2679–2685,doi:10.1029/JB079i017p02679.
Kárason, H. (2002), Constraints on mantle convection fromseismic tomography and flow modeling, Ph.D. thesis, Mass.Inst. of Technol., Cambridge.
Kárason, H., and R. Van der Hilst (2001), Tomographic imag-ing of the lowermost mantle with differential times ofrefracted and diffracted core phases (PKP, Pai), J. Geophys.Res., 106, 6569–6587, doi:10.1029/2000JB900380.
GeochemistryGeophysicsGeosystems G3G3 LOISELET ET AL.: SUBDUCTING SLABS 10.1029/2010GC003172
19 of 21
Kido, M., and O. Cadek (1997), Inferences of viscosity fromthe oceanic geoid: Indication of a low viscosity zone belowthe 660‐km discontinuity, Earth Planet. Sci. Lett., 151, 125–137, doi:10.1016/S0012-821X(97)81843-2.
Kincaid, C., and R. W. Griffiths (2003), Laboratory models ofthe thermal evolution of the mantle during rollback subduc-tion, Nature, 425(6953), 58–62, doi:10.1038/nature01923.
Kincaid, C., and P. Olson (1987), An experimental study ofsubduction and slab migration, J. Geophys. Res., 92,13,832–13,840.
Kohlstedt, D. L., B. Evans, and S. J. Mackwell (1995),Strength of the lithosphere: Constraints imposed by labora-tory experiments, J. Geophys. Res., 100(B9), 17,587–17,602, doi:10.1029/95JB01460.
Lambeck, K., and P. Johnston (1998), The viscosity of themantle: Evidence from analysis of glacial‐rebound phenom-ena, in The Earth’s Mantle: Composition, Structure, andEvolution, edited by I. Jackson, pp. 461–502, CambridgeUniv. Press, Cambridge, U. K.
Lay, T. (1994), The fate of descending slabs, Annu. Rev. EarthPlanet. Sci., 22, 33–61, doi:10.1146/annurev.ea.22.050194.000341.
Li, C., R. D. van der Hilst, E. R. Engdahl, and S. Burdick(2008), A new global model for P wave speed variationsin Earth’s mantle, Geochem. Geophys. Geosyst., 9 ,Q05018, doi:10.1029/2007GC001806.
Loiselet, C., L. Husson, and J. Braun (2009), From longitudi-nal slab curvature to slab rheology, Geology, 37(8), 747–750, doi:10.1130/G30052A.1.
Loubet, N., N. M. Ribe, and Y. Gamblin (2009), Deformationmodes of subducted lithosphere at the core‐mantle boundary:An experimental investigation, Geochem. Geophys. Geo-syst., 10, Q10004, doi:10.1029/2009GC002492.
Mitrovica, J. X., and A. M. Forte (2004), A new inference ofmantle viscosity based upon joint inversion of convectionand glacial isostatic adjustment data, Earth Planet. Sci. Lett.,225, 177–189, doi:10.1016/j.epsl.2004.06.005.
Moresi, L., and M. Gurnis (1996), Constraints on the lateralstrength of slabs from three‐dimentional dynamic flowmodels, Earth Planet. Sci. Lett., 138, 15–28, doi:10.1016/0012-821X(95)00221-W.
Morra, G., K. Regenauer‐Lieb, and D. Giardini (2006), Curva-ture of oceanic arcs, Geology, 34(10), 877–880, doi:10.1130/G22462.1.
Moucha, R., A. M. Forte, J. X. Mitrovica, and A. Daradich(2007), Lateral variations in mantle rheology: Implica-tions for convection related surface observables and inferredviscosity models, Geophys. J. Int., 169(1), 113–135,doi:10.1111/j.1365-246X.2006.03225.x.
Müller, R., W. Roest, J. Y. Royer, L. Gahagan, and J. Sclater(1997), Digital isochrons of the world’s ocean floor, J. Geo-phys. Res., 102, 3211–3214, doi:10.1029/96JB01781.
Olbertz, D., M. J. R. Wortel, and U. Hansen (1997), Trenchmigration and subduction zone geometry, Geophys. Res.Lett., 24, 221–224, doi:10.1029/96GL03971.
Olson, P., and H. Singer (1985), Creeping plumes, J. FluidMech., 158, 511–531.
Peltier, W. R. (1996), Mantle viscosity and ice‐age ice sheettomography, Science, 273, 1359–1364, doi:10.1126/science.273.5280.1359.
Piromallo, C., and A. Morelli (2003), P wave tomography ofthe mantle under the Alpine‐Mediterranean area, J. Geophys.Res., 108(B2), 2065, doi:10.1029/2002JB001757.
Piromallo, C., T. W. Becker, F. Funiciello, and C. Faccenna(2006), Three‐dimensional instantaneous mantle flow
induced by subduction, Geophys. Res. Lett., 33, L08304,doi:10.1029/2005GL025390.
Puspito, N. T., Y. Yamanaka, T. Miyatake, K. Shimazaki, andK. Hirahara (1993), Three‐dimensional P wave velocitystructure beneath the Indonesian region, Tectonophysics,220(1–4), 175–192, doi:10.1016/0040-1951(93)90230-H.
Ren, Y., E. Stutzmann, R. Van der Hilst, and J. Besse (2007),Understanding seismic heterogeneities in the lower mantlebeneath the Americas from seismic tomography and platetectonic his tory, J. Geophys. Res. , 112 , B01302,doi:10.1029/2005JB004154.
Ribe, N. M. (2003), Periodic folding of viscous sheets, Phys.Rev. Lett., E68, 036305.
Ribe, N. M., E. Stutzmann, Y. Ren, and R. van der Hilst(2007), Buckling instabilities of subducted lithospherebeneath the transition zone, Earth Planet. Sci. Lett., 254(1–2),173–179, doi:10.1016/j.epsl.2006.11.028.
Ricard, Y., M. A. Richards, C. Lithgow‐Bertelloni, and Y. LeStunff (1993), A geodynamic model of mantle density hetero-geneity, J. Geophys. Res., 98, 21,895–21,909, doi:10.1029/93JB02216.
Royden, L. H., and L. Husson (2006), Trench motion, slabgeometry and viscous stresses in subduction systems, Geo-phys. J. Int., 167, 881–905, doi:10.1111/j.1365-246X.2006.03079.x.
Rybczynski, W. (1911), Uber die fortschreitende Bewegungeiner flussigen Kugel in einem zahen Medieum, Bull. Acad.Sci. Cracovi, A, 40.
Schellart, W. P. (2004), Kinematics of subduction and subduc-tion‐induced flow in the upper mantle, J. Geophys. Res.,109, B07401, doi:10.1029/2004JB002970.
Schellart, W. P. (2009), Evolution of the slab bending radiusand the bending dissipation in three‐dimensional subductionmodels with a variable slab to upper mantle viscosity ratio,Earth Planet. Sci. Lett., 288, 309–319.
Schellart, W. P., J. Freeman, D. R. Stegman, L. Moresi, andD. May (2007), Evolution and diversity of subductionzones controlled by slab width, Nature, 446(7133), 308–311, doi:10.1038/nature05615.
Spakman, W., S. van der Lee, and R. van der Hilst (1993),Travel‐time tomography of the European‐Mediterraneanmantle down to 1400 km, Phys. Earth Planet. Inter., 79(1–2),3–74, doi:10.1016/0031-9201(93)90142-V.
Stegman, D. R., J. Freeman, W. P. Schellart, L. Moresi, andD.May (2006), Influence of trench width on subduction hingeretreat rates in 3‐D models of slab rollback, Geochem. Geo-phys. Geosyst., 7, Q03012, doi:10.1029/2005GC001056.
Tackley, P. J. (1993), Effects of strongly temperature‐dependent viscosity on time‐dependent, three‐dimensionalmodels of mantle convection, Geophys. Res. Lett., 20(20),2187–2190, doi:10.1029/93GL02317.
Tagawa, M., T. Nakakuki, and F. Tajima (2007), Dynam-ical modeling of trench retreat driven by the slab inter-action with the mantle transition zone, Earth PlanetsSpace, 59, 65–74.
Tajima, F., and S. P. Grand (1995), Evidence of high velocityanomalies in the transition zone associated with SouthernKurile Subduction Zone, Geophys. Res. Lett., 22(23),3139–3142, doi:10.1029/95GL03314.
Tajima, F., and S. P. Grand (1998), Variation of transition zonehigh‐velocity anomalies and depression of 660 km disconti-nuity associated with subduction zones from the southernKuriles to Izu‐Bonin and Ryukyu, J. Geophys. Res.,103(B7), 15,015–15,036.
GeochemistryGeophysicsGeosystems G3G3 LOISELET ET AL.: SUBDUCTING SLABS 10.1029/2010GC003172
20 of 21
Tao, W. C., and R. J. O’Connell (1993), Deformation of aweak subducted slab and variation of seismicity with depth,Nature, 361(6413), 626–628, doi:10.1038/361626a0.
Thieulot, C., P. Fullsack, and J. Braun (2008), Adaptiveoctree‐based finite element analysis of two‐ and three‐dimensional indentation problems, J. Geophys. Res., 113,B12207, doi:10.1029/2008JB005591.
van der Hilst, R. (1995), Complex morphology of subductedlithosphere in the mantle beneath the Tonga trench, Nature,374(6518), 154–157, doi:10.1038/374154a0.
van der Hilst, R., and T. Seno (1993), Effects of relative platemotion on the deep structure and penetration depth of slabsbelow the Izu‐Bonin and Mariana island arcs, Earth Planet.Sci. Lett., 120(3–4), 395–407, doi:10.1016/0012-821X(93)90253-6.
van der Hilst, R., and S. Widiyantoro (1997), Evidence fordeep mantle circulation from global tomography, Nature,386, 578–584, doi:10.1038/386578a0.
Vassiliou, M. S., B. H. Hager, and A. Raefsky (1984), The dis-tribution of earthquakes with depth and stress in subductingslabs, J. Geodyn., 1(1), 11–28, doi:10.1016/0264-3707(84)90004-8.
Wessel, P., and W. H. F. Smith (1991), Free software helpsmap and display data, Eos Trans. AGU , 72 , 441,doi:10.1029/90EO00319.
Widiyantoro, S., and R. van der Hilst (1996), Structureand evolution of lithospheric slab beneath the Sunda Arc,Indonesia, Science, 271(5255), 1566–1570, doi:10.1126/science.271.5255.1566.
Wortel, M. J. R., and W. Spakman (2000), Subduction andslab detachment in the Mediterranean‐Carpathian region,Science, 290, 1910–1917, doi:10.1126/science.290.5498.1910.
Wortel, M. J. R., and N. J. Vlaar (1988), Subduction zone seis-micity and the thermo‐mechanical evolution of downgoingli thosphere, Pure Appl. Geophys. , 128 , 625–659,doi:10.1007/BF00874551.
Yamaoka, K. Y., Y. Fukao, and M. Kumazawa (1986), Spher-ical shell tectonics: Effects of sphericity and inextensibilityon the geometry of the descending lithosphere, Rev. Geo-phys., 24, 27–53, doi:10.1029/RG024i001p00027.
Yamato, P., L. Husson, J. Braun, C. Loiselet, and C. Thieulot(2009), Influence of surrounding plates on 3D subductiondynamics, Geophys. Res. Lett., 36, L07303, doi:10.1029/2008GL036942.
Yoshioka, S., and M. J. R. Wortel (1995), Three‐dimensionalnumerical modeling of detachment of subducted lithosphere,J. Geophys. Res., 100(B10), 20,223–20,244, doi:10.1029/94JB01258.
Zhao, D., Y. Xu, D. A. Wiens, L. M. Dorman, J. Hiderbrand,and S. C. Webb (1997), Depth extent of the Lau back‐arcspreading center and its relation to subduction processes,Science, 278, 254–257, doi:10.1126/science.278.5336.254.
Zhong, S., and G. F. Davies (1999), Effects of plate and slabviscosities on the geoid, Earth Planet. Sci. Lett., 170(4),487–496, doi:10.1016/S0012-821X(99)00124-7.
Zhong, S., and M. Gurnis (1994), Controls on trench topogra-phy from dynamic models of subducted slabs, J. Geophys.Res., 99, 15,683–15,695, doi:10.1029/94JB00809.
Zhong, S., and M. Gurnis (1995), Mantle convection withplates and mobile, faulted plate margins, Science, 267,838–843, doi:10.1126/science.267.5199.838.
Zhou, H.‐W. (1988), How well can we resolve the deep seis-mic slab with seismic tomography?, Geophys. Res. Lett.,15(12), 1425–1428, doi:10.1029/GL015i012p01425.
GeochemistryGeophysicsGeosystems G3G3 LOISELET ET AL.: SUBDUCTING SLABS 10.1029/2010GC003172