Mean of age 1
The MEANS Procedure
Analysis Variable : age
N Mean Std Dev Minimum Maximum
ƒƒƒƒƒƒƒƒƒƒƒƒƒƒƒƒƒƒƒƒƒƒƒƒƒƒƒƒƒƒƒƒƒƒƒƒƒƒƒƒƒƒƒƒƒƒƒƒƒƒƒƒƒƒƒƒƒƒƒƒƒƒƒƒƒƒƒ
109 55.5321101 12.1255537 26.0000000 83.0000000
ƒƒƒƒƒƒƒƒƒƒƒƒƒƒƒƒƒƒƒƒƒƒƒƒƒƒƒƒƒƒƒƒƒƒƒƒƒƒƒƒƒƒƒƒƒƒƒƒƒƒƒƒƒƒƒƒƒƒƒƒƒƒƒƒƒƒƒ
diff
-40
-20
0
20
week
2 3 4 5 6 7 8 9 10 11 12 13 14 15 16
Subject-specific observed profiles of change from baseline vs weektrt=10000U
diff
-40
-20
0
20
week
2 3 4 5 6 7 8 9 10 11 12 13 14 15 16
Subject-specific observed profiles of change from baseline vs weektrt=5000U
diff
-40
-20
0
20
week
2 3 4 5 6 7 8 9 10 11 12 13 14 15 16
Subject-specific observed profiles of change from baseline vs weektrt=Placebo
diff
-50
-40
-30
-20
-10
0
10
20
30
age
20 30 40 50 60 70 80 90
Raw Data: Change scores vs Age
Model M1: Full model 2
Unspecified var-cov structure
The Mixed Procedure
Model Information
Data Set WORK.THREE
Dependent Variable diff
Covariance Structures Variance Components,
Unstructured
Subject Effects site, id(site)
Estimation Method REML
Residual Variance Method None
Fixed Effects SE Method Kenward-Roger
Degrees of Freedom Method Kenward-Roger
Class Level Information
Class Levels Values
id 19 1 2 3 4 5 6 7 8 9 10 11 12 13
14 15 16 17 18 19
trt 3 10000U 5000U Placebo
site 9 1 2 3 4 5 6 7 8 9
sex 2 F M
week 5 2 4 8 12 16
measocc 5 2 3 4 5 6
Dimensions
Covariance Parameters 16
Columns in X 98
Columns in Z Per Subject 1
Subjects 9
Max Obs Per Subject 95
Number of Observations
Number of Observations Read 545
Number of Observations Used 522
Number of Observations Not Used 23
Iteration History
Iteration Evaluations -2 Res Log Like Criterion
0 1 3600.93973714
1 2 3396.97724037 0.00001347
2 1 3396.95992468 0.00000001
3 1 3396.95990814 0.00000000
Model M1: Full model 3
Unspecified var-cov structure
The Mixed Procedure
Convergence criteria met.
Estimated R Matrix for id(site) 1 1
Row Col1 Col2 Col3 Col4 Col5
1 70.2952 36.4542 31.6631 29.4481 22.2192
2 36.4542 61.6512 46.9627 29.1634 21.9909
3 31.6631 46.9627 77.3702 45.2065 28.7920
4 29.4481 29.1634 45.2065 69.3619 50.6900
5 22.2192 21.9909 28.7920 50.6900 78.4851
Estimated R Correlation Matrix for id(site) 1 1
Row Col1 Col2 Col3 Col4 Col5
1 1.0000 0.5538 0.4293 0.4217 0.2991
2 0.5538 1.0000 0.6800 0.4460 0.3161
3 0.4293 0.6800 1.0000 0.6171 0.3695
4 0.4217 0.4460 0.6171 1.0000 0.6870
5 0.2991 0.3161 0.3695 0.6870 1.0000
Covariance Parameter Estimates
Standard Z
Cov Parm Subject Estimate Error Value Pr Z
Intercept site 0.06721 1.9983 0.03 0.4866
UN(1,1) id(site) 70.2952 10.6244 6.62 <.0001
UN(2,1) id(site) 36.4542 8.3284 4.38 <.0001
UN(2,2) id(site) 61.6512 9.5236 6.47 <.0001
UN(3,1) id(site) 31.6631 8.8164 3.59 0.0003
UN(3,2) id(site) 46.9627 8.7722 5.35 <.0001
UN(3,3) id(site) 77.3702 11.1893 6.91 <.0001
UN(4,1) id(site) 29.4481 8.2834 3.56 0.0004
UN(4,2) id(site) 29.1634 7.7951 3.74 0.0002
UN(4,3) id(site) 45.2065 8.9780 5.04 <.0001
UN(4,4) id(site) 69.3619 10.2367 6.78 <.0001
UN(5,1) id(site) 22.2192 8.1412 2.73 0.0063
UN(5,2) id(site) 21.9909 7.6484 2.88 0.0040
UN(5,3) id(site) 28.7920 8.5322 3.37 0.0007
UN(5,4) id(site) 50.6900 9.1842 5.52 <.0001
UN(5,5) id(site) 78.4851 11.4405 6.86 <.0001
Model M1: Full model 4
Unspecified var-cov structure
The Mixed Procedure
Fit Statistics
-2 Res Log Likelihood 3397.0
AIC (smaller is better) 3429.0
AICC (smaller is better) 3430.1
BIC (smaller is better) 3432.1
Type 3 Tests of Fixed Effects
Num Den
Effect DF DF F Value Pr > F
agec 1 97 1.72 0.1922
sex 1 95.6 1.09 0.3001
agec*sex 1 93.9 2.53 0.1149
trt 2 93.9 5.06 0.0082
agec*trt 2 94.8 2.19 0.1174
week 4 94.1 19.52 <.0001
agec*week 4 90 2.44 0.0526
trt*week 8 131 2.24 0.0283
agec*trt*week 8 127 1.18 0.3192
trt*sex 2 96.9 0.59 0.5551
sex*week 4 93.9 0.60 0.6642
trt*sex*week 8 131 0.89 0.5293
Least Squares Means
Standard
Effect trt week Estimate Error DF t Value Pr > |t|
trt 10000U -6.7958 1.3034 51.5 -5.21 <.0001
trt 5000U -5.9849 1.1002 41.4 -5.44 <.0001
trt Placebo -1.8226 1.1554 49.6 -1.58 0.1210
week 2 -8.0900 0.9091 21.2 -8.90 <.0001
week 4 -8.3454 0.8328 16.7 -10.02 <.0001
week 8 -5.8699 0.9368 20.9 -6.27 <.0001
week 12 -2.4661 0.9097 19.5 -2.71 0.0136
week 16 0.4325 0.9507 18.6 0.45 0.6544
trt*week 10000U 2 -11.7219 1.6984 82.3 -6.90 <.0001
trt*week 10000U 4 -12.5073 1.5443 79.7 -8.10 <.0001
trt*week 10000U 8 -8.9155 1.7655 77.3 -5.05 <.0001
trt*week 10000U 12 -2.8369 1.7705 84 -1.60 0.1128
trt*week 10000U 16 2.0028 1.7969 63.8 1.11 0.2692
trt*week 5000U 2 -9.1533 1.4431 74.1 -6.34 <.0001
trt*week 5000U 4 -9.0616 1.3388 73.4 -6.77 <.0001
trt*week 5000U 8 -7.0119 1.4961 68.3 -4.69 <.0001
trt*week 5000U 12 -3.6045 1.4085 63.9 -2.56 0.0129
trt*week 5000U 16 -1.0935 1.5078 56.6 -0.73 0.4713
trt*week Placebo 2 -3.3949 1.5324 82.2 -2.22 0.0295
Model M1: Full model 5
Unspecified var-cov structure
The Mixed Procedure
Least Squares Means
Standard
Effect trt week Estimate Error DF t Value Pr > |t|
trt*week Placebo 4 -3.4672 1.3901 79.8 -2.49 0.0147
trt*week Placebo 8 -1.6822 1.5529 73.6 -1.08 0.2822
trt*week Placebo 12 -0.9568 1.4820 71.5 -0.65 0.5206
trt*week Placebo 16 0.3881 1.5787 62.3 0.25 0.8066
Estimate
-13.0000
-12.0000
-11.0000
-10.0000
-9.0000
-8.0000
-7.0000
-6.0000
-5.0000
-4.0000
-3.0000
-2.0000
-1.0000
0
1.0000
2.0000
3.0000
week
2 3 4 5 6 7 8 9 10 11 12 13 14 15 16
Group by time profile plots for model M1
trt 10000U 5000U Placebo
AIC values for variants of model M1 with a variety of var-cov structures 6
Obs Descr Value
1 AIC (smaller is better) 3429.0
2 AIC (smaller is better) 3420.8
3 AIC (smaller is better) 3415.2
4 AIC (smaller is better) 3413.8
5 AIC (smaller is better) 3421.3
6 AIC (smaller is better) 3414.0
7 AIC (smaller is better) 3419.3
8 AIC (smaller is better) 3415.8
9 AIC (smaller is better) 3413.9
10 AIC (smaller is better) 3466.5
11 AIC (smaller is better) 3460.6
12 AIC (smaller is better) 3423.6
13 AIC (smaller is better) 3458.0
M4 is best among models considered so far 7
The Mixed Procedure
Convergence criteria met.
Covariance Parameter Estimates
Standard Z
Cov Parm Subject Estimate Error Value Pr Z
Intercept site 4.53E-17 . . .
AR(1) id(site) 0.6404 0.03527 18.16 <.0001
Residual 72.0612 6.3868 11.28 <.0001
Fit Statistics
-2 Res Log Likelihood 3409.8
AIC (smaller is better) 3413.8
AICC (smaller is better) 3413.8
BIC (smaller is better) 3414.2
Type 3 Tests of Fixed Effects
Num Den
Effect DF DF F Value Pr > F
age 1 468 1.75 0.1870
sex 1 468 1.79 0.1814
age*sex 1 468 2.57 0.1096
trt 2 468 1.85 0.1587
age*trt 2 468 2.26 0.1055
week 4 468 1.46 0.2138
age*week 4 468 2.38 0.0505
trt*week 8 468 1.37 0.2080
age*trt*week 8 468 1.17 0.3169
trt*sex 2 468 0.66 0.5190
sex*week 4 468 0.61 0.6558
trt*sex*week 8 468 0.74 0.6546
M4a: same as M4 without site effect 8
The Mixed Procedure
Convergence criteria met.
Covariance Parameter Estimates
Standard Z
Cov Parm Subject Estimate Error Value Pr Z
AR(1) id(site) 0.6404 0.03527 18.16 <.0001
Residual 72.0613 6.3868 11.28 <.0001
Fit Statistics
-2 Res Log Likelihood 3409.8
AIC (smaller is better) 3413.8
AICC (smaller is better) 3413.8
BIC (smaller is better) 3419.1
Type 3 Tests of Fixed Effects
Num Den
Effect DF DF F Value Pr > F
age 1 98 1.75 0.1894
sex 1 98 1.79 0.1838
age*sex 1 98 2.57 0.1121
trt 2 98 1.85 0.1630
age*trt 2 98 2.26 0.1098
week 4 378 1.46 0.2142
age*week 4 378 2.38 0.0509
trt*week 8 378 1.37 0.2088
age*trt*week 8 378 1.17 0.3175
trt*sex 2 98 0.66 0.5208
sex*week 4 378 0.61 0.6558
trt*sex*week 8 378 0.74 0.6546
Model M4b has ar(1) residual var-cov matrix with trt-specific parameters 9
The Mixed Procedure
Convergence criteria met.
Estimated R Matrix for id(site) 1 1
Row Col1 Col2 Col3 Col4 Col5
1 59.1924 41.1814 28.6508 19.9330 13.8678
2 41.1814 59.1924 41.1814 28.6508 19.9330
3 28.6508 41.1814 59.1924 41.1814 28.6508
4 19.9330 28.6508 41.1814 59.1924 41.1814
5 13.8678 19.9330 28.6508 41.1814 59.1924
Estimated R Correlation Matrix for id(site) 1 1
Row Col1 Col2 Col3 Col4 Col5
1 1.0000 0.6957 0.4840 0.3367 0.2343
2 0.6957 1.0000 0.6957 0.4840 0.3367
3 0.4840 0.6957 1.0000 0.6957 0.4840
4 0.3367 0.4840 0.6957 1.0000 0.6957
5 0.2343 0.3367 0.4840 0.6957 1.0000
Estimated R Matrix for id(site) 2 1
Row Col1 Col2 Col3 Col4 Col5
1 75.4201 46.6360 28.8373 17.8315 11.0261
2 46.6360 75.4201 46.6360 28.8373 17.8315
3 28.8373 46.6360 75.4201 46.6360 28.8373
4 17.8315 28.8373 46.6360 75.4201 46.6360
5 11.0261 17.8315 28.8373 46.6360 75.4201
Estimated R Correlation Matrix for id(site) 2 1
Row Col1 Col2 Col3 Col4 Col5
1 1.0000 0.6183 0.3824 0.2364 0.1462
2 0.6183 1.0000 0.6183 0.3824 0.2364
3 0.3824 0.6183 1.0000 0.6183 0.3824
4 0.2364 0.3824 0.6183 1.0000 0.6183
5 0.1462 0.2364 0.3824 0.6183 1.0000
Model M4b has ar(1) residual var-cov matrix with trt-specific parameters 10
The Mixed Procedure
Estimated R Matrix for id(site) 8 1
Row Col1 Col2 Col3 Col4 Col5
1 82.2313 51.2377 31.9258 19.8927 12.3950
2 51.2377 82.2313 51.2377 31.9258 19.8927
3 31.9258 51.2377 82.2313 51.2377 31.9258
4 19.8927 31.9258 51.2377 82.2313 51.2377
5 12.3950 19.8927 31.9258 51.2377 82.2313
Estimated R Correlation Matrix for id(site) 8 1
Row Col1 Col2 Col3 Col4 Col5
1 1.0000 0.6231 0.3882 0.2419 0.1507
2 0.6231 1.0000 0.6231 0.3882 0.2419
3 0.3882 0.6231 1.0000 0.6231 0.3882
4 0.2419 0.3882 0.6231 1.0000 0.6231
5 0.1507 0.2419 0.3882 0.6231 1.0000
Covariance Parameter Estimates
Standard Z
Cov Parm Subject Group Estimate Error Value Pr Z
Variance id(site) trt 10000U 75.4201 11.3412 6.65 <.0001
AR(1) id(site) trt 10000U 0.6183 0.06258 9.88 <.0001
Variance id(site) trt 5000U 59.1924 9.9515 5.95 <.0001
AR(1) id(site) trt 5000U 0.6957 0.05705 12.20 <.0001
Variance id(site) trt Placebo 82.2313 12.5935 6.53 <.0001
AR(1) id(site) trt Placebo 0.6231 0.06359 9.80 <.0001
Fit Statistics
-2 Res Log Likelihood 3399.6
AIC (smaller is better) 3411.6
AICC (smaller is better) 3411.8
BIC (smaller is better) 3427.7
Type 3 Tests of Fixed Effects
Num Den
Effect DF DF F Value Pr > F
age 1 111 1.62 0.2060
sex 1 102 1.29 0.2592
age*sex 1 101 1.93 0.1681
trt 2 74.8 1.81 0.1708
Model M4b has ar(1) residual var-cov matrix with trt-specific parameters 11
The Mixed Procedure
Type 3 Tests of Fixed Effects
Num Den
Effect DF DF F Value Pr > F
age*trt 2 74.7 2.22 0.1163
week 4 351 1.44 0.2217
age*week 4 349 2.33 0.0554
trt*week 8 299 1.37 0.2069
age*trt*week 8 298 1.18 0.3078
trt*sex 2 74.3 0.64 0.5313
sex*week 4 337 0.58 0.6756
trt*sex*week 8 295 0.76 0.6344
Model M4c has AR(1) residual var-cov matrix with sex-specific parameters 12
The Mixed Procedure
Convergence criteria met.
Estimated R Matrix for id(site) 1 1
Row Col1 Col2 Col3 Col4 Col5
1 70.4629 46.8258 31.1179 20.6792 13.7423
2 46.8258 70.4629 46.8258 31.1179 20.6792
3 31.1179 46.8258 70.4629 46.8258 31.1179
4 20.6792 31.1179 46.8258 70.4629 46.8258
5 13.7423 20.6792 31.1179 46.8258 70.4629
Estimated R Correlation Matrix for id(site) 1 1
Row Col1 Col2 Col3 Col4 Col5
1 1.0000 0.6645 0.4416 0.2935 0.1950
2 0.6645 1.0000 0.6645 0.4416 0.2935
3 0.4416 0.6645 1.0000 0.6645 0.4416
4 0.2935 0.4416 0.6645 1.0000 0.6645
5 0.1950 0.2935 0.4416 0.6645 1.0000
Estimated R Matrix for id(site) 7 1
Row Col1 Col2 Col3 Col4 Col5
1 74.5208 44.5038 26.5776 15.8721 9.4788
2 44.5038 74.5208 44.5038 26.5776 15.8721
3 26.5776 44.5038 74.5208 44.5038 26.5776
4 15.8721 26.5776 44.5038 74.5208 44.5038
5 9.4788 15.8721 26.5776 44.5038 74.5208
Estimated R Correlation Matrix for id(site) 7 1
Row Col1 Col2 Col3 Col4 Col5
1 1.0000 0.5972 0.3566 0.2130 0.1272
2 0.5972 1.0000 0.5972 0.3566 0.2130
3 0.3566 0.5972 1.0000 0.5972 0.3566
4 0.2130 0.3566 0.5972 1.0000 0.5972
5 0.1272 0.2130 0.3566 0.5972 1.0000
Model M4c has AR(1) residual var-cov matrix with sex-specific parameters 13
The Mixed Procedure
Covariance Parameter Estimates
Standard Z
Cov Parm Subject Group Estimate Error Value Pr Z
Variance id(site) sex F 70.4629 8.1026 8.70 <.0001
AR(1) id(site) sex F 0.6645 0.04241 15.67 <.0001
Variance id(site) sex M 74.5208 10.8741 6.85 <.0001
AR(1) id(site) sex M 0.5972 0.06543 9.13 <.0001
Fit Statistics
-2 Res Log Likelihood 3407.4
AIC (smaller is better) 3415.4
AICC (smaller is better) 3415.5
BIC (smaller is better) 3426.2
Type 3 Tests of Fixed Effects
Num Den
Effect DF DF F Value Pr > F
age 1 98 1.77 0.1861
sex 1 98 1.81 0.1818
age*sex 1 98 2.60 0.1104
trt 2 98 1.99 0.1425
age*trt 2 98 2.41 0.0950
week 4 378 1.49 0.2045
age*week 4 378 2.46 0.0452
trt*week 8 378 1.38 0.2051
age*trt*week 8 378 1.17 0.3177
trt*sex 2 98 0.67 0.5162
sex*week 4 378 0.56 0.6927
trt*sex*week 8 378 0.71 0.6832
Model M4b-9. Same as previous model but drop age 14
This is final model when week is a factor
The Mixed Procedure
Convergence criteria met.
Covariance Parameter Estimates
Standard Z
Cov Parm Subject Group Estimate Error Value Pr Z
Variance id(site) trt 10000U 77.0849 11.2200 6.87 <.0001
AR(1) id(site) trt 10000U 0.6404 0.05773 11.09 <.0001
Variance id(site) trt 5000U 60.4942 9.5723 6.32 <.0001
AR(1) id(site) trt 5000U 0.6938 0.05451 12.73 <.0001
Variance id(site) trt Placebo 82.9271 12.2492 6.77 <.0001
AR(1) id(site) trt Placebo 0.6155 0.06273 9.81 <.0001
Fit Statistics
-2 Res Log Likelihood 3445.6
AIC (smaller is better) 3457.6
AICC (smaller is better) 3457.8
BIC (smaller is better) 3473.8
Type 3 Tests of Fixed Effects
Num Den
Effect DF DF F Value Pr > F
trt 2 78.2 3.99 0.0224
week 4 375 18.53 <.0001
trt*week 8 319 1.93 0.0545
Least Squares Means
Standard
Effect trt week Estimate Error DF t Value Pr > |t|
trt 10000U -6.5438 1.0797 42.3 -6.06 <.0001
trt 5000U -6.0313 1.0071 37.8 -5.99 <.0001
trt Placebo -2.4877 1.1234 38.6 -2.21 0.0328
week 2 -7.9426 0.8375 273 -9.48 <.0001
week 4 -8.5434 0.8283 267 -10.31 <.0001
week 8 -5.8555 0.8326 271 -7.03 <.0001
week 12 -2.8514 0.8354 271 -3.41 0.0007
week 16 0.08804 0.8350 268 0.11 0.9161
trt*week 10000U 2 -10.8019 1.4554 96.2 -7.42 <.0001
trt*week 10000U 4 -11.8383 1.4519 96.2 -8.15 <.0001
trt*week 10000U 8 -8.2156 1.4738 100 -5.57 <.0001
trt*week 10000U 12 -3.4952 1.4786 99.6 -2.36 0.0200
Model M4b-9. Same as previous model but drop age 15
This is final model when week is a factor
The Mixed Procedure
Least Squares Means
Standard
Effect trt week Estimate Error DF t Value Pr > |t|
trt*week 10000U 16 1.6318 1.4623 95.3 1.12 0.2673
trt*week 5000U 2 -9.4078 1.3165 83.1 -7.15 <.0001
trt*week 5000U 4 -9.3634 1.3029 81.3 -7.19 <.0001
trt*week 5000U 8 -6.9794 1.3029 81.3 -5.36 <.0001
trt*week 5000U 12 -3.5000 1.2963 79.9 -2.70 0.0085
trt*week 5000U 16 -0.9061 1.3061 81.5 -0.69 0.4898
trt*week Placebo 2 -3.6180 1.5687 95.5 -2.31 0.0233
trt*week Placebo 4 -4.4286 1.5393 91.7 -2.88 0.0050
trt*week Placebo 8 -2.3714 1.5393 91.7 -1.54 0.1269
trt*week Placebo 12 -1.5589 1.5536 93.5 -1.00 0.3183
trt*week Placebo 16 -0.4615 1.5590 93.1 -0.30 0.7678
Estimate
-12.0000
-11.0000
-10.0000
-9.0000
-8.0000
-7.0000
-6.0000
-5.0000
-4.0000
-3.0000
-2.0000
-1.0000
0
1.0000
2.0000
week
2 3 4 5 6 7 8 9 10 11 12 13 14 15 16
Group by time profile plots for model M4b-9
trt 10000U 5000U Placebo
Model M4b-9(ML). Model M4b-9 fit with ML estimation 16
The Mixed Procedure
Convergence criteria met.
Covariance Parameter Estimates
Standard Z
Cov Parm Subject Group Estimate Error Value Pr Z
Variance id(site) trt 10000U 74.9452 10.7624 6.96 <.0001
AR(1) id(site) trt 10000U 0.6407 0.05689 11.26 <.0001
Variance id(site) trt 5000U 58.7896 9.1735 6.41 <.0001
AR(1) id(site) trt 5000U 0.6940 0.05372 12.92 <.0001
Variance id(site) trt Placebo 80.5139 11.7204 6.87 <.0001
AR(1) id(site) trt Placebo 0.6155 0.06181 9.96 <.0001
Fit Statistics
-2 Log Likelihood 3477.4
AIC (smaller is better) 3519.4
AICC (smaller is better) 3521.3
BIC (smaller is better) 3576.0
Type 3 Tests of Fixed Effects
Num Den
Effect DF DF F Value Pr > F
trt 2 80.5 4.11 0.0200
week 4 386 19.09 <.0001
trt*week 8 329 1.99 0.0468
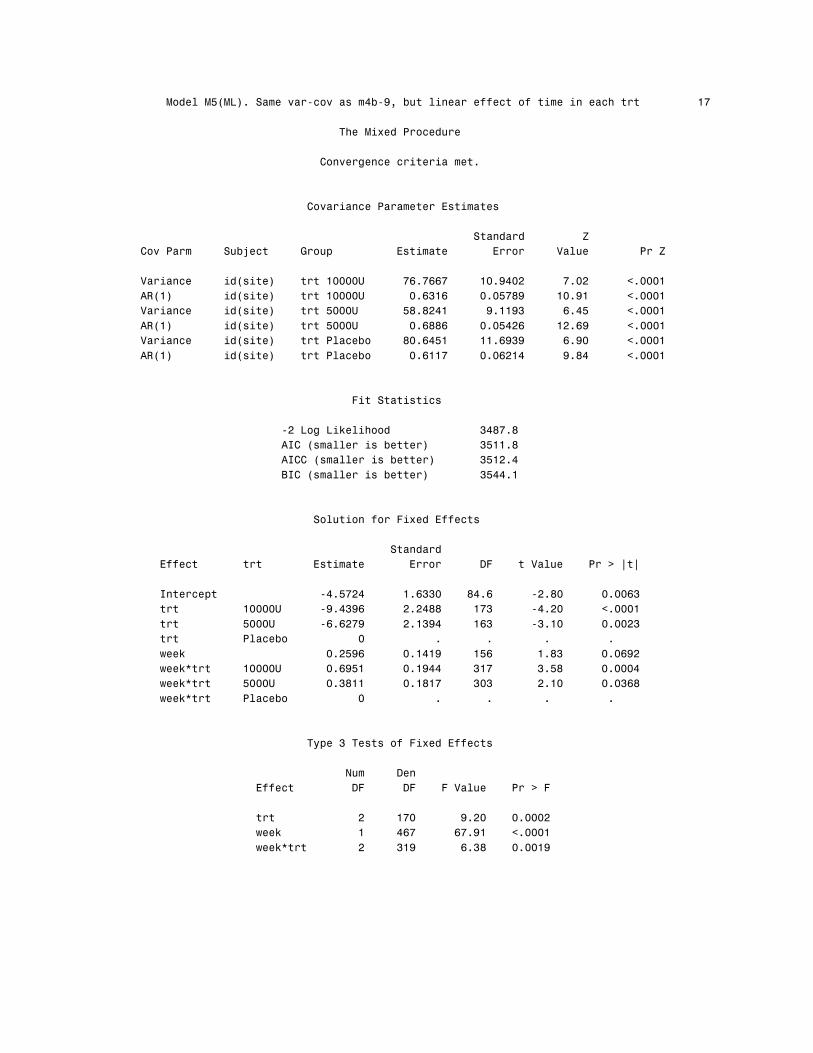
Model M5(ML). Same var-cov as m4b-9, but linear effect of time in each trt 17
The Mixed Procedure
Convergence criteria met.
Covariance Parameter Estimates
Standard Z
Cov Parm Subject Group Estimate Error Value Pr Z
Variance id(site) trt 10000U 76.7667 10.9402 7.02 <.0001
AR(1) id(site) trt 10000U 0.6316 0.05789 10.91 <.0001
Variance id(site) trt 5000U 58.8241 9.1193 6.45 <.0001
AR(1) id(site) trt 5000U 0.6886 0.05426 12.69 <.0001
Variance id(site) trt Placebo 80.6451 11.6939 6.90 <.0001
AR(1) id(site) trt Placebo 0.6117 0.06214 9.84 <.0001
Fit Statistics
-2 Log Likelihood 3487.8
AIC (smaller is better) 3511.8
AICC (smaller is better) 3512.4
BIC (smaller is better) 3544.1
Solution for Fixed Effects
Standard
Effect trt Estimate Error DF t Value Pr > |t|
Intercept -4.5724 1.6330 84.6 -2.80 0.0063
trt 10000U -9.4396 2.2488 173 -4.20 <.0001
trt 5000U -6.6279 2.1394 163 -3.10 0.0023
trt Placebo 0 . . . .
week 0.2596 0.1419 156 1.83 0.0692
week*trt 10000U 0.6951 0.1944 317 3.58 0.0004
week*trt 5000U 0.3811 0.1817 303 2.10 0.0368
week*trt Placebo 0 . . . .
Type 3 Tests of Fixed Effects
Num Den
Effect DF DF F Value Pr > F
trt 2 170 9.20 0.0002
week 1 467 67.91 <.0001
week*trt 2 319 6.38 0.0019
Model M5. Refit model M5 with REML and test hypotheses 18
The Mixed Procedure
Convergence criteria met.
Covariance Parameter Estimates
Standard Z
Cov Parm Subject Group Estimate Error Value Pr Z
Variance id(site) trt 10000U 78.4561 11.3968 6.88 <.0001
AR(1) id(site) trt 10000U 0.6378 0.05787 11.02 <.0001
Variance id(site) trt 5000U 60.2633 9.5375 6.32 <.0001
AR(1) id(site) trt 5000U 0.6946 0.05415 12.83 <.0001
Variance id(site) trt Placebo 82.5252 12.2199 6.75 <.0001
AR(1) id(site) trt Placebo 0.6188 0.06214 9.96 <.0001
Fit Statistics
-2 Res Log Likelihood 3488.8
AIC (smaller is better) 3500.8
AICC (smaller is better) 3501.0
BIC (smaller is better) 3516.9
Solution for Fixed Effects
Standard
Effect trt Estimate Error DF t Value Pr > |t|
Intercept -4.5712 1.6531 81.9 -2.77 0.0070
trt 10000U -9.4363 2.2757 168 -4.15 <.0001
trt 5000U -6.6261 2.1658 158 -3.06 0.0026
trt Placebo 0 . . . .
week 0.2598 0.1430 153 1.82 0.0712
week*trt 10000U 0.6953 0.1959 313 3.55 0.0004
week*trt 5000U 0.3810 0.1831 299 2.08 0.0383
week*trt Placebo 0 . . . .
Type 3 Tests of Fixed Effects
Num Den
Effect DF DF F Value Pr > F
trt 2 164 8.98 0.0002
week 1 461 66.92 <.0001
week*trt 2 315 6.28 0.0021
Model M5. Refit model M5 with REML and test hypotheses 19
The Mixed Procedure
Convergence criteria met.
Covariance Parameter Estimates
Standard Z
Cov Parm Subject Group Estimate Error Value Pr Z
Variance id(site) trt 10000U 78.4561 11.3968 6.88 <.0001
AR(1) id(site) trt 10000U 0.6378 0.05787 11.02 <.0001
Variance id(site) trt 5000U 60.2633 9.5375 6.32 <.0001
AR(1) id(site) trt 5000U 0.6946 0.05415 12.83 <.0001
Variance id(site) trt Placebo 82.5252 12.2199 6.75 <.0001
AR(1) id(site) trt Placebo 0.6188 0.06214 9.96 <.0001
Fit Statistics
-2 Res Log Likelihood 3488.8
AIC (smaller is better) 3500.8
AICC (smaller is better) 3501.0
BIC (smaller is better) 3516.9
Solution for Fixed Effects
Standard
Effect trt Estimate Error DF t Value Pr > |t|
Intercept -4.0515 1.4524 67.5 -2.79 0.0069
trt 10000U -8.0458 2.0030 138 -4.02 <.0001
trt 5000U -5.8641 1.9143 130 -3.06 0.0027
trt Placebo 0 . . . .
week2 0.2598 0.1430 153 1.82 0.0712
week2*trt 10000U 0.6953 0.1959 313 3.55 0.0004
week2*trt 5000U 0.3810 0.1831 299 2.08 0.0383
week2*trt Placebo 0 . . . .
Type 3 Tests of Fixed Effects
Num Den
Effect DF DF F Value Pr > F
trt 2 135 8.55 0.0003
week2 1 461 66.92 <.0001
week2*trt 2 315 6.28 0.0021
Model M5. Refit model M5 with REML and test hypotheses 20
The Mixed Procedure
Least Squares Means
Standard
Effect trt week2 Estimate Error DF t Value Pr > |t|
trt 10000U 0.00 -12.0973 1.3793 71.9 -8.77 <.0001
trt 5000U 0.00 -9.9156 1.2470 64.4 -7.95 <.0001
trt Placebo 0.00 -4.0515 1.4524 67.5 -2.79 0.0069
Differences of Least Squares Means
Standard
Effect trt _trt week2 Estimate Error DF t Value Pr > |t| Adjustment
trt 10000U Placebo 0.00 -8.0458 2.0030 138 -4.02 <.0001 Dunnett
trt 5000U Placebo 0.00 -5.8641 1.9143 130 -3.06 0.0027 Dunnett
Differences of Least
Squares Means
Effect trt _trt Adj P
trt 10000U Placebo 0.0002
trt 5000U Placebo 0.0051
Model M5. Refit model M5 with REML and test hypotheses 21
The Mixed Procedure
Convergence criteria met.
Covariance Parameter Estimates
Standard Z
Cov Parm Subject Group Estimate Error Value Pr Z
Variance id(site) trt 10000U 78.4561 11.3968 6.88 <.0001
AR(1) id(site) trt 10000U 0.6378 0.05787 11.02 <.0001
Variance id(site) trt 5000U 60.2633 9.5375 6.32 <.0001
AR(1) id(site) trt 5000U 0.6946 0.05415 12.83 <.0001
Variance id(site) trt Placebo 82.5252 12.2199 6.75 <.0001
AR(1) id(site) trt Placebo 0.6188 0.06214 9.96 <.0001
Fit Statistics
-2 Res Log Likelihood 3488.8
AIC (smaller is better) 3500.8
AICC (smaller is better) 3501.0
BIC (smaller is better) 3516.9
Solution for Fixed Effects
Standard
Effect trt Estimate Error DF t Value Pr > |t|
Intercept -0.4137 1.5263 78.9 -0.27 0.7871
trt 10000U 1.6878 2.1081 162 0.80 0.4245
trt 5000U -0.5302 1.9984 150 -0.27 0.7911
trt Placebo 0 . . . .
week16 0.2598 0.1430 153 1.82 0.0712
week16*trt 10000U 0.6953 0.1959 313 3.55 0.0004
week16*trt 5000U 0.3810 0.1831 299 2.08 0.0383
week16*trt Placebo 0 . . . .
Type 3 Tests of Fixed Effects
Num Den
Effect DF DF F Value Pr > F
trt 2 157 0.68 0.5088
week16 1 461 66.92 <.0001
week16*trt 2 315 6.28 0.0021
Model M5. Refit model M5 with REML and test hypotheses 22
The Mixed Procedure
Least Squares Means
Standard
Effect trt week16 Estimate Error DF t Value Pr > |t|
trt 10000U 0.00 1.2741 1.4542 83.8 0.88 0.3835
trt 5000U 0.00 -0.9439 1.2900 73.9 -0.73 0.4667
trt Placebo 0.00 -0.4137 1.5263 78.9 -0.27 0.7871
Differences of Least Squares Means
Standard
Effect trt _trt week16 Estimate Error DF t Value Pr > |t| Adjustment
trt 10000U Placebo 0.00 1.6878 2.1081 162 0.80 0.4245 Dunnett
trt 5000U Placebo 0.00 -0.5302 1.9984 150 -0.27 0.7911 Dunnett
Differences of Least
Squares Means
Effect trt _trt Adj P
trt 10000U Placebo 0.6301
trt 5000U Placebo 0.9480
Model M5a. Refit model M5 but add site effect and test 23
The Mixed Procedure
Convergence criteria met.
Covariance Parameter Estimates
Standard Z
Cov Parm Subject Group Estimate Error Value Pr Z
Intercept site 0 . . .
Variance id(site) trt 10000U 78.4561 11.3968 6.88 <.0001
AR(1) id(site) trt 10000U 0.6378 0.05787 11.02 <.0001
Variance id(site) trt 5000U 60.2633 9.5375 6.32 <.0001
AR(1) id(site) trt 5000U 0.6946 0.05415 12.83 <.0001
Variance id(site) trt Placebo 82.5251 12.2199 6.75 <.0001
AR(1) id(site) trt Placebo 0.6188 0.06214 9.96 <.0001
Fit Statistics
-2 Res Log Likelihood 3488.8
AIC (smaller is better) 3500.8
AICC (smaller is better) 3501.0
BIC (smaller is better) 3502.0
Type 3 Tests of Fixed Effects
Num Den
Effect DF DF F Value Pr > F
trt 2 164 8.98 0.0002
week 1 461 66.92 <.0001
week*trt 2 315 6.28 0.0021