SUBMERGED VANES FOR FLOW CONTROL AND BANK PROTECTION IN STREAMS A. Jacob Odgaard and I-Tong-Yuan E. Lee submitted to the Highway Division of the Iowa Department of Transportation and the Iowa Highway Research Board Project HR-255 IIHR Report No. 279 Iowa Institute of Hydraulic Research The University of Iowa Iowa City, Iowa 52242 July 1984
Transcript
SUBMERGED VANES FOR FLOW CONTROL AND BANK PROTECTION IN STREAMS
A. Jacob Odgaard and I-Tong-Yuan E. Lee
submitted to
the Highway Division of the Iowa Department of Transportation and
the Iowa Highway Research Board Project HR-255
IIHR Report No. 279
Iowa Institute of Hydraulic Research The University of Iowa Iowa City, Iowa 52242
July 1984
SUBMERGED VANES FOR FLOW CONTROL AND BANK PROTECTION IN STREAMS
by
A. Jacob Odgaard and Hong-Yuan E. Lee
submitted to
the Highway Division of the Iowa Department of Transportation and
the Iowa Highway Research Board Project HR-255
IIHR Report No. 279
Iowa Institute of Hydraulic Research The University of Iowa Iowa City, Iowa 52242
ACKNOWLEDGEMENTS
This i n v e s t i g a t i o n was sponsored by t h e Iowa Highway Research
Board o f t h e Iowa Department o f Transportat ion. The authors are
g r a t e f u l f o r IDOT's support and they wish t o express t h e i r spec ia l
thanks t o Messrs. Vernon Marks and Mark Looschen, IDOT, f o r
p r o v i d i n g he lp a t var ious stages o f t h i s p r o j e c t . The authors a l s o
wish t o acknowledge t h e support prov ided by I IHR's mechanical and
e l e c t r o n i c shops, i n p a r t i c u l a r by Messrs. James R. Goss and Michael
Kundert, who ass i s ted on t h e f i e l d surveys; M r . James Cramer who
constructed spec ia l i zed e l e c t r o n i c data a c q u i s i t i o n equipment f o r
t h e model t e s t s ; and M r , Dale C. H a r r i s who supervised t h e l abo r ious
m ix ing o f t h e sediment grades used i n t h e model t e s t s . The data on
f l o w and bed c h a r a c t e r i s t i c s obta ined i n t h e model t e s t s served as
bas i s f o r t h e second au tho r ' s Ph.D. thes is ,
Dr. John F. Kennedy's c r i t i c a l review o f t h e manuscript was
g r e a t l y appreciated.
The opin ions, f ind ings , and conc?usions o f t h i s r e p o r t are
those o f t h e a f ~ t h o r s and not necessar i l y those o f t h e Highway
D i v i s i o n o f t h e Iowa Department o f Transportat ion.
ABSTRACT
The study has evaluated t h e e f fec t i veness o f Iowa Vanes i n
reducing depth and v e l o c i t y near t h e ou te r bank i n a curved, a l l u v i a l
channel f low. A procedure f o r the design o f a vane system f o r a
g iven r i v e r curve has been developed and tes ted i n a l abo ra to ry
model. The procedure has been used f o r t h e design o f an Iowa-Vane
bank-protect ion s t r u c t u r e f o r a sec t i on o f East Nishnabotna R ive r
along U.S. Highway 34 a t Red Oak, Iowa.
TABLE OF CONTENTS
Page
LIST OF SYMBOLS . ..................e.eo..................e....... *.v
................................................. LIST OF TABLES v i i ... .. LIST OF FIGURES .................................*........... V 1 1 1
.......................... ..................... I . INTRODUCTION .. 1
............. .......... ......... I 1 . THEORETICAL ANALYSIS .. .. .. .. 8 ........................................... . A Vane Funct ion 10 .............. . B E f f e c t i v e Bend Radius .............. ...... 13 . C L i f t C o e f f i c i e n t ......... ... ..... .. ......- .*as....... 15
. I 1 1 LABORATORY-MODEL EXPERIMENTS. ..............e..........oe... -18 . A V e r i f i c a t i o n o f Design Re la t ions ......................... 8 ................................ . 1 Uniform Bed Ma te r ia l 18 ............... ........... . 2 Nonuniform Bed M a t e r i a l .. 36 ............................... B . Vanes i n Armored Channel *39 .................. ..............a. C . Rock Vanes ... ... .. *43 D . Discussion o f Resu l ts .............. ............. ....... 45
................. . I V VANE DESIGN FOR EAST NISHNABOTNA R I V E R BEND 52 A . F i e l d Surveys ........................................... 52 . B Design Computations .............................o... *.63
......... ...-. . V SUMMARY. CONCLUSIONS AND RECOMMENDATIONS .... 72
APPENDIX I : Vane-Design Example ................................ 77
......... APPENDIX 11: Grain-Size D i s t r i b u t i o n s from F i e l d Surveys 79
L I S T OF SYMBOLS
wid th o f channel
1 i f t - f o r c e c o e f f i c i e n t
p a r t i c l e diameter
f l ow depth
vane func t ion , Eq. 10
p a r t i c l e Froude number, Eq. 4
Darcy-Weisbach f r i c t i o n f a c t o r
acce le ra t i on due t o g r a v i t y
vane he igh t
vane l e n g t h
number o f vanes
exponent i n t h e power-law v e l o c i t y p r o f i l e
rad ius
e f f e c t i v e radius, Eq. 12
l o n g i t u d i n a l s lope o f water sur face
t ransverse bed s lope
to rque
to rque due t o c e n t r i f u g a l acce le ra t i on
to rque induced by vane
l o c a l v e l o c i t y
shear v e l o c i t y (= Jv) depth-averaged v e l o c i t y
vo l ume
vane-angle o f a t tack
e f f e c t i v e angle o f a t tack
vane angle w i t h mean-flow d i r e c t i o n
downwash angle
d e v i a t i o n angle, Eq. 23
von Karman's constant
Sh ie lds ' parameter
f l u i d dens i t y
dens i t y o f bed ma te r ia l (sand)
shear s t ress
bed-shear s t ress
r a d i a l component o f T 0
bend angle
Subscr ipts
a c ross-sec t iona l average
c center1 i n e
LIST OF TABLES
Table
1 . 2 .
Page
Minimum Values o f t h e Vane Function. F .................. 13
Summary o f Model Test Condi t ions a t Maximum Rates ................................................. o f Flow 21
Ef fect ive-Radius Ca lcu la t i ons f o r Model Tests ........... 26
Vane-Design Ca lcu la t i ons f o r Model Tests ................ 27
Summary o f Experimental Resul ts o f Vane Tests ........... 33
High-Flow Data from East Nishnabotna R ive r Bend ......... 57
Low-Flow Data from East Nishnabotna R ive r Bend .......... 58
Vane-Design Computations f o r East Nishnabotna R ive r Bend ................................................... -65
Proposed Emplacement o f Vane System f o r East Ni shnabotna R ive r Rend .................................. 71
LIST OF FIGURES
Figure - Page
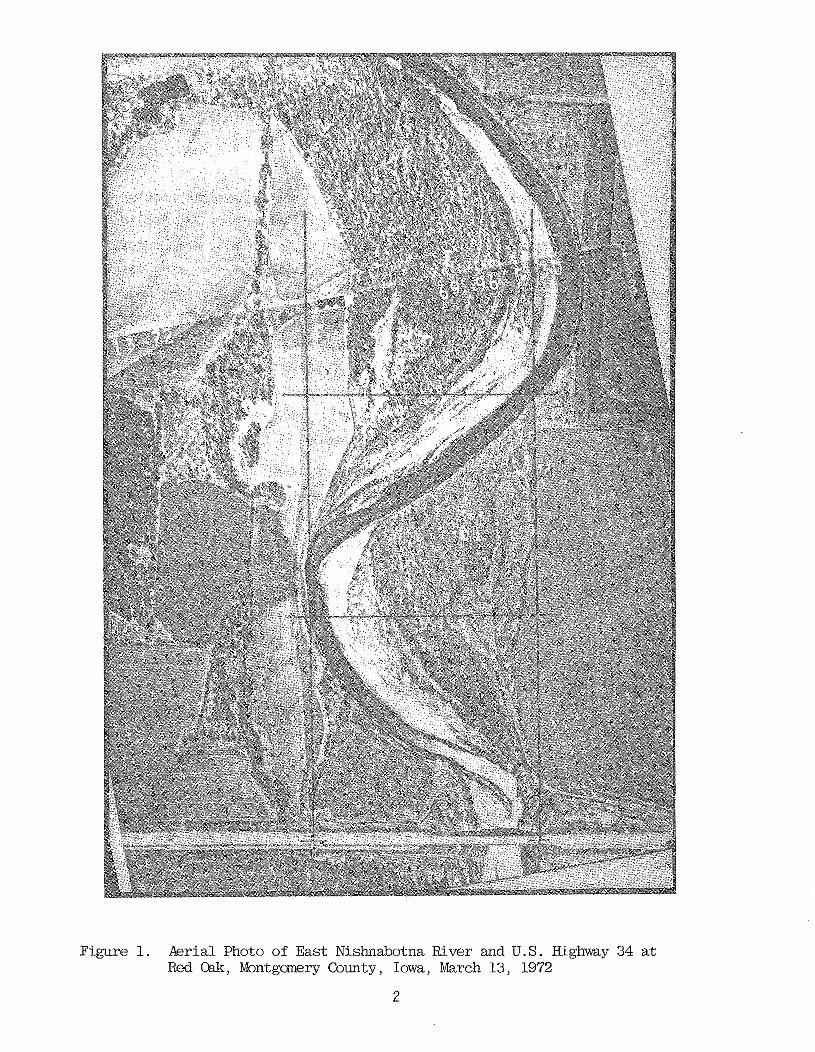
1. A e r i a l Photo o f East Nishnabotna R iver and U.S. Highway 34 a t Red Oak, Montgomery County, ........................................... Iowa, March 13, 1972 2
2. A e r i a l Photo o f East Nishnabotna R iver and U.S. Highway 34 a t Red Oak, Montgomery County, Iowa, March 7, 1977. ................................................. 3
3. A e r i a l Photo o f East Nishnabotna R ive r and U.S. Highway 34 a t Red Oak, Montgomery County, Iowa, ................................................ August 11, 1982 4
4. Sequential Center l ines o f East Nishnabotna R ive r a t Red Oak, Montgomery County, Iowa.. ............................ .6
5. Vane Funct ion F as a Funct ion o f Vane Height-Water ........................ Depth Ratio, H/d, f o r Four Values o f n 12
6. L i f t C o e f f i c i e n t s f o r F l a t - P l a t e Vane.........................17
7. I IHR's Curved Sediment Flume; (a ) Viewed Upstream Toward the Flume I n l e t ; and ( b ) Viewed Upstream Around t h e Curve.....................................................l9
8. Layout o f I IHR's Curved, R e c i r c u l a t i n g Sediment Flume, .......................... w i t h Sect ion Numbers and Bend Angles 20
9. Grain-Size D i s t r i b u t i o n f o r Uniform Bed Sediment, Test Ser ies 1 and 2 .......................................... -22
10. Streamwise V a r i a t i o n o f Transverse Bed Slope Development, Test Ser ies No. 1 ................................ 24
11. Development o f Bed P r o f i l e a t Sect ion 80, Test Ser ies No. 1 .............................................. 25
12. Development o f Bed P r o f i l e a t Sect ion 112, ............................................. Test Ser ies No. 1 25
13. Test Ser ies 1: Measured Radial Average-Dist r i bu t ions o f Depth and Depth-Averaged Mean Ve loc i t y Compared w i t h t h e Pred ic ted D i s t r i b u t i o n s ; (a ) Before I n s t a l l a t i o n o f Vanes; (b) A f t e r I n s t a l l a t i o n o f Vanes.....................28
14. Test Ser ies 1 Vane Emplacement.. ............................. -28
15. Streamwise V a r i a t i o n o f Transverse Bed Slope Develop- ment a f t e r I n s t a l l a t i o n o f Vanes; Test Series No. 1...........30
16. Developme~t o f Bed P r o f i l e s a t Sect ion 80 a f t e r I n s t a l l a t i o n o f Vanes; Test Ser ies No. 1 ...................... 31
17. Development o f Bed P r o f i l e a t Sect ion 112 a f t e r I n s t a l l a t i o n o f Vanes; Test Ser ies No. 1......................31
18. Test Ser ies 2: Measured Radial Average-Dist r ibut ions o f Depth and Depth-Averaged Mean V e l o c i t y Compared w i t h t h e Pred ic ted D i s t r i b u t i o n s ; (a ) Before I n s t a l l a t i o n o f Vanes; (b) A f t e r I n s t a l l a t i o n o f Vanes ..................... 35
19. Test Ser ies 2 Vane and Vane Emplacements ...................... 35
20. Grain-Size D i s t r i b u t i o n f o r Nonuniform Bed Sediment; Test Ser ies No. 3.............................................37
21. Test Ser ies 3: Measured Radial Average-Dist r ibut ions o f Depth and Depth-Averaged Mean V e l o c i t y Compared w i t h t h e Pred ic ted D i s t r i b u t i o n s ; (a ) Before I n s t a l l a t i o n o f Vanes; (b ) A f t e r I n s t a l l a t i o n of Vanes ..................... 38
22. Gra in -s ize D i s t r i b u t i o n s f o r Nonuniform Bed Sediment; ............................................. Test Ser ies No. 4 40
23, Test Ser ies No. 4: Radial Average-Dist r ibut ions o f Depth, Depth-Averaged Mean Ve loc i t y , and Median-Grain Diameter; (a ) Before I n s t a l l a t i o n o f Vanes; (b) A f t e r ............ I n s t a l l a t i o n o f Vanes.. .............. .. ........ .. -41
................... 24. Test Ser ies No. 4 Run 3 Vane Emplacement.. .41
25. Test Ser ies No. 4: Radial Average-Dis t r ibu t ions o f Depth; ( a ) Before I n s t a l l a t i o n o f Vanes; (b) A f t e r I n s t a l l a t i o n of Vanes......................................-..44
26. Test Series No. 5: Radial Average-Dist r ibut ions o f Depth, and Depth-Averaged Mean V e l o c i t y between Sect ions 72 and 112; (a) Before I n s t a l l a t i o n o f Vanes; ( b ) A f t e r I n s t a l l a t i o n o f Vanes ............................... 44
27. Test Ser ies No. 5: Rock Vanes before Admission o f Flow........46
28. Test Ser ies No. 5: Rock Vanes a f t e r Admission o f Flow.........46
N a t u r a l l y Formed Bed Topography i n Test Series No. 4 (Looking Upstream). . . . . . . . . . . . . . . . . . . . . . . . . . . . . . . . . . . . . . . . . . . -48
Bed Topography i n Test Ser ies No. 4 (Looking Upstream) a f t e r I n s t a l l a t i o n o f 14-in. Vanes.. . . . . . . . . . . . . . . . . . . . . . . . . . .48
Depth D i s t r i b u t i o n a t Sect ion 112 i n Test Ser ies No. 4 Before I n s t a l l a t i o n o f Vanes.. . . . . . . . . . . . . . . . . . . . . . . . . . . . . . . . .49
Depth D i s t r i b u t i o n a t Sect ion 112 i n Test Ser ies No. 4 A f t e r I n s t a l l a t i o n o f 14- in Vanes ............................. 49
Close-Up o f Bed w i t h 14-in. Vane (one ba re l y v i s i b l e ) a t Sect ion 112 i n Test Ser ies No. 4 ........................... 50
Bed Topography Downstream from Sect ion 112 i n Test Series No. 4 w i t h 14-in. Vanes............,.......,...........50
Depth D i s t r i b u t i o n a t Sect ion 112 i n Test Series No. 4 A f t e r I n s t a l l a t i o n o f 9- in . Vanes.. .... . . .. . . . ... .. . .. . .. .... .51
Depth D i s t r i b u t i o n a t Sect ion 112 i n Test Ser ies No. 2 A f t e r I n s t a l l a t i o n o f 9- in. Vanes.. . . .. . . ... .. . .. . ... . ..... ... 51
Plan-View Sketch o f I IHR's Sediment Flume Over la id t h e East Nishnabotna R ive r Bend a t Red Oak, Using a Scale R a t i o o f 1 : lO . . .. . . . . . . . . . .. . .. ..... . . .. . . ... ... . . .. .. ... . ... -53
Plan-View Sketch o f t h e East Nishnabotna R ive r Bend a t Red Oak, Iowa.. . . . . . . . . . . . . . . . . . . . . . . . . .. . . .. . . . . . . . . . . . . -54
East Nishnabotna R ive r on May 2, 1984, Looking Upstream from t h e U.S. Highway 3f Br idge .................... ........... 56 Survey a t Sect ion 4, May 2, 1984 ..................... ......... 56
Sect ions 1 through 10 o f t h e East Nishnabotna R ive r Bend.. . . . . . . . . . . . . . . . . . . . . . . . . . .. . . . . . . . *. . . . . . -. . . . . . . . . . . . -59
Rat ing Curve f o r t h e U.S.G.S. Water-Stage Recorder on East Nishnabotna R ive r a t Red Oak ( a t Coolbaugh S t ree t Br idge) . . . . . . . . . . . . . . . . . . . . . . . . .. . . .... . . . . *. . . . *. *. . . .62
East Nishnabotna R ive r on May 2, 1984, Looking Down- stream toward t h e Highway 34 Br idge (The rock pro tec- t i o n i s along t h e r i g h t bank i n t h e upper-center p o r t i o n o f t h e p i c t u r e ) .................. .. ......... ......*... 64
Frequency D i s t r i b u t i o n f o r Discharge i n East Nishnabotna R i v e r a t Red Oak..................................68
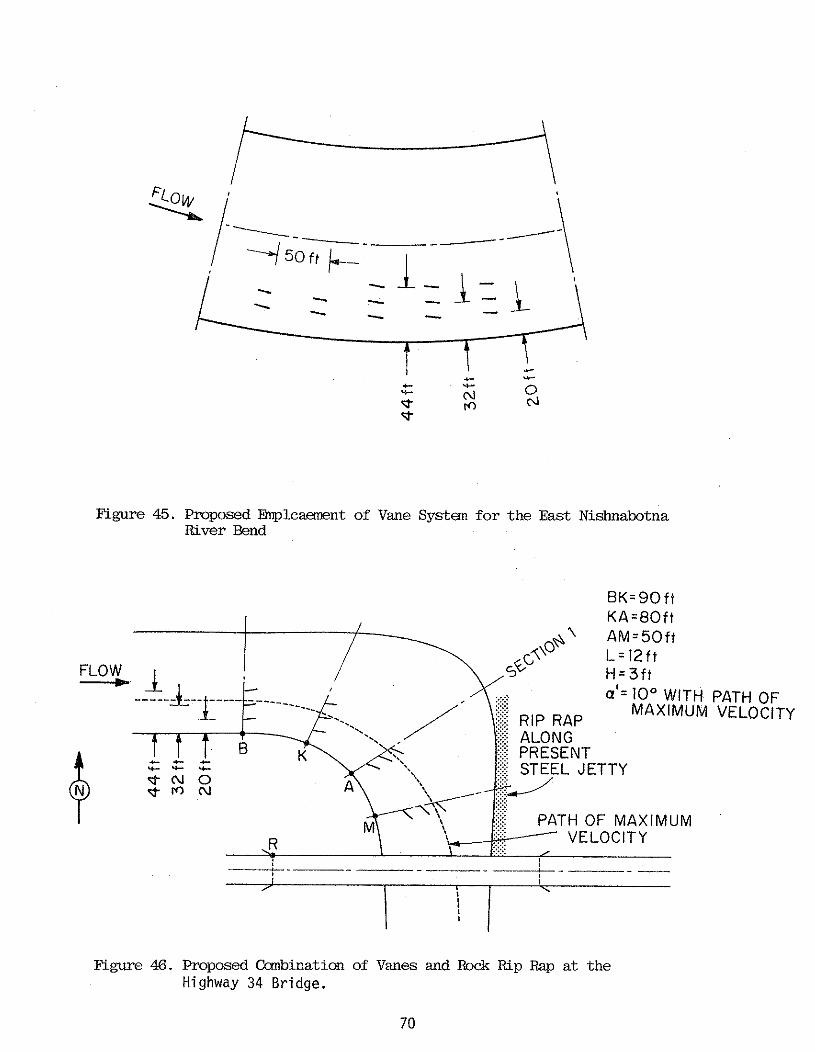
45 . Proposed Emplacement o f Vane System f o r t h e East Nishnabotna R ive r Bend ........................................ 70
46 . Proposed Combination o f Vanes and Rock R ip Rap a t t h e Highway 34 Br idge ............................................. 70
47 . U.S. Highway 34 Br idge over East Nishnabotna River. Viewed Downstream toward R igh t Bank o f R i v e r .................. 75
48 . U.S. Highway 34 Br idge over East Nishnabotna River. Viewed Downstream from L e f t Bank o f R i v e r ..................... 75
SUBMERGED VANES FOR FLOW CONTROL AND BANK PROTECTION I N STREAMS
I . INTRODUCTION
The f i n a l repo r t on work conducted under t h e Streambank Erosion
Cont ro l Evaluat ion and Demonstration Act o f 1974 (Sect ion 32, Pub l i c
Law 93-251) was submitted r e c e n t l y t o Congress by t h e U.S. Army Corps
o f Engineers (December 1981). The main conclus ion o f t h e work was
t h a t streambank eros ion cont inues t o be a ser ious problem along many
o f t h e Nat ion 's streams and waterways, r e s u l t i n g i n ser ious economic
losses o f p r i v a t e and p u b l i c lands, br idges, etc. According t o t h i s
repor t , approximately 148,000 bank-miles of streams and waterways are
i n need o f e ros ion pro tec t ion . The cost t o a r r e s t o r c o n t r o l t h i s
eros ion, us ing convent ional bank p r o t e c t i o n methods c u r r e n t l y
ava i l ab le , was est imated t o be i n t h e excess o f $1 b i l l i o n annual ly .
The problem i s d i f f i c u l t because bank eros ion i s o f t e n t h e
r e s u l t o f a complex i n t e r a c t i o n between water and sediment i n t h e
streams. The sediment-transport capac i ty and eros ion p o t e n t i a l o f a
stream f l ow become g rea te r w i t h i nc reas ing boundary shear s t ress and
f l o w v e l o c i t y . Along curved reaches and i n bends, t h e i n t e r a c t i o n
between t h e v e r t i c a l g rad ien t o f streamwise v e l o c i t y and t h e
curva ture o f the pr imary f l o w generates a so-ca l led secondary o r
s p i r a l l i n g f low, which produces l a r g e r depths and t h e r e f o r e a l s o
l a r g e r v e l o c i t i e s and boundary shear s t resses near t h e ou te r
(concave) bank. The channel deepening undermines t h i s bank, and t h e
l a r g e r l o c a l v e l o c i t i e s a t tack it, and thus i s t h e stage s e t f o r
r iver-bank erosion.
The problem i n Iowa i s i l l u s t r a t e d i n Figs. 1, 2, and 3, which
show a e r i a l photos o f East Nishnabotna R iver a t Red Oak, Montgomery
County. The photos were taken a t 5-year i n t e r v a l s i n 1972, 1977, and
1982, Over the 10-year per iod, a t o t a l o f 20 acres o f farmland was
l o s t by bank eros ion a long t h i s 1.6-mile reach o f t h e r i v e r , Eros ion
a t a comparable r a t e i s occur ing along t h e e n t i r e leng'eh o f East
Figure 1. Aerial Photo of East Nishnabotna River and U.S. Kighway 34 a t Red (Xak, Montgmery County, Iowa, March 13, 1972
figure 2. &rial Photo of East Nishnabotna River and U.S. Highway 34 at Red Qak, Montgomery County, Iowa, March 7, 1977
Figure 3. Aerial Photo of East Nishnabotna River and U.S. Iiighway 34 a t Red Oak, Montgcmery County, Iowa, August 11, 1982
4
Nishnabotna River, and along a very s i g n i f i c a n t p a r t o f a l l t h e
r i v e r s i n Iowa. Many highways and br idges throughout t h e Sta te are
i n imminent danger o f being damaged by bank erosion. Examples are:
Highway (HW) 34's cross ings o f West and East Nishnabotna River ,
Walnut Creek, and West Nodaway River ; HW 6 ' s c ross ing o f West
Nishnabotna River ; HW 92's c ross ing o f East Nishnabotna River ; HW 2 ' s
c ross ing o f West Nodaway River; HW 101's c ross ing o f Cedar River ; HW
136's c ross ing o f Maquoketa River; I 35's c ross ing o f Raccoon R iver ;
HW 611 80 's c ross ing o f West Nodaway River ; the sec t i on o f HW 175
t h a t i s running along Maple River ; i n p a r t i c u l a r a t Castana and
B a t t l e Creek; and HW 183 along S o l d i e r River.
A t some o f these l o c a t i o n s p r o t e c t i v e measures have been
i n s t a l l e d by t h e Iowa Department o f Transportat ion. The methods i n
cu r ren t general use i n v o l v e e i t h e r armoring o f concave banks by one
means o r another, ranging from paving w i t h stone o r concrete t o
enhanced vegeta t ive cover; o r reduc t ion o f t h e nearbank v e l o c i t y by
d i kes o r o the r s t r u c t u r e s t h a t increase t h e l o c a l channel
roughness. Many o f these methods are o f a temporary nature and do
n o t so lve t h e problem on a long-term basis. For example, HW 34 ' s
c ross ing o f East Nishnabotna R ive r ( a t Red Oak, Montgomery County) i s
p r e s e n t l y be ing pro tec ted by r i p - r a p s t r u c t u r e s along c e r t a i n reaches
o f t h e r i v e r bank j u s t upstream from t h e crossing. I n a few years
t ime a major sec t i on o f t h e r i p - r a p s t r u c t u r e i s going t o be
undermined from behind and washed away unless subs tan t i a l , a d d i t i o n a l
p r o t e c t i o n work i s undertaken. The problem a t t h i s l o c a t i o n i s seen
very c l e a r l y on t h e a e r i a l photos i n Figs. 1, 2, and 3; and i n Fig. 4
which shows t h e l o c a t i o n o f t h e channel-center l i n e i n 1972, 1977,
and 1982). The present r i p - r a p s t r u c t u r e along t h e r i g h t bank o f t h e
r i v e r (between t h e po in t s A and B i n F ig. 2, a t o t a l o f 600 f t ) ,
which was i n s t a l l e d i n 1977, has so f a r o f f e r e d exce l l en t p r o t e c t i o n
o f t h e highway. However, du r ing t h e 10-year period, shown i n t h e
f i gu res 1, 2, 3, and 4, apex o f t h e lower meander curve has moved
approximately 500 ft southward and i s now on ly about 500 i t from t h e
SCALE (FT) I I I I I 0 200 400
U.S. HIGHWAY 34 f .
Fig. 4 - Sequential Centerlines of East Nishnabotna River at Red Oak,. Montgomery County, Iowa.
6
highway. It i s obvious t h a t t h e present bank p r o t e c t i o n w i l l be
i n s u f f i c i e n t f o r t h e p r o t e c t i o n o f t h e highway i n t h e fu tu re . A t t h e
present r a t e o f bank eros ion a t t h i s s i t e , t h e r i p - r a p s t r u c t u r e
between A and B w i l l be undercut and 1000 ft o f Highway 34, i n c l u d i n g
t h e highway br idge, w i l l be s e r i o u s l y damaged w i t h i n t h e next 5 t o 7
years unless a d d i t i o n a l p r o t e c t i o n i s provided. Problems of s i m i l a r
na ture are being faced a t several o the r highway sec t ions and b r i dge
crossings i n Iowa, some o f which were mentioned i n t h e preceding
paragraphs.
Many minor roads i n Iowa a l so face t h i s problem. Examples here
are the low-water cross ings where d ips i n the road have been prov ided
t o a l l ow f l o o d f lows t o pass t h e road. As t h e courses o f most
streams tend t o change w i t h time, t h e f l o o d f lows are o f t e n seen t o
a t tack t h e roads a t p o i n t s (away from these d ips ) t h a t a re no t
designed t o w i ths tand t h e impact o f h igh v e l o c i t y f low. I n such
cases t h e r e i s a need f o r a simple inexpensive technique t h a t can
i n s u r e t h a t t h e f l o o d f lows always cross t h e roads a t t h e
predesignated po in ts .
Considering t h e r i s k s t h a t are a t stake a t so many sec t ions o f
Iowa's highway system, which i s one o f t h e S ta te ' s major investments,
and cons ider ing t h e inadequacy o f t h e p r o t e c t i o n methods t h a t a re i n
cu r ren t use, t he re appears t o be an urgent need f o r t h e development
o f new ideas o r approaches f o r t h e safeguarding o f these investments
aga ins t t h e eros ive a t tack o f t h e streams.
Th is study was conducted f o r t h e purpose o f eva lua t i ng a new
concept f o r a bank-protect ion s t ruc tu re : The Iowa Vane (Odgaard and
Kennedy, 1983). The under ly ing idea invo lves counter ing t h e to rque
exer ted on the pr imary f l o w by i t s curvature and v e r t i c a l v e l o c i t y
g rad ien t , thereby e l i m i n a t i n g o r s i g n i f i c a n t l y reducing t h e secondary
f l o w and thus reducing t h e undermining o f t h e ou te r banks and t h e
h i g h - v e l o c i t y a t tack on it. The new s t r u c t u r e cons i s t s o f an a r ray
o f shor t , v e r t i c a l , submerged vanes i n s t a l l e d w i t h a c e r t a i n
o r i e n t a t i o n on t h e channel bed. A r e l a t i v e l y small number o f vanes I can produce bend f lows which are p r a c t i c a l l y un i fo rm across t h e
channel. The he igh t o f t h e vanes i s l e s s than h a l f t h e water depth,
and t h e i r angle w i t h the f l ow d i r e c t i o n i s o f t h e order o f loo. I n
t h i s study, design r e l a t i o n s have been es tab l ished (Chapter 11). The
r e l a t i o n s , and t h e vanes' o v e r a l l performance, have been t e s t e d i n a
l abo ra to ry model under d i f f e r e n t f l o w and sediment cond i t i ons
(Chapter 111). The r e s u l t s are used f o r t h e design o f an Iowa-Vane
bank p r o t e c t i o n s t r u c t u r e f o r a sec t i on (Fig. 3) o f East Nishnabotna
R ive r a long U.S. Highway 34 a t Red Oak, Iowa (Chapter IV) .
11. THEORETICAL ANALYSIS
The o b j e c t i v e o f t h e ana lys is i n t h i s chapter i s t o e s t a b l i s h a
se t o f design r e l a t i o n s f o r use i n t h e design o f a vane system f o r
t h e p r o t e c t i o n o f r i v e r banks. The vane system i s t o produce a
reduc t i on o f near-bank depth and v e l o c i t y s u f f i c i e n t t o prevent t h e
banks from be ing undermined and eroded. It fo l l ows t h a t t h e design
c r i t e r i a are r e l a t e d t o maximum a l lowab le values f o r near-bank depth
and v e l o c i t y . Preceding s tud ies have shown (Odgaard, 1984) t h a t t h e r a d i a l
d i s t r i b u t i o n o f depth-averaged mean v e l o c i t y i n t h e f u l l y developed
p a r t o f a constant- radius r i v e r curve can be adequately descr ibed by
an equat ion based on Oarcy-Weishach's res is tance law:
i n which TT = depth-averaged mean v e l o c i t y a t rad ius r from t h e center
o f t h e curve; d = depth o f f l ow a t rad ius r; and k = f a c t o r of t h e
order 2/3. Subscr ipt c denotes t h e center-1 i n e values. General ly,
t h e c e n t e r - l i n e value o f d can be se t equal t o t h e c ross-sec t iona l
average depth, da, and t h e v a r i a t i o n o f depth can be taken t o be
l i n e a r i n t h e r a d i a l d i r e c t i o n :
i n which ST = r a d i a l o r t ransverse slope o f t h e bed surface.
According t o Odgaard (1984), ST i s r e l a t e d t o pr imary f l ow va r iab les
by t h e equat ion
i n which 8 = Sh ie lds ' (1936) parameter; and FD = densimetr ic p a r t i c l e Froude number de f i ned as
i n which D = median-grain s i z e o f t h e bed ma te r ia l ; g = acce le ra t i on
due t o g r a v i t y ; ua = cross-sect ional average v e l o c i t y ; and p and p s =
dens i ty o f f l u i d and bed sediment, respec t i ve l y . S u b s t i t u t i n g Eq. 2
i n t o Eq, 1 y i e l d s t h e f o l l o w i n g r e l a t i o n s h i p between ST and c:
Hence, a c r i t e r i o n f o r i s equ iva len t t o a c r i t e r i o n f o r ST, and t h e
design o b j e c t i v e f o r t h e vane system can be formulated as a maximum
a l lowab le value f o r ST. TO reduce (o r e l i m i n a t e ) t h e t ransverse bed
s lope ST, t h e vane system must reduce ( o r e l i m i n a t e ) t h e secondary f l o w i n t h e r i v e r curve.
The e f fec t i veness o f a vane depends on t h e l i f t and drag induced
by t h e f low as i t passes t h e vane, and t h e he igh t o f t h e vane i n
r e l a t i o n t o t h e water depth. (The l i f t i s t h e sum o f t h e fo rces
(pressure and v iscous) t h a t acts normal t o t h e free-stream d i r e c t i o n ;
t h e drag i s t h e sum t h a t ac ts p a r a l l e l t o t h e f ree-st ream
d i r e c t i o n ) . The l i f t and drag, i n t u rn , depend on t h e shape o f t h e
vane; i t s aspect r a t i o (he igh t - length r a t i o ) ; and angle o f inc idence
w i t h t h e free-stream d i r e c t i o n , a. To maximize t h e e f fec t i veness of
a vane design, t h e moment o f t h e l i f t f o r c e about t h e c e n t r o i d of t h e
channel-cross sec t i on must be maximized and t h e drag force on t h e
vane must be minimized ( l a r g e drag would change t h e o v e r a l l
c h a r a c t e r i s t i c s o f t h e r i v e r f l ow inc reas ing channel roughness, which
should be avoided). I n add i t ion , t h e vane emplacement must be
designed such t h a t t h e e f fec t iveness o f t h e vane ar ray as a whole i s
maximized. I n o the r words, adverse i n t e r f e r e n c e among t h e vanes must
be avoided (cascade e f f e c t ) . The f o l l o w i n g ana lys is prov ides a guide
t o t h e design o f a vane system.
A. Vane Function
The secondary f l ow i n a r i v e r curve i s produced by t h e torque,
T ~ . due t o t h e c e n t r i f u g a l fo rce being d i s t r i b u t e d nonuni formly over
t h e depth. For f u l l y developed f l ow i n a rec tangu lar channel w i t h
constant rad ius and a power-law v e l o c i t y d i s t r i b u t i o n , Tc i s g iven by (Eq. 3 i n Ref. 3)
i n which $ = inc luded bend angle; b = channel width; and n =
v e l o c i t y - p r o f i l e exponent. n i s r e l a t e d t o t h e Darcy-Weisbach
f r i c t i o n fac to r , f, by (Zimmermann and Kennedy, 1978)
i n which K = von Karman's constant. (Hence, n = K S =
l o n g i t u d i n a l s lope o f water sur face) . The Iowa Vanes exe r t a to rque
on t h e f l o w t h a t i s g iven by (Eq. 6 i n Ref. 3, w i t h ~ I I sina = c ) L
i n which c ~ = l i f t c o e f f i c i e n t ; L = vane length ; H = vane he igh t ; and
N = number o f vanes. To e l i m i n a t e t h e secondary f l ow t h a t i s
generat ing t h e t ransverse bed slope, ST, t h e vanes must*. e x e r t a to rque t h a t balances t h e d r i v i n g torque, Tc. Equat ing Tc and Tv
y i e l d s
1 rc NLH 7 C L (*I (rn) = F
C
F i s a f u n c t i o n (termed the vane f u n c t i o n ) o f n and H/d g iven by
F = 1
2/n H (10)
(a ) C(n+l)-(n+2) 51 Fq, 9 y i e l d s t h e t o t a l vane area ( l i f t i n g sur face) needed per u n i t
sur face area o f channel bed [NHL/(rc4b)l as a f u n c t i o n o f t h e rad ius-
donth r a t i o o f the channel, rc/d; l i f t c o e f f i c i e n t , CL; and t h e vane func t i on , F = F(n,H/d). The vane f u n c t i o n i s graphed i n F ig . 5. It
i s seen t h a t f o r given value o f H/d t h e value o f F, and t h e r e f o r e t h e
requ i red l i f t i n g surface, increases when n decreases ( i .e., when t h e
f r i c t i o n a l res is tance increases) . The vane func t i on has i t s minimum
a t H/d = 2(n+l) /(n+2)2:
Corresponding values of Fmin, H/d, and n are l i s t e d i n Table 1. The
vane f u n c t i o n i s seen t o be r e l a t i v e l y i n s e n s i t i v e t o v a r i a t i o n s o f
H/d over a f a i r l y l a r g e range o f H/d-values. For example, f o r n = 4,
F i s w i t h i n 20% o f i t s minimum value ( t h e design value) when H/d i s
w i t h i n t h e range o f 0.12 < H/d < 0.48 ( t h a t i s , when t h e water depth
i s between 2 and 8 t imes t h e vane h e i g h t ) . A t y p i c a l r i v e r bend
Figure 5. Vane Function F a s a Function of Vane Height-Water Depth Ratio, H/d, for Four Values of n
Table 1 - Minimum Values o f t h e Vane Funct ion, F.
V e l o c i t y M i nimum Value of H/d-range w i t h i n p r o f i l e value o f H/d a t which which F - < 1.2 Fmin
exponent, F 9 Fixin F = Fmi ,, n
would have an r c / d r a t i o o f about 100 and an n value o f about 4.
Wi th H/d = 0.28 ( y i e l d i n g F = 0.57), and CL = 1 ( t h e s e l e c t i o n of t h e
CL - value w i l l be discussed i n Sect ion C) , Eq. 9 shows t h a t t h e
t o t a l l i f t i n g sur face requ i red would then be 1,14% o f t h e sur face
area o f t h e channel bend. With a width-depth r a t i o , b/d, o f 10,
which i s t y p i c a l , t h e t o t a l l eng th o f vanes requ i red (NL) i s 41% of
t h e l e n g t h o f the channel t o be pro tec ted ( r c+ ) . Adding 20% t o a l l ow
f o r t h e aforementioned f l u c t u a t i o n i n water depth y i e l d s t h e
percentages 1.37 and 49, respec t i ve l y .
8. Effective Bend Radius
Eq. 9 app l ies t o fu l ly-developed, constant- radius bend f low.
Most na tu ra l bends are not constant- radius bends, nor i s t h e f l o w i n
them f u l l y developed, and E q . 9 cannot be used. However, i f t h e
channel 's r a d i a l d i s t r i b u t i o n o f depth i s known (measured) an
e f f e c t i v e - r a d i u s concept can be used f o r t h e vane design. The
e f f e c t i v e radius, r e i s t h e rad ius a t which a fu l l y -deve loped, constant- radius bend f l o w would form a t ransverse bed s lope o f t h e
known o r measured magnitude. According t o E q . 3, re i s then r e l a t e d
t o t h e t ransverse bed slope, ST, by t h e equat ion
The vanes must produce a to rque t h a t balances t h e torque, Tc, respons ib le f o r t h i s t ransverse bed slope. The d r i v i n g to rque i n
t h i s case i s g iven by Eq. 6 w i t h 41 = $Ie, where $I = e f f e c t i v e bend e angle ( t h e angle corresponding t o t h e e f f e c t i v e radius, r e ) . The design r e l a t i o n , obta ined by equat ing Tc and Tv, then reads
Eqs. 9 and 14 are based on complete e l i m i n a t i o n of t h e secondary
c u r r e n t and t h e achievement o f zero t ransverse bed slope. P r a c t i c a l
cons idera t ions may no t j u s t i f y such an i d e a l (asymptot ic)
o b j e c t i v e . Also, t h e vane he igh t o r t h e t o t a l number o f vanes ( o r
bo th) may become a p r a c t i c a l problem, i n which case lower o r fewer
vanes ( o r both) may have t o be combined w i t h minimal s lope p r o t e c t i o n
on t h e banks. A vane system would be adequate i f it can make t h e
bank-shear s t ress s tay below t h e c r i t i c a l value a t a l l f l o w rates.
I f t h e c r i t i c a l bank-shear s t ress i s r e l a t i v e l y h igh due t o s lope
p ro tec t i on , some t ransverse s lope on t h e r i v e r bed may be
acceptable. I f t h e acceptable t ransverse bed s lope i s ST^, t h e vanes must produce a to rque t h a t can reduce t h e s lope from ST t o ST^, or,
accord ing t o Eq. 12, increase t h e e f f e c t i v e rad ius from re t o reos where
The requ i red l i f t i n g sur face (NLH) would then be obta ined as t h e
d i f f e r e n c e between t h e l i f t i n g sur face requ i red f o r zero ing ST and
t h a t requ i red f o r zero ing ST^:
2 1 1 NHL = c Frc@ bd (r - r) L e eo
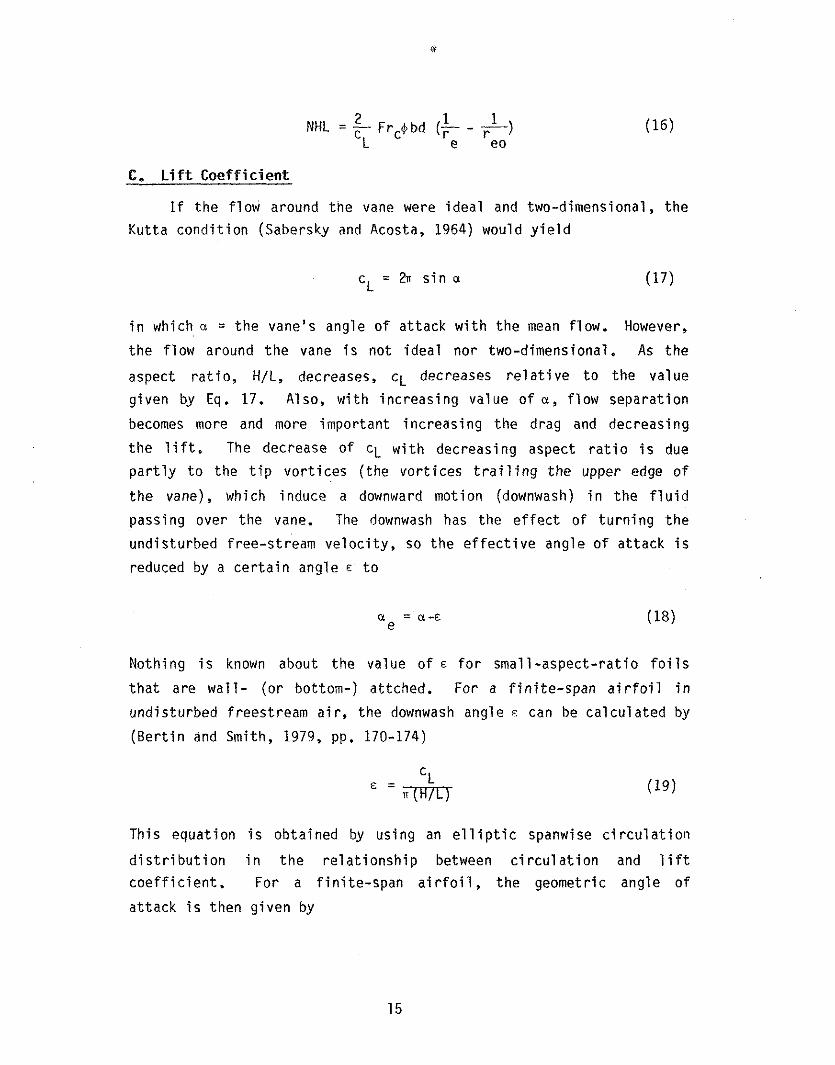
C. L i f t C o e f f i c i e n t
I f t h e f l o w around t h e vane were i d e a l and two-dimensional, t h e
Kut ta c o n d i t i o n (Sabersky and Acosta, 1964) would y i e l d
cL = ~ I I s i n a (17)
i n which a = t h e vane's angle o f a t tack w i t h t h e mean f low. However,
t h e f l ow around t h e vane i s not i d e a l nor two-dimensional. As t h e
aspect r a t i o , H/L, decreases, CL decreases r e l a t i v e t o t h e value
g iven by Eq. 17. Also, w i t h increas ing value o f a, f l o w separat ion
becomes more and more important inc reas ing t h e drag and decreasing
t h e l i f t . The decrease of CL w i t h decreasing aspect r a t i o i s due
p a r t l y t o the t i p v o r t i c e s ( the v o r t i c e s t r a i l i n g t h e upper edge o f
t h e vane), which induce a downward motion (downwash) i n t h e f l u i d
passing over t h e vane. The downwash has the e f f e c t o f t u r n i n g t h e
undisturbed f ree-st ream v e l o c i t y , so t h e e f f e c t i v e angle o f a t tack i s
reduced by a c e r t a i n angle E t o
Nothing i s known ahout t h e value o f E f o r smal l -aspect - ra t io f o i l s
t h a t are w a l l - ( o r bottom-) attched. For a f i n i t e -span a i r f o i l i n
undisturbed f reestream a i r , t h e downwash angle F can be ca l cu la ted by
( B e r t i n and Smith, 1979, pp. 170-174)
This equat ion i s obta ined by us ing an e l l i p t i c spanwise c i r c u l a t i o n
d i s t r i b u t i o n i n t h e r e l a t i o n s h i p between c i r c u l a t i o n and l i f t
c o e f f i c i e n t . For a f i n i t e - s p a n a i r f o i l , t h e geometric angle o f
a t tack i s then g iven by
I f two a i r f o i l s have t h e same l i f t c o e f f i c i e n t and e f f e c t i v e angle of
a t tack , bu t d i f f e r e n t aspect r a t i o s , Hl/Ll, and H2/L2, t h e i r
geometric angles o f a t tack , al and a2, a re thus r e l a t e d by t h e
equat ion
The v a l i d i t y o f Eqs. 20 and 21 have been v e r i f i e d exper imenta l l y
( B e r t i n and Smith, 1979) f o r a i r f o i l s w i t h aspect r a t i o g rea te r than
o r equal t o one. For a bottom-attached f l a t p l a t e i t i s t e n t a t i v e l y
assumed t h a t Eq. 17 app l ies a t l a r g e aspect r a t i o s , and t h a t t h e
downwash angle i s h a l f t h a t g iven by Eq. 19 (as a bottom-attached
f o i l has on ly one edge w i t h t i p v o r t i c e s ) . Using Eq. 21, t h e l i f t
c o e f f i c i e n t can then be determined as a f u n c t i o n o f a and H/L (Fig.
6 ) . Note t h a t a l though the aforementioned assumptions a r e reasonable, they have no t been v e r i f i e d exper imenta l ly .
The angle a t o be used f o r t h e c a l c u l a t i o n s of CL i s t h e angle
as seen by t h e f l u i d approaching t h e vane. Because o f t h e
c e n t r i f u g a l acce lera t ion , t h e near-bed v e l o c i t y d i s t r i b u t i o n ( t h e
v e l o c i t y d i s t r i b u t i o n seen by t h e vane) i s skewed toward t h e i n s i d e
o f t h e bend. The angle the near-bed v e l o c i t y forms w i t h t h e mean-
f l o w d i r e c t i o n , 6 , i s g iven by (Falcon, 1979)
T r 6 = arc tan (-) T
0 (22)
i n which T = bed-shear s t ress; and T = r a d i a l component o f T . 0 2 2 -2 r -2 0
S u b s t i t u t i n g r o = (K /n ) P U and T r = P (n+l) / [n(n+2)] (d / re ) u
(Falcon, 1979) i n t o Eq. 22 y i e l d s
1 n (n t1 ) d 6 = arc tan f7 n+2 -1
K e
ANGLE OF ATTACK, a (degrees)
Figure 6. Lift Coefficients for Flat-Plate Vane
Hence, i f a vane i s p laced a t an angle w i t h t h e mean-flow d i r e c t i o n
o f a', t h e angle a t o be used f o r t h e c a l c u l a t i o n o f CL i s g iven by
111. LABORATORY-MODEL EXPERIMENTS
The v a l i d i t y o f t h e fo rego ing design r e l a t i o n s , and t h e
e f fec t i veness o f t h e vanes i n producing more un i fo rm l a t e r a l
d i s t r i b u t i o n s o f depth and ve loc i t y , were tes ted i n I IHR's 250- f t
long, 8 - f t wide, and 2 - f t deep, curved, r e c i r c u l a t i n g sediment f lume
(Fig. 7) Fig. 8 shows t h e l a y o u t o f t h e flume w i t h sec t i on numbers,
which are the distances, i n fee t , from t h e i n l e t , measured along t h e
i n n e r f lume wa l l . The c e n t e r - l i n e rad ius o f t h e curved p a r t o f t h e
f lume i s 43 ft. The ins t rumenta t ion and measurement technique were
descr ibed by Odgaard and Kennedy (1983). Tests were conducted w i t h
bo th un i fo rm and nonuniform bed ma te r ia l w i t h smooth and rough banks;
w i t h d i f f e r e n t vane lengths and emplacement; and w i t h vanes composed
o f modeled sheet p i l i n g and steep-sided windrows o f rock. A summary
o f t e s t cond i t i ons i s g iven i n Table 2.
A. Verification of Design Relations
The formula f o r t h e t ransverse bed slope, Eq. 12, and t h e vane-
design r e l a t i o n s , Eqs. 9, 14, o r 16, were tes ted i n t h ree se r ies o f
experiments w i t h two d i f f e r e n t grades o f bed sediment.
1. Uniform Bed Sediment - I n Test Ser ies No. 1, t h e sediment
was sand w i t h a median diameter o f 0.30 mm and a geometric standard
d e v i a t i o n o f 1.45 (Fig. 9). The sand was p laced i n t h e f lume i n a 9-
i n . t h i c k l a y e r throughout. A f t e r about an hour o f g e n t l e wet t ing,
t h e sand bed was subjected t o a f l ow o f 5.2 c f s f o r a pe r iod o f 160
hours. The bed topography was measured a f t e r per iods o f 10, 20, 40,
F i g u r e 7. I I H R ' s W e d Sediment Flume; (a) Viewed U p s t r e a m Toward the Flume I n l e t ; and (b) Viewed Ups t r eam Around the Curve
U - U 0 4 8 12 16 20
SCALE IN FEET
Pigure 8. Layout of IIHR's Curved, Recirculating Sediment Flume, with Section NLnnbers and Bend Angles
Table 2.
Summ
ary of Model Test C
onditions at Maximum Rates of F
low
Test
Series
Plow rate,
in cubic feet per second
cross-sectional M
edian- average depth,
grain da, in feet
diameter, D
in m
illimeters
Geom
etric standard deviation
of bed material L
ongitudinal V
elocity- C
ross-Sectional
Condition
slope of profile
average velocity, of channel
water
exponent u,,
in feet side w
all surface
per second
1.45 0.00104
4.0 1.30
smooth
1.45 0.00146
3.5 1.40
rough
1.90 0.00063
6.5 1.56
smooth
2.78 0.00217
3.1 1.45
rough
SIZE, IN MILLIMETERS
Figure 9. Grain-Size Distribution f o r Uniform Bed Sediment, Test Ser ies 1 and 2
80, and 160 hours. Each time, t h e depth was measured a t 19 p o i n t s
across each o f 25 sect ions throughout t h e bend. A t each sec t i on t h e
topography was charac ter ized by t h e t ransverse slope o f t h e bed as
determined by l i n e a r regression. (The ac tua l s lope was not complely
constant across t h e channel e s p e c i a l l y not a t t h e end o f t h e t ime
per iod ; however, the t e s t o b j e c t i v e d i d not c a l l f o r any h igher
degree o f mathematical s o p h i s t i c a t i o n ) . The t ransverse bed s lope
changed q u i t e r a p i d l y w i t h i n t h e f i r s t 10 hours a f t e r t h e s t a r t o f
t h e t e s t (Fig. 10). A f t e r 10 hours, t h e changes were minor. The
maximum transverse bed slope (0.092) developed a t Sect ions 80 and
84. Figs. 11 and I 2 show t h e bed p r o f i l e a t Sect ions 80 and 112 a t
t imes 0, 10, and 160 hours. Over t h e 160-hour per iod, a t o t a l o f 30
f t3 o f sand was moved from t h e ou te r h a l f o f t h e channel t o t h e i n n e r
h a l f generat ing po in t bars and scour holes, t y p i c a l fea tures o f an
a l l u v i a l channel bend. The l o n g i t u d i n a l slope o f t h e water surface,
and t h e cross-sect ional average depth and v e l o c i t y were measured t o
be 0.00104, 0,50 ft, and 1.30 f t / sec , respect ive ly . Thus, FD = 5.67,
n = 4.0, and u* = ~ u ~ / n = 0.10 f t / sec (u* = shear v e l o c i t y =
4%). The value o f t h e boundary Reynolds number, u,D/v (v = 0
k inemat ic v i s c o s i t y ) , was approximately 12 y i e l d i n g ( f rom Sh ie lds '
curve) a Shie lds parameter o f O = 0.04. Based on these f l o w data,
E q . 12 p r e d i c t s a t ransverse bed s lope o f ST = 0.063. This s lope i s
seen (Figs. 10 and 13a) t o compare favorab ly w i t h those measured,
i n d i c a t i n g t h a t t h e theory on which t h e vane-design formula i s based
i s v a l i d .
The vane-design formula was tes ted w i t h a system o f 42 14-in.
long vanes (plane pieces o f 28-gage galvanized s t e e l ) each placed a t
an angle o f 15 degrees t o t h e mean-flow d i r e c t i o n . Th is system
corresponds w i t h the design o b j e c t i v e o f oh ta in ing a reduct ion o f t h e
t ransverse bed slope t o 0.03 throughout t h e bend. The design
c a l c u l a t i o n s f o r t h i s o b j e c t i v e are summarized i n Tables 3 and 4.
Because o f t h e s i g n i f i c a n t v a r i a t i o n o f t h e t ransverse bed s lope
a long t h e channel, the c a l c u l a t i o n s are based on t h e e f f e c t i v e - r a d i u s
Figure 10. Streamwise Variation of Transverse Bed Slope Developnent, Test Series No. 1
Figure
Figure
v =
...... t=o --- f = I0 hours - 1 = 160 hours
I 8
0 1 2 3 4 5 6 7 8 DISTANCE FROM LEFT BANK (11)
11. Developent of B d Profile a t Section 80, Test Series No. 1
, 0 I 2 3 4 5 6 7 8
DISTANCE FROM LEFT BANK (fl)
v = - ...... t:O --- t = I0 hours -
1 = 160 hours
- .. - . . .. , , .* .. . . .. .
-
-
-
12. Bve lopent of B d Profile a t Section 112, Test Series No. 1
00
0 . 2
0 .4
0.6
0.8
1.0
Tab
le 3
. E
ffec
tive
-Rad
ius
Cal
cula
tion
s for
Mod
el Tests
Tes
t L
engt
h Sh
ield
s'
Par
ticl
e T
rans
vers
e bed
slo
pe
Eff
ecti
ve r
adiu
s se
ries
ch
anne
l rea
ch,
fact
or,
Frou
de n
umbe
r,
-run
no.
re
+,
in f
eet
t)
F~
Mea
sure
d,
Des
ired
, re
, in
fee
t re
,, in
fee
t ST
'T
O
(bas
ed o
n ST
) (b
ased
on
ST,)
Figure 13. %st Series 1: Measured Radial Average-Distribution of Depth and Depth-Averaged Mean Velocity CcPnpared with the Predicted Distributions; (a) Before Installation of Vanes; (b) After Installation of Vanes
Z 1.3 - a 7 1.3 - -
1.2- 2 \ - 1.2 - -
ol= 1.1 - - 1.1 - w >r
-
E t 1.0- - 1.0 - - -
$ y OL- * MEASUREMENT 08- 0 MEASUREMENT 0.7- - THEORY 0.7- -THEORY
Figure 14. Test Series 1 Vane Emplacement
28
1.3
1.2
I. I 1.0
0.9
0 8
0.7
0 1 2 3 4 5 6 7 8 0 1 2 3 4 5 6 7 8 DISTANCE FROM LEFT BANK ( f f )
concept. Between Sect ions 64 and 100, t h e average t ransverse bed
s lope was measured t o be ST = 0.070, y i e l d i n g an e f f e c t i v e rad ius o f
38.9 ft. Between Sect ions 100 and 176 ( t h e end o f the bend), t h e
t ransverse bed s lope was 0.045, y i e l d i n g an e f f e c t i v e rad ius o f re =
60.5 ft. The "desi red" e f f e c t i v e rad ius ( t h a t corresponding t o STo =
0.030) i s re, = 90.7 ft. To meet t h e o b j e c t i v e a t minimum l i f t
surface, t h e vane he igh t H must be about 33% o f t h e water depth a t
the vanes. (Note t h a t because CL decreases when HIL decreases, NHL
i s not minimum when F i s minimum). As the vanes a r e p laced a t a
d is tance from the channel-center l i n e o f 2 t o 3 ft, and are t o reduce
t h e water depth t h e r e t o approximately 0.6 ft, t h e i r he igh t should be
H = 0.2 ft, y i e l d i n g an aspect r a t i o o f approximately 0.2. The near-
bed d e v i a t i o n angle i s ca l cu la ted from Eq. 22 ( w i t h n = 4.0, d = 0.6
ft, and re = (90.7 + 2.5) f t ) t o be 6 r7O, y i e l d i n g a t o t a l angle o f a t tack o f a = 15" + 7' = 22". According t o Fig. 6, t h e l i f t
c o e f f i c i e n t i s then CL - 0.4. The value o f F i s obta ined from Eq. 10
( o r F ig. 5) t o be F = 0.577 (us ing n = 4 and N/d = 113). The number
o f vanes i s then r e a d i l y determined by s u b s t i t u t i o r i i n t o Eq. 16: N =
26 between Sect ions 64 and 100; and N = 20 between Sect ions 100 and
176. Hence, accord ing t o t h i s design procedure, a t o t a l o f 46 vanes
( f o u r more than was a c t u a l l y used) would be requ i red t o reduce t h e
t ransverse bed s lope t o 0.03 throughout t h e channel.
The vanes were i n s t a l l e d i n a two-row a r ray up u n t i l Sect ion
104, and a one-row a r ray beyond Sect ion 104. The emplacement o f t h e
two-row a r ray i s sketched i n Fig. 14. The emplacement o f t h e one-row
a r ray was the same as t h a t o f t h e ou ter row i n Fig. 14. The vanes
were i n s t a l l e d on t h e dry 5.2-cfs channel bed such t h a t t h e i r t o p
edge was 0.4 f t under t h e 5.2-cfs water surface. The f l ow r a t e was
then gent ly increased t o 5.2 c f s , and mainta ined a t t h i s r a t e f o r a
pe r iod o f 160 hours. The bed topography was measured a f t e r 10, 20,
40, 80, and 160 hours. The t ransverse bed s lope was observed t o
change very r a p i d l y w i t h i n t h e f i r s t 10 hours a f t e r t h e s t a r t o f t h e
f low, as Figs. 15, 16, and 17 i nd i ca te . Over t h e 160-hour per iod, a
SECTION NUMBER
Figure 15. Streamwise Variation of Transverse Bed Slope Developnent after Installation oNanes; Test Series No. 1
...... 1- I 0 hours
I I I
0 I 2 3 4 5 6 7 8 DISTANCE FROM LEFT BANK (11)
Figure 16. Developnent of Bed Profiles at 8ection 80 af ter Installation of Vanes; Test Series No. 1
...... 1.0 --- I- 10 hours - 1 = 160 hours
I I I
0 1 2 3 4 5 6 7 8 DISTANCE FROM LEFT BANK ( f t )
Figure 17. Developnent of Bed Profiles a t Section 112 a f te r Installation of Vanes; Test Series No. 1
t o t a l o f 15.7 ft3 o f sand was moved from t h e i nne r h a l f o f t h e
channel t o t h e ou te r h a l f . I n o ther words, t h e vane system caused
52% o f t h e sand t h a t was o r i g i n a l l y moved (dur ing t h e i n i t i a l bed-
forming process) from the ou te r h a l f t o t h e i n n e r h a l f t o r e t u r n t o
t h e ou te r h a l f o f t h e channel. As Fig. 13b shows, t h e average
d i s t r i b u t i o n s o f depth and v e l o c i t y are i n good agreement w i t h those
p red i c ted by t h e design procedure. I n F ig. 15 i t i s seen t h a t t h e
vane system performed b e t t e r over t h e f i r s t h a l f o f t h e bend than
over t h e second h a l f . This may have been due t o t h e f a c t t h a t t h e
reach between Sect ions 64 and 104 was fu rn ished w i t h 28 vanes ( i n
double-array) whereas t h e remaining p a r t o f t h e bend had on ly 14
vanes ( i n s i n g l e a r ray ) , o r 30 percent fewer vanes than c a l l e d f o r by
t h e design c a l c u l a t i o n s (which were done a f t e r t h e complet ion o f t h e
t e s t s ) .
Table 5 summarizes t h e o v e r a l l e f f ec t i veness o f t h e vane system
tes ted i n terms o f recovery o f : (1 ) Sediment volume i n ou ter h a l f o f
channel ( t he percentage returned t o t h e ou te r h a l f o f the channel o f
t h e sediment volume t h a t was o r i g i n a l l y moved from the ou te r h a l f t o
t h e i n n e r h a l f ) ; (2) near-bank depth ( t h e reduct ion o f near-bank
depth i n percent o f t h e reduct ion requ i red f o r achiev ing un i fo rm
depth); and (3) near-bank v e l o c i t y ( t h e reduct ion i n near-bank
v e l o c i t y i n percent o f the reduct ion requ i red f o r t h e achievement o f
un i fo rm v e l o c i t y ) . The numbers i n parentheses are t h e recovery
percentages computed by t h e theory on the bas is o f the number o f
vanes employed. I f these numbers equal t h e ac tua l recovery
percentage, t h e vane system performed e x a c t l y as computed. I f t h e
numbers i n parenthesis a re smal le r than t h e ac tua l recovery
percentage, t h e vane system performed b e t t e r than computed. Table 5
a l s o shows t h e reduct ion o f t h e l o n g i t u d i n a l s lope o f t h e water
sur face caused by t h e vane system. I n Test Ser ies 1, t h e s lope was
reduced by 10 percent. The o b j e c t i v e i s t o design t h e vane system
such t h a t t h e change i n s lope i s as small as poss ib le (a l o c a l
reduc t i on o f s lope w i l l cause an increase o f s lope and degradat ion
downstream).
Table 5.
Svmm
ary of Experimental Rd
ts
of Vane Tests
Test
Vane
Vane
Vane
Num
ber E
ffectiven
ess of V
ane System
lu
n no.
type
length
, an
gle,
of in in
ches
d'. in
van
es d
egrees
Reco
very
of R
ecovery
of
Reco
ver of n
ea
r R
eductio
n of
Num
ber of sed
imen
t volume
ne
eh
an
k d
epth
, hank v
elocity
, slope of
vanes w
ith in o
uter half of
in percen
t in p
ercent
water su
rface, sig
nifican
t ch
annel, in p
ercent
in percen
t sco
ur, in p
ercent
1-1 1
sheet
14 1
5
42
52 (52) 63 (53)
58 (61) 10
9
metal
2-1 sh
eet 9
12%
) 84
49 (58) 63 (62)
80 (701 C
5 6
metal
3-1 sh
eet 14
15 42
44 (471 36 (501
50 (61) 10
7 m
etal
4-1 sh
eet 14
15 49
50 (29) 74 (29)
93 m
etal
4-2 sh
eet 14
8
49 44 (19)
62 (17) 100
metal
4-3 sh
eet 9
15 70
47 (41) 66 (441
Not
(5
6 m
etal m
easured
*) slig
htly
curv
ed v
anes
**) sev
eral unsu
ccessful, ex
plo
ratory
tests with
rock
van
es preced
ed R
un 5-1 ***)
the "ro
ck" v
anes w
ere installed
betw
een S
ections 72 an
d 112; remaining p
art of bend w
as furn
ished
with cu
rved
sheet m
etal vanes in the R
un 2-1 config
vratio
n
Q
Reco
very
by sheet m
etal va
ns
betw
een S
ections 72 and 112 in R
un 2-i co
nfig
uratio
n
I n t h e t e s t se r i es described above, Test Series 1, t h e s i d e
w a l l s of t h e f lume were o f smooth plywood w i t h a roughness much lower
than t h a t o f t h e sand bed. The roughness o f r e a l r i v e r banks i s
o f t e n h igher than t h a t o f t h e streamhed (due t o vegetat ion, f a l l e n
t rees , r ip - rap , etc . ) . I n view o f t ha t , two t e s t se r i es (Nos. 2 and
4) were a l so conducted w i t h roughened s ide wa l l s . The roughness
elements were 20-in. long, 1/2-in. wide, 1/4-in. t h i c k pieces o f wood
which were n a i l e d onto t h e s ide w a l l s 1.5 i n . center t o center .
Test Series No. 2 was conducted w i t h t h e same grade o f sediment
i n t h e f lume as Test Ser ies No. 1. The maximum f l ow r a t e was 6.0
c f s . At f u l l y developed f low and bed topography, t h e l o n g i t u d i n a l
s lope o f the water sur face and t h e cross-sect ional average values o f
depth and v e l o c i t y were 0.00146, 0.54 ft, and 1.40 f t / sec ,
respec t i ve l y . Thus, FD = 6.11, n = 3.5, u* = 0.16 f t / sec ,
and 8 - 0.04. Rased on these f l ow data, Eq. 12 p r e d i c t s a t ransverse
bed s lope of ST = 0.074, which i s i n good agreement w i t h those
measured (Fig. 18a).
I n Test Ser ies No. 2, t h e vane-design formula was tes ted w i t h a
system o f 84 9- in . long, s l i g h t l y curved vanes (F ig. 19). These
t e s t s were conducted s p e c i f i c a l l y t o v e r i f y t h a t t h e l i f t force, and
t h e r e f o r e t h e torque Tv, produced by a g iven l i f t - s u r f a c e area
increases when t h e aspect r a t i o increases. As t h e design
ca l cu la t i ons , summarized i n Tables 3 and 4, show, t h e number N = 84
corresponds w i t h t h e design o b j e c t i v e o f ob ta in ing a reduc t i on o f t h e
t ransverse bed slope t o approximately 0.03, t h e same o b j e c t i v e as i n
Test Ser ies No. 1. Ry reducing t h e vane l eng th from 14 i n . t o 9 in.,
t h e aspect r a t i o goes up from 0.2 t o 0.3, and, accord ing t o F ig. 6,
t h e l i f t c o e f f i c i e n t becomes 0.6 as opposed t o 0.4 w i t h 14-in,
vanes. Hence, w i t h 9-in. vanes, t h e requ i red l i f t i n g sur face i s 33%
lower than i f 14-in. vanes were used. The c a l c u l a t i o n s summarized i n
Table 5 show t h a t the e f fec t i veness o f t h e 9- in . vane system i s as
good as t h a t o f t h e 14-in. system as f a r as recovery o f sediment
volume, near-bank depth and near-bank v e l o c i t y are concerned. The 9-
(a) MEASUREMENT
- THEORY
( b ) MEASUREMENT
- THEORY
0 1 2 3 4 5 6 7 8 0 1 2 3 4 5 6 7 8 DISTANCE FROM LEFT BANK (fl)
Figure 18. Test Series 2: Measured Radial Average-Distributions of Depth and Depth-Averaged Mean Velocity Canpared with t h e Predicted Distributions; (a ) Before Instal la t ion of Vanes; (b) After Ins ta l la t ion of Vanes
Figure 19. Test Series 2 Vane and Vane Enplacements
35
i n . vane system i s seen t o have caused l ess change i n water-sur face
s lope than t h e 14-in. system. Therefore, o v e r a l l t h e 9-in. vane
system i s judged t o be more e f f i c i e n t than t h e 14-in. vane system.
2. Nonuniform Bed Sediment - I n Test Ser ies No. 3, t h e sediment
was sand wi~I.1 a l o g normal g ra in -s i ze d i s t r i b u t i o n w i t h a median
diameter o f 0.90 mm and a geometric standard dev ia t i on o f 1.90 (Fig.
20). The discharge was 5.8 c fs . I n i t i a l l y , t h e sand was d i s t r i b u t e d
un i fo rm ly throughout t h e flume. As t h e water-sediment m ix tu re was
then p rope l l ed through t h e flume, g r a i n s o r t i n g took place. The
smal le r f r a c t i o n s tended t o accumulate near t h e i n s i d e o f t h e bend
l e a v i n g t h e l a r g e r f r a c t i o n s along t h e outside. When s teady-s ta te
cond i t i ons were obtained, water-sur face e levat ions , and d i s t r i b u t i o n s
o f depth, v e l o c i t y , and g r a i n s ize, were measured. Notable fea tures
o f t h e bed topography were a p o i n t bar along t h e inner bank between
Sect ions 88 and 104; and an at tendant r e l a t i v e l y deep scour h o l e a t
Sect ion 80. Deep scour holes occurred a l so a t the ou ter bend a t
Sect ions 136 and 170. It i s noteworthy a l s o t h a t t h e sediment i n t h e
sur face l a y e r o f the bed was genera l l y f i n e r than t h a t below t h e
surface. The coarser f r a c t i o n s on ly surfaced w i t h i n a d i s tance o f
about 2 f t from t h e ou te r f lume wa l l . Red-material samples taken
below t h e sur face o f t h e bed throughout t h e bend showed t h a t t h e
o r i g i n a l sand m ix tu re was found a t a depth o f t h ree t o f i v e inches
below t h e bed surface, i n d i c a t i n g t h a t g ra in s o r t i n g was l i m i t e d t o
t h e upper t h r e e t o f i v e inches o f t h e sediment l aye r . Bed armoring
d i d no t occur. The o v e r a l l median diameter o f t h e sediment i n t h e
sur face l a y e r o f t h e bed was determined t o be Da = 0.50 mm. The l o n g i t u d i n a l s lope o f t h e water surface, and c ross-sec t iona l average
values o f depth and mean v e l o c i t y were measured t o be 0.00063, 0.47
ft, and 1.56 f t l s e c , respec t i ve l y , y i e l d i n g FD = 5.27, n = 6.5, u* =
0.10 f t / s e c , and = = 0.04. Based on these f l ow data, Eq. 12
p r e d i c t s a t ransverse bed s lope of ST = 0.055, which i s i n reasonable
agreement w i t h those measured (Fig. 21). The o v e r a l l average
t ransverse bed s lope was measured t o be 0.07.
SIZE, IN MILLIMETERS
Figure 20. Grain-Size Distribution for Nonuniform Bd Sedimnt; Test Series No. 3
( 0 )
MEASUREMENT - THEORY
MEASUREMENT - THEORY
I
0 1 2 3 4 5 6 7 8 0 1 2 3 4 5 6 7 8 DISTANCE FROM LEFT BANK (ft)
Figure 21. Test Series 3: Measured Radial Average-Distributions of Depth and Depth-Averaged Mean Velocity Canpared with the Predicted Distributions: (a) Before Installation of Vanes; (b) After Installation of Vanes
The vane-design fortnula was tes ted w i t h a system o f 42 14-in.
vanes i n t h e Fig. 14 con f i gu ra t i on . The design c a l c u l a t i o n s (Tables
3 and 4) show t h a t t h i s system corresponds w i t h t h e design o b j e c t i v e
o f o b t a i n i n g a reduct ion o f t h e t ransverse bed s lope from 0.07 t o
0.03, which i s seen t o be i n very good agreement w i t h t h a t
measured. The vane system i s seen t o have performed w i t h about t h e
same e f f i c i e n c y as i n t h e case o f un i fo rm sand (Table 5) .
6. Vanes i n Armored Channel
A se r ies o f t e s t s was designed s p e c i f i c a l l y t o i n v e s t i g a t e t h e
vanes' performance i n a channel bend w i t h bed armoring. Data from
many r i v e r bends i n t h e Uni ted States, i n c l u d i n g Iowa, show t h a t some
areas o f t h e bends are o f t e n h e a v i l y armored along some reaches, and
r a i s e t h e quest ion o f whether t h e submerged vanes can achieve
rework ing o f t h e armored p o r t i o n s o f t h e beds t h a t i s requ i red t o
achieve a f l ow t h a t i s un i fo rm l a t e r a l l y .
The bed ma te r ia l i n t h i s t e s t se r i es was t h a t o f Test Ser ies No.
3 supplemented w i t h coarse sand t o g i ve t h e g ra in -s i ze d i s t r i b u t i o n
shown i n Fig. 22 (several d i f f e r e n t mixtures were tes ted before one
was found t h a t armored over a s i g n i f i c a n t p a r t o f t h e bend). Dur ing
t h e process o f bed armoring, t h e bed l e v e l was observed t o increase
i n t h e s t r a i g h t approach s e c t i o n causing t h e o v e r a l l l o n g i t u d i n a l bed
s lope t o be somewhat l a r g e r than t h e slope o f t h e water surface.
Grain s o r t i n g took p lace both l a t e r a l l y and l o n g i t u d i n a l l y . The bed
became f u l l y armored i n t h e e n t i r e approach sec t i on and i n t h e
beginning o f t h e bend up t i l l Sect ion 88. Between Sect ions 88 and
172 t h e bed ma te r ia l near t h e ou ter bank was coarse sand w i t h a
median diameter o f about 3.2 mm and a geometric standard d e v i a t i o n o f
l ess than 1.4. Armoring occurred over most o f t h e p o i n t bar w i t h i n a
d i s tance o f 4 t o 5 f t from t h e i nne r f lume wal l . A t f u l l
development, t h e o v e r a l l average d i s t r i b u t i o n s o f depth, v e l o c i t y ,
and median-grain s i z e were as shown i n F ig. 23a. As was expected,
Eg. 12 cou ld not p r e d i c t t h e t ransverse bed s lope i n t h i s case. So
SIZE, I N MILLIMETERS
f igure 22. Grain-Size Distributions for Nonunifom Bed Sediment; Test Series No. 4
1.5
10
E a (0) OK o0 MEASUREMENT 0.0 z 0
MEASURED
0 1 2 3 4 5 6 7 8 0 1 2 3 4 5 6 7 8 DISTANCE FROM LEFT BANK ( f t )
Figure 23. Test Series No. 4 : Radial Average-Distributions of Depth, Depth-Averaged Mean Velocity, and Median-Grain Diamter; (a) Before Installation of Vanes; (b) After Installation of Vanes
Figure 24. Test Series No. 4 Run 3 Vane Bnplacment
41
f a r , no mathematical model has been developed t h a t can p r e d i c t t h e
bed topography i n a p a r t i a l l y armored r i v e r bend. However, t h e bed
p r o f i l e i s formed by t h e secondary-flow component so t h e t ransverse
bed s lope must c o r r e l a t e w i t h t h e balance between t h e r a d i a l
components o f t h e bed-shear s t ress and weight o f some rep resen ta t i ve
bed p a r t i c l e , o r group o f bed p a r t i c l e s . Therefore, i t i s reasonable
t o expect t h a t t h e parameter c o n s t e l l a t i o n o f E q . 12 s t i l l appl ies,
and t h a t an acceptable design r e l a t i o n can be obta ined by us ing E q .
12 w i t h a c a l i b r a t i o n fac to r , which obv ious ly must be s i t e
s p e c i f i c . With a p a r t i c l e Froude number based on D = 2,7 mm, and 0 =
0.04, t h e c a l i b r a t i o n f a c t o r becomes 7.0.
The t e s t se r i es inc luded experiments w i t h two d i f f e r e n t vane
lengths ( L ) and two d i f f e r e n t vanes angles ( a ' ) . I n Run 4-1, t h e
performance o f 49 14-in. vanes, i n s t a l l e d a t angle a ' = 15O, were
tes ted ; i n Run 4-2, t h e same 49 14-in. vanes were tes ted w i t h a ' =
8O. The vane emplacement was as shown i n Fig. 14. The system o f 49
14-in. vanes a t a ' = 15O corresponds w i t h t h e design o b j e c t i v e o f
o b t a i n i n g a reduc t i on o f t h e t ransverse bed s lope from 0.16 t o 0.11;
the system o f 49 14-in. vanes a t a ' = 8' corresponds w i t h t h e design
o b j e c t i v e t o reduce t h e t ransverse bed s lope from 0.16 t o 0.13. A
major o b j e c t i v e o f these two experiments was t o v e r i f y t h a t t h e
performance o f t h e vane system i s s e n s i t i v e t o a ' , i n agreement w i t h
t h e theory. As Fig, 23b shows, t h e 15-degree system performed
s l i g h t l y b e t t e r than t h e 8-degree system, as predic ted. I n bo th
cases, t h e vane system performed b e t t e r than t h e design c a l c u l a t i o n s
p r e d i c t e d i n terms o f recovery o f near-bank depth and v e l o c i t y . Th is
may have been due t o t h e f a c t t h a t t h e c a l c u l a t i o n s (and t h e
ana lys i s ) r e l a t e s t o t h e e n t i r e channel cross sect ion, whereas t h e
vanes, by t h e i r pos i t i on ing , a f f e c t e d t h e f l o w i n main ly t h e o u t e r
h a l f o f t h e channel. Because o f armoring, t h e vanes were not ab le t o
move any major amounts o f sand away from t h e i nne r h a l f o f t h e
channel. It i s important t o note t h a t t h e 7-degree d i f f e r e n c e i n
vane angle had on ly l i t t l e e f f e c t on t h e o v e r a l l performance.
I n Run 4-3, t h e performance o f 70 9- in. long vanes, i n s t a l l e d a t
an angle o f a ' = 15' i n the Fig. 24 con f i gu ra t i on , were tested. The
o b j e c t i v e was t h e same as t h a t o f Run 2-1 w i t h un i fo rm sand; i .e., t o
v e r i f y t h a t t h e e f f i c i e n c y o f a system w i t h g iven l i f t - s u r f a c e area
increases when t h e aspect r a t i o o f each i n d i v i d u a l vane increases.
As t h e design ca l cu la t i ons , summarized i n Tables 3 and 4, show, t h e
system o f 70 9-in. l ong vanes a t a ' = 15O corresponds w i t h t h e design
o b j e c t i v e o f o b t a i n i n g a reduct ion o f t h e t ransverse bed s lope from
0.16 t o 0.09. The pred ic ted improvement over t h e 14-in. vane system
i s no t apparent from t h e t e s t r e s u l t s (Fig. 25); i n f a c t , t h e
performance i s seen t o have heen s l i g h t l y lower than t h a t o f t h e 14-
i n . system as f a r as near-bank depth recovery i s concerned. However,
i t i s noteworthy t h a t the l i f t sur face o f t h e 9-in. system was about
10% smal le r than t h a t o f the 14-in. system, and t h a t t h e 9- in . system
d i d no t produce any measureable change o f the slope o f t h e water
surface.
A t t h e conclus ion o f each o f t h e aforementioned runs, t h e vane
system, and t h e bed topography developed by t h e vane system, were
sub jec ted t o a lower f l o c r a t e o f t h e order o f 3.5 t o 4.0 c f s . I n no
case d i d t h e lower f l o w r a t e cause any s i g n i f i c a n t change i n t h e bed
topography developed a t t h e h igher f l o w rate.
C. Rock Vanes
A number o f experiments were c a r r i e d ou t w i t h "vanes" composed
o f windrows o f gravel and marbles (sca led-s ize rock) i n an attempt t o
develop an economical a l t e r n a t i v e t o shee t -p i l e vanes. The
experiments, which are s t i l l ongoing, have no t produced any
encouraging r e s u l t s so fa r . One o f t h e major problems i s t h e
embedment o f t h e vanes. As t h e f l o w passes over t h e windrows, near-
bed tu rbu lence generates scour holes i n t h e bed a t t h e bottom o f t h e
windrows. As a r e s u l t , the windrows tend t o s e t t l e , u s u a l l y i n an
uneven manner, and col lapse.
I - L . . ' 0 1 2 3 4 5 6 7 8 0 1 2 3 4 5 6 7 8
DISTANCE FROM LEFT BANK ( f t )
0 1 2 3 4 5 6 7 8 0 1 2 3 4 5 6 7 8 4
0.0
' v 0 0 5 ~ ~ ~~~'~~ Figure 25. Test Series No. 4: Radial Average-Distributions of Depth;
(a) Before Installation of Vanes; (b) After Installation of Vanes
Figure 26. Test Series No. 5: Radial Average-Distributions of Depth, and Depth-Averaged Mean Velocity between Sections 72 and 112; (a) Before Installation of Vanes; (b) After Installation of V a n e s
The most encouraging r e s u l t was obtained i n an experiment i n
which 12 24-in. long windrows o f m a r b l e - f i l l e d baskets were i n s t a l l e d
between Sections 72 and 112 a t 15O w i t h the mean-flow d i r e c t i o n (Fig.
27), w i t h t h e remaining p a r t o f the bend fu rn ished w i t h 40 9- in.
sheet-metal vanes i n t h e Fig. 19 conf igura t ion . The bed sediment was
t h a t used i n Test Series No. 2. The marble vanes were i n s t a l l e d on
t h e Run 2-1 channel bed, as developed by t h e 84 9-in. vanes, by
rep lac ing the 9- in. vanes between Sect ions 72 and 112 w i t h marble
vanes. Fig. 26 shows t h e average d i s t r i b u t i o n s o f depth and v e l o c i t y
between Sections 72 and 112 before any vanes were i n s t a l l e d (F ig.
26a); a f t e r t h e 9-in. vanes were i n s t a l l e d (do t ted curves i n Fig.
26b); and a f t e r the 9- in. vanes were replaced by t h e marble vanes
( s o l i d curves i n Fig. 26b). Approximately 50% o f t h e sand t h a t t h e
9-in. vanes recovered i n t h e ou te r h a l f o f t h i s channel p o r t i o n was
l o s t again when t h e 9 - i n vanes were replaced by t h e marble vanes.
The marble vanes reduced t h e near-bank v e l o c i t y t o t h e cross-
sec t i ona l average value f o r t h i s p o r t i o n o f t h e bend, as i n d i c a t e d i n
Fig. 26b; however, t h i s reduc t ion was accompanied (and expla ined) by
a very s i g n i f i c a n t decrease o f t h e slope o f t h e water sur face over
t h i s reach. Despite t h a t t h i s experiment was by f a r t h e most
successful o f t h e rock-vane experiments, Fig, 28 c l e a r l y show t h a t
more development work i s needed before "rock vanes" can be considered
t o be an e f f i c i e n t a l t e r n a t i v e t o sheet -p i le vanes.
D. Discussion o f Resu l ts
A l l t e s t s were conducted w i t h a vane angle o f a ' = 15 degrees
w i t h t h e except ion o f Runs 2-1 and 4-2 i n which t h e angle was 1 2 and
8 degrees, respect ive ly . It was very c l e a r from t h e t e s t s t h a t a ' =
15 degrees was a t t h e upper l i m i t o f t h e workable a ' -range.
Object ionable scour always occured a t a few o f t h e vanes, even
a t a' = 12 degrees, al though t h i s was not r e f l e c t e d i n t h e "recovery"
e f f i c i e n c i e s . However, no scour occurred when a ' was 8 degrees.
As 6 was always o f t h e same order o f magnitude (approximate ly 10
Figure 27. Test Series No. 5: Rock Vanes b f o r e Admission of Flow
Figure 28. Test Series No. 5: Rock Vanes a f te r Adtnission of Flow
degrees) i t would appear t h a t t h e optimum angle o f at tack, a, i s o f
the order o f 20 degrees. (a = t h e angle a t which t h e bottom cu r ren t
approaches t h e vane).
The cu rv ing o f t h e vanes i n Run 2-1 was done i n t h e b e l i e f t h a t
the l i f t and drag c h a r a c t e r i s t i c s would be improved. Separate t e s t s
w i t h s t r a i g h t and curved vanes i n one o f I IHR's s t r a i g h t , r ig id -bed
flumes showed t h a t f l o w separat ion was l ess severe when t h e vanes
were curved. As Table 5 shows, t h e e f f i c i e n c y o f t h e curved-vane
system was very good, i n p a r t i c u l a r considere ing t h a t t he re was no
measurable reduc t i on o f t h e l o n g i t u d i n a l s lope o f t h e water
surface. However, ob jec t ionab le scour was observed a t a few o f t h e
vanes. This might not have happened i f t h e vanes had been s l i g h t l y
l ess curved.
Throughout t h e study t h e performance o f t h e var ious vane systems
was checked a l so by observat ions o f t h e behavior o f sur face f l o a t s .
F loa ts re leased a t t h e center l i n e o f t h e channel should be c a r r i e d
sidewards toward t h e ou ts ide a t a r a t e t h a t can be ca l cu la ted from
t h e t ransverse bed s lope t h a t t h e vane system i s designed t o achieve
(Odgaard, 1984). The f l o a t technique was used also, together w i t h
dye i n j e c t i o n s , t o study t h e f low behavior around each i n d i v i d u a l
vane. These t e s t s l e d t o t h e conclus ion t h a t t h e length o f the vanes
and t h e i r l a t e r a l spacing should not be more than about t w i c e t h e
water depth. I f t h e l eng th o f t h e vanes o r t h e i r l a t e r a l spacing, o r
both, exceeded t w i c e t h e water depth t h e vanes tended t o generate two
( o r more) secondary f l o w c e l l s downstream r a t h e r than one, which
obviously would reduce t h e o v e r a l l performance o f t h e vane system,
The performance o f t h e var ious sheet metal vanes i s i l l u s t r a t e d
on t h e photographs i n Figs. 29 through 36. F ig. 29 shows a n a t u r a l l y
formed bed topography w i t h p a r t i a l armoring ( f rom Test Ser ies No.
4). Notable fea tu res are t h e f l a t p o i n t bar and t h e steep s lope a t
t h e edge o f it, Fig. 29 a l so shows t h e 14-in vanes i n s t a l l e d i n a
two-row a r ray up t o Sect ion 98 ( a t t h e t o p o f t h e p i c t u r e ) and a one-
Figure 29. Naturally Formed E3ed Topography i n Test Ser ies No. 4 (Looking Upstream)
Figure 30. Bed Topography i n Test Ser ies No. 4 (Looking Upstream) a f t e r Ins ta l la t ion of 14-in. Vanes
48
Figure 31. Depth Distribution at Section 112 i n Test Ser ies No. 4 Before Ins ta l la t ion of Vanes
Figure 32. Depth Distribution a t Section 112 i n Test Ser ies No. 4 After Installati-on of 14-in Vanes
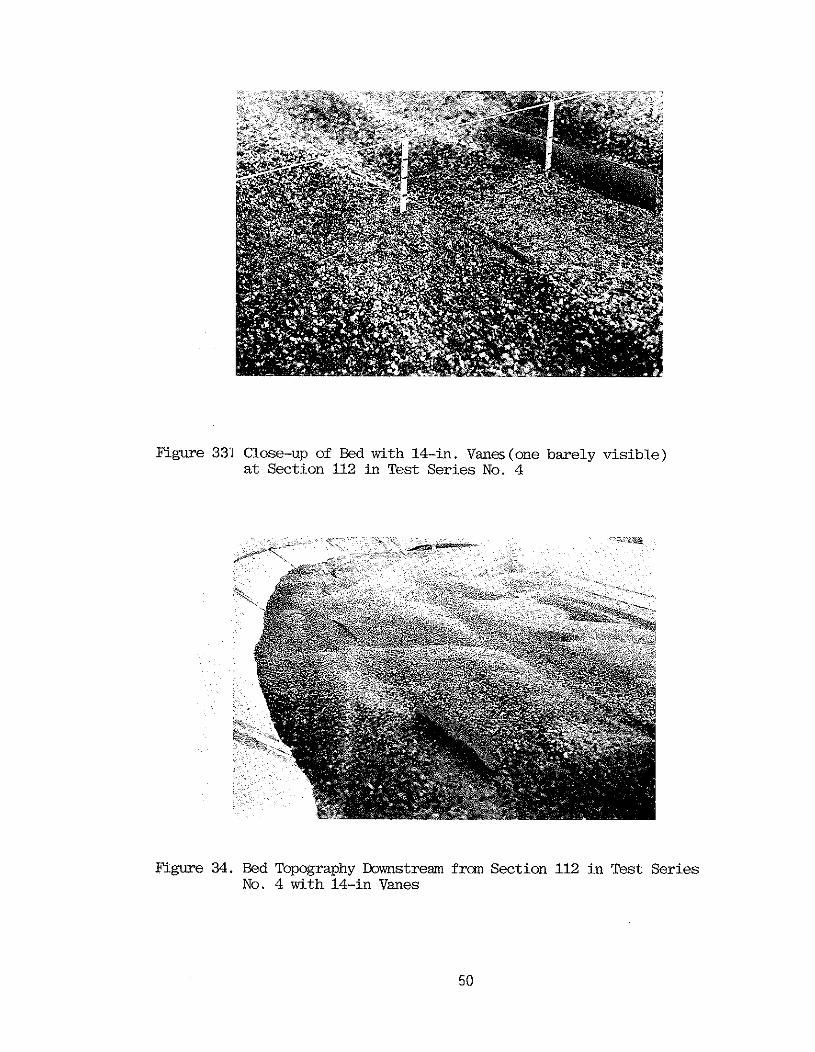
Figure 331 Close-up of Bed with 14-in. Vanes(one barely v i s ib l e ) a t Section 112 in Test Ser ies No. 4
Figure 34. Bed Topography Downstream frcm Section 112 i n Test Series No. 4 with 14-in Vanes
Fgiure 35. &pth Distribution at Section 112 i n Test Series No. 4 After Ins ta l la t ion of 9-in. Vanes
Figure 36. Ikpth Distribution a t Section 112 i n Test Series No. 2 After Ins ta l la t ion of 9-in. Vanes
5 1
row a r ray over t h e r e s t o f t h e bend, The two-row a r ray was l a t e r
extended up t o Sect ion 112 ( a t t h e lower edge o f Fig. 29). A f t e r 160
hours w i t h a discharge o f 5.8 c f s through the flume, most o f t h e
p o i n t bar had disappeared (Fig. 30). Note i n Fig. 30 t h a t some o f
t h e vanes i n t h e ou te r row had become completely covered w i t h sand.
The depth d i s t r i b u t i o n a t Sect ion 112 i s i nd i ca ted i n Figs. 31
(before i n s t a l l a t i o n o f vanes) and 32 ( a f t e r i n s t a l l a t i o n o f
vanes). For v i s u a l i z a t i o n , a s t r i n g was extended h o r i z o n t a l l y a t t h e
water l e v e l , and 5 t h i n s t a f f s w i t h 1110-f t marks were d r i v e n i n t o
t h e sand bed ( a f t e r d r a i n i n g o f t h e f lume) a t 1 f t i n t e r v a l s . The
ou te r s t a f f was 2 f t from t h e ou te r f lume wa l l . The depth a t t h i s
s t a f f i s seen t o have been 0.8 f t before vanes were i n s t a l l e d . A f t e r
t h e vanes were i n s t a l l e d t h e depth here was reduced t o 0.4 f t (Figs.
32 and 33). Downstream from 112, where on ly one row o f vanes were
i n s t a l l e d , t h e r e s u l t was a l so very s a t i s f a c t o r y , as Fig. 34 c l e a r l y
shows. The bed recovery a t Sect ion 112 w i t h 9-in. vanes i s shown i n
F igs. 35 (Test Ser ies No. 4-3) and 36 (Test Ser ies No. 2-1).
I V . VANE DESIGN FOR EAST NISHNABOTNA RIVER BEND
The r e s u l t s o f t h e t h e o r e t i c a l ana lys is and t h e laboratory-model
experiments were used f o r t h e design o f a vane s t r u c t u r e f o r t h e
meander bend i n Fig. 3 f o r t h e p r o t e c t i o n o f U.S. Highway 34 and i t s
b r i dge over East Nishnabotna River. The f lume i n which t h e
aforementioned experiments were conducted, models, w i t h some
i d e a l i z a t i o n , t h i s meander bend a t an u n d i s t o r t e d sca le of
approximately 1:10. F ig. 37 shows t h e IIHR flume o v e r l a i d t h e
pro to type bend, us ing t h e scale r a t i o 1 : l O .
Cross sec t ions o f t h e r i v e r bend ( o f which a p lan view i s shown
i n F ig. 38) were surveyed October 6-7, 1983 (e igh t cross sec t i ons ) ,
and A p r i l 30 through May 2, 1984 ( t e n cross sec t ions) t o d e f i n e t h e
channel geometry a t two d i f f e r e n t t imes f o r two d i f f e r e n t f l o w ra tes
PROTOTYPE SCALE (FT)
-- -- -- -- - U.S. HIGHWAY 34
Figure 37. Plan-View of IIHR's Sediment Flume Overlaid the East Nishnabotna River Bend a t Red Oak, Using a Scale Ratio of 1:10
NOTE REFERENCE POINT R IS AT NORTH WEST WING OF BRIDGE, DOT STATION 421, 18 FT NORTH OF HIGHWAY CENTER LINE
/ / L3.Y SCALE (FT)
STEEL JETTY
-
Figure 38. Plan-View Sketch of the Eas t Nishnabotna River Bend at Red Oak, Iowa
54
(Figs. 39 and 40). Also, d e t a i l e d v e l o c i t y measurements and bed-
ma te r i a l samples were taken a t each cross sec t ion t o determine t h e
v a r i a t i o n s i n t h e v e l o c i t y p r o f i l e s and t h e s i z e o f t h e bed
sediment. The v e l o c i t y wds measured over 5-6 v e r t i c a l s across each
s e c t i o n us ing a 5-in. O t t cu r ren t meter. I n each v e r t i c a l , t h e
ve loc i t y , u, was measured i n f i v e po in t s ; t h e record ing t ime was 30-
40 seconds a t each po in t . Based on these measurements, a depth-
averaged v e l o c i t y , E, was determined f o r each v e r t i c a l . The cross-
sec t i ona l average v e l o c i t y , ua, was determined by d i v i d i n g t h e f l ow
r a t e (obta ined by i n t e g r a t i n g t h e v e l o c i t y d i s t r i b u t i o n ) by t h e
measured c ross-sec t iona l area. The bed samples were taken by a grab-
bucket sampler which samples t o a depth o f 5-6 in , below t h e bed
surface. The samples were dr ied , weighed, and sieved f o r s ize-
d i s t r i b u t i o n analys is .
The data are summarized i n Tables 6 and 7 and i n Fig. 41. The
sec t ions are i n d e n t i f i e d by t h e i r d is tance from t h e nor thern
g u a r d r a i l o f t h e br idge. The d is tances are along t h e Hay 1, 1984,
channel-center l i n e . The e leva t i ons are l i s t e d i n r e l a t i o n t o mean
sea l e v e l us ing t h e stage-discharge r e l a t i o n f o r t h e U.S.G.S. gage a t
Coolbaugh S t ree t b r idge i n Red Oak (F ig. 42), which i s 6,000 f t
downstream from t h e Highway 34 br idge. The datum o f t h i s gage i s
1005.45 ft above mean sea l e v e l . The l o n g i t u d i n a l s lope o f t h e water
sur face was measured t o be 0.00064 and 0.00066, respec t i ve l y , i n t h e
two surveys. [Note: The Iowa Sta te Highway Commission Bench Mark on
t h e south eas t wing o f t h e b r i dge ( S t a t i o n 425i-42, 19 f t south o f t h e
highway center l i n e ) i s not t i e d i n w i t h the U.S.G.S. gage a t
Coolbaugh S t r e e t br idge. This was v e r i f i e d by t h e O f f i c e o f Br idge
Design, Iowa Department o f Transportat ion. Based on t h e U.S,G.S.
gage a t Coolbaugh St ree t , t h e bench mark i s a t e l e v a t i o n 1043.58 ft
( o r 2.97 ft above t h a t i nd i ca ted on t h e bench mark)]. The n-values
( c h a r a c t e r i z i n g t h e channel res is tance) are ca l cu la ted by t h e Darcy-
Weisbach r e l a t i o n , us ing measured values o f ua, S and da: n = - na = ~u,/dgSd,. A1 1 g ra in -s i ze d i s t r i b u t i o n s f o r t h e bed and bank
Figure 39. East NishnabotnaRiver on May 2, 1984, Looking Upstream from the U.S. Highway 34 Bridge
Figure 40. Survey at Section 4 , May 2 , 1984
TB
ble 6. H
igh-Flow D
ata fmm
East N
istmabotna R
iver Bend
Section
Distance
Flow rate,
Cross-sectional
Surface
Elevation
Cro
ss~ectio
nal
Cross-sectional
Cm
sssection
al num
ber from
in cubic
area, in w
idth of
of water surface,
average velocity, average depth
average velocity bridge, in
feet per square feet
channel, b, in feet above
ua, in feet
d,, in feet
profile exponent feet*
) second
in feet m
ean sea level per second
"a
*) Distance from
northern guardrail of bridge, measured along the M
ay 1, 1984, channel-center
line
Tab
le 7
. L
ow-P
low
Dat
a fr
om E
est
Nish
nabo
tna
Riv
er Bend
Sec
tion
D
ista
nce
Flow
rat
e,
Cro
ss-s
ecti
onal
S
urfa
ce
Ele
vati
on
Cro
ss-s
ecti
onal
C
ross
sect
ion
al
Cro
ss-s
ecti
onal
nu
mbe
r fr
om
in c
ubic
ar
ea,
in
wid
th o
f of
wat
er s
urf
ace
aver
age
velo
city
, av
erag
e de
pth
aver
age
velo
city
br
idge
, in
fe
et p
er
squa
re f
eet
chan
nel,
b,
in f
eet
abov
e ua
, in
fee
t da
, in
fee
t pr
ofil
e ex
pone
nt
feet
*)
seco
nd
in f
eet
mea
n se
a le
vel
per
seco
nd
"a
--
--
--
*) D
ista
nce
from
nor
ther
n gu
ardr
ail
of b
ridg
e, m
easu
red
alon
g th
e M
ay 1, 1984,
chan
nel-
cent
er
line
n - - EL. 1022.4
1.6 0.7 3.6 4.1 2.8 7 0.8
\ DEPTH-AVERAGED MEAN VELOCITIES (fps)
5 0
SECTION 1 EL. 0 0 7 2
0 2 0 4 0 60 80 100 120 140 160 180 2 0 0
DISTANCE FROM LEFT BANK ( f t )
6 2 0 40 60 80 100 120 140
DISTANCE FROM LEFT BANK ( f t )
Figure 41. Sect ions 1 thorugh 10 of t h e East Nishnabotna River Bend
1012 - $ 1012 i w 0 2 0 4 0 6 0 8 0 100 120 140 160 180
DISTANCE FROM LEFT BANK (f t)
2 -
10 - 5 0 -
SECTION 10 -
-
1020
1018
1016
1014
1012 W i W
0 2 0 4 0 60 80 1 0 0 120 140 160 180
DISTANCE FROM LEFT BANK i f t )
DISCHARGE (cfs)
3 0 -
25
..-. + * 2 0 - t- I (3 - g 151 W (3 3
10-
5 -
10'
Figure 42. Rating (Xlrve for the U.S.G.S. WateriStage Recorder on East Nishnabotna River a t Red Gak (a t Coolbaugh Street Bridge)
5 lo3 5 104 5
I I 1 1 t 1 1 1 1 1 1 I 1 1 1 1 - - ---- -- -------------- _---__---___-___--___--___---__ - MAXIMUM GAGE HEIGHT ON RECORD. 28.23ft - - - - - DATUM OF GAGE IS 1005.45 f t - ABOVE MEAN SEA LEVEL - - -
- - - - - - - -
x I - - - 2 / I
I 1 1 1 1 1 1 1 1 I I I 1 1 1 1 1 I I I1
5
sediments are shown i n Appendix 11. Due t o h igh f l ow v e l o c i t i e s , no
samples were taken from t h e bed o f t h e main channel i n the May 1984
survey. Median-grain diameter and geometric standard d e v i a t i o n o f
t h e composite g ra in -s i ze d i s t r i b u t i o n f o r the bed ma te r ia l o f t h e
October 1983 main channel a re determined t o be 0.45 mm and 2.0,
respec t i ve l y . There i s no i n d i c a t i o n t h a t bed armoring occurred i n
t h e channel bend.
F igs. 41 show t h e t e n cross sect ions measured i n t h e Apri l-May
survey w i t h t h e e i g h t October cross sect ions superimposed (do t ted)
f o r comparison. (The l a t e r a l p o s i t i o n o f t h e October cross sec t ions
r e l a t i v e t o t h e Apri l-May sec t ions i s on ly approximate). It i s seen
t h a t f o r most sec t ions t h e e l e v a t i o n o f the bed i n t h e October
channel i s very c lose t o t h a t o f t h e average depth i n t h e Apri l-May
channel. Th is i n d i c a t e s t h a t t h e increase i n t ransverse bed s lope
due t o increase o f f l ow r a t e i s accomplished b a s i c a l l y by a t i l t i n g
o f t h e October bed about t h e April-May channel cen te r l i ne . A t
Sect ion 2, t h e Apri l-May h igh f l o w i s seen t o have caused an o v e r a l l
l ower ing o f t h e October low f l ow channel bed by 5-6 ft. Note a l s o
t h a t t h e deepest p o i n t i n Sect ion 1 (130 ft upstream from the b r i dge )
i s a t e l e v a t i o n 1007.2 ft, which i s about 5 f t lower than t h e stream-
bed e leva t i on f o r which t h e b r i dge foundat ion was designed (Iowa
S ta te Highway Commission, Design No. 262, Montgomery County, F i l e No.
21400, Ju ly , 1963). The cause o f t h i s o v e r a l l lower ing o f t h e stream
bed may be r e l a t e d t o t h e presence o f t h e G O O - f t rock p r o t e c t i o n on
the r i g h t bank near t h e br idge (Fig. 43). According t o Jansen e t a l .
(1979), f i x a t i o n o f an ou te r bank which i s be ing eroded induces a
steeper slope i n t h e cross sec t i on and a greater depth a t t h e t o e o r
t h e f i x a t i o n s t ruc tu re .
5. Design Computations
The design computations are summarized i n Table 8. The
t ransverse bed slopes l i s t e d i n Table 8 are determined as t h e slopes
o f b e s t - f i t l i n e s through t h e depth p o i n t s w i t h i n t h e c e n t r a l p o r t i o n
Figure 43. East Nishnabotna River on May 2 , 19%, b k i n g Downstream toward the Highway 34 Bridge (The rock protection is along the right bank i n the upper-center portion of the picture)
Table 8.
Vane Design C
omputations fo
r Esst Nishnabotna R
iver Bend
Section
Distance
Transverse
Particle
Effective
Deviation
Vane angle
Vane
Rquired
Sectional
Required
Required
number
from
bed slope P
roude radius o
f angle, 6
with m
ean function,
lifting surface
lifting num
ber bridge
S, num
ber, curvature.
in flow
P
su
rface area of
surface. of vanes
in feet*)
ED
r
,in
degrees direction,ae
Peet
per unit channel,
NH
L, in (3-ft high,
surface
PC&% square
12-ft long) area of
in square feet
channel feet
7 1,510
0.08 14.9
1,120 7.5
12.5 0.43
0.0086 64,800
557 15
8 1,960
0.04 13.8
1,890 3.9
16.1 0.44
0.0047 40,000
188 5
*) Distance from
northern guardrail of bridge, measured along th
e May 1,1984, channel-center line
o f t h e cross sect ions. These slopes are seen t o be o f t h e same order
o f magnitude as those measured i n t h e l abo ra to ry model. However, t h e
l abo ra to ry model i s a constant- radius bend f o l l o w i n g a s t r a i g h t
channel ( w i t h rad ius = i n f i n i t y ) . The rad ius o f the r i v e r curve
decreases gradua l ly from i n f i n i t y a t t h e i n f l e c t i o n p o i n t near
Sect ion 8 t o l ess than 400 f t a t Sect ion 5, Between Sect ions 5 and
3, t h e rad ius increases again t o i n f i n i t y . Considering t h e sho r t
d is tance over which these changes occur, i t i s q u i t e obvious t h a t t h e
bend f l o w cannot a t any p o i n t be considered t o be f u l l y developed
w i t h depth and v e l o c i t y d i s t r i b u t i o n s as i n t h e downstream reach o f a
long, cons tant - rad ius bend ( f o r which most bend-flow theo r ies are
developed). However, t h e e f f e c t i v e - r a d i u s concept can be used f o r
t h e vane design. Table 8 l i s t s t h e e f f e c t i v e r a d i i , re, as - c a l c u l a t e d by Eq. 12, u s i n g 0 =0.05; d = da; Fg = FDa -
ua/JgD(pS-o )/P ; and t h e measured values o f ST.
The laboratory-model t e s t s i nd i ca ted t h a t t h e vane-angle o f
a t tack should be o f the order o f 20 degrees. With a = 20 degrees,
and t h e near-bed d e v i a t i o n angles, 6 , c a l c u l a t e d by Eq. 23, t h e
vanes' angle w i t h t h e mean-flow d i r e c t i o n i s obta ined from Eq. 24:
a ' = a - 6 . The a ' values are seen t o range from 10 t o 16
degrees. Consider ing t h e unce r ta in t y i nvo l ved i n t h e de terminat ion
o f t h e optimum value o f a, t he re does not appear t o be j u s t i f i c a t i o n
f o r a g rea te r accuracy on a ' than about two t o t h r e e degrees. I n
view o f t h e g rea te r r i s k o f scour a t t h e l a r g e r values o f a, i t would
be adv isab le t o l e t a ' be c l o s e r t o 10' than 16'.
According t o t h e bas ic theory t h e requ i red area o f l i f t i n g
surface decreases w i t h increas ing aspect r a t i o . However, t h e r e i s a
p r a c t i c a l upper l i m i t t o t h e aspect r a t i o . For t h e vanes t o be
eros ion p reven t i ve t h e i r he igh t H should be l e s s than h a l f t h e water
depth a t t h e f l ow r a t e s a t which bank e ros ion occurs; i.e., whenever
t h e f l ow r a t e i n t h i s r i v e r bend i s g rea ter than about 1500 c fs . (A t
1500 cfs, t h e near-bank v e l o c i t y a t Sect ion 3 through 6 exceeds 3.5
f t / sec , which i s t h e l i m i t i n g v e l o c i t y recommended by t h e U.S. Bureau
o f Reclamation f o r t h e design o f a s tab le , f irm-loam channel c a r r y i n g
water w i t h c o l l o i d a l s i l t s . ) According t o t h e U.S. Geological
Survey, t h i s f low r a t e i s exceeded on t h e average (based on 60 years
o f records) 4% o f the t ime, o r approximately 15 days per year (Fig.
44). The 1500-cfs r i v e r stages are obta ined from t h e U.S.G.S stage-
discharge r e l a t i o n f o r the gage i n Red Oak us ing a l o n g i t u d i n a l
water-sur face s lope o f 0.00064. The 1500-cfs average water depth i s
est imated t o be approximately 5 ft. Therefor?, the top o f the vanes
should be more than 2.5 f t under t h e 1500-cfs stage t o be eros ion
p reven t i ve a t t h i s and h igher stages. From Fig. 41 fo l l ows t h a t i f
t h e vanes are i n s t a l l e d a t low f low w i t h t h e i r t o p edge 2.5 f t below
t h e 1500-cfs stage and can main ta in t h e present low-f low bed p r o f i l e ,
t h e H/d-value w i l l be optimum ( o f t h e order of 0.2-0.3) a t t h e
extreme h i g h f low when most e ros ion losses would occur. For t h i s
s i t u a t i o n t o occur, t h e vane he igh t must be o f t h e order of 3 ft. I n
t h e model, the best per forming vane was fou r t imes as long as i t was
h igh. A 3 - f t h igh pro to type vane should then be 12 f t long. I f t h e
vane i s much longer than t h a t it may generate two (o r more) secondary
f l o w c e l l s downstream r a t h e r than one, which reduces t h e o v e r a l l
performance. Using H/L = 0.3, and u = 20'; t h e l i f t c o e f f i c i e n t as
g iven by Fig. 6 i s c~ = 0.5. The value o f F selected f o r the design
was t h e minimum value, Fmin, corresponding t o the n-value f o r t h e
sect ion. The l i f t i n g sur face per u n i t sur face area o f t h e
channel, NHL/(rc$b), requ i red t o main ta in a h o r i z o n t a l "low f l ow"
bed i s then r e a d i l y ca lcu la ted , and so i s the requ i red number o f
vanes.
Each vane would be acted upon by a maximum l i f t f o r c e of the 2 order of F, = 1/2c pu HL 1 300 l b f which, when u n i f o r ~ n l y d i s t r i b u t e d
L over t h e 36 f t 2 l i f t i n g sur face would y i e l d a bending moment 3 f t
from t h e top o f the vane o f about 450 f t - l b . I f t h e vanes are made
o f sheet p i l e s , wood planks, o r t h i n concrete s labs, t h e drag f o r c e
on t h e vanes would not be a design fac to r . Although t h e forces on
t h e vanes from t h e f l ow are thus very small i t i s recommended t h a t
60 I I I I 1 I I I I I I l l
50 - - 40 - GAGE HEIGHT (f t) - 30 - - 20 - -
10 - -
5 - - GAGE HEIGHT (fl)
2 - -
1 - - 0.5 - 0 2 - 0.1 I I I I 1 I i I
lo2 5 1 o3 5 1 o4 DISCHARGE (cfs)
Figure 44. Frequency Distribution f o r Discharge i n East Nishnabotna River at Red Oak
each vane has a t l e a s t two o f i t s p i l e s extending down below t h e t o p
o f the f i r m shale layer , which, according t o t h e Iowa Sta te Highway
Commission Design No. 262 ( F i l e No. 21400, J u l y 1963) i s a t e l e v a t i o n
1004 f t (sounding dated J u l y 31, 1962). The support p i l e s should
thus be a t l e a s t 15 f t long, and p re fe rab l y 18 t o 20 ft.
The p o s i t i o n i n g o f t h e vanes on t h e stream-bed requ i res ca re fu l
planning. I n o rder t h a t t h e vane system as a whole f u n c t i o n a t
optimum e f f i c i e n c y , t h e l o n g i t u d i n a l and l a t e r a l spacing o f t h e vanes
must be such t h a t a s i n g l e - c e l l c i r c u l a t i o n i s induced i n t h e f l ow
sect ion. I f t h e vanes are spaced too f a r apar t l a t e r a l l y , two o r
more secondary f l o w c e l l s a re induced. Dye and f l o a t s tud ies i n t h e
l abo ra to ry model i n d i c a t e d t h a t t h e l a t e r a l d is tance between two
vanes should be l ess than o r equal t o two t imes t h e water depth. The
optimum distance, which undoubtedly i s a f u n c t i o n o f L and a, was no t
i d e n t i f i e d i n t h e model s tudies. S a t i s f a c t o r y r e s u l t s were obta ined
i n t h e model w i t h a l a t e r a l vane d is tance o f two t imes t h e water
depth. Based on a 4,000 c f s r i v e r f low, t h e pro to type vanes should
then be spaced about 12 ft apar t i n t h e l a t e r a l d i r e c t i o n . The
proposed emplacement o f t h e vanes i s d e t a i l e d i n Fig. 45, and
Table 9.
The above emplacement app l ies t o t h e reach between Sect ions 2
and 9. However, i t i s equa l l y important t h a t measures he taken t o
guide t h e f l ow through t h e b r i dge sect ion. The e f f e c t i v e w id th o f
t h e channel a t t h e b r i dge sec t i on i s p resen t l y l ess than h a l f t h e
w id th f o r which t h e b r i dge was designed. There i s obv ious ly a need
f o r measures t h a t can: (1 ) Turn t h e r i v e r f l o w southward (90°) over a
sho r t d is tance ( l e s s than 300 f t ) w i thout endangering t h e l e f t b r i dge
abutment; and (2) generate a widening o f t h e e f f e c t i v e channel w id th
a t t h e b r i dge sect ion. I t i s unce r ta in t o what ex ten t Iowa Vanes can
accomplish such a task. The most l o g i c a l s o l u t i o n would be t o use a
combinat ion o f bank r i p rap and vanes as sketched i n Fig. 46, Note
t h a t bank r i p rap alone would not produce a widening o f t h e r i v e r
channel.
Figure 45. F?mposed Ehrplcaement of Vane System for the East Nishnabotna River Bnd
FLOW - l a =
TTY
10" WITH MAXIMUM
'ATH OF MAXIMUM
,R VELOCITY -
PATH OF VELOCITY
Figure 46. Proposed Canbination of Vanes and Rock Rip Rap a t the Highway 34 Bridge.
70
Table 9. Reposed Emplacement of Vane System for Bast Nkhmbotna River Bend
Section Distance Number Elevation of number from bridge, of top edge of
in feet *) vanes vanes, in feet above mean sea level
*) Distance from northern guardrail of bridge, measured along the May 1, 1984, channel-center line
\I. SUMMARY, CONCLUSIONS AND RECOMMENDATIONS
The study has evaluated t h e e f fec t iveness o f Iowa Vanes i n
reducing depth and v e l o c i t y near t h e ou ter bank i n a curved, a l l u v i a l
channel f low. A procedure f o r t h e design o f a vane system f o r a
g iven r i v e r curve has been developed and tes ted i n a l abo ra to ry
model. The procedure has been summarized i n Appendix I by way o f a
numerical example, and it has been used f o r t h e design o f an Iowa-
Vane bank p r o t e c t i o n s t r u c t u r e f o r a sec t i on o f East Nishnabotna
R ive r along U.S. Highway 34 a t Red Oak, Iowa (Chapter IV).
The study has v e r i f i e d t h a t Eqs. 9, 14, and 16 can prov ide a
reasonably accurate est imate o f t h e v a n e - l i f t sur face requ i red t o
o b t a i n a s p e c i f i e d reduct ion i n near-bank v e l o c i t y o r corresponding
t ransverse bed slope. The l i f t coe f f i c i en ts , CL, used i n t h e experiments (0.4 t o 0.6) were obta ined from Fig. 6 which was
developed by e x t rap01 a t i o n us ing a procedure t h a t has been v e r i f i e d
f o r aspect r a t i o s (H/L) g rea ter than o r equal t o one. The dependence
of CL o n a n g l e o f a t tack (a) and aspect r a t i o (H/L) depicted i n Fig.
6 has not been v e r i f i e d exper imenta l ly f o r aspect r a t i o s l e s s than
one. The r e s u l t s o f the t h e o r e t i c a l ana lys is and t h e model t e s t s
suggest t h a t :
1. The vane system should be designed w i t h data f o r bankfu l f l o w i n
t h e r i v e r ;
2. The vane he igh t , H, should be chosen such t h a t t h e r a t i o H/d
remains w i t h i n t h e range 0.2 < H/d < 0.5 a t a l l erosion-causing
f l o w ra tes ;
3. The vane length, L, should be o f t h e order o f f o u r t imes t h e
vane he igh t ;
4. The vanes should form an angle o f 10 t o 15 degrees w i t h t h e
mean-flow d i r e c t i o n a t bankfu l f low; and
5. The l a t e r a l spacing o f t h e i n d i v i d u a l vanes should be l ess than
o r equal t o t w i c e t h e water depth a t bankful f low.
The l abo ra to ry model experiments d i d not suggest t h a t vanes composed
o f steep-sided windrows o f rock could be a f e a s i b l e a l t e r n a t i v e t o
shee t -p i l e vanes ( o r t o o the r types of vanes w i t h v e r t i c a l ,
impervious 1 i f t i n g surface). However, more exper imentat ion i s needed
before any firm conclus ions about t h e f e a s i b i l i t y o f rock vanes can
be made.
It appears t h a t t h e developmental work i s a t a p o i n t where f i e l d
experiments are now needed. The l abo ra to ry experiments have c l e a r l y
demonstrated t h a t a system o f submerged vanes designed according t o
t h e p r i n c i p l e s developed du r ing t h i s study can f u l l y e l i m i n a t e t h e
secondary f low, and i t s consequence (bank scour) i n a l abo ra to ry
model o f an a l l u v i a l channel bend. A vane system has been designed
f o r t h e bend o f East Nishnabotna R iver shown i n F ig. 3 ( f o r t h e
p r o t e c t i o n o f 1000 ft o f 1J.S. Highway 34 and i t s h r i dge over East
Nishnabotna R ive r ) us ing t h e same design p r i n c i p l e s . A t o t a l o f 66
1 2 - f t long 3 - f t h igh vanes, pos i t i oned as shown i n F ig. 45, would be
needed f o r t h e e l i m i n a t i o n o f t h e secondary-flow component a t h igh
f l o w ( the f low t h a t generated the bed topography t h a t was measured i n
t h e May 1984 survey o f t h e r i v e r bend). It i s recommended t h a t t h e
Iowa Department o f Transpor ta t ion consider i n s t a l l i n g t h i s system i n
t h e r i v e r bend.
Because o f i d e a l i z e d f l o w cond i t ions and sca le e f f e c t s i n t h e
l abo ra to ry model i t i s unce r ta in t o what ex ten t t h e vane system can
prevent bank eros ion i n t h e prototype. Banks may cave i n f o r a
number o f reasons, some o f which may not be r e l a t e d d i r e c t l y t o bank
shear. However, by e l i m i n a t i n g t h e secondary-flow component, t h e
vane system w i l l make t h e water and sediment move through t h e r i v e r
curve as i f t h e channel had been s t r a i g h t , and t h e hanks o f t h e r i v e r
bend w i l l be subjected t o on l y t h e same k ind o f e ros i ve fo rces t h a t
t h e banks along t h e s t r a i g h t reaches o f t h e r i v e r a re subjected to.
I n o the r words, the vanes w i l l s top t h e process o f meandering and
make t h e r i v e r main ta in i t s present alignment.
Another important cons idera t ion i s t h a t t h e vanes do no t change
t h e o v e r a l l c h a r a c t e r i s t i c s o f t h e r i v e r . The vane system does not
increase t h e l o c a l channel roughness as do o the r p resen t l y used means
f o r reduc t i on o f t h e near-bank v e l o c i t y (rock r i p rap, j e t t i e s ,
dikes, etc.). By i nc reas ing t h e channel roughness l o c a l l y , t h e
p r e s e n t l y used techniques o f t e n generate enhanced eros ion and channel
degradat ion f u r t h e r downstream (U.S. Army Corps o f Engineers,
1981). Extended use o f rock r i p rap a long t h e bend o f East
Nishnabotna R iver upstream from 1J.S. Highway 34 may have such e f f e c t s
on t h e r i v e r channel a t t h e b r i dge c ross ing and cou ld even tua l l y
cause a weakening o f t h e foundat ion o f t h e b r i dge p ie rs . The b r i dge
was o r i g i n a l l y designed f o r a high-water channel w id th o f over 300
ft. Dur ing the May 1, 1984, survey t h e high-water channel w id th a t
t h e b r i dge sec t i on was measured t o be on l y approximately 150 ft
(Figs. 47 and 48), which i n d i c a t e s t h a t a very s i g n i f i c a n t degrada-
t i o n o f t h e channel a t t h e b r i dge has a l ready taken place. Whether
t h e proposed vane system can amel io ra te t h e present s i t u a t i o n a t t h e
b r i d g e i s uncer ta in. However, t h e r e s u l t s o f t h i s study suggest t h a t
t h e vane system can reduce t h e r i s k o f f u r t h e r degradat ion o f t h e
channel and eros ion o f t h e banks.
The work a t IIHR on t h e submerged-vane concept has generated a
s i g n i f i c a n t amount o f p u b l i c i t y . If t h e proposed vane system i s
i n s t a l l e d i t w i l l be t h e f i r s t o f i t s kind. (A system i s p r e s e n t l y
be ing designed a lso f o r t h e Alaska Department o f Transpor ta t ion f o r
bank p r o t e c t i o n a long a reach o f t h e Yukon R ive r a t Galena
A i r f i e l d . ) There i s no doubt t h a t t h e performance o f t h e vane
system, i f i n s t a l l e d , w i l l be fo l lowed c l o s e l y by many p a r t i e s .
Figure 47. U.S. Highway 34 Bridge over East Nishnabotna River, Viewed Downstream toward Right Bank of River
Figure 48. U.S. Highway 34 Bridge over E a s t Nishnabotna River, Viewed Downstream f r m Left Bank of River
REFERENCES
1. Ber t i n , J.J., and Smith, M.L., Aerodynamics f o r Engineers, Prent ice-Ha l l , Inc., Englewood C l i f f s , N.J., 1979.
2. Falcon, M.A., "Analys is o f Flow i n A l l u v i a l Channel Bends", Thesis presented t o The U n i v e r s i t y o f Iowa, Iowa C i t y , Iowa, i n 1979, i n p a r t i a l f u l f i l l m e n t o f t h e requirements f o r the degree o f Doctor o f Philosophy.
3. Jansen, P. Ph., e t al., P r i n c i p l e s o f R i ve r Engineering, Pitman Pub l i sh ing Ltd., London, Uni ted Kingdom, 1979.
4. Odgaard, A.J., and Kennedy, J.F., "River-Bend Bank P ro tec t i on by Submerged Vanes", Journal o f Hydrau l ic Engineering, ASCE, Vol, 109, No. 8, Aug., 1983, pp. 1161-1173.
5. Odgaard, A.J., "Flow and Bed Topography i n A l l u v i a l Channel Bends", Journal o f Hydrau l ic Engineering, ASCE, Vol. 110, No. 4, A p r i l , 1984, pp. 521-536.
6, Sabersky, R.H., and Acosta, A.J., F l u i d Flow, MacMil lan Pub l i sh ing Co., Inc., New York, 1964.
7. Shields, A., "Anvendung der Aenl i chkei tsmechani k und der Turbulenzforschung auf d i e Geshiebebewegung", M i t t e i l u n g e n der Preussischen Versuchsanstal t f u r Wasserbau and Schi f fbau, B e r l i n , Germany, Translated t o Eng l ish by W.P. O t t and J.C. van Uchelen, C a l i f o r n i a I n s t i t u t e o f Technology, Pasadena, C a l i f o r n i a , 1936.
8. U.S. Army Corps o f Engineers, The Streambank Erosion Contro l Eva lua t ion and Demonstration Act o f 1974 Sect ion 32, Pub l i c Law 93-251, F i n a l Report t o Congress (Publ ished a t t h e Waterways Experimental S ta t ion , Vicksburg, Miss.), December 1981.
APPENDIX I - VANE-DESIGN EXAMPLE
The f o l l o w i n g numerical example summarizes t h e procedure f o r
t h e design o f an Iowa-Vane bank p r o t e c t i o n s t ruc tu re .
A r i v e r f l ow curv ing a t a radius o f rc = 2,000 f t has been
observed t o cause bank eros ion when t h e discharge exceeds 3,000
c f s . The bed ma te r ia l i n the channel i s sand w i t h a median-grain
d iameter o f 0.4 mm and a geometric standard d e v i a t i o n o f l e s s than
2. The l o n g i t u d i n a l s lope of t h e water sur face remains constant a t
a value o f S = 0.0006 a t a l l f l o w rates. A t 3,000 c f s , t h e average
w id th and depth o f t h e r i v e r channel are 100 f t and 10 ft,
respec t i ve l y . A vane system i s t o be designed t h a t prevents the
near-bank v e l o c i t y from exceeding i t s 3,000-cfs value. Maximum
v e l o c i t y i n t h e channel occurs a t bankful stage when t h e f l ow i s
8,000 c f s and depth and w id th are 15 f t and 120 ft, respec t i ve l y .
For t h e vane system t o be eros ion prevent ive a t a l l f l o w rates,
H must be l ess than h a l f t h e water depth when the f l o w i s 3,000 cfs;
i.e., H c 5 ft. With H = 5 ft, t h e H/d r a t i o i s 0.5 a t 3,000 c f s
and 0.33 a t 8,000 c f s . The performance o f the vanes i s c l o s e r t o
optimum i f t h e i r he igh t i s chosen t o be H = 4 ft. The H/d values
then range from 0.25 t o 0.4 a t e ros ion causing f l o w rates. The
l eng th i s se lected on t h e bas is o f model-test experience t o be f o u r
t ime t h e he igh t : L = 4H = 16 ft.
A t bankful f low, t h e average v e l o c i t y i n t h e channel i s ua =
8,000/[(120)(15)] = 4.44 f t / s e c y i e l d i n g n = K U ~ / { ~ = 3.3, and -2
6 = arc tan [K (da / re ) n (n+ l ) / (n+2) ] = 7'. Enter ing Fig. 6 w i t h
H/L = 0.25 and a = 10 + 7 = 17" y i e l d s CL = 0,4; s u b s t i t u t i n g n =
3.3 and H/d = 0.25 i n t o Eq. 10 y i e l d s F = 0.78. Eq. 4 y i e l d s FD =
16-78.
A t 3,000 cfs, ua = 3,000/[(100)(10)] = 3.0 fps, y i e l d i n g FD =
11.34.
The vanes are t o reduce the 8,000 c f s transverse bed slope, ST = (4.8)( 0.05)(16.68)(15)/(2,000) = 0.135 t o the 3,000 c f s
t ransverse bed slope, ST^ * (4.8)( 0.05)(11.34)(10)/(2,000) =
0.0609. This i s equivalent t o increasing the e f f e c t i v e radius from
re = 2,000 ft t o re, = (4.8)( 0.05)(16.78(15)/(0.0609) = 4,440 f t s u b s t i t u t i n g i n t o Eq. 16 then y i e l d s
N = 30 per 1000 f t o f channel
APPENDIX I1
Grain-Size Distribution from Field Surveys
99.5- I I I I I I I I t I I I A
99 - 98 - DISTANCE FROM LEFT BANK:
W
N- 95- V)
0 90- W
';? o 80-
- - " z 70- - - - z 60
-
2 50- -
I- 40- -
5 30- - Z - 2 0 - - L L
I- = 10- - o ar. 5 - - W a
2 - SECTION 2-OCTOBER 7, 1983 - 1 - -
0.5 I I I I I I l l l l I i I
0.1 0.2 0.5 1.0 2.0 5.0 SIZE, IN MILLIMETERS
99.5 99 98
1=1 95- - 0
0 90 - W I- a 80- 0
70- Z - 60- 5 50-
40- 3 0 -
z 20- LL
I- z: 10 W 0 rr 5 - W a
2: 1 0.5
t I I I t I l l I I I
- - - -
DISTANCE FROM LEFT BANK: - -
- - - - - - -
- -
-
/ SECTION 3 - OCTOBER 7, 1983 - -
I t I I I I I I I
0.1 0.2 0.5 1.0 2.0 5.0 SIZE, IN MILLIMETERS
99 DISTANCE FROM LEFT BANK:
70f t , 8 0 f t
rn 50 f t
SECTION 4-OCTOBER 6, 1983 j 0.5 I I I I 1 1 1 1 1 1 I I I