Submission on the Draft Final Report of the Scientific Inquiry into Hydraulic Fracturing in the Northern Territory: Greenhouse gas emissions Mark Ogge, Rod Campbell, February 2018 Table of Contents Introduction .......................................................................................................................... 2 Executive Summary............................................................................................................... 2 NT fracking emissions in context ........................................................................................... 3 Potential total emissions from shale gas resource ............................................................. 3 Risk assessment fails to assess impacts of shale oil. .......................................................... 5 Failure to meet Terms of Reference .................................................................................. 6 Potential annual emissions................................................................................................ 7 Carbon lock-in ....................................................................................................................... 9 Draft report global greenhouse gas emissions comparisons are flawed .............................. 10 Methane emissions are understated in the Draft Report..................................................... 12 Conclusion .......................................................................................................................... 16 Recommendations .............................................................................................................. 17
Transcript
Submission on the Draft Final Report of the Scientific Inquiry into Hydraulic Fracturing in the Northern Territory: Greenhouse gas emissions Mark Ogge, Rod Campbell, February 2018
Table of Contents Introduction .......................................................................................................................... 2
Introduction The Australia Institute appreciates the opportunity to respond to Draft Final Report of the Northern Territory Scientific Inquiry into Hydraulic Fracturing. We would also like to thank Tim Forcey and Dimitri Laffleur whose work has been helpful in preparing this submission. The Australia Institute has published research on climate and energy issues for over two decades including many reports on unconventional gas. The Institute previously commissioned two reports on methane emissions from the University of Melbourne that have been cited in this report1 The Institute has also submitted a separate response to the economics chapter of the Inquiry’s Draft Final Report.
Executive Summary The Draft Final Report of the Northern Territory Scientific Inquiry into Hydraulic Fracturing effectively recommends approval of unconventional gas development in the Northern Territory. It does this despite the huge potential climate change impacts of developing a shale gas industry, which this submission focuses on. Development of onshore shale oil and gas fields in the Northern Territory could result in up to 34 billion tonnes of carbon emissions, equivalent to 60 times Australia’s total current greenhouse gas emissions, or 130 large coal power plants running for 40 years. Global warming is not only a future concern but is already causing serious damage now - including loss of human life, devastating natural ecosystems and increasing natural disasters. The Northern Territory itself is highly susceptible to temperature increases. For example, in Darwin the number of days over 35 degrees Celsius is expected to increase from 11 per year
1 Laffleur (2016) The risk of migratory methane emissions resulting from the development of Queensland coal seam gas accesed 1/1/18 http://climatecollege.unimelb.edu.au/risk-migratory-methane-emissions-resulting-development-queensland-coal-seam-gas Forcey, Laffleur (2016) A Review of Current and Future Methane Emissions from Australian unconventional oil and gas production, Accessed 1/1/18 http://www.tai.org.au/content/review-current-and-future-methane-emissions-australian-unconventional-oil-and-gas-production
currently to 308 by 2070 without global action to reduce emissions.2 Heatwaves have killed more Australians than any other extreme weather events.3 Despite being required by its Terms of Reference to assess the cumulative impacts of unconventional reservoir development, and having identified a 257,276 PJ resource, the Inquiry based its risk assessment on its estimate of emissions from a single 365 PJ/y shale gas field and ignored the impact of shale oil. It found that development of this single shale gas field in isolation would increase Australia’s greenhouse gas emissions by 5%4. Incredibly the Inquiry concludes this as a “low” consequence and “acceptable” risk. In fact, even a 5% increase in Australia’s emissions from a single gas field is a large and unacceptable increase. It is completely inconsistent with Australia’s carbon budget and our commitments under the Paris agreement. As such, unconventional gas and shale oil development in the northern Territory should not go ahead under any circumstances.
NT fracking emissions in context Potential total emissions from shale gas resource The Inquiry’s Draft Report identifies total shale gas resources of 257,276 PJ in the Northern Territory.5 Despite identifying this potential resource, the Inquiry fails to explore the risks of exploiting this resource, particularly the risk of greenhouse gas pollution from extracting and using this gas. Figure 1 below quantifies the possible greenhouse emissions under different methane global warming potentials:
2 Australian Government, Department of the Environment and Energy, Climate change impacts in the Northern Territory, Accessed 28/01/17 http://www.environment.gov.au/climate-change/climate-science-data/climate-science/impacts/nt 3 Hughes et al (2016) The Silent Killer: Climate Change and the Health Impacts of Extreme Heat, Climate Council. 4 Inquiry Report, Section 9.6 p.209 5 Draft Final Report Section 6.3 p.76, based on Geoscience Australia assessment
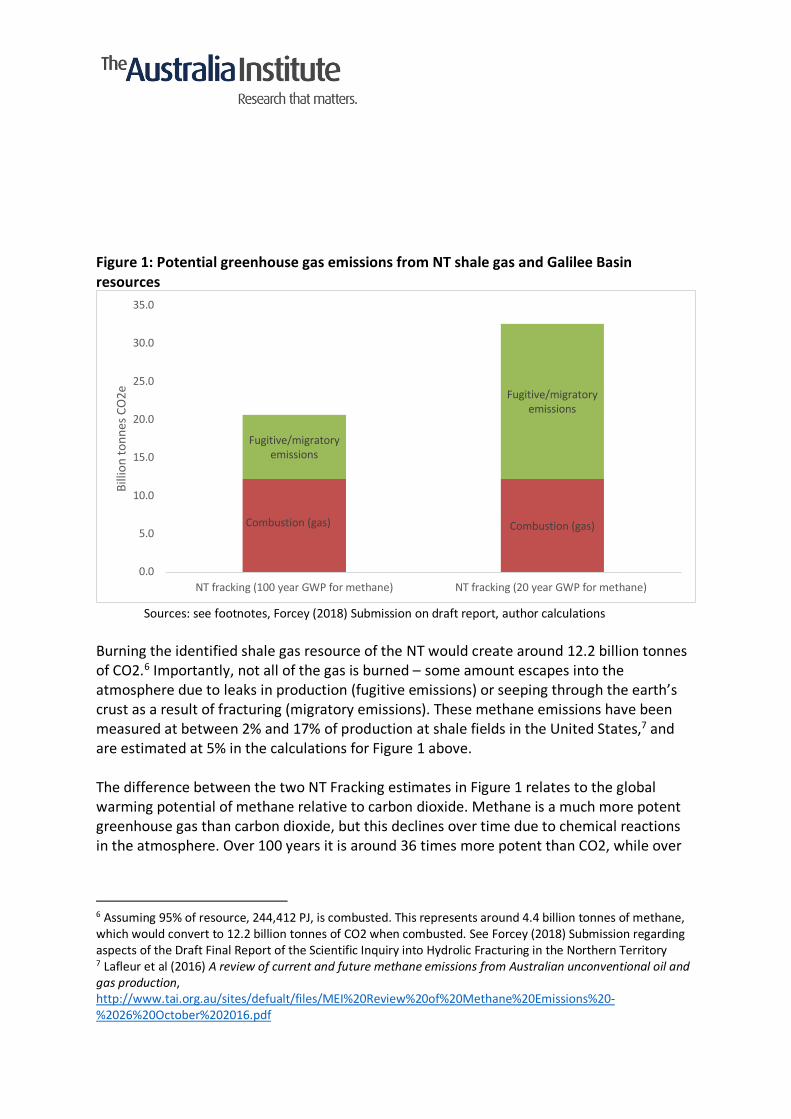
Figure 1: Potential greenhouse gas emissions from NT shale gas and Galilee Basin resources
Sources: see footnotes, Forcey (2018) Submission on draft report, author calculations
Burning the identified shale gas resource of the NT would create around 12.2 billion tonnes of CO2.6 Importantly, not all of the gas is burned – some amount escapes into the atmosphere due to leaks in production (fugitive emissions) or seeping through the earth’s crust as a result of fracturing (migratory emissions). These methane emissions have been measured at between 2% and 17% of production at shale fields in the United States,7 and are estimated at 5% in the calculations for Figure 1 above. The difference between the two NT Fracking estimates in Figure 1 relates to the global warming potential of methane relative to carbon dioxide. Methane is a much more potent greenhouse gas than carbon dioxide, but this declines over time due to chemical reactions in the atmosphere. Over 100 years it is around 36 times more potent than CO2, while over
6 Assuming 95% of resource, 244,412 PJ, is combusted. This represents around 4.4 billion tonnes of methane, which would convert to 12.2 billion tonnes of CO2 when combusted. See Forcey (2018) Submission regarding aspects of the Draft Final Report of the Scientific Inquiry into Hydrolic Fracturing in the Northern Territory 7 Lafleur et al (2016) A review of current and future methane emissions from Australian unconventional oil and gas production, http://www.tai.org.au/sites/defualt/files/MEI%20Review%20of%20Methane%20Emissions%20-%2026%20October%202016.pdf
Combustion (gas) Combustion (gas)
Fugitive/migratory emissions
Fugitive/migratory emissions
0.0
5.0
10.0
15.0
20.0
25.0
30.0
35.0
NT fracking (100 year GWP for methane) NT fracking (20 year GWP for methane)
Billi
on to
nnes
CO
2e
20 years it is up to 87 times more potent. Depending on the time frame in question, methane’s climate impacts are different, explaining the different estimates in Figure 1. These are huge amounts of greenhouse gasses. This equivalent of either 38 or 61 years of Australia’s total annual emissions, which were around 537 million tonnes in 2015.8 Alternatively, this is equivalent to 130 large coal power plants operating for up to 40 years9. Even if we exclude the impact of fugitive emissions and shale oil, it would result in 12.2 billion tonnes, the equivalent to around 50 large coal power plants operating for 40 years. Risk assessment fails to assess impacts of shale oil. The Inquiry’s Terms of Reference for the Inquiry state:
1. assess the scientific evidence to determine the nature and extent of the environmental impacts and risks, including the cumulative impacts and risks, associated with hydraulic fracturing of unconventional reservoirs and the Associated Activities in the Northern Territory.
The Inquiry makes no mention of shale oil, but the US EIA estimates a resource of 4.7 billion barrels.10 Shale oil is often a key driver of shale development. Often it can be decisive in the commercial viability of extracting the resource. Most shale fields in the US extract both shale oil and gas. Proponent companies in the Northern Territory have publicly announced they are targeting shale oil resources.
In the US shale oil has been major driver of the unconventional fracking, if not the main driver. Most unconventional hydrocarbon basins in the US have both oil and gas production.11 Geoscience Australia believes shale oil could be the “key driver” of unconventional fracking in the Beetaloo and Georgina basins in the Northern Territory.12 Geoscience Australia have identified almost 200,000 PJ of prospective shale oil resources in the Northern Territory across the McCarthur, Beetaloo and Georgina basins.13
8 National Greenhouse Gas Inventory (2017) http://ageis.climatechange.gov.au/ 9 Assumes a coal plant of 1000 MW registered capacity running at .75 capacity with emissions intensity of 1000 kg CO2/MWh. 10 US EIA (2013) Technically Recoverable Shale Oil and Shale Gas Resources: An Assessment of 137 Shale Formations in 41 Countries Outside the United States https://www.eia.gov/analysis/studies/worldshalegas/pdf/overview.pdf 11 U.S. Energy Information Administration, Drilling Productivity report, January 2018, accessed 19/01/18 https://www.eia.gov/petroleum/drilling/pdf/dpr-full.pdf 12 Geoscience Australia, 2013, Old rocks prove their exploration potential, accessed 19/1/18 http://www.ga.gov.au/news-events/news/latest-news/old-rocks-prove-their-exploration-potential2 13 http://www.ga.gov.au/aera/oil
Proponents themselves have clearly and publicly indicated that they are actively perusing oil plays.14 15 16 Unconventional oil and gas drilling have completely different production, processing, transport and storage, all with different fugitive emissions risks and profiles.17 A further risk is that developments targeting shale oil will produce oil without connection to the gas network, in which case gas will be a by-product without access to the market (oil can be transported by road) and hence the gas would be vented or flared. In the US, very large quantities of gas gave been flared (up to 40% of production) when oil production began prior gas infrastructure being in place.18 The Draft Final Report cannot be said to have assessed the “cumulative impacts and risks, associated with hydraulic fracturing of unconventional reservoirs” as required by the Terms of Reference without considering the implications of shale oil development. Failure to meet Terms of Reference The Inquiry’s Terms of Reference for the Inquiry state:
1. assess the scientific evidence to determine the nature and extent of the environmental impacts and risks, including the cumulative impacts and risks, associated with hydraulic fracturing of unconventional reservoirs and the Associated Activities in the Northern Territory.
Despite being required by its Terms of Reference to assess the cumulative impacts of unconventional reservoir development, and having identified a 257,276 PJ resource, the Inquiry based its risk assessment on its estimate of emissions from a single 365 PJ/y shale gas field. Had the Inquiry complied with these Terms of Reference, it would also have considered the potential for shale oil production and its associated risks.
14 McDonald Smith, A, (2014) Origin, Sasol in $200m Shale exploration deal in NT Accessed 1/1/18 http://www.afr.com/business/energy/gas/origin-sasol-in-200m-shale-exploration-deal-in-nt-20140502-iwu8n 15 Chamber, M (2017) Origin sitting on Beetaloo shale gas bonanza accessed1/1/18 https://www.theaustralian.com.au/business/mining-energy/origin-sitting-on-beetaloo-shale-gas-bonanza/news-story/b0df8be0415702284a6c5a8c23832285 16 Origin Energy 2016 Amungee NW-1H – Velkerri B Shale Pool Results of Evaluation of the Discovery and Preliminary Estimate of Petroleum in Place 17 IPCC 2006, Fugitive Emissions from oil and natural gas activities http://www.ipcc-nggip.iges.or.jp/public/gp/bgp/2_6_Fugitive_Emissions_from_Oil_and_Natural_Gas.pdf 18 EIA (2016), Natural gas flaring in North Dakota has declined sharply since 2014, accessed 1/1/18 https://www.eia.gov/todayinenergy/detail.php?id=26632
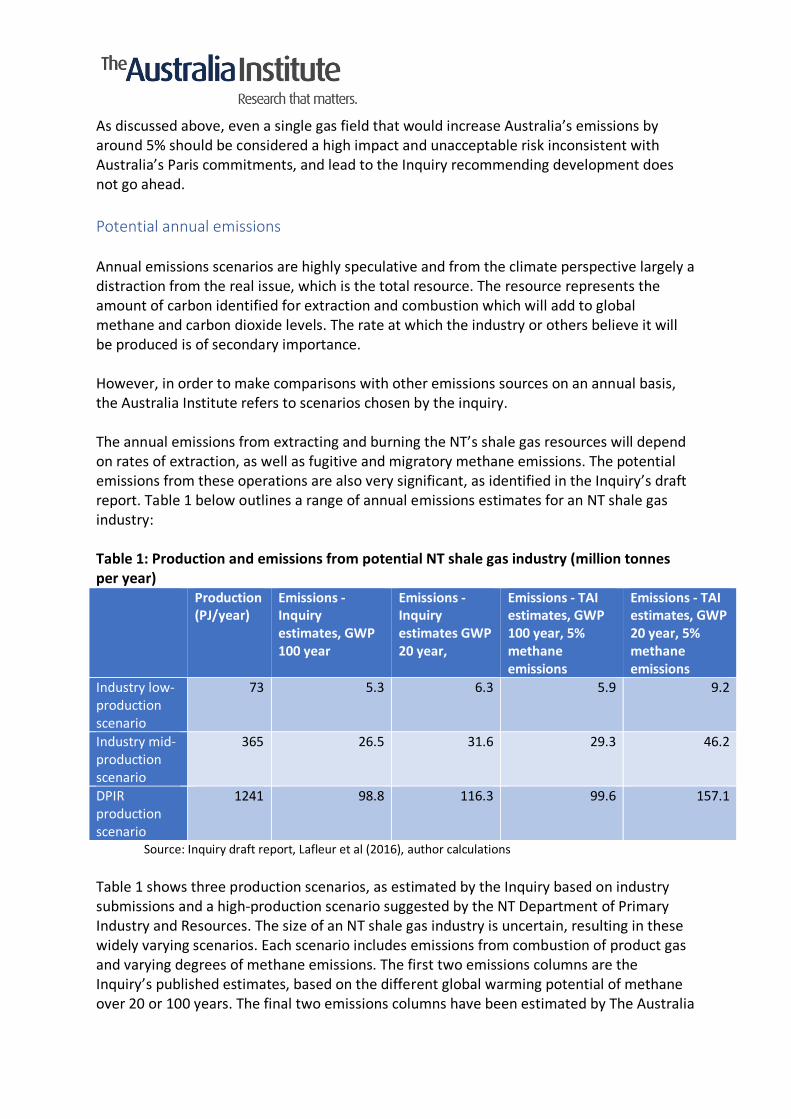
As discussed above, even a single gas field that would increase Australia’s emissions by around 5% should be considered a high impact and unacceptable risk inconsistent with Australia’s Paris commitments, and lead to the Inquiry recommending development does not go ahead. Potential annual emissions Annual emissions scenarios are highly speculative and from the climate perspective largely a distraction from the real issue, which is the total resource. The resource represents the amount of carbon identified for extraction and combustion which will add to global methane and carbon dioxide levels. The rate at which the industry or others believe it will be produced is of secondary importance. However, in order to make comparisons with other emissions sources on an annual basis, the Australia Institute refers to scenarios chosen by the inquiry. The annual emissions from extracting and burning the NT’s shale gas resources will depend on rates of extraction, as well as fugitive and migratory methane emissions. The potential emissions from these operations are also very significant, as identified in the Inquiry’s draft report. Table 1 below outlines a range of annual emissions estimates for an NT shale gas industry: Table 1: Production and emissions from potential NT shale gas industry (million tonnes per year) Production
(PJ/year) Emissions - Inquiry estimates, GWP 100 year
Emissions - Inquiry estimates GWP 20 year,
Emissions - TAI estimates, GWP 100 year, 5% methane emissions
Emissions - TAI estimates, GWP 20 year, 5% methane emissions
Industry low-production scenario
73 5.3 6.3 5.9 9.2
Industry mid-production scenario
365 26.5 31.6 29.3 46.2
DPIR production scenario
1241 98.8 116.3 99.6 157.1
Source: Inquiry draft report, Lafleur et al (2016), author calculations Table 1 shows three production scenarios, as estimated by the Inquiry based on industry submissions and a high-production scenario suggested by the NT Department of Primary Industry and Resources. The size of an NT shale gas industry is uncertain, resulting in these widely varying scenarios. Each scenario includes emissions from combustion of product gas and varying degrees of methane emissions. The first two emissions columns are the Inquiry’s published estimates, based on the different global warming potential of methane over 20 or 100 years. The final two emissions columns have been estimated by The Australia
Institute, based on combustion assumptions in the section above and an assumption of 5% fugitive and migratory methane emissions. These are huge quantities of greenhouse gas emissions. They represent an increase in emissions comparable to each state in Australia’s annual emissions. In Figure 2 below the annual emissions of Australia’s states and territories are shown in blue and the potential annual emissions from NT shale exploitation are shown in red. Figure 2: Annual emissions, states, territories and NT shale shale selected scenarios
Sources: National Greenhouse Gas Inventory (2017) State and Territory Greenhouse Gas Inventories 2015; Fracking Inquiry draft report, author calculations
Figure 2 shows that the scenario envisaged by the DPIR would see the NT shale industry producing emissions larger than any state in Australia under Australia Institute assumptions. Under the Inquiry’s assumptions NT shale emissions would be up to the level of Victoria. The middle estimates are equivalent to the emissions of South Australia. Even the lowest estimate of 5.3 million tonnes per year equates to five times the 2015 emissions of Tasmania. The Inquiry’s draft report notes that industry’s mid scenarios represent an increase of 5% of Australia’s national emissions. The DPIR’s scenarios represent an increase of over 20% of Australia’s total annual emissions. Australia’s emissions reduction targets under the Paris Agreement are for 26-28% reductions in emissions compared to 2005 levels. Given our policy goals of reducing emissions, pursuing any policy that would increase emissions to such a degree is highly counter-productive.
157.1 152.1133.4
119.6 116.3
86.5
31.6 30.1 26.512.8 5.3 1.6 0.9
0
20
40
60
80
100
120
140
160
180
NT frac
king D
PIR high QldNSW Vic
NT frac
king D
PIR low WA
NT frac
king (
Industry 2
0y) SA
NT frac
king
(Industr
y 100y) NT
NT frac
king l
ow ACT Tas
Mill
ion
tonn
es p
er y
ear
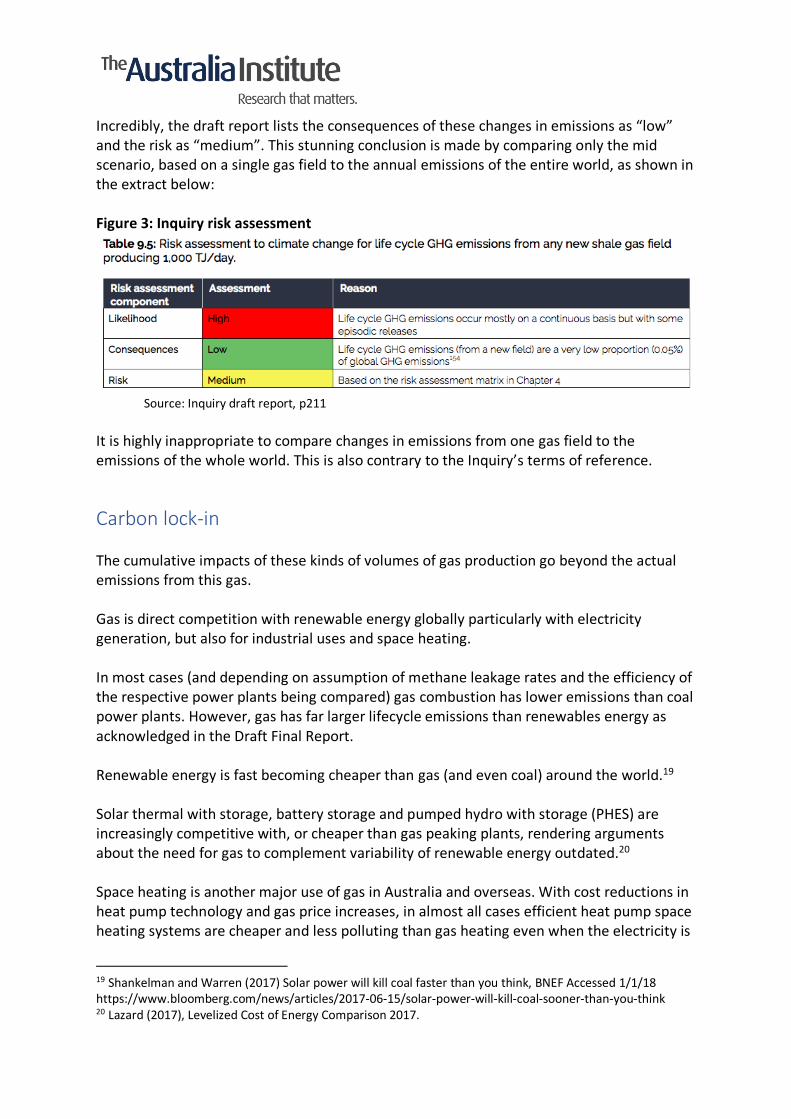
Incredibly, the draft report lists the consequences of these changes in emissions as “low” and the risk as “medium”. This stunning conclusion is made by comparing only the mid scenario, based on a single gas field to the annual emissions of the entire world, as shown in the extract below: Figure 3: Inquiry risk assessment
Source: Inquiry draft report, p211
It is highly inappropriate to compare changes in emissions from one gas field to the emissions of the whole world. This is also contrary to the Inquiry’s terms of reference.
Carbon lock-in The cumulative impacts of these kinds of volumes of gas production go beyond the actual emissions from this gas. Gas is direct competition with renewable energy globally particularly with electricity generation, but also for industrial uses and space heating. In most cases (and depending on assumption of methane leakage rates and the efficiency of the respective power plants being compared) gas combustion has lower emissions than coal power plants. However, gas has far larger lifecycle emissions than renewables energy as acknowledged in the Draft Final Report. Renewable energy is fast becoming cheaper than gas (and even coal) around the world.19 Solar thermal with storage, battery storage and pumped hydro with storage (PHES) are increasingly competitive with, or cheaper than gas peaking plants, rendering arguments about the need for gas to complement variability of renewable energy outdated.20 Space heating is another major use of gas in Australia and overseas. With cost reductions in heat pump technology and gas price increases, in almost all cases efficient heat pump space heating systems are cheaper and less polluting than gas heating even when the electricity is
19 Shankelman and Warren (2017) Solar power will kill coal faster than you think, BNEF Accessed 1/1/18 https://www.bloomberg.com/news/articles/2017-06-15/solar-power-will-kill-coal-sooner-than-you-think 20 Lazard (2017), Levelized Cost of Energy Comparison 2017.
supplied by coal. In many areas of Australia even the cost of replacing gas heaters with heat pumps has a short payback period.21 However, although the cost of renewable energy is cheaper overall, the initial capex of gas is usually far lower than renewables with renewables saving on fuel costs over time. Similarly, with electrical space heating and industrial uses, although costs are saved over time, the sunk costs of gas system can be a barrier to fuel switching. As such, there is the risk that gas plants and other gas infrastructure for heating and industry will be built, particularly in developing countries with little gas infrastructure currently, locking them in to higher energy costs in the medium to long term, and locking the world into far higher emissions.
Draft report global greenhouse gas emissions comparisons are flawed The Draft Final Reports argues that global methane emissions from natural gas have a small effect on climate change compared to that of CO2. ..annual fugitive methane emissions from natural gas production are about 0.2% of the annual anthropogenic greenhouse warming effect of carbon dioxide (based on data over the past decade).22 This this comparison is unhelpful and appears to be aimed at downplaying the seriousness of methane emissions from natural gas. Comparing methane emissions from natural gas to total CO2 emissions from all sources is not comparing like with like. Comparing warming impact of total lifecycle natural gas emissions to total lifecycle coal emissions for example would be a like for like comparison. Similarly comparing the warming impact of total anthropogenic methane emissions to the warming impact pf total anthropogenic CO2 emissions. Taking a subset of the lifecycle emissions of natural gas emissions and comparing them total CO2 emissions from all sources is a contrived comparison with little relevance to the question of whether the overall greenhouse gas impacts of unconventional oil and gas in the Northern Territory is acceptable risk. However, even this comparison is made up of misleading and incorrect assumptions. Footnote 17 explains the calculations that lead to the 0.2% figure. (=2.3%x0.19x0.33).
21 ATA (2014) Are we still cooking with gas? Accessed 1/1/18 http://www.ata.org.au/wp-content/uploads/2014/11/Gas-report-cover-v2.01.jpg 22 Draft report p 9
Each element of this calculation is incorrect or misleading. 2.3% This figure is a calculation of the climate effect of methane compared to the annual added climate effect of anthropogenic carbon dioxide greenhouse effect over the decade. Despite being a calculation for the climate effect over a decade, the calculation uses a GWP for a 100-year timeframe (36 x CO2). The appropriate GWP for the annual effect over a decade is of course a 10-year timeframe (110 x CO223). Using the correct time-frame the effect increases to 7%. Another approach is to use radiative forcing as a measure, in which case the effect would be 6%.24 0.19 This figure represents the proportion that fossil fuel methane emissions make up of total global methane emissions including natural sources. Again, this is not a like for like comparison. Methane emissions from fossil fuels should be compared to other anthropogenic sources of methane, as we have no control over natural sources such as swamps. On a 558Mt 25 CH4 budget, 59% is anthropogenic (328Mt CH4). Of that 328Mt, 105Mt 25 comes from fossil fuels, representing 32% of the total anthropogenic budget, rather than 19%. 0.33 This refers to the assumption that made by the report that “fugitive emissions from natural gas are one third of the emissions from fossil fuels globally” It is correct that methane emissions from oil and gas are thought to be approximately two thirds of fossil fuel methane emissions (the remaining third being from coal). However, there is no breakdown between gas an oil production. As discussed, oil is likely to be a significant part if not the “key driver” of fracking in the Northern territory if it allowed to go ahead. As such, the methane emissions of oil should be included in this comparison, as with the rest of the Inquiry. As such it is appropriate to apply two thirds (0.66) if this comparison is to be made. The missing 18%
23 IPCC, 2013, Climate change 2013: The physical science basis, chapter 8, figure 8.29 24 Lafleur, D. 2018, Submission to the scientific inquiry into hydraulic fracturing in the Northern Territory. Australian-German Climate & Energy College, University of Melbourne 25 Annual average 2003-2012, Saunois, 2016, table 2.
The most glaring omission is that is the effect of methane emissions from gas production are being compared to the total global carbon dioxide emissions, without acknowledging that 18.2%26 of the carbon dioxide emissions come from that same gas production.
Methane emissions are understated in the Draft Report The Draft Final Report cites a University of Melbourne Energy Institute report quoting “methane emissions ranging from 0.22 to 17% of total methane production” but then largely dismisses the higher readings that come from “top down” studies because;
…in particular, it is difficult, if not almost impossible, to distinguish between the many sources of emissions when considering the results from ‘top-down’ investigations.
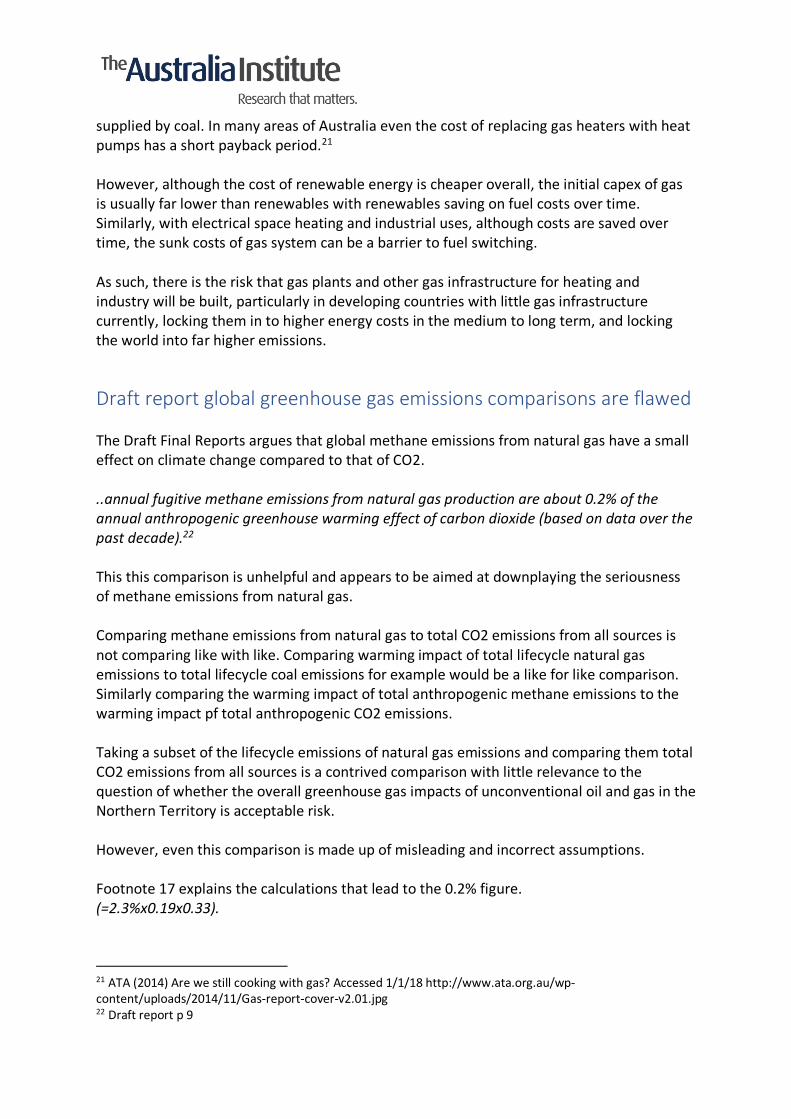
This is simply incorrect. Top down studies can and do distinguish between the different sources of emissions. All recent major top down measurement studies that found high levels of methane over US gas fields included detailed analysis distinguishing between different sources. Some specific examples include: Frankenberg et.al. (2016). This study was funded by NASA and the NOAA. It used top down infrared imaging able to accurately identify individual methane plumes as small as 2 kg per hour.
26 Lafleur, D. 2018
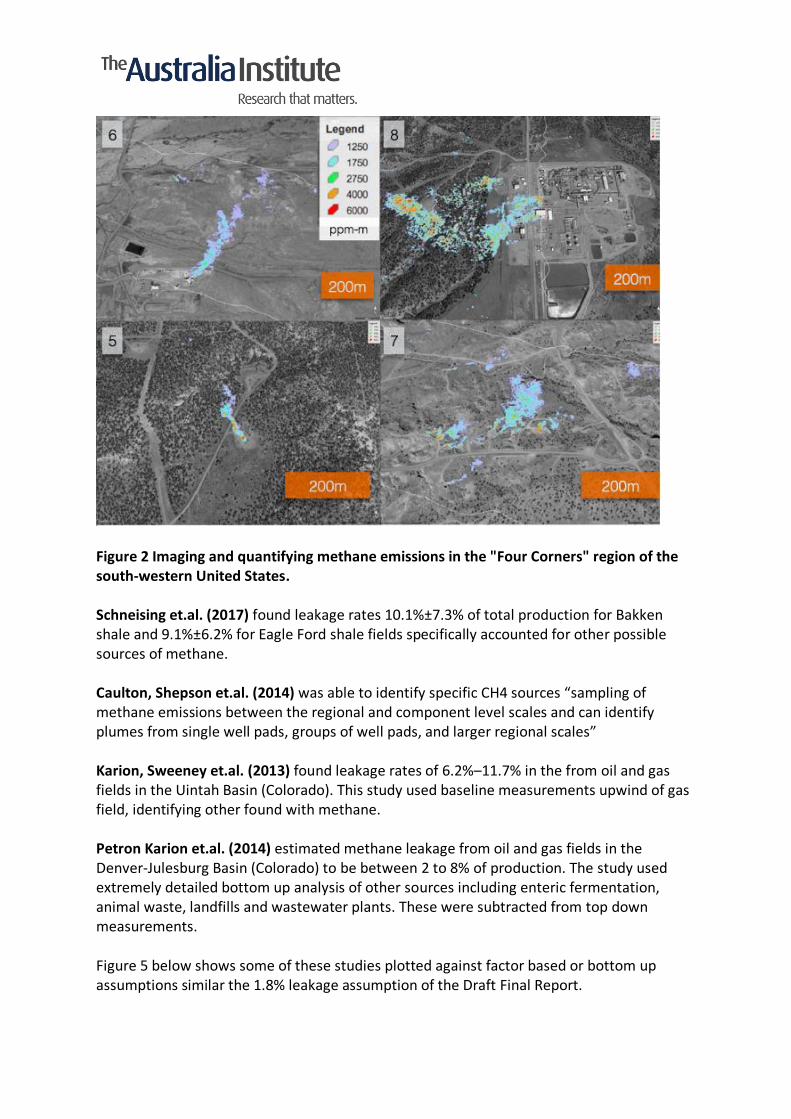
Figure 1 Imaging and quantifying methane emissions in the "Four Corners" region of the south-western United States.
Figure 2 Imaging and quantifying methane emissions in the "Four Corners" region of the south-western United States. Schneising et.al. (2017) found leakage rates 10.1%±7.3% of total production for Bakken shale and 9.1%±6.2% for Eagle Ford shale fields specifically accounted for other possible sources of methane. Caulton, Shepson et.al. (2014) was able to identify specific CH4 sources “sampling of methane emissions between the regional and component level scales and can identify plumes from single well pads, groups of well pads, and larger regional scales” Karion, Sweeney et.al. (2013) found leakage rates of 6.2%–11.7% in the from oil and gas fields in the Uintah Basin (Colorado). This study used baseline measurements upwind of gas field, identifying other found with methane. Petron Karion et.al. (2014) estimated methane leakage from oil and gas fields in the Denver-Julesburg Basin (Colorado) to be between 2 to 8% of production. The study used extremely detailed bottom up analysis of other sources including enteric fermentation, animal waste, landfills and wastewater plants. These were subtracted from top down measurements. Figure 5 below shows some of these studies plotted against factor based or bottom up assumptions similar the 1.8% leakage assumption of the Draft Final Report.
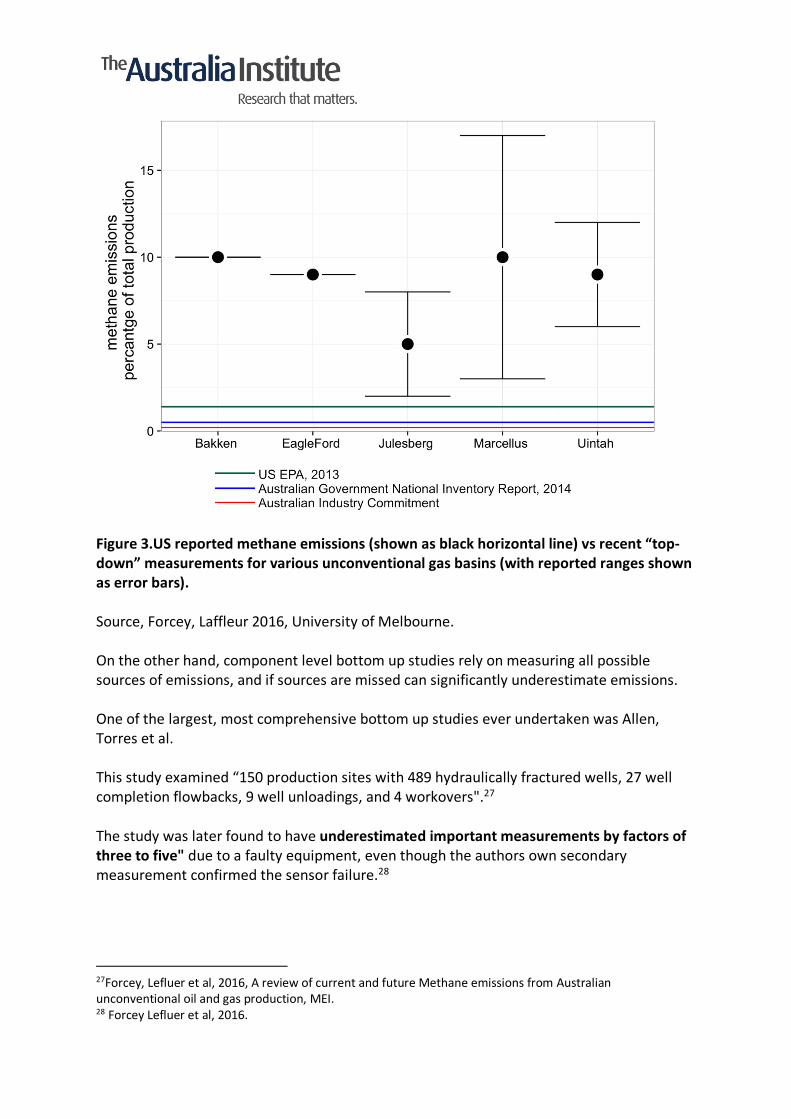
Figure 3.US reported methane emissions (shown as black horizontal line) vs recent “top-down” measurements for various unconventional gas basins (with reported ranges shown as error bars). Source, Forcey, Laffleur 2016, University of Melbourne. On the other hand, component level bottom up studies rely on measuring all possible sources of emissions, and if sources are missed can significantly underestimate emissions. One of the largest, most comprehensive bottom up studies ever undertaken was Allen, Torres et al. This study examined “150 production sites with 489 hydraulically fractured wells, 27 well completion flowbacks, 9 well unloadings, and 4 workovers".27 The study was later found to have underestimated important measurements by factors of three to five" due to a faulty equipment, even though the authors own secondary measurement confirmed the sensor failure.28
27Forcey, Lefluer et al, 2016, A review of current and future Methane emissions from Australian unconventional oil and gas production, MEI. 28 Forcey Lefluer et al, 2016.
However, a bigger problem than flawed studies and equipment is the inherent difficulty if not impossibility of capturing all emissions sources. As University of Melbourne researchers put it:
'Bottom-up' studies may also fail to assess every emission source. Sources may be unknown, unexpected, or outside of the scope assigned to assessors. CSIRO's experience (Day, Dell’Amico et al. (2014)) is one example of the latter. Because emission-points can be vast in number, 'bottom-up' studies may of necessity measure only a limited number of points and then attempt to apply the limited results to an entire class of emission points.29
The Draft Final Report, after dismissing empirical actual measurement of gas fields relies on a theoretical model to assume a leakage rate of 1.8% of production.30 This figure is a theoretical national average across the US covering both conventional and unconventional sources. It is well understood that conventional gas has substantially lower methane emissions than unconventional gas wells, which alone makes it an inappropriate assumption. However even more importantly, there is no reason to assume that an immature unconventional oil and gas industry in the Northern Territory would have methane emissions rates in line with US average, particularly one that includes conventional gas.
Conclusion The Draft Final Report fails to consider the cumulative impacts fulfill its Terms of Reference by basing its risk assessment on a single gas field in isolation and ignoring shale oil development. It is also incorrect in assessing the consequences of emissions from a single gas field equivalent to 5% of Australia’s current total emissions as “low” and the risk “acceptable”. In fact, this is a very large amount of emissions and completely at odds with Australia’s commitments under the Paris Agreement. This alone should rule out development of unconventional gas and shale oil reservoirs in the Northern territory. This remains true whatever the level of methane emissions as the combustion emissions alone are enough to make development completely unacceptable.
29 Forcey Lefluer et al, 2016. 30 Littlefield
However, it should be noted that there are a number of misleading comparisons and errors and that consistently lead to an underestimation likely level of methane emissions and the consequences of those emissions.
Recommendations That the Inquiry recommend that the development of onshore shale oil and gas fields in the Northern Territory should not go ahead under any circumstances.