Dynamic graph representation learning is a task to learn nodeembeddings over dynamic networks, and has many important ap-plications, including knowledge graphs, citation networks to socialnetworks. Graphs of this type are usually large-scale but only asmall subset of vertices are related in downstream tasks. Currentmethods are too expensive to this setting as the complexity is atbest linear-dependent on both the number of nodes and edges.
In this paper, we propose a new method, namely Dynamic Per-sonalized PageRank Embedding (DynamicPPE) for learning a targetsubset of node representations over large-scale dynamic networks.Based on recent advances in local node embedding and a novelcomputation of dynamic personalized PageRank vector (PPV), Dy-namicPPE has two key ingredients: 1) the per-PPV complexity isO(𝑚𝑑/𝜖) where𝑚,𝑑 , and 𝜖 are the number of edges received, aver-age degree, global precision error respectively. Thus, the per-edgeevent update of a single node is only dependent on 𝑑 in average;and 2) by using these high quality PPVs and hash kernels, thelearned embeddings have properties of both locality and globalconsistency. These two make it possible to capture the evolution ofgraph structure effectively.
Experimental results demonstrate both the effectiveness and effi-ciency of the proposed method over large-scale dynamic networks.We apply DynamicPPE to capture the embedding change of Chinesecities in the Wikipedia graph during this ongoing COVID-19 pan-demic 1. Our results show that these representations successfullyencode the dynamics of the Wikipedia graph.
Xingzhi Guo, Baojian Zhou, and Steven Skiena. 2021. Subset Node Repre-sentation Learning over Large Dynamic Graphs. In Proceedings of the 27th
ACM SIGKDD Conference on Knowledge Discovery and Data Mining (KDD
∗Both authors contributed equally to this research1https://en.wikipedia.org/wiki/COVID-19_pandemic
Permission to make digital or hard copies of all or part of this work for personal orclassroom use is granted without fee provided that copies are not made or distributedfor profit or commercial advantage and that copies bear this notice and the full citationon the first page. Copyrights for components of this work owned by others than ACMmust be honored. Abstracting with credit is permitted. To copy otherwise, or republish,to post on servers or to redistribute to lists, requires prior specific permission and/or afee. Request permissions from [email protected] ’21, August 14–18, 2021, Virtual Event, Singapore.
Figure 1: (a) The model of dynamic network in two consecu-
tive snapshots. (b) An application of DynamicPPE to keep
track embedding movements of interesting Wikipedia ar-
ticles (vertices). We learn embeddings of two presidents of
the United States on the whole English Wikipedia graph
from 2012 monthly, which cumulatively involves 6.2M ar-
ticles (nodes) and 170M internal links (edges). The embed-ding movement between two time points is defined as 1 −cos(𝒘𝑡
𝑣,𝒘𝑡+1𝑣 ) where cos(·, ·) is the cosine similarity. The sig-
nificant embeddingmovements may reflect big social status
changes of Donald_Trump and Joe_Biden2in this dynamic
Wikipedia graph.
’21), August 14–18, 2021, Virtual Event, Singapore. ACM, New York, NY, USA,11 pages. https://doi.org/10.1145/XXXXXXXXXXXXX
1 INTRODUCTION
Graph node representation learning aims to represent nodes fromgraph structure data into lower dimensional vectors and has re-ceived much attention in recent years [12, 15, 16, 23, 29, 31, 37]. Ef-fective methods have been successfully applied to many real-worldapplications where graphs are large-scale and static [43]. However,networks such as social networks [4], knowledge graphs [20], andcitation networks [7] are usually time-evolving where edges andnodes are inserted or deleted over time. Computing representationsof all vertices over time is prohibitively expensive because only asmall subset of nodes may be interesting in a particular application.Therefore, it is important and technical challenging to efficientlylearn dynamic embeddings for these large-scale dynamic networksunder this typical use case.
Specifically, we study the following dynamic embedding problem:We are given a subset 𝑆 = {𝑣1, 𝑣2, . . . , 𝑣𝑘 } and an initial graph G𝑡with 𝑡 = 0. Between time 𝑡 and 𝑡 + 1, there are edge events ofinsertions and/or deletions. The task is to design an algorithm to2Two English Wikipedia articles are accessible at https://en.wikipedia.org/wiki/Donald_Trump and https://en.wikipedia.org/wiki/Joe_Biden.
learn embeddings for 𝑘 nodes with time complexity independenton the number of nodes 𝑛 per time 𝑡 where 𝑘 ≪ 𝑛. This problemsetting is both technically challenging and practically important.For example, in the English Wikipedia graph, one need focus onlyon embedding movements of articles related to political leaders,a tiny portion of whole Wikipedia. Current dynamic embeddingmethods [10, 28, 47, 49, 50] are not applicable to this large-scaleproblem setting due to the lack of efficiency. More specifically,current methods have the dependence issue where one must learn allembedding vectors. This dependence issue leads to per-embeddingupdate is linear-dependent on 𝑛, which is inefficient when graphsare large-scale. This obstacle motivates us to develop a new method.
In this paper, we propose a dynamic personalized PageRankembedding (DynamicPPE) method for learning a subset of noderepresentations over large-sale dynamic networks. DynamicPPEis based on an effective approach to compute dynamic PPVs [45].There are two challenges of using Zhang et al. [45] directly: 1) thequality of dynamic PPVs depend critically on precision parameter𝜖 , which unfortunately is unknown under the dynamic setting; and2) The update of per-edge event strategy is not suitable for batchupdate between graph snapshots. To resolve these two difficulties,first, we adaptively update 𝜖 so that the estimation error is indepen-dent of 𝑛,𝑚, thus obtaining high quality PPVs. Yet previous workdoes not give an estimation error guarantee. We prove that thetime complexity is only dependent on 𝑑 . Second, we incorporatea batch update strategy inspired from [13] to avoid frequent per-edge update. Therefore, the total run time to keep track of 𝑘 nodesfor given snapshots is O(𝑘𝑑𝑚). Since real-world graphs have thesparsity property 𝑑 ≪ 𝑛, it significantly improves the efficiencycompared with previous methods. Inspired by InstantEmbedding
[30] for static graph, we use hash kernels to project dynamic PPVsinto embedding space. Figure 1 shows an example of successfullyapplying DynamicPPE to study the dynamics of social status in theEnglish Wikipedia graph. To summarize, our contributions are:
(1) We propose a new algorithm DynamicPPE, which is basedon the recent advances of local network embedding on staticgraph and a novel computation of dynamic PPVs. DynamicPPEeffectively learns PPVs and then projects them into embeddingspace using hash kernels.
(2) DynamicPPE adaptively updates the precision parameter 𝜖 sothat PPVs always have a provable estimation error guarantee.In our subset problem setting, we prove that the time and spacecomplexity are all linear to the number of edges𝑚 but indepen-dent on the number of nodes 𝑛, thus significantly improve theefficiency.
(3) Node classification results demonstrate the effectiveness and ef-ficiency of the proposed. We compile three large-scale datasetsto validate our method. As an application, we showcase thatlearned embeddings can be used to detect the changes of Chi-nese cities during this ongoing COVID-19 pandemic articles ona large-scale English Wikipedia.
The rest of this paper is organized as follows: In Section 2, wegive the overview of current dynamic embedding methods. Theproblem definition and preliminaries are in Section 3. We presentour proposed method in Section 4. Experimental results are reportedin Section 5. The discussion and conclusion will be presented in
Section 6. Our code and created datasets are accessible at https://github.com/zjlxgxz/DynamicPPE.
2 RELATEDWORK
There are two main categories of works for learning embeddingsfrom the dynamic graph structure data. The first type is focusingon capturing the evolution of dynamics of graph structure [49].The second type is focusing on both dynamics of graph structureand features lie in these graph data [38]. In this paper, we focuson the first type and give the overview of related works. Due tothe large mount of works in this area, some related works may notbe included, one can find more related works in a survey [22] andreferences therein.Dynamic latent spacemodels The dynamic embedding modelshad been initially explored by using latent space model [18]. Thedynamic latent space model of a network makes an assumptionthat each node is associated with an 𝑑-dimensional vector anddistance between two vectors should be small if there is an edgebetween these two nodes [32, 33]. Works of these assume that thedistance between two consecutive embeddings should be small. Theproposed dynamic models were applied to different applications[17, 34]. Their methods are not scalable from the fact that the timecomplexity of initial position estimation is at least O(𝑛2) even ifthe per-node update is log(𝑛).Incremental SVD and random walk based methods Zhanget al. [48] proposed TIMERS that is an incremental SVD-basedmethod. To prevent the error accumulation, TIMERS properly setthe restart time so that the accumulated error can be reduced.Nguyen et al. [28] proposed continuous-time dynamic network em-beddings, namely CTDNE. The key idea of CTNDE is that insteadof using general random walks as DeepWalk [29], it uses temporalrandom walks contain a sequence of edges in order. Similarly, thework of Du et al. [10] was also based on the idea of DeepWalk. Thesemethods have time complexity dependent on 𝑛 for per-snapshotupdate. Zhou et al. [49] proposed to learn dynamic embeddings bymodeling the triadic closure to capture the dynamics.Graph neural network methods Trivedi et al. [38] designed adynamic node representation model, namely DyRep, as modelinga latent mediation process where it leverages the changes of nodebetween the node’s social interactions and its neighborhoods. Morespecifically, DyRep contains a temporal attention layer to capturethe interactions of neighbors. Zang and Wang [44] proposed a neu-ral network model to learn embeddings by solving a differentialequation with ReLU as its activation function. [24] presents a dy-namic embedding, a recurrent neural network method, to learnthe interactions between users and items. However, these methodseither need to have features as input or cannot be applied to large-scale dynamic graph. Kumar et al. [24] proposed an algorithm tolearn the trajectory of the dynamic embedding for temporal inter-action networks. Since the learning task is different from ours, onecan find more details in their paper.
3 NOTATIONS AND PRELIMINARIES
Notations We use [𝑛] to denote a ground set [𝑛] := {0, 1, . . . , 𝑛−1}. The graph snapshot at time 𝑡 is denoted as G𝑡
(V𝑡 ,E𝑡
). The
degree of a node 𝑣 is 𝑑 (𝑣)𝑡 . In the rest of this paper, the average
degree at time 𝑡 is 𝑑𝑡 and the subset of target nodes is 𝑆 ⊆ V𝑡 . Boldcapitals, e.g. 𝑨,𝑾 are matrices and bold lower letters are vectors𝒘, 𝒙 . More specifically, the embedding vector for node 𝑣 at time𝑡 denoted as 𝒘𝑡
𝑣 ∈ R𝑑 and 𝑑 is the embedding dimension. The 𝑖-th entry of 𝒘𝑡
𝑣 is 𝑤𝑡𝑣 (𝑖) ∈ R. The embedding of node 𝑣 for all 𝑇
snapshots is written as 𝑾𝑣 = [𝒘1𝑣 ,𝒘
2𝑣 , . . . ,𝒘
𝑇𝑣 ]⊤. We use 𝑛𝑡 and 𝑚𝑡
as the number of nodes and edges in G𝑡 which we simply use 𝑛
and𝑚 if time 𝑡 is clear in the context.Given the graph snapshot G𝑡 and a specific node 𝑣 , the person-
alized PageRank vector (PPV) is an 𝑛-dimensional vector 𝝅𝑡𝑣 ∈ R𝑛
and the corresponding 𝑖-th entry is 𝜋𝑡𝑣 (𝑖). We use 𝒑𝑡𝑣 ∈ R𝑛 to standfor a calculated PPV obtained from a specific algorithm. Similarly,the corresponding 𝑖-th entry is 𝑝𝑡𝑣 (𝑖). The teleport probability of thePageRank is denoted as 𝛼 . The estimation error of an embedding vec-tor is the difference between true embedding𝒘𝑡
𝑣 and the estimatedembedding𝒘𝑡
𝑣 is measure by ∥ · ∥1 :=∑𝑛𝑖=1
��𝑤𝑡𝑣 (𝑖) −𝑤𝑡
𝑣 (𝑖)��.
3.1 Dynamic graph model and its embedding
Given any initial graph (could be an empty graph), the correspond-ing dynamic graph model describes how the graph structure evolvesover time. We first define the dynamic graph model, which is basedon Kazemi and Goel [22].
Definition 1 (Simple dynamic graph model [22]). A simple dy-
namic graph model is defined as an ordered of snapshots G0,G1,
G2, . . . ,G𝑇 where G0is the initial graph. The difference of graph
G𝑡 at time 𝑡 = 1, 2, . . . ,𝑇 is Δ𝐺𝑡 (ΔV𝑡 ,ΔE𝑡 ) := 𝐺𝑡\𝐺𝑡−1with
ΔV𝑡 := V𝑡\V𝑡−1 and ΔE𝑡 := E𝑡\E𝑡−1. Equivalently, ΔG𝑡 corre-
sponds to a sequence of edge events as the following
ΔG𝑡 ={𝑒𝑡1, 𝑒
𝑡2, . . . , 𝑒
𝑡𝑚′
}, (1)
where each edge event 𝑒𝑡𝑖has two types: insertion or deletion, i.e,
𝑒𝑡𝑖= (𝑢, 𝑣, event) where event ∈ {Insert,Delete} 3
.
The above model captures evolution of a real-world graph nat-urally where the structure evolution can be treated as a sequenceof edge events occurred in this graph. To simplify our analysis, weassume that the graph is undirected. Based on this, we define thesubset dynamic representation problem as the following.
1 and a subset of target nodes 𝑆 = {𝑣1, 𝑣2, . . . , 𝑣𝑘 }, the subset dynamic
network embedding problem is to learn dynamic embeddings of 𝑇
snapshots for all 𝑘 nodes 𝑆 where 𝑘 ≪ 𝑛. That is, given any node
𝑣 ∈ 𝑆 , the goal is to learn embedding matrix for each node 𝑣 ∈ 𝑆 , i.e.
𝑾𝑣 := [𝒘1𝑣 ,𝒘
2𝑣 , . . . ,𝒘
𝑇𝑣 ]⊤ where𝒘𝑡
𝑣 ∈ R𝑑 and 𝑣 ∈ 𝑆. (2)
3.2 Personalized PageRank
Given any node 𝑣 at time 𝑡 , the personalized PageRank vector forgraph G𝑡 is defined as the following
Definition 3 (Personalized PageRank (PPR)). Given normalized
adjacency matrix𝑾𝑡 = 𝑫−1𝑡 𝑨𝑡 where 𝑫𝑡 is a diagonal matrix with
𝐷𝑡 (𝑖, 𝑖) = 𝑑 (𝑖)𝑡 and 𝑨𝑡 is the adjacency matrix, the PageRank vector
3The node insertion can be treated as inserting a new edge and then delete it and nodedeletion is a sequence of deleting its edges.
𝝅𝑡𝑠 with respect to a source node 𝑠 is the solution of the following
equation
𝝅𝑡𝑠 = 𝛼 ∗ 1𝑠 + (1 − 𝛼)𝝅𝑡
𝑠𝑾𝑡 , (3)
where 1𝑠 is the unit vector with 1𝑠 (𝑣) = 1 when 𝑣 = 𝑠 , 0 otherwise.
There are several works on computing PPVs for static graph[1, 2, 5]. The idea is based a local push operation proposed in [2].Interestingly, Zhang et al. [45] extends this idea and proposes anovel updating strategy for calculating dynamic PPVs. We use amodified version of it as presented in Algorithm 1.
Algorithm 1 is a generalization from Andersen et al. [2] and thereare several variants of forward push [2, 5, 26], which are dependenton how 𝛽 is chosen (we assume 𝛽 = 0). The essential idea of forwardpush is that, at each Push step, the frontier node𝑢 transforms her 𝛼residual probability 𝑟𝑠 (𝑢) into estimation probability 𝑝𝑠 (𝑢) and thenpushes the rest residual to its neighbors. The algorithm repeats thispush operation until all residuals are small enough 4. Methods basedon local push operations have the following invariant property.
Lemma 4 (Invariant property [19]). ForwardPush has the follow-
ing invariant property
𝜋𝑠 (𝑢) = 𝑝𝑠 (𝑢) +∑︁𝑣∈𝑉
𝑟𝑠 (𝑣)𝜋𝑣 (𝑢),∀𝑢 ∈ V. (4)
The local push algorithm can guarantee that the each entry ofthe estimation vector 𝑝𝑠 (𝑣) is very close to the true value 𝜋𝑠 (𝑣).We state this property as in the following
Lemma 5 ([2, 45]). Given any graph G(V,E) with 𝒑𝑠 = 0, 𝒓𝑠 = 1𝑠and a constant 𝜖 , the run time for ForwardLocalPush is at most
1−∥𝒓𝑠 ∥1𝛼𝜖 and the estimation error of 𝜋𝑠 (𝑣) for each node 𝑣 is at most
𝜖 , i.e. |𝑝𝑠 (𝑣) − 𝜋𝑠 (𝑣) |/𝑑 (𝑣) | ≤ 𝜖
The main challenge to directly use forward push algorithm toobtain high quality PPVs in our setting is that: 1) the quality 𝒑𝑠return by forward push algorithm will critically depend on theprecision parameter 𝜖 which unfortunately is unknown under ourdynamic problem setting. Furthermore, the original update of per-edge event strategy proposed in [45] is not suitable for batch update4There are two implementation of forward push depends on how frontier is selected.One is to use a first-in-first-out (FIFO) queue [11] to maintain the frontiers while theother one maintains nodes using a priority queue is used [5] so that the operation costis O(1/𝜖𝛼) instead of O(log𝑛/𝜖𝛼) .
between graph snapshots. Guo et al. [13] propose to use a batchstrategy, which is more practical in real-world scenario where thereis a sequence of edge events between two consecutive snapshots.This motivates us to develop a new algorithm for dynamic PPVsand then use these PPVs to obtain high quality dynamic embeddingvectors.
4 PROPOSED METHOD
To obtain dynamic embedding vectors, the general idea is to obtaindynamic PPVs and then project these PPVs into embedding spaceby using two kernel functions [30, 42]. In this section, we presentour proposed method DynamicPPE where it contains two maincomponents: 1) an adaptive precision strategy to control the esti-mation error of PPVs. We then prove that the time complexity ofthis dynamic strategy is still independent on 𝑛. With this qualityguarantee, learned PPVs will be used as proximity vectors and be"projected" into lower dimensional space based on ideas of Verse[39] and InstantEmbedding [30]. We first show how can we get highquality PPVs and then present how use PPVs to obtain dynamicembeddings. Finally, we give the complexity analysis.
4.1 Dynamic graph embedding for single batch
For each batch update Δ𝐺𝑡 , the key idea is to dynamically maintainPPVs where the algorithm updates the estimate from𝒑𝑡−1𝑣 to𝒑𝑡𝑣 andits residuals from 𝒓𝑡−1𝑣 to 𝒓𝑡𝑣 . Our method is inspired from Guo et al.[13] where they proposed to update a personalized contributionvector by using the local reverse push 5. The proposed dynamicsingle node embedding, DynamicSNE is illustrated in Algorithm 2.It takes an update batch ΔG𝑡 (a sequence of edge events), a targetnode 𝑠 with a precision 𝜖𝑡 , estimation vector of 𝑠 and residual vectoras inputs. It then obtains an updated embedding vector of 𝑠 by thefollowing three steps: 1) It first updates the estimate vector𝒑𝑡𝑠 and 𝒓𝑡𝑠from Line 2 to Line 9; 2) It then calls the forward local push methodto obtain the updated estimations, 𝒑𝑡𝑠 ; 3) We then use the hashkernel projection step to get an updated embedding. This projectionstep is from InstantEmbedding where two universal hash functionsare defined as ℎ𝑑 : N→ [𝑑] and ℎsgn : N→ {±1} 6. Then the hashkernel based on these two hash functions is defined as𝐻ℎsgn,ℎ𝑑 (𝒙) :R𝑛 → R𝑑 where each entity 𝑖 is
∑𝑗 ∈ℎ−1
𝑑(𝑖) 𝑥 𝑗ℎsgn ( 𝑗). Different
from random projection used in RandNE [47] and FastRP [6], hashfunctions has O(1) memory cost while random projection basedmethod has O(𝑑𝑛) if the Gaussian matrix is used. Furthermore,hash kernel keeps unbiased estimator for the inner product [42].
In the rest of this section, we show that the time complexityis O(𝑚𝑑/𝜖) in average and the estimation error of learned PPVsmeasure by ∥ · ∥1 can also be bounded. Our proof is based on thefollowing lemma which follows from Guo et al. [13], Zhang et al.[45].
Lemma 6. Given current graph G𝑡 and an update batch ΔG𝑡 , thetotal run time of the dynamic single node embedding, DynamicSNE
5One should notice that, for undirected graph, PPVs can be calculated by using theinvariant property from the contribution vectors. However, the invariant propertydoes not hold for directed graph. It means that one cannot use reverse local push to geta personalized PageRank vector directly. In this sense, using forward push algorithmis more general for our problem setting.6For example, in our implementation, we use MurmurHash https://github.com/aappleby/smhasher
for obtaining embedding𝒘𝑡𝑠 is bounded by the following
𝑇𝑡 ≤∥𝒓𝑡−1𝑠 ∥1 − ∥𝒓𝑡𝑠 ∥1
𝛼𝜖𝑡+
∑︁𝑢∈ΔG𝑡
2 − 𝛼𝛼
𝑝𝑡−1𝑠 (𝑢)𝑑 (𝑢) (5)
Proof. We first make an assumption that there is only one edgeupdate (𝑢, 𝑣, event) in ΔG𝑡 , then based Lemma 14 of [46], the runtime of per-edge update is at most:
∥𝒓𝑡−1𝑠 ∥1 − ∥𝒓𝑡−1𝑠 ∥1𝛼𝜖𝑡
+ Δ𝑡 (𝑠)𝛼𝜖𝑡
, (6)
where Δ𝑡 (𝑠) = 2−𝛼𝛼
𝑝𝑡−1𝑠 (𝑢)𝑑 (𝑢) . Suppose there are 𝑘 edge events in
ΔG𝑡 . We still obtain a similar bound, by the fact that forward pushalgorithm has monotonicity property: the entries of estimates 𝑝𝑡𝑠 (𝑣)only increase when it pushes positive residuals (Line 2 and 3 of Al-gorithm 1). Similarly, estimates 𝑝𝑡𝑠 (𝑣) only decrease when it pushesnegative residuals (Line 4 and 5 of Algorithm 1). In other words, theamount of work for per-edge update is not less than the amount ofwork for per-batch update. Similar idea is also used in [13]. □
Theorem 7. Given any graph snapshot G𝑡 and an update batch Δ𝐺𝑡
where there are𝑚𝑡 edge events and suppose the precision parameter
is 𝜖𝑡 and teleport probability is 𝛼 , DynamicSNE runs in O(𝑚𝑡/𝛼2 +𝑚𝑡𝑑
𝑡/(𝜖𝛼2) +𝑚𝑡/(𝜖𝛼)) with 𝜖𝑡 = 𝜖/𝑚𝑡
Proof. Based lemma 6, the proof directly follows from Theorem12 of [46]. □
The above theorem has an important difference from the pre-vious one [45]. We require that the precision parameter will besmall enough so that ∥𝒑𝑡𝑠 − 𝝅𝑡
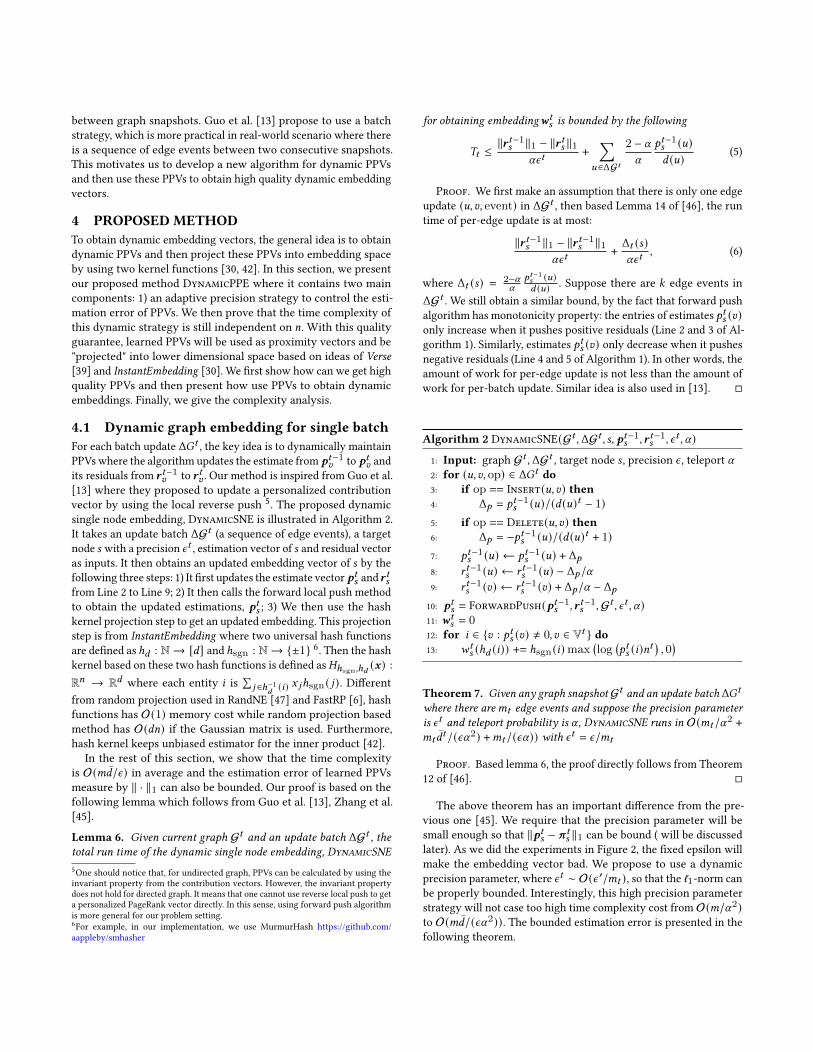
𝑠 ∥1 can be bound ( will be discussedlater). As we did the experiments in Figure 2, the fixed epsilon willmake the embedding vector bad. We propose to use a dynamicprecision parameter, where 𝜖𝑡 ∼ O(𝜖 ′/𝑚𝑡 ), so that the ℓ1-norm canbe properly bounded. Interestingly, this high precision parameterstrategy will not case too high time complexity cost from O(𝑚/𝛼2)to O(𝑚𝑑/(𝜖𝛼2)). The bounded estimation error is presented in thefollowing theorem.
Theorem 8 (Estimation error). Given any node 𝑠 , define the estima-
tion error of PPVs learned from DynamicSNE at time 𝑡 as ∥𝒑𝑡𝑠 −𝝅𝑡𝑠 ∥1,
if we are given the precision parameter 𝜖𝑡 = 𝜖/𝑚𝑡 , the estimation
error can be bounded by the following
∥𝒑𝑡𝑠 − 𝝅𝑡𝑠 ∥1 ≤ 𝜖, (7)
where we require 𝜖 ≤ 2 7and 𝜖 is a global precision parameter of
DynamicPPE independent on𝑚𝑡 and 𝑛𝑡 .
Proof. Notice that for any node 𝑢, by Lemma 5, we have thefollowing inequality
|𝜋𝑡𝑠 (𝑢) − 𝜋𝑡𝑠 (𝑢) | ≤ 𝜖𝑑𝑡 (𝑢) .
Summing all these inequalities over all nodes 𝑢, we have
∥𝒑𝑡𝑠 − 𝝅𝑡𝑠 ∥1 =
∑︁𝑢∈V𝑡
��𝑝𝑡𝑠 (𝑢) − 𝜋𝑡𝑠 (𝑢)��≤
∑︁𝑢∈V𝑡
𝜖𝑡𝑑𝑡 (𝑢) = 𝜖𝑡𝑚𝑡 =𝜖
𝑚𝑡𝑚𝑡 = 𝜖.
□
01 03 05 07 09 11 13 15 17 19Year
0.2
0.3
0.4
0.5
0.6
Ma
cro
-F1
ε = 10−6
ε = 10−7
ε = 10−8
ε = 10−9
01 03 05 07 09 11 13 15 17 19Year
0.3
0.4
0.5
0.6
0.7
Mic
ro-F
1
ε = 10−6
ε = 10−7
ε = 10−8
ε = 10−9
Figure 2: 𝜖 as a function of year for the task of node clas-
sification on the English Wikipedia graph. Each line corre-
sponds to a fixed precision strategy of DynamicSNE. Clearly,
when the precision parameter 𝜖 decreases, the performance
of node classification improves.
The above theorem gives estimation error guarantee of𝒑𝑡𝑠 , whichis critically important for learning high quality embeddings. Firstof all, the dynamic precision strategy is inevitable because the pre-cision is unknown parameter for dynamic graph where the num-ber of nodes and edges could increase dramatically over time. Todemonstrate this issue, we conduct an experiments on the EnglishWikipedia graph where we learn embeddings over years and vali-date these embeddings by using node classification task. As shownin Figure 2, when we use the fixed parameter, the performanceof node classification is getting worse when the graph is gettingbigger. This is mainly due to the lower quality of PPVs. Fortunately,the adaptive precision parameter 𝜖/𝑚𝑡 does not make the run timeincrease dramatically. It only dependents on the average degree 𝑑𝑡 .In practice, we found 𝜖 = 0.1 are sufficient for learning effectiveembeddings.
7By noticing that ∥𝒑𝑡𝑠 − 𝝅𝑡𝑠 ∥1 ≤ ∥𝒑𝑡𝑠 ∥1 + ∥𝝅𝑡
𝑠 ∥1 ≤ 2, any precision parameterlarger than 2 will be meaningless.
4.2 DynamicPPE
Our finally algorithm DynamicPPE is presented in Algorithm 3.At every beginning, estimators 𝒑𝑡𝑠 are set to be zero vectors andresidual vectors 𝒓𝑡𝑠 are set to be unit vectors with mass all on oneentry (Line 4). The algorithm then call the procedure DynamicSNEwith an empty batch as input to get initial PPVs for all target nodes8 (Line 5). From Line 6 to Line 9, at each snapshot 𝑡 , it gets anupdate batch ΔG𝑡 at Line 7 and then calls DynamicSNE to obtainthe updated embeddings for every node 𝑣 .
Algorithm 3 DynamicPPE(G0, 𝑆, 𝜖, 𝛼)
1: Input: initial graphG0, target set 𝑆 , global precision 𝜖 , teleportprobability 𝛼
Based on our analysis, DynamicPPE is an dynamic version ofInstantEmbedding. Therefore, DynamicPPE has two key propertiesobserved in [30]: locality and global consistency. The embeddingquality is guaranteed from the fact that InstantEmbedding implicitlyfactorizes the proximity matrix based on PPVs [39].
4.3 Complexity analysis
Time complexity The overall time complexity of DynamicPPEis the 𝑘 times of the run time of DynamicSNE. We summarize thetime complexity of DynamicPPE as in the following theorem
Theorem 9. The time complexity of DynamicPPE for learning a
subset of 𝑘 nodes is O(𝑘𝑚𝑡
𝛼2 + 𝑘𝑚𝑡𝑑𝑡
𝛼2 + 𝑚𝑡
𝜖 + 𝑘𝑇 min{𝑛, 𝑚𝜖𝛼 })
Proof. We follow Theorem 7 and summarize all run time to-gether to get the final time complexity. □
Space complexity The overall space complexity has two parts:1) O(𝑚) to store the graph structure information; and 2) the storageof keeping nonzeros of 𝒑𝑡𝑠 and 𝒓𝑡𝑠 . From the fact that local push oper-ation [2], the number of nonzeros in𝒑𝑡𝑠 is at most 1
𝜖𝛼 . Thus, the totalstorage for saving these vectors are O(𝑘min{𝑛, 𝑚𝜖𝛼 }). Therefore,the total space complexity is O(𝑚 + 𝑘min(𝑛, 𝑚𝜖𝛼 )).Implementation Since learning the dynamic node embeddingfor any node 𝑣 is independent with each other, DynamicPPE is areeasy to parallel. Our current implementation can take advantage ofmulti-cores and compute the embeddings of 𝑆 in parallel.
8For the situation that some nodes of 𝑆 has not appeared in G𝑡 yet, it checks everybatch update until all nodes are initialized.
5 EXPERIMENTS
To demonstrate the effectiveness and efficiency of DynamicPPE,in this section, we first conduct experiments on several small andlarge scale real-world dynamic graphs on the task of node classifi-cation, followed by a case study about changes of Chinese cities inWikipedia graph during the COVID-19 pandemic.
5.1 Datasets
We compile the following three real-world dynamic graphs, moredetails can be found in Appendix C.Enwiki20 English Wikipedia Network We collect the internalWikipedia Links (WikiLinks) of English Wikipedia from the begin-ning of Wikipedia, January 11th, 2001, to December 31, 2020 9. Theinternal links are extracted using a regular expression proposed in[8]. During the entire period, we collection 6,151,779 valid articles10.We generated the WikiLink graphs only containing edge insertionevents. We keep all the edges existing before Dec. 31 2020, and sortthe edge insertion order by the creation time. There are 6,216,199nodes and 177,862,656 edges during the entire period. Each nodeeither has one label (Food, Person, Place,...) or no label.Patent (US Patent Graph) The citation network of US patent[14]contains 2,738,011 nodes with 13,960,811 citations range from year1963 to 1999. For any two patents 𝑢 and 𝑣 , there is an edge (𝑢, 𝑣)if the patent 𝑢 cites patent 𝑣 . Each patent belongs to six differenttypes of patent categories. We extract a small weakly-connectedcomponent of 46,753 nodes and 425,732 edges with timestamp,called Patent-small.Coauthor We extracted the co-authorship network from theMicrosoft Academic Graph [35] dumped on September 21, 2019. Wecollect the papers with less than six coauthors, keeping those whohas more than 10 publications, then build undirected edges betweeneach coauthor with a timestamp of the publication date. In addition,we gather temporal label (e.g.: Computer Science, Art, ... ) of authorsbased on their publication’s field of study. Specifically we assignthe label of an author to be the field of study where s/he publishedthe most up to that date. The original graph contains 4,894,639authors and 26,894,397 edges ranging from year 1800 to 2019. Wealso sampled a small connected component containing 49,767 nodesand 755,446 edges with timestamp, called Coauthor-small.Academic The co-authorship network is from the academic net-work [36, 49] where it contains 51,060 nodes and 794,552 edges.The nodes are generated from 1980 to 2015. According to the nodeclassification setting in Zhou et al. [49], each node has either onebinary label or no label.
5.2 Node Classification Task
Experimental settings We evaluate embedding quality on bi-nary classification for Academic graph (as same as in [49]), whileusing multi-class classification for other tasks. We use balancedlogistic regression with ℓ2 penalty in on-vs-rest setting, and reportthe Macro-F1 and Macro-AUC (ROC) from 5 repeated trials with10% training ratio on the labeled nodes in each snapshot, excludingdangling nodes. Between each snapshot, we insert new edges andkeep the previous edges.9We collect the data from the dump https://dumps.wikimedia.org/enwiki/20210101/10A valid Wikipedia article must be in the 0 namespace
We conduct the experiments on the aforementioned small andlarge scale graph. In small scale graphs, we calculate the embed-dings of all nodes and compare our proposed method (DynPPE.)against other state-of-the-art models from three categories11. 1)Random walk based static graph embeddings (Deepwalk
12 [29],Node2Vec
13 [12]); 2) Random Projection-based embedding methodwhich supports online update: RandNE14 [47]; 3) Dynamic graphembedding method: DynamicTriad (DynTri.) 15 [49] which mod-els the dynamics of the graph and optimized on link prediction.
Table 1: Node classification task on the Academic, PatentSmall, Coauthor Small graph on the final snapshot
Academic Patent Small Coauthor SmallF1 AUC F1 AUC F1 AUC
Table 1 shows the classification results on the final snapshot.When we restrict the dimension to be 128, we observe that staticmethods outperform all dynamic methods. However, the staticmethods independently model each snapshot and the running timegrows with number of snapshots, regardless of the number of edgechanges. In addition, our proposed method (DynPPE.) outperformsother dynamic baselines, except that in the academic graph, whereDynTri. is slightly better. However, their CPU time is 13 times11Appendix D shows the hyper-parameter settings of baseline methods12https://pypi.org/project/deepwalk/13https://github.com/aditya-grover/node2vec14https://github.com/ZW-ZHANG/RandNE/tree/master/Python15https://github.com/luckiezhou/DynamicTriad16We ran static graph embedding methods over a set of sampled snapshots and estimatethe total CPU time for all snapshots.
Figure 3: Macro-F1 scores of node classification as a function of time. The results of the small and large graphs are on the first
and second row respectively (dim=512). Our proposed methods achieves the best performance on the last snapshot when all
edges arrived and performance curve matches to the static methods as the graph becomes more and more complete.
more than ours as shown in Table 2. According to the Johnson-Lindenstrauss lemma[9, 21], we suspect that the poor result ofRandNE is partially caused by the dimension size. As we increasethe dimension to 512, we see a great performance improvementof RandNE. Also, our proposed method takes the same advantage,and outperform all others baselines in F1-score. Specifically, theincrease of dimension makes hash projection step (Line 12-13 inAlgorithm 2) retain more information and yield better embeddings.We attach the visualization of embeddings in Appendix.E.
The first row in the Figure 3 shows the F1-scores in each snap-shot when the dimension is 512. We observe that in the earliersnapshots where many edges are not arrived, the performance ofDynamicTriad [49] is better. One possible reason is that it modelsthe dynamics of the graph, thus the node feature is more robustto the "missing" of the future links. While other methods, includ-ing ours, focus on an online feature updates incurred by the edgechanges without explicitly modeling the temporal dynamics of agraph. Meanwhile, the performance curve of our method matchesto the static methods, demonstrating the embedding quality of theintermediate snapshots is comparable to the state-of-the-art.
Table 2 shows the CPU time of each method (Dim=512). Aswe expected, static methods is very expensive as they calculateembeddings for each snapshot individually. Although our methodis not blazingly fast compared to RandNE, it has a good trade-offbetween running time and embedding quality, especially withoutmuch hyper-parameter tuning. Most importantly, it can be easilyparallelized by distributing the calculation of each node to clusters.
We also conduct experiment on large scale graphs (EnWiki20,
Patent, Coauthor). We keep track of the vertices in a subset contain-ing |𝑆 | = 3, 000 nodes randomly selected from the first snapshot ineach dataset, and similarly evaluate the quality of the embeddingsof each snapshot on the node classification task. Due to scale of thegraph, we compare our method against RandNE [47] and an fastheuristic Algorithm 4. Our method can calculate the embeddingsfor a subset of useful nodes only, while other methods have to cal-culate the embeddings of all nodes, which is not necessary under
our scenario detailed in Sec. 5.3. The second row in Figure 3 showsthat our proposed method has the best performance.
Table 3: Total CPU time for large graphs (in second)
Table 3 shows the total CPU time of each method (Dim=512).Although total CPU time of our proposed method seems to be thegreatest, the average CPU time for one node (as shown in row 4) issignificantly smaller. This benefits a lot of downstream applicationswhere only a subset of nodes are interesting to people in a largedynamic graph. For example, if we want to monitor the weeklyembedding changes of a single node (e.g., the city of Wuhan, China)in English Wikipedia network from year 2020 to 2021, we canhave the results in roughly 8.5 minutes. Meanwhile, other baselineshave to calculate the embeddings of all nodes, and this expensivecalculation may become the bottleneck in a downstream applicationwith real-time constraints. To demonstrate the usefulness of ourmethod, we conduct a case study in the following subsection.
5.3 Change Detection
Thanks to the contributors timely maintaining Wikipedia, we be-lieve that the evolution of the Wikipedia graph reflects how thereal world is going on. We assume that when the structure of anode greatly changes, there must be underlying interesting eventsor anomalies. Since the structural changes can be well-capturedby graph embedding, we use our proposed method to investi-gate whether anomalies happened to the Chinese cities duringthe COVID-19 pandemic (from Jan. 2020 to Dec. 2020).Changes of major Chinese Cities We target nine Chinese ma-jor cities (Shanghai, Guangzhou, Nanjing, Beijing, Tianjin, Wuhan,Shenzhen, Chengdu, Chongqing) and keep track of the embeddings
Table 4: The top cities ranked by the z-score along time. The corresponding news titles are from the news in each time period.
𝑑 (𝑣) is node degree, Δ𝑑 (𝑣) is the degree changes from the previous timestamp.
Date City 𝑑 (𝑣) Δ𝑑 (𝑣) Z-score Top News Title1/22/20 Wuhan 2890 54 2.210 NBC: "New virus prompts U.S. to screen passengers from Wuhan, China"2/2/20 Wuhan 2937 47 1.928 WSJ: "U.S. Sets Evacuation Plan From Coronavirus-Infected Wuhan"2/13/20 Hohhot 631 20 1.370 Poeple.cn: "26 people in Hohhot were notified of dereliction of duty for prevention and control, and the
director of the Health Commission was removed" (Translated from Chinese).2/24/20 Wuhan 3012 38 2.063 USA Today: "Coronavirus 20 times more lethal than the flu? Death toll passes 2,000"3/6/20 Wuhan 3095 83 1.723 Reuters: "Infelctions may drop to zero by end-March in Wuhan: Chinese government expert"3/17/20 Wuhan 3173 78 1.690 NYT: "Politicians Use of ’Wuhan Virus’ Starts a Debate Health Experets Wanted to Avoid"3/28/20 Zhangjiakou 517 15 1.217 "Logo revealed for Freestyle Ski and Snowboard World Championships in Zhangjiakou"4/8/20 Wuhan 3314 47 2.118 CNN:"China lifts 76-day lockdown on Wuhan as city reemerges from conronavirus crisis"4/19/20 Luohe 106 15 2.640 Forbes: "The Chinese Billionaire Whose Company Owns Troubled Pork Processor Smithfield Foods"4/30/20 Zunhua 52 17 2.449 XINHUA: "Export companies resume production in Zunhua, Hebei"5/11/20 Shulan 88 46 2.449 CGTN: "NE China’s Shulan City to reimpose community lockdown in ’wartime’ battle against COVID-19"
in a 10-day time window. From our prior knowledge, we expectthat Wuhan should greatly change since it is the first reported placeof the COVID-19 outbreak in early Jan. 2020.
1/11/203/6/20
4/30/206/24/20
8/18/2010/12/20
12/6/200
20
40
60
80
Degr
ee C
hang
es
WuhanChengdu
Figure 4: The changes of major Chinese cities in 2020.
Left:Changes in Node Degree. Right: Changes in Cosine dis-
tance
Figure.4(a) shows the node degree changes of each city every 10days. The curve is quite noisy, but we can still see several majorpeaks from Wuhan around 3/6/20 and Chengdu around 8/18/20.When using embedding changes 17 as the measurement, Figure.4(b) provides a more clear view of the changed cities. We observestrong signals from the curve of Wuhan, correlating to the initialCOVID-19 outbreak and the declaration of pandemic 18. In addition,we observed an peak from the curve of Chengdu around 8/18/20when U.S. closed the consulate in Chengdu, China, reflecting theU.S.-China diplomatic tension19.Top changed city along time We keep track of the embeddingmovement of 533 Chinese cities from year 2020 to 2021 in a 10-day time window, and filter out the inactive records by setting thethreshold of degree changes (e.g. greater than 10). The final resultsare 51 Chinese cities from the major ones listed above and lessfamous cities like Zhangjiakou, Hohhot, Shulan, ....
Furthermore, we define the z-score of a target node 𝑢 as 𝑍𝑡 (𝑢)based on the embedding changes within a specific period of time
17Again, the embedding movement Dist( ·, ·) is defined as 1 − cos( ·, ·)18COIVD-19: https://www.who.int/news/item/27-04-2020-who-timeline---covid-1919US Consulate: https://china.usembassy-china.org.cn/embassy-consulates/chengdu/
from 𝑡 − 1 to 𝑡 .
𝑍𝑡 (𝑢 |𝑢 ∈ 𝑆) =𝐷𝑖𝑠𝑡 (𝑤𝑡
𝑢 ,𝑤𝑡−1𝑢 ) − `
𝜎
` =1
|𝑆 |∑︁𝑢′∈𝑆
𝐷𝑖𝑠𝑡 (𝑤𝑡𝑢′,𝑤
𝑡−1𝑢′ ), 𝜎 =
√︄1
|𝑆 |∑︁𝑢′∈𝑆(𝐷𝑖𝑠𝑡 (𝑤𝑡
𝑢′𝑤𝑡−1𝑢′ ) − `)2
In Table 4, we list the highest ranked cities by the z-score fromJan.22 to May 11, 2020. In addition, we also attach the top newstitles corresponding to the city within each specific time period.We found that Wuhan generally appears more frequently as thesituation of the pandemic kept changing. Meanwhile, we found theappearance of Hohhot and Shulan reflects the time when COVID-19outbreak happened in those cities. We also discovered cities unre-lated to the pandemic. For example, Luohe, on 4/19/20, turns outto be the city where the headquarter of the organization whichacquired Smithfield Foods (as mentioned in the news). In addition,Zhangjiakou, on 3/28/20, is the city, which will host World Snow-board competition, released the Logo of that competition.
6 DISCUSSION AND CONCLUSION
In this paper, we propose a new method to learn dynamic nodeembeddings over large-scale dynamic networks for a subset ofinteresting nodes. Our proposed method has time complexity thatis linear-dependent on the number of edges 𝑚 but independenton the number of nodes 𝑛. This makes our method applicable toapplications of subset representations on very large-scale dynamicgraphs. For the future work, as shown in Trivedi et al. [38], thereare two dynamics on dynamic graph data, structure evolution anddynamics of node interaction. It would be interesting to study howone can incorporate dynamic of node interaction into our model. Itis also worth to study how different version of local push operationaffect the performance of our method.
ACKNOWLEDGMENTS
This work was partially supported by NSF grants IIS-1926781, IIS-1927227, IIS-1546113 and OAC-1919752.
[1] Reid Andersen, Christian Borgs, Jennifer Chayes, John Hopcraft, Vahab S Mir-rokni, and Shang-Hua Teng. 2007. Local computation of PageRank contributions.In International Workshop on Algorithms and Models for the Web-Graph. Springer,150–165.
[2] Reid Andersen, Fan Chung, and Kevin Lang. 2006. Local graph partitioningusing pagerank vectors. In 2006 47th Annual IEEE Symposium on Foundations of
Computer Science (FOCS’06). IEEE, 475–486.[3] Reid Andersen, Fan Chung, and Kevin Lang. 2007. Using pagerank to locally
partition a graph. Internet Mathematics 4, 1 (2007), 35–64.[4] Tanya Y Berger-Wolf and Jared Saia. 2006. A framework for analysis of dynamic
social networks. In Proceedings of the 12th ACM SIGKDD international conference
on Knowledge discovery and data mining. 523–528.[5] Pavel Berkhin. 2006. Bookmark-coloring algorithm for personalized pagerank
computing. Internet Mathematics 3, 1 (2006), 41–62.[6] Haochen Chen, Syed Fahad Sultan, Yingtao Tian, Muhao Chen, and Steven
Skiena. 2019. Fast and Accurate Network Embeddings via Very Sparse RandomProjection. In Proceedings of the 28th ACM International Conference on Information
and Knowledge Management. 399–408.[7] Colin B Clement, Matthew Bierbaum, Kevin P O’Keeffe, and Alexander A Alemi.
2019. On the Use of ArXiv as a Dataset. arXiv preprint arXiv:1905.00075 (2019).[8] Cristian Consonni, David Laniado, and Alberto Montresor. 2019. WikiLinkGraphs:
A complete, longitudinal and multi-language dataset of the Wikipedia link net-works. In Proceedings of the International AAAI Conference on Web and Social
Media, Vol. 13. 598–607.[9] Sanjoy Dasgupta and Anupam Gupta. 1999. An elementary proof of the Johnson-
Lindenstrauss lemma. International Computer Science Institute, Technical Report
22, 1 (1999), 1–5.[10] Lun Du, Yun Wang, Guojie Song, Zhicong Lu, and Junshan Wang. 2018. Dynamic
Network Embedding: An Extended Approach for Skip-gram based NetworkEmbedding.. In IJCAI, Vol. 2018. 2086–2092.
[11] David F Gleich. 2015. PageRank beyond the Web. Siam Review 57, 3 (2015),321–363.
[12] Aditya Grover and Jure Leskovec. 2016. node2vec: Scalable feature learning fornetworks. In Proceedings of the 22nd ACM SIGKDD international conference on
Knowledge discovery and data mining. 855–864.[13] Wentian Guo, Yuchen Li, Mo Sha, and Kian-Lee Tan. 2017. Parallel personalized
pagerank on dynamic graphs. Proceedings of the VLDB Endowment 11, 1 (2017),93–106.
[14] Bronwyn H Hall, Adam B Jaffe, and Manuel Trajtenberg. 2001. The NBER patent
citation data file: Lessons, insights and methodological tools. Technical Report.National Bureau of Economic Research.
[15] Will Hamilton, Zhitao Ying, and Jure Leskovec. 2017. Inductive representationlearning on large graphs. In Advances in neural information processing systems.1024–1034.
[16] William L Hamilton, Rex Ying, and Jure Leskovec. 2017. Representation learningon graphs: Methods and applications. arXiv preprint arXiv:1709.05584 (2017).
[17] Peter Hoff. 2007. Modeling homophily and stochastic equivalence in symmetricrelational data. Advances in neural information processing systems 20 (2007),657–664.
[18] Peter D Hoff, Adrian E Raftery, and Mark S Handcock. 2002. Latent space ap-proaches to social network analysis. Journal of the american Statistical association
97, 460 (2002), 1090–1098.[19] Sungryong Hong, Bruno C Coutinho, Arjun Dey, Albert-L Barabási, Mark Vo-
gelsberger, Lars Hernquist, and Karl Gebhardt. 2016. Discriminating topologyin galaxy distributions using network analysis. Monthly Notices of the Royal
Astronomical Society 459, 3 (2016), 2690–2700.[20] Guoliang Ji, Shizhu He, Liheng Xu, Kang Liu, and Jun Zhao. 2015. Knowledge
graph embedding via dynamic mapping matrix. In Proceedings of the 53rd annual
meeting of the association for computational linguistics and the 7th international
joint conference on natural language processing (volume 1: Long papers). 687–696.[21] William B Johnson and Joram Lindenstrauss. 1984. Extensions of Lipschitz
mappings into a Hilbert space. Contemporary mathematics 26, 189-206 (1984), 1.[22] Seyed Mehran Kazemi and Rishab Goel. 2020. Representation Learning for
Dynamic Graphs: A Survey. Journal of Machine Learning Research 21, 70 (2020),1–73.
[23] Thomas N. Kipf and Max Welling. 2017. Semi-Supervised Classification withGraph Convolutional Networks. In International Conference on Learning Repre-
bedding trajectory in temporal interaction networks. In Proceedings of the 25th
ACM SIGKDD International Conference on Knowledge Discovery & Data Mining.1269–1278.
[25] TG Lei, CW Woo, JZ Liu, and F Zhang. 2003. On the Schur complements ofdiagonally dominant matrices.
[26] Peter Lofgren. 2015. Efficient Algorithms for Personalized PageRank. Ph.D. Disser-tation. Stanford University.
[27] Peter Lofgren, Siddhartha Banerjee, and Ashish Goel. 2015. Bidirectional PageR-ank Estimation: From Average-Case to Worst-Case. In Proceedings of the 12th
International Workshop on Algorithms and Models for the Web Graph-Volume 9479.164–176.
[28] Giang Hoang Nguyen, John Boaz Lee, Ryan A Rossi, Nesreen K Ahmed, EunyeeKoh, and Sungchul Kim. 2018. Continuous-time dynamic network embeddings.In Companion Proceedings of the The Web Conference 2018. 969–976.
[29] Bryan Perozzi, Rami Al-Rfou, and Steven Skiena. 2014. Deepwalk: Online learningof social representations. In Proceedings of the 20th ACM SIGKDD international
conference on Knowledge discovery and data mining. 701–710.[30] Ştefan Postăvaru, Anton Tsitsulin, Filipe Miguel Gonçalves de Almeida, Yingtao
[31] Ryan A Rossi, Brian Gallagher, Jennifer Neville, and Keith Henderson. 2013.Modeling dynamic behavior in large evolving graphs. In Proceedings of the sixth
ACM international conference on Web search and data mining. 667–676.[32] Purnamrita Sarkar and Andrew W Moore. 2005. Dynamic social network analysis
using latent space models. Acm Sigkdd Explorations Newsletter 7, 2 (2005), 31–40.[33] Purnamrita Sarkar and Andrew W Moore. 2005. Dynamic social network analysis
using latent space models. In Proceedings of the 18th International Conference on
Neural Information Processing Systems. 1145–1152.[34] Purnamrita Sarkar, Sajid M Siddiqi, and Geogrey J Gordon. 2007. A latent space
approach to dynamic embedding of co-occurrence data. In Artificial Intelligence
and Statistics. 420–427.[35] Arnab Sinha, Zhihong Shen, Yang Song, Hao Ma, Darrin Eide, Bo-June Hsu, and
Kuansan Wang. 2015. An overview of microsoft academic service (mas) andapplications. In Proceedings of the 24th international conference on world wide web.243–246.
[36] Jie Tang, Jing Zhang, Limin Yao, Juanzi Li, Li Zhang, and Zhong Su. 2008. Ar-netminer: extraction and mining of academic social networks. In Proceedings of
the 14th ACM SIGKDD international conference on Knowledge discovery and data
2019. DyRep: Learning Representations over Dynamic Graphs. In International
Conference on Learning Representations.[38] Rakshit Trivedi, Mehrdad Farajtabar, Prasenjeet Biswal, and Hongyuan Zha.
2019. DyRep: Learning Representations over Dynamic Graphs. In International
Conference on Learning Representations.[39] Anton Tsitsulin, Davide Mottin, Panagiotis Karras, and Emmanuel Müller. 2018.
Verse: Versatile graph embeddings from similarity measures. In Proceedings of
the 2018 World Wide Web Conference. 539–548.[40] Laurens Van der Maaten and Geoffrey Hinton. 2008. Visualizing data using t-SNE.
Journal of machine learning research 9, 11 (2008).[41] Ulrike Von Luxburg, Agnes Radl, and Matthias Hein. 2014. Hitting and commute
times in large random neighborhood graphs. The Journal of Machine Learning
Research 15, 1 (2014), 1751–1798.[42] Kilian Weinberger, Anirban Dasgupta, John Langford, Alex Smola, and Josh
Attenberg. 2009. Feature hashing for large scale multitask learning. In Proceedings
of the 26th annual international conference on machine learning. 1113–1120.[43] Rex Ying, Ruining He, Kaifeng Chen, Pong Eksombatchai, William L Hamilton,
and Jure Leskovec. 2018. Graph convolutional neural networks for web-scalerecommender systems. In Proceedings of the 24th ACM SIGKDD International
Conference on Knowledge Discovery & Data Mining. 974–983.[44] Chengxi Zang and Fei Wang. 2020. Neural dynamics on complex networks.
In Proceedings of the 26th ACM SIGKDD International Conference on Knowledge
Discovery & Data Mining. 892–902.[45] Hongyang Zhang, Peter Lofgren, and Ashish Goel. 2016. Approximate person-
alized pagerank on dynamic graphs. In Proceedings of the 22nd ACM SIGKDD
International Conference on Knowledge Discovery and Data Mining. 1315–1324.[46] Hongyang Zhang, Peter Lofgren, and Ashish Goel. 2016. Approximate Personal-
scale network embedding with iterative random projection. In 2018 IEEE Interna-
tional Conference on Data Mining (ICDM). IEEE, 787–796.[48] Ziwei Zhang, Peng Cui, Jian Pei, Xiao Wang, and Wenwu Zhu. 2018. TIMERS:
Error-Bounded SVD Restart on Dynamic Networks. In Proceedings of the 32nd
AAAI Conference on Artificial Intelligence. AAAI.[49] Lekui Zhou, Yang Yang, Xiang Ren, Fei Wu, and Yueting Zhuang. 2018. Dynamic
network embedding by modeling triadic closure process. In Proceedings of the
AAAI Conference on Artificial Intelligence, Vol. 32.[50] Linhong Zhu, Dong Guo, Junming Yin, Greg Ver Steeg, and Aram Galstyan. 2016.
Scalable temporal latent space inference for link prediction in dynamic socialnetworks. IEEE Transactions on Knowledge and Data Engineering 28, 10 (2016),2765–2777.
A PROOF OF LEMMAS
To prove Lemma 4, we first introduce the property of uniquenessof PPR 𝝅𝑠 for any 𝑠 .
Proposition 10 (Uniqueness of PPR [3]). For any starting vector
1𝑠 , and any constant 𝛼 ∈ (0, 1], there is a unique vector 𝝅𝑠 satisfying(3).
We can rewrite it as (𝑰 −(1−𝛼)𝑫−1𝑨)𝝅𝑠 = 𝛼1𝑠 . Notice the fact thatmatrix 𝑰 − (1 − 𝛼)𝑫−1𝑨 is strictly diagonally dominant matrix. Tosee this, for each 𝑖 ∈ V, we have 1−(1−𝛼)∑𝑗≠𝑖 |1/𝑑 (𝑖) | = 𝛼 > 0. By[25], strictly diagonally dominant matrix is always invertible. □
Proposition 11 (Symmetry property [27]). Given any undirected
graph G, for any 𝛼 ∈ (0, 1) and for any node pair (𝑢, 𝑣), we have𝑑 (𝑢)𝜋𝑢 (𝑣) = 𝑑 (𝑣)𝜋𝑣 (𝑢). (8)
Proof of Lemma 7. Assume there are𝑇 iterations. For each for-ward push operation 𝑡 = 1, 2, . . .𝑇 , we assume the frontier nodeis 𝑢𝑡 , the run time of one push operation is then 𝑑 (𝑢𝑡 ). For total𝑇 push operations, the total run time is
∑𝑇𝑖=1 𝑑 (𝑢𝑖 ). Notice that
during each push operation, the amount of ∥𝒓𝑡−1𝑠 ∥1 is reduced atleast 𝜖𝛼𝑑 (𝑢𝑡 ), then we always have the following inequality
𝜖𝛼𝑑 (𝑢𝑡 ) < ∥𝒓𝑡−1𝑠 ∥1 − ∥𝒓𝑡𝑠 ∥1Apply the above inequality from 𝑡 = 1, 2, to 𝑇 , we will have
𝜖𝛼
𝑇∑︁𝑡=1
𝑑 (𝑢𝑡 ) ≤ ∥𝒓0𝑠 ∥ − ∥𝒓𝑇𝑠 ∥1 = 1 − ∥𝒓𝑠 ∥1, (9)
where 𝒓𝑠 is the final residual vector. The total time is then O(1/𝜖𝛼).To show the estimation error, we follow the idea of [26]. Noticethat, the forward local push algorithm always has the invariantproperty by Lemma 4, that is
𝜋𝑠 (𝑢) = 𝑝𝑠 (𝑢) +∑︁𝑣∈𝑉
𝑟𝑠 (𝑣)𝜋𝑣 (𝑢),∀𝑢 ∈ V. (10)
By proposition 11, we have
𝜋𝑠 (𝑢) = 𝑝𝑠 (𝑢) +∑︁𝑣∈𝑉
𝑟𝑠 (𝑣)𝜋𝑣 (𝑢),∀𝑢 ∈ V
= 𝑝𝑠 (𝑢) +∑︁𝑣∈𝑉
𝑟𝑠 (𝑣)𝑑 (𝑢)𝑑 (𝑣) 𝜋𝑢 (𝑣),∀𝑢 ∈ V
≤ 𝑝𝑠 (𝑢) +∑︁𝑣∈𝑉
𝜖𝑑 (𝑢)𝜋𝑢 (𝑣),∀𝑢 ∈ V = 𝑝𝑠 (𝑢) + 𝜖𝑑 (𝑢),
where the first inequality by the fact that 𝑟𝑠 (𝑣) ≤ 𝜖𝑑 (𝑣) and thelast equality is due to ∥𝜋𝑢 ∥1 = 1. □
Proposition 12 ([45]). Let G = (𝑉 , 𝐸) be undirected and let 𝑡 be avertex of 𝑉 , then
∑𝑥 ∈𝑉
𝜋𝑥 (𝑡 )𝑑 (𝑡 ) ≤ 1.
Proof. By using Proposition 11, we have∑︁𝑥 ∈𝑉
𝜋𝑥 (𝑡)𝑑 (𝑡) =
∑︁𝑥 ∈𝑉
𝜋𝑡 (𝑥)𝑑 (𝑥) ≤
∑︁𝑥 ∈𝑉
𝜋𝑡 (𝑥) = 1.
□
B HEURISTIC METHOD: COMMUTE
We update the embeddings by their pairwise relationship (resistancedistance). The commute distance (i.e. resistance distance) 𝐶𝑢𝑣 =
𝐻𝑢𝑣 + 𝐻𝑣𝑢 , where rescaled hitting time 𝐻𝑢𝑣 converges to 1/𝑑 (𝑣).As proved in [41], when the number of nodes in the graph is largeenough, we can show that the commute distance tends to 1/𝑑𝑣 +1/𝑑𝑢 .
Algorithm 4 Commute
1: Input: An graph G0 (V0, E0) and embedding 𝑾0, dimension 𝑑 .2: Output:𝑾𝑇
One can treat the Commute method, i.e. Algorithm 4, as the first-order approximation of RandNE [47]. The embedding generated byRandNE is given as the following
𝑼 =
(𝛼0𝑰 + 𝛼1𝑨 + 𝛼2𝑨2 + . . . + 𝛼𝑞𝑨𝑞
)𝑹, (11)
where 𝑨 is the normalized adjacency matrix and 𝑰 is the identitymatrix. At any time 𝑡 , the dynamic embedding of node 𝑖 of Commuteis given by
𝒘𝑡𝑖 =
𝑑 (𝑢)𝑑 (𝑢) + 1𝒘
𝑡−1𝑖 + 1
𝑑 (𝑢)𝒘𝑡𝑣
=1
𝑑 (𝑢) + 1𝒘0𝑖 +
1
|N (𝑖) |∑︁
𝑗 ∈N(𝑖)
1
𝑑 (𝑢)𝒘𝑡𝑣
C DETAILS OF DATA PREPROCESSING
In this section, we describe the preprocessing steps of three datasets.Enwiki20: In Enwiki20 graph, the edge stream is divided into6 snapshots, containing edges before 2005, 2005-2008, ..., 2017-2020. The sampled nodes in the first snapshot fall into 5 categories.Patent: In full patent graph, we divide edge stream into 4 snap-shots, containing patents citation links before 1985, 1985-1990,...,1995-1999. In node classification tasks, we sampled 3,000 nodesin the first snapshot, which fall into 6 categories. In patent smallgraph, we divide into 13 snapshots with a 2-year window. All thenodes in each snapshot fall into 6 categories.Coauthor graph: Infull Coauthor graph, we divide edge stream into 7 snapshots (before1990, 1990-1995, ..., 2015-2019). The sampled nodes in the first snap-shot fall into 9 categories. In Coauthor small graph, the edge streamis divided into 9 snapshots (before 1978, 1978-1983,..., 2013-2017).All the nodes in each snapshot have 14 labels in common.
Figure 6: We randomly select 2,000 nodes from Coauthor-
small graph and visualize their embeddings usingT-SNE[40]
.
125 100 75 50 25 0 25 50
10080604020
0204060 T-SNE: DeepWalk
01
150 100 50 0 50
100
50
0
50
T-SNE: Node2vec01
40 20 0 20 40
40
20
0
20
40
T-SNE: DynamicTriad01
60 40 20 0 20 40 60
60
40
20
0
20
40
T-SNE: RandNE01
40 20 0 20 40 60 80
40
20
0
20
40
60
T-SNE: DynamicPPE01
Figure 7: We select all labeled nodes from Academic graph
and visualize their embeddings using T-SNE[40]
.
D DETAILS OF PARAMETER SETTINGS
Deepwalk: number-walks=40, walk-length=40, window-size=5Node2Vec: Same as Deepwalk, p = 0.5, q = 0.5DynamicTriad: iteration=10, beta-smooth=10, beta-triad=10. Eachinput snapshot contains the previous existing edges and newly ar-rived edges.RandNE: q=3, default weight for node classification [1, 1𝑒2, 1𝑒4, 1𝑒5],input is the transition matrix, the output feature is normalized (l-2norm) row-wise.DynamicPPE: 𝛼 = 0.15, 𝜖 = 0.1, projection method=hash. ourmethod is relatively insensitive to the hyper-parameters.
E VISUALIZATIONS OF EMBEDDINGS
We visualize the embeddings of small scale graphs using T-SNE[40]in Fig.5,6,7.


![Mining Billion-node Graphs: Patterns and Toolschristos/TALKS/11-Facebook/FOILS/...CMU SCS C. Faloutsos (CMU) 5 Graphs - why should we care? Internet Map [lumeta.com] Food Web [Martinez](https://static.documents.pub/doc/80x56/5f748adac91dee62f178bcaf/mining-billion-node-graphs-patterns-and-christostalks11-facebookfoils-cmu.jpg)
![Mining Billion-node Graphs: Patterns, Generators …christos/TALKS/10-PSU/FOILS/faloutsosPSU...CMU SCS C. Faloutsos (CMU) 5 Graphs - why should we care? Internet Map [lumeta.com] Food](https://static.documents.pub/doc/80x56/5fd26c3fbbbad21df3533bc9/mining-billion-node-graphs-patterns-generators-christostalks10-psufoilsfaloutsospsu.jpg)


