Subsidence and soil CO2 efflux in tropical peatland in southern Thailand under various water table and management conditions
T. Nagano1,4*, K. Osawa1,4*, T. Ishida1,4*, K. Sakai2,4, P. Vijarnsorn5, A. Jongskul5,
S. Phetsuk6, S. Waijaroen5, T. Yamanoshita3,4, M. Norisada3,4 and K. Kojima3,4
1Utsunomiya University, 2University of the Ryukyus and 3The University of Tokyo, Japan 4Japan Science and Technology Agency, CREST, Japan
5Department of Land Development and 6Pikul Thong Royal Development Study Center, Thailand
*These authors contributed equally to the work reported here. _______________________________________________________________________________________ SUMMARY At the Bacho peatland in southern Thailand, peat subsidence was measured at four locations on abandoned agricultural land (degraded peat swamp forest) and at one location in a conservation zone, at monthly intervals over a period of more than 20 years. Average peat subsidence rates during the observation period were 3.1–5.2 cm y−1 on the degraded peatland, reducing to 1.8–2.6 cm y−1 when peat loss due to field fires was discounted, and 1.0 cm y−1 reducing to 0.7 cm y-1 in the conservation zone. Due to martial law restrictions on access to the Bacho site, measurements of the peat soil respiration rate under various water table conditions were made mostly at other sites in Thailand with similar climate. During these measurements the position of the water table ranged from 0.92 m above the peat surface to more than one metre below it, and daily mean respiration rates ranged from 0.57 to 8.20 μmol CO2 m
−2 s−1. The CO2 efflux attributed to peat respiration was 13.7–18.9 Mg ha−1 y−1 on the degraded peatland but only 7.5 Mg ha−1 y−1 in the conservation zone. To simulate the CO2 efflux resulting from soil respiration at Bacho on the basis of data collected elsewhere, we developed an empirical three-stage model (NAIS Peat Model) that treats the position of the water table as a proxy variable. The observed values of peat subsidence were in good agreement with simulated values of CO2 efflux in two tests. The implications for peatland management are considered. KEY WORDS: drainage; field fire; NAIS (NAgano-IShida) Peat Model; peat swamp forest; soil respiration _______________________________________________________________________________________ INTRODUCTION The global area of tropical peatland is approximately 441,025 km2, with 247,778 km2 (~56 %) located in south-east Asia (Page et al. 2011). In south-east Asian peat swamp forests, dead vegetation such as litter, fallen trees and roots is deposited in anaerobic floodwater and, because the decomposition rate of organic matter is low under these conditions, it accumulates as peat. The peat in these ecosystems is an immense natural reservoir of fossil carbon but, when it is drained to enable conversion of the forest into agricultural land, the peat quickly decomposes due to respiration of aerobic organisms which releases the greenhouse gas carbon dioxide (CO2). Drained peat is vulnerable to field fires during dry seasons, and these accelerate CO2 emissions. As much as 30 % of the total CO2 emissions from land use, land use change and forestry (LULUCF) has been attributed to the current large-scale degradation of peatlands (Hooijer et al. 2006, Couwenberg et al. 2010).
In Thailand, peat swamp forests have been converted to agriculture since the 1970s. The conversion involves deforestation and drainage. The thickness of the peat layer reduces first due to withdrawal of water and, later, through aerobic decomposition of peat (soil respiration) which releases the greenhouse gas CO2 to the atmosphere. As the peat layer thins, the ground surface subsides. Many peatland conversions have not created good agricultural land and have been abandoned, leaving degraded areas that usually develop secondary forest vegetation. However, because they are still efficiently drained, decomposition of the remaining peat may continue (now unnecessarily) to release CO2 to the atmosphere.
The purpose of this article is to report an unusually long series of direct observations of subsidence in converted peat swamp forest and an adjacent conservation zone, together with preliminary results from a supporting research programme that aims to identify and quantify the underlying processes.
T. Nagano et al. SUBSIDENCE AND SOIL CO2 EFFLUX IN TROPICAL PEATLAND
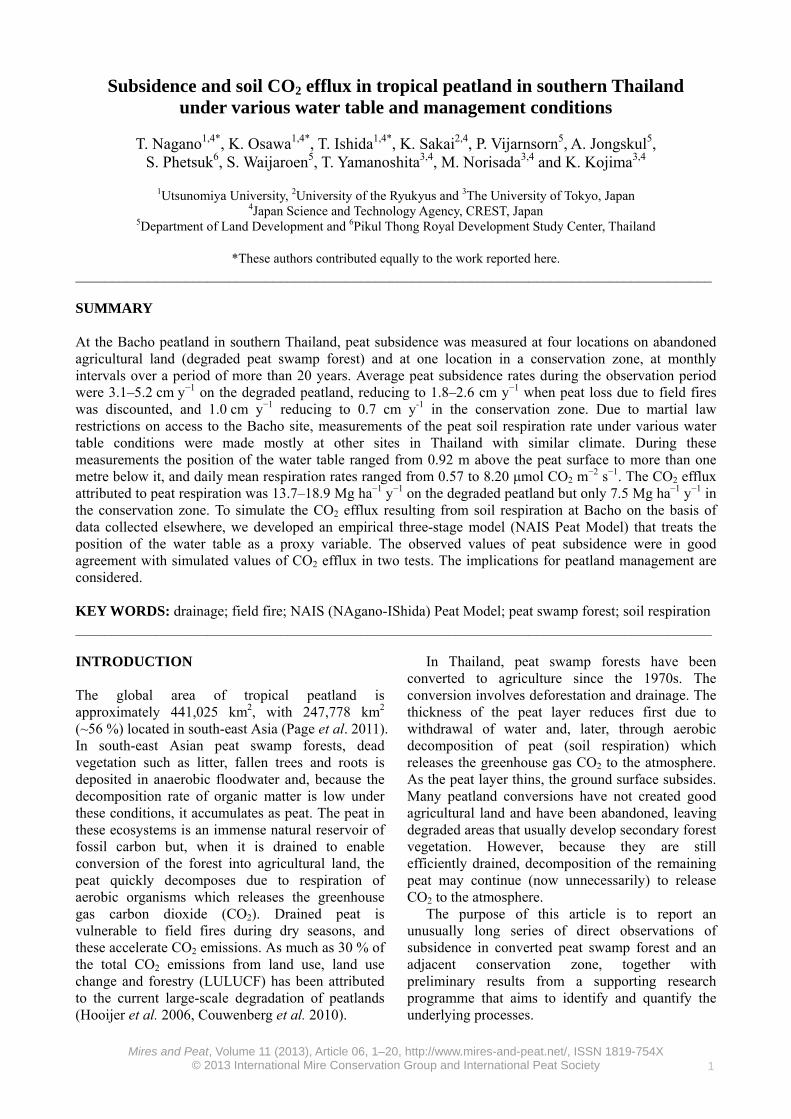
METHODS Study sites In Thailand, soils with surface organic layers more than 40 cm thick are defined as peatland. Applying this definition, the total area of peatland in Thailand is approximately 453 km2. Our field investigations were conducted on peatlands in the southern provinces of Narathiwat and Nakhon Si Thammarat, on the Malay Peninsula (Figure 1). The areas of peatland in Narathiwat and Nakhon Si Thammarat Provinces are approximately 266 km2 and 123 km2, respectively (Vijarnsorn 1996), which means that these two provinces together host around 86 % of the country’s peatland resource. In Narathiwat Province, mean annual temperature is 27.9 ºC and mean annual precipitation is 2,465 mm. The corresponding figures for Nakhon Si Thammarat Province are 27.2 ºC and 2,381 mm (World Climate 2012). Both provinces are identified as tropical rain forest by the Köppen climate classification system.
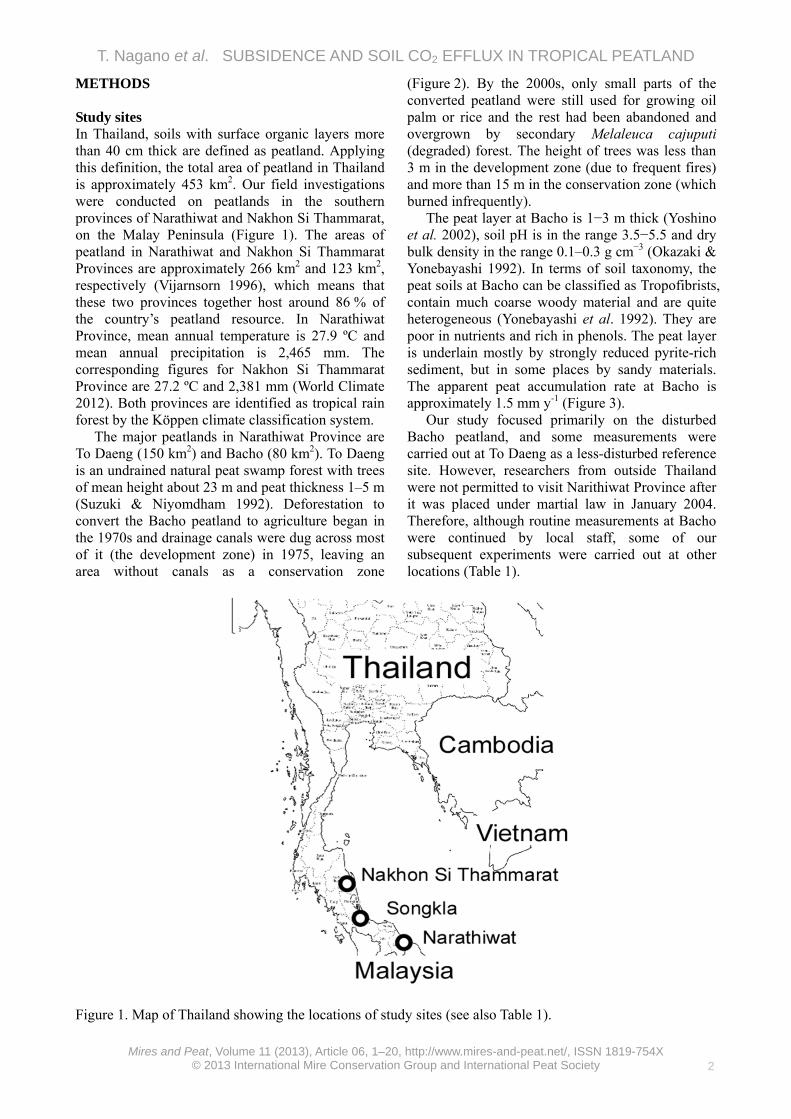
The major peatlands in Narathiwat Province are To Daeng (150 km2) and Bacho (80 km2). To Daeng is an undrained natural peat swamp forest with trees of mean height about 23 m and peat thickness 1–5 m (Suzuki & Niyomdham 1992). Deforestation to convert the Bacho peatland to agriculture began in the 1970s and drainage canals were dug across most of it (the development zone) in 1975, leaving an area without canals as a conservation zone
(Figure 2). By the 2000s, only small parts of the converted peatland were still used for growing oil palm or rice and the rest had been abandoned and overgrown by secondary Melaleuca cajuputi (degraded) forest. The height of trees was less than 3 m in the development zone (due to frequent fires) and more than 15 m in the conservation zone (which burned infrequently).
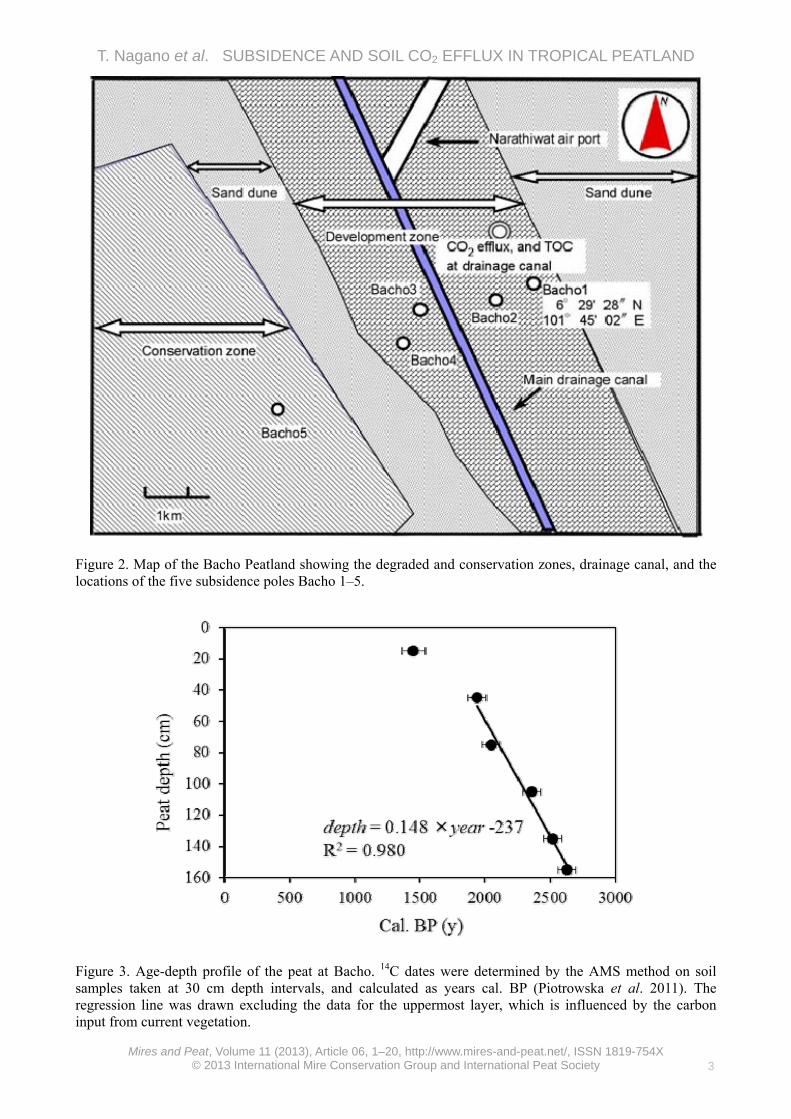
The peat layer at Bacho is 1−3 m thick (Yoshino et al. 2002), soil pH is in the range 3.5−5.5 and dry bulk density in the range 0.1–0.3 g cm−3 (Okazaki & Yonebayashi 1992). In terms of soil taxonomy, the peat soils at Bacho can be classified as Tropofibrists, contain much coarse woody material and are quite heterogeneous (Yonebayashi et al. 1992). They are poor in nutrients and rich in phenols. The peat layer is underlain mostly by strongly reduced pyrite-rich sediment, but in some places by sandy materials. The apparent peat accumulation rate at Bacho is approximately 1.5 mm y-1 (Figure 3).
Our study focused primarily on the disturbed Bacho peatland, and some measurements were carried out at To Daeng as a less-disturbed reference site. However, researchers from outside Thailand were not permitted to visit Narithiwat Province after it was placed under martial law in January 2004. Therefore, although routine measurements at Bacho were continued by local staff, some of our subsequent experiments were carried out at other locations (Table 1).
Figure 1. Map of Thailand showing the locations of study sites (see also Table 1).
T. Nagano et al. SUBSIDENCE AND SOIL CO2 EFFLUX IN TROPICAL PEATLAND
Figure 2. Map of the Bacho Peatland showing the degraded and conservation zones, drainage canal, and the locations of the five subsidence poles Bacho 1–5.
Figure 3. Age-depth profile of the peat at Bacho. 14C dates were determined by the AMS method on soil samples taken at 30 cm depth intervals, and calculated as years cal. BP (Piotrowska et al. 2011). The regression line was drawn excluding the data for the uppermost layer, which is influenced by the carbon input from current vegetation.
T. Nagano et al. SUBSIDENCE AND SOIL CO2 EFFLUX IN TROPICAL PEATLAND
Table 1. Summary of sites and measurements obtained from each site.
Province Site name and location (latitude, longitude)
Peatland type Period of
observations Variables measured
Narathiwat*
Bacho (6º 29' N, 101º 45' E)
Converted peat swamp with conservation zone
Jul 1983–Jan 2006 Peat subsidence
Aug 2001 Aug 2003
CO2 efflux rate from ditches
Aug 2004–Jul 2006 TOC in ditches
To Daeng (6º 12' N, 101º 56' E)
Undrained natural peat swamp forest
Aug 2003 CO2 efflux rate from flooded forest
Nakhon Si Thammarat
Nakhon Si Thammarat Peatland (8º 01′ N, 100º 03′ E)
Reclaimed peatland Aug 2006–May 2009
CO2 efflux rate from non-flooded peat surface
Peat properties
Songkla
Southern Silvicultural Research Center, Royal Forest Department (7º 01′ N, 100º 17′ E)
ex-situ peat from Bacho
Mar 2011–Jul 2011
CO2 efflux rate from non-flooded translocated peat
Peat properties
* Under martial law from January 2004; this restricted data collection to routine measurements by local staff.
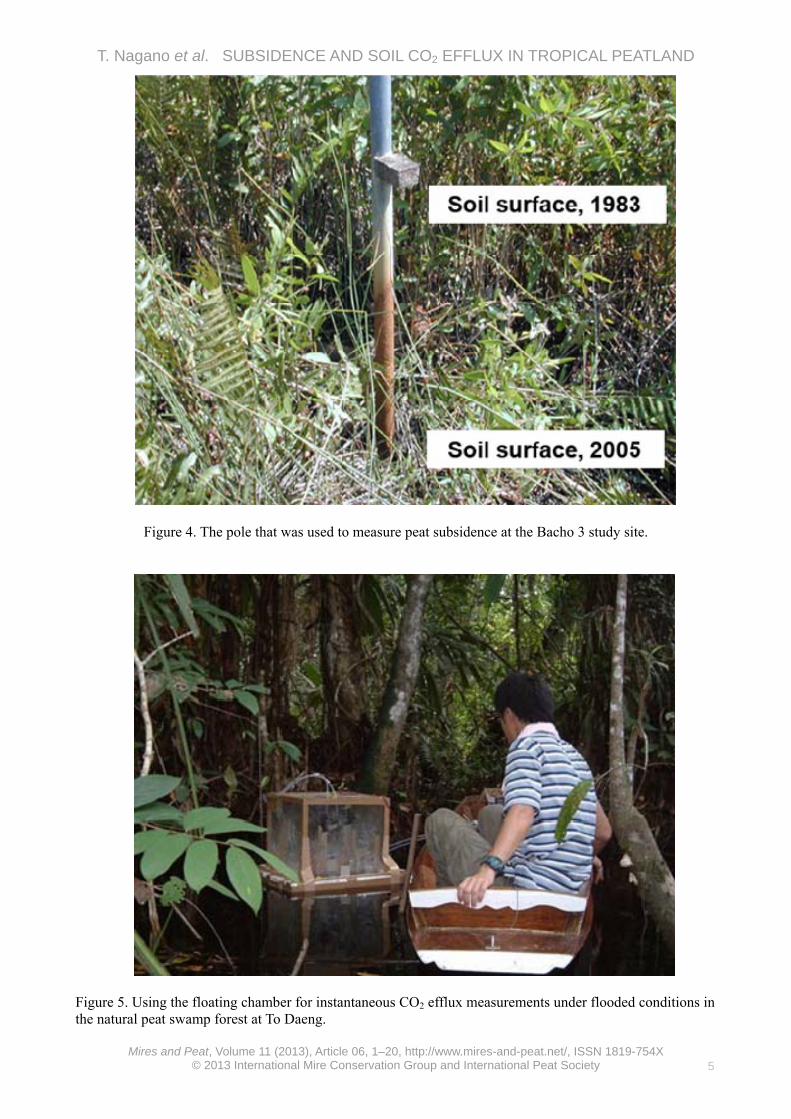
Peat subsidence Peat subsidence has been measured at Bacho since 1983, when three of the four steel subsidence poles (Bacho 1, Bacho 2, Bacho 3, Bacho 4) were installed by one of the authors (P. Vijaronson) on degraded peatland in the converted zone and another (Bacho 5) was established in the conservation zone (Figure 2). The poles were driven through the peat and anchored firmly in the substratum (usually marine clay). The difference in height between the initial and the current ground surface level at each pole (Figure 4) was subsequently measured at monthly intervals, enabling the rate of subsidence (PS) to be calculated in cm per month or per year. A perforated 6 cm diameter plastic pipe (dipwell) was inserted vertically into the peat near each pole with its lower end 1.5 m below ground level. Each time a pole measurement was made, the position of the water table in the adjacent dipwell was also determined using a tape measure (GW: height of water table in centimetres above ground level at the time of measurement, i.e. positive values indicate that the ground surface was flooded and negative values that the water table was below the surface). Missing peat subsidence and water table data were estimated by interpolation from the nearest two points for which data were recorded.
In general, the water table in the degraded areas fluctuated between 10 cm and 30 cm above the peat surface during rainy seasons and between -30 cm and -70 cm (below the surface) during dry seasons, when the upper part of the peat layer could become extremely dry and prone to frequent fires. During
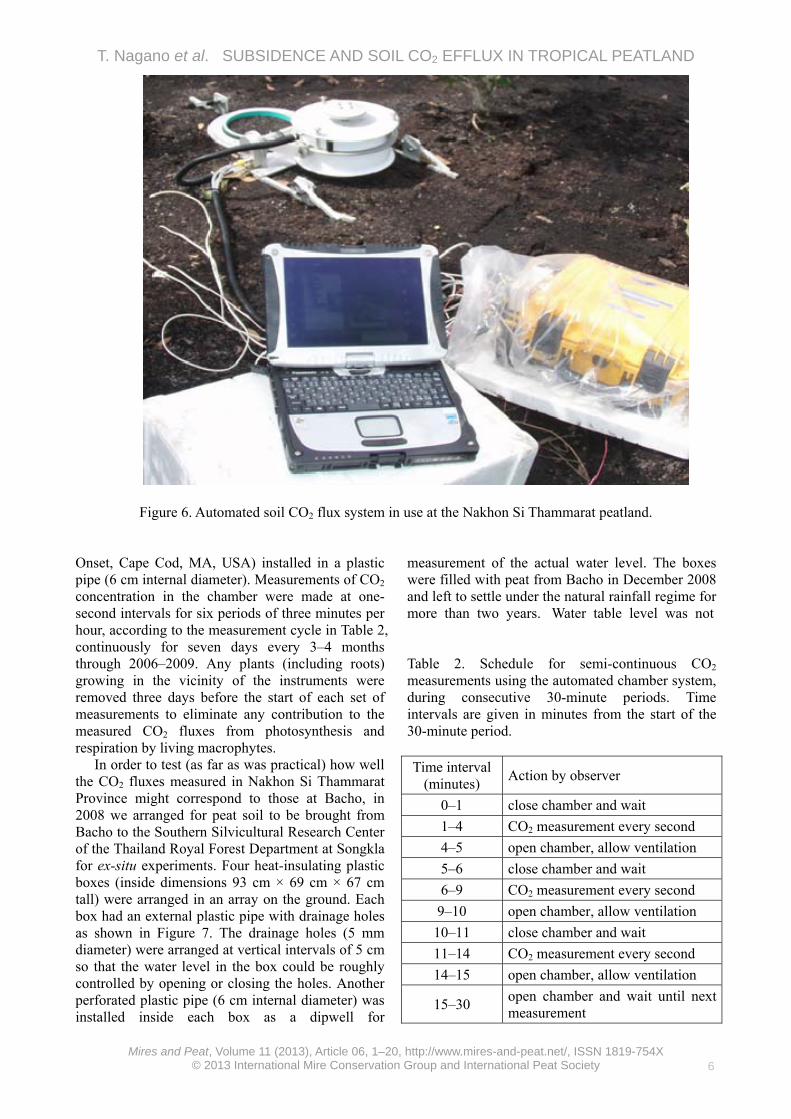
each site visit, any new visual evidence of fire in the vicinity (during the previous month) was recorded. Instantaneous CO2 efflux measurements In August 2001 and August 2003, instantaneous CO2 efflux rates under flooded conditions were measured in the drainage canal at Bacho (four measurements) and at To Daeng (nine measurements) using a closed chamber connected to a non-dispersive infrared gas analyser (LI-820; LI-COR, Lincoln, NE, USA). The chamber was composed of transparent acrylic panels, had a 44 cm square cross-section, and was 45 cm in height. It was attached to a styrene foam float so that the bottom of the chamber was submerged to a depth of about 10 cm in use (Figure 5). Automated CO2 efflux measurements Because the political situation had prevented any further CO2 efflux measurements in Narathiwat Province since 2003, these were continued at a new site in Nakhon Si Thammarat Province from 2006. This research site was on reclaimed peatland which had been stripped of vegetation in 2004 and where very few new plants were colonising. Here, measurements of soil CO2 efflux were conducted using automated soil CO2 flux systems (LI-8100; LI-COR, Lincoln, NE, USA) (Figure 6). With this system, soil temperatures at 1 cm and 5 cm below the ground surface were measured using Type T (copper-constantan) thermocouples, and air temperature 20 cm above the ground surface was measured using a thermistor. Water level was measured using a hydrobarometer (HOBO U20;
T. Nagano et al. SUBSIDENCE AND SOIL CO2 EFFLUX IN TROPICAL PEATLAND
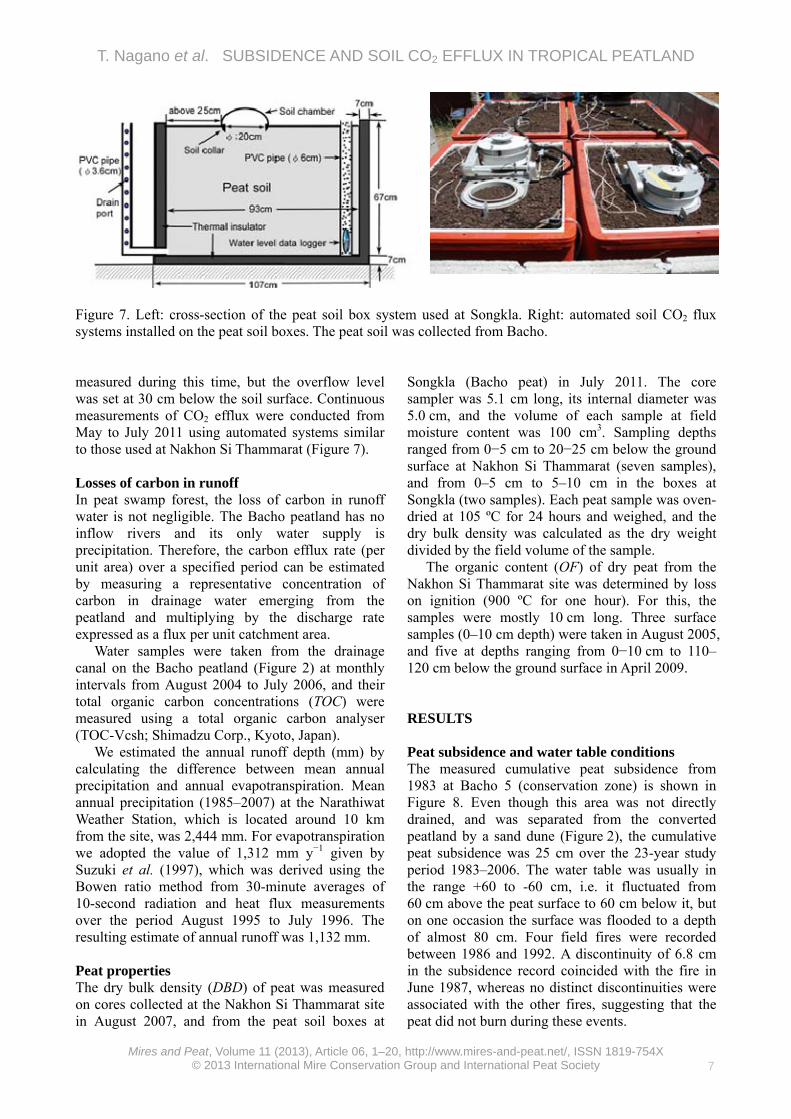
Figure 6. Automated soil CO2 flux system in use at the Nakhon Si Thammarat peatland.
Onset, Cape Cod, MA, USA) installed in a plastic pipe (6 cm internal diameter). Measurements of CO2 concentration in the chamber were made at one-second intervals for six periods of three minutes per hour, according to the measurement cycle in Table 2, continuously for seven days every 3–4 months through 2006–2009. Any plants (including roots) growing in the vicinity of the instruments were removed three days before the start of each set of measurements to eliminate any contribution to the measured CO2 fluxes from photosynthesis and respiration by living macrophytes.
In order to test (as far as was practical) how well the CO2 fluxes measured in Nakhon Si Thammarat Province might correspond to those at Bacho, in 2008 we arranged for peat soil to be brought from Bacho to the Southern Silvicultural Research Center of the Thailand Royal Forest Department at Songkla for ex-situ experiments. Four heat-insulating plastic boxes (inside dimensions 93 cm × 69 cm × 67 cm tall) were arranged in an array on the ground. Each box had an external plastic pipe with drainage holes as shown in Figure 7. The drainage holes (5 mm diameter) were arranged at vertical intervals of 5 cm so that the water level in the box could be roughly controlled by opening or closing the holes. Another perforated plastic pipe (6 cm internal diameter) was installed inside each box as a dipwell for
measurement of the actual water level. The boxes were filled with peat from Bacho in December 2008 and left to settle under the natural rainfall regime for more than two years. Water table level was not Table 2. Schedule for semi-continuous CO2 measurements using the automated chamber system, during consecutive 30-minute periods. Time intervals are given in minutes from the start of the 30-minute period. Time interval
(minutes) Action by observer
0–1 close chamber and wait
1–4 CO2 measurement every second
4–5 open chamber, allow ventilation
5–6 close chamber and wait
6–9 CO2 measurement every second
9–10 open chamber, allow ventilation
10–11 close chamber and wait
11–14 CO2 measurement every second
14–15 open chamber, allow ventilation
15–30 open chamber and wait until next measurement
T. Nagano et al. SUBSIDENCE AND SOIL CO2 EFFLUX IN TROPICAL PEATLAND
Figure 7. Left: cross-section of the peat soil box system used at Songkla. Right: automated soil CO2 flux systems installed on the peat soil boxes. The peat soil was collected from Bacho. measured during this time, but the overflow level was set at 30 cm below the soil surface. Continuous measurements of CO2 efflux were conducted from May to July 2011 using automated systems similar to those used at Nakhon Si Thammarat (Figure 7). Losses of carbon in runoff In peat swamp forest, the loss of carbon in runoff water is not negligible. The Bacho peatland has no inflow rivers and its only water supply is precipitation. Therefore, the carbon efflux rate (per unit area) over a specified period can be estimated by measuring a representative concentration of carbon in drainage water emerging from the peatland and multiplying by the discharge rate expressed as a flux per unit catchment area.
Water samples were taken from the drainage canal on the Bacho peatland (Figure 2) at monthly intervals from August 2004 to July 2006, and their total organic carbon concentrations (TOC) were measured using a total organic carbon analyser (TOC-Vcsh; Shimadzu Corp., Kyoto, Japan).
We estimated the annual runoff depth (mm) by calculating the difference between mean annual precipitation and annual evapotranspiration. Mean annual precipitation (1985–2007) at the Narathiwat Weather Station, which is located around 10 km from the site, was 2,444 mm. For evapotranspiration we adopted the value of 1,312 mm y−1 given by Suzuki et al. (1997), which was derived using the Bowen ratio method from 30-minute averages of 10-second radiation and heat flux measurements over the period August 1995 to July 1996. The resulting estimate of annual runoff was 1,132 mm. Peat properties The dry bulk density (DBD) of peat was measured on cores collected at the Nakhon Si Thammarat site in August 2007, and from the peat soil boxes at
Songkla (Bacho peat) in July 2011. The core sampler was 5.1 cm long, its internal diameter was 5.0 cm, and the volume of each sample at field moisture content was 100 cm3. Sampling depths ranged from 0−5 cm to 20−25 cm below the ground surface at Nakhon Si Thammarat (seven samples), and from 0–5 cm to 5–10 cm in the boxes at Songkla (two samples). Each peat sample was oven-dried at 105 ºC for 24 hours and weighed, and the dry bulk density was calculated as the dry weight divided by the field volume of the sample.
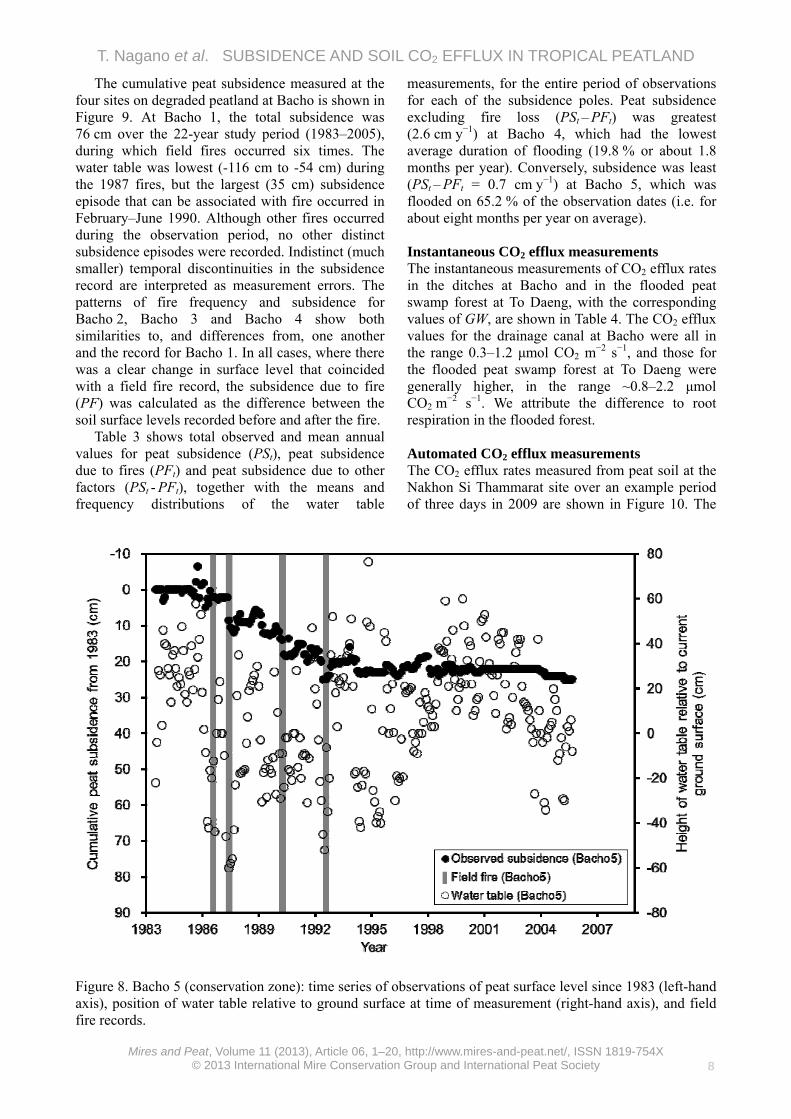
The organic content (OF) of dry peat from the Nakhon Si Thammarat site was determined by loss on ignition (900 ºC for one hour). For this, the samples were mostly 10 cm long. Three surface samples (0–10 cm depth) were taken in August 2005, and five at depths ranging from 0−10 cm to 110–120 cm below the ground surface in April 2009. RESULTS Peat subsidence and water table conditions The measured cumulative peat subsidence from 1983 at Bacho 5 (conservation zone) is shown in Figure 8. Even though this area was not directly drained, and was separated from the converted peatland by a sand dune (Figure 2), the cumulative peat subsidence was 25 cm over the 23-year study period 1983–2006. The water table was usually in the range +60 to -60 cm, i.e. it fluctuated from 60 cm above the peat surface to 60 cm below it, but on one occasion the surface was flooded to a depth of almost 80 cm. Four field fires were recorded between 1986 and 1992. A discontinuity of 6.8 cm in the subsidence record coincided with the fire in June 1987, whereas no distinct discontinuities were associated with the other fires, suggesting that the peat did not burn during these events.
T. Nagano et al. SUBSIDENCE AND SOIL CO2 EFFLUX IN TROPICAL PEATLAND
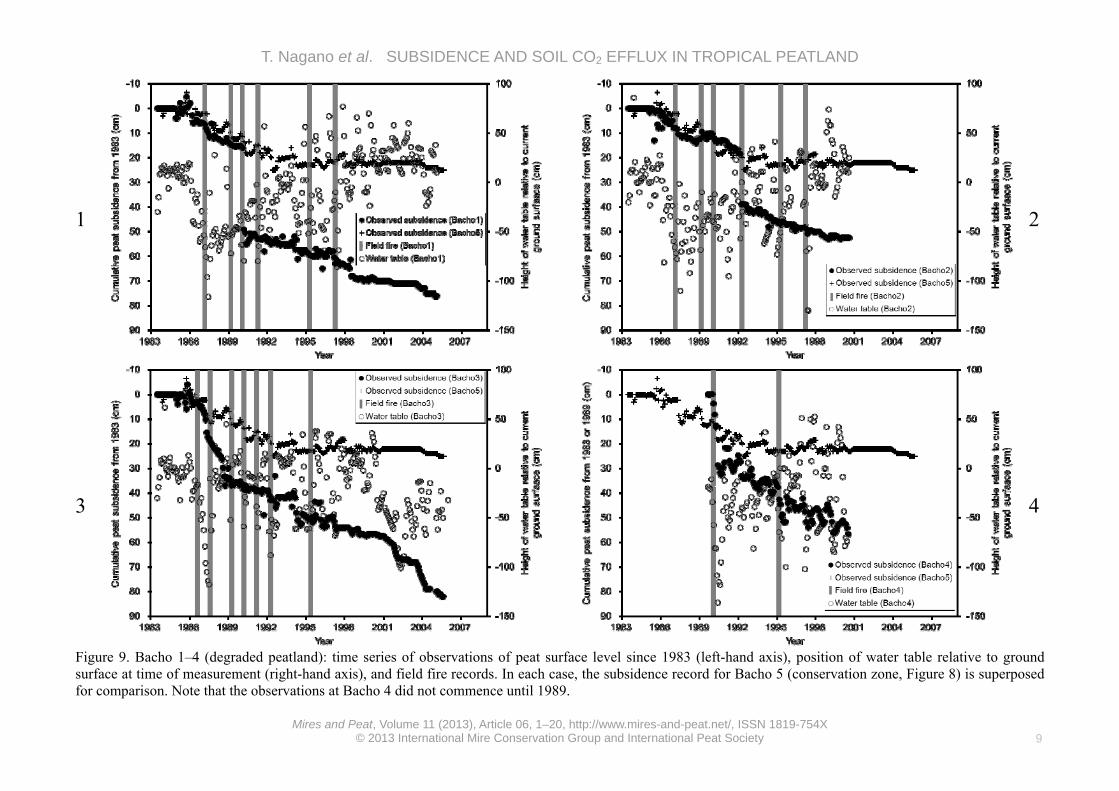
The cumulative peat subsidence measured at the four sites on degraded peatland at Bacho is shown in Figure 9. At Bacho 1, the total subsidence was 76 cm over the 22-year study period (1983–2005), during which field fires occurred six times. The water table was lowest (-116 cm to -54 cm) during the 1987 fires, but the largest (35 cm) subsidence episode that can be associated with fire occurred in February–June 1990. Although other fires occurred during the observation period, no other distinct subsidence episodes were recorded. Indistinct (much smaller) temporal discontinuities in the subsidence record are interpreted as measurement errors. The patterns of fire frequency and subsidence for Bacho 2, Bacho 3 and Bacho 4 show both similarities to, and differences from, one another and the record for Bacho 1. In all cases, where there was a clear change in surface level that coincided with a field fire record, the subsidence due to fire (PF) was calculated as the difference between the soil surface levels recorded before and after the fire.
Table 3 shows total observed and mean annual values for peat subsidence (PSt), peat subsidence due to fires (PFt) and peat subsidence due to other factors (PSt
- PFt), together with the means and frequency distributions of the water table
measurements, for the entire period of observations for each of the subsidence poles. Peat subsidence excluding fire loss (PSt
– PFt) was greatest (2.6 cm y−1) at Bacho 4, which had the lowest average duration of flooding (19.8 % or about 1.8 months per year). Conversely, subsidence was least (PSt
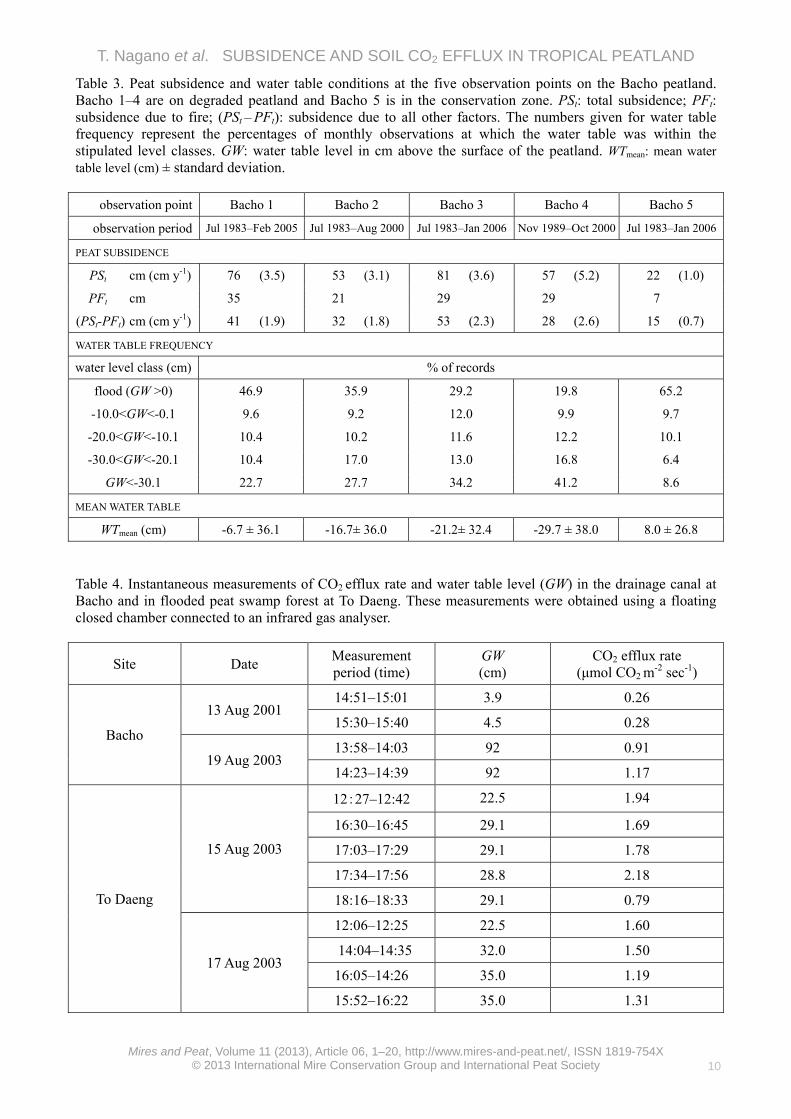
– PFt = 0.7 cm y−1) at Bacho 5, which was flooded on 65.2 % of the observation dates (i.e. for about eight months per year on average). Instantaneous CO2 efflux measurements The instantaneous measurements of CO2 efflux rates in the ditches at Bacho and in the flooded peat swamp forest at To Daeng, with the corresponding values of GW, are shown in Table 4. The CO2 efflux values for the drainage canal at Bacho were all in the range 0.3–1.2 μmol CO2 m−2 s−1, and those for the flooded peat swamp forest at To Daeng were generally higher, in the range ~0.8–2.2 μmol CO2 m
−2 s−1. We attribute the difference to root respiration in the flooded forest. Automated CO2 efflux measurements The CO2 efflux rates measured from peat soil at the Nakhon Si Thammarat site over an example period of three days in 2009 are shown in Figure 10. The
Figure 8. Bacho 5 (conservation zone): time series of observations of peat surface level since 1983 (left-hand axis), position of water table relative to ground surface at time of measurement (right-hand axis), and field fire records.
T. Nagano et al. SUBSIDENCE AND SOIL CO2 EFFLUX IN TROPICAL PEATLAND
Figure 9. Bacho 1–4 (degraded peatland): time series of observations of peat surface level since 1983 (left-hand axis), position of water table relative to ground surface at time of measurement (right-hand axis), and field fire records. In each case, the subsidence record for Bacho 5 (conservation zone, Figure 8) is superposed for comparison. Note that the observations at Bacho 4 did not commence until 1989.
T. Nagano et al. SUBSIDENCE AND SOIL CO2 EFFLUX IN TROPICAL PEATLAND
Table 3. Peat subsidence and water table conditions at the five observation points on the Bacho peatland. Bacho 1–4 are on degraded peatland and Bacho 5 is in the conservation zone. PSt: total subsidence; PFt: subsidence due to fire; (PSt
– PFt): subsidence due to all other factors. The numbers given for water table frequency represent the percentages of monthly observations at which the water table was within the stipulated level classes. GW: water table level in cm above the surface of the peatland. WTmean: mean water table level (cm) ± standard deviation.
Table 4. Instantaneous measurements of CO2 efflux rate and water table level (GW) in the drainage canal at Bacho and in flooded peat swamp forest at To Daeng. These measurements were obtained using a floating closed chamber connected to an infrared gas analyser.
Site Date Measurement period (time)
GW (cm)
CO2 efflux rate (μmol CO2 m
-2 sec-1)
Bacho
13 Aug 2001 14:51–15:01 3.9 0.26
15:30–15:40 4.5 0.28
19 Aug 2003 13:58–14:03 92 0.91
14:23–14:39 92 1.17
To Daeng
15 Aug 2003
12:27–12:42 22.5 1.94
16:30–16:45 29.1 1.69
17:03–17:29 29.1 1.78
17:34–17:56 28.8 2.18
18:16–18:33 29.1 0.79
17 Aug 2003
12:06–12:25 22.5 1.60
14:04–14:35 32.0 1.50
16:05–14:26 35.0 1.19
15:52–16:22 35.0 1.31
T. Nagano et al. SUBSIDENCE AND SOIL CO2 EFFLUX IN TROPICAL PEATLAND
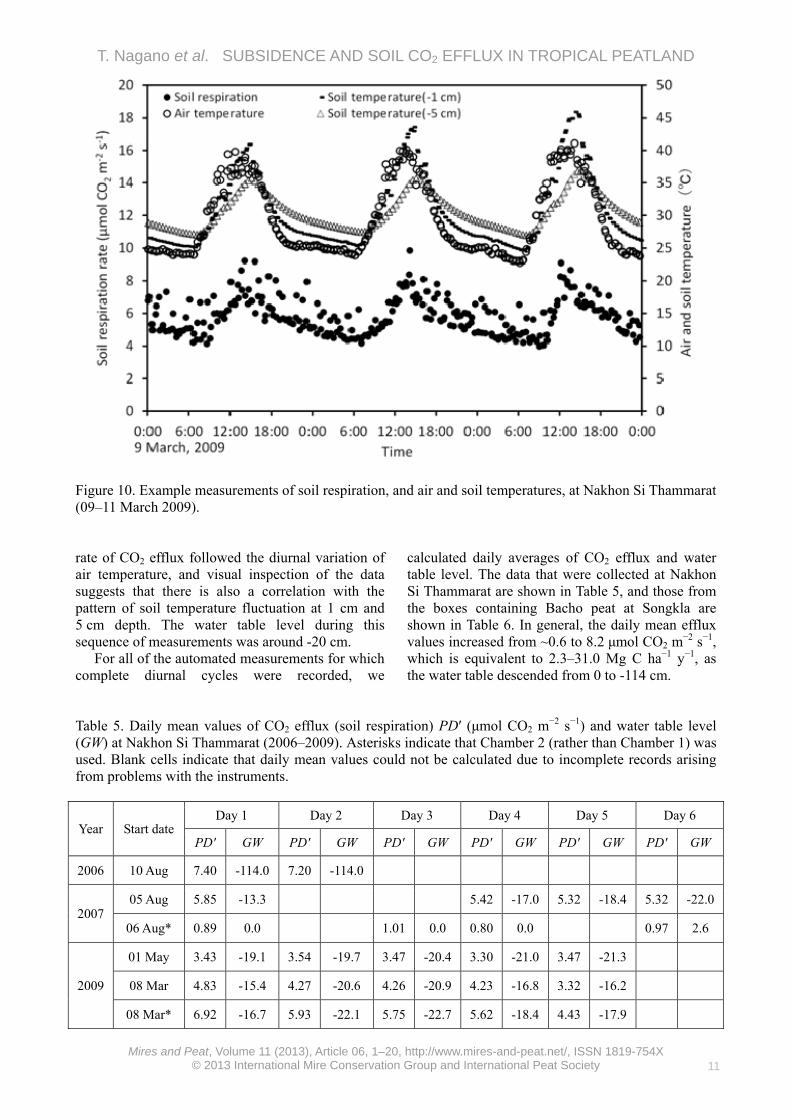
Figure 10. Example measurements of soil respiration, and air and soil temperatures, at Nakhon Si Thammarat (09–11 March 2009). rate of CO2 efflux followed the diurnal variation of air temperature, and visual inspection of the data suggests that there is also a correlation with the pattern of soil temperature fluctuation at 1 cm and 5 cm depth. The water table level during this sequence of measurements was around -20 cm.
For all of the automated measurements for which complete diurnal cycles were recorded, we
calculated daily averages of CO2 efflux and water table level. The data that were collected at Nakhon Si Thammarat are shown in Table 5, and those from the boxes containing Bacho peat at Songkla are shown in Table 6. In general, the daily mean efflux values increased from ~0.6 to 8.2 μmol CO2 m
−2 s−1, which is equivalent to 2.3–31.0 Mg C ha−1 y−1, as the water table descended from 0 to -114 cm.
Table 5. Daily mean values of CO2 efflux (soil respiration) PD′ (μmol CO2 m
−2 s−1) and water table level (GW) at Nakhon Si Thammarat (2006–2009). Asterisks indicate that Chamber 2 (rather than Chamber 1) was used. Blank cells indicate that daily mean values could not be calculated due to incomplete records arising from problems with the instruments.
Year Start date Day 1 Day 2 Day 3 Day 4 Day 5 Day 6
Table 6. Daily mean values of CO2 efflux (soil respiration) PD′ (μmol CO2 m−2 s−1) and water table level
(GW) for the peat boxes at Songkla, May–July 2011. Data are shown per week, but the measurements were continuous from the beginning of May to the end of July. Asterisks indicate that Chamber 2 (rather than Chamber 1) was used. Blank cells indicate that daily mean values could not be calculated due to incomplete records arising from problems with the instruments.
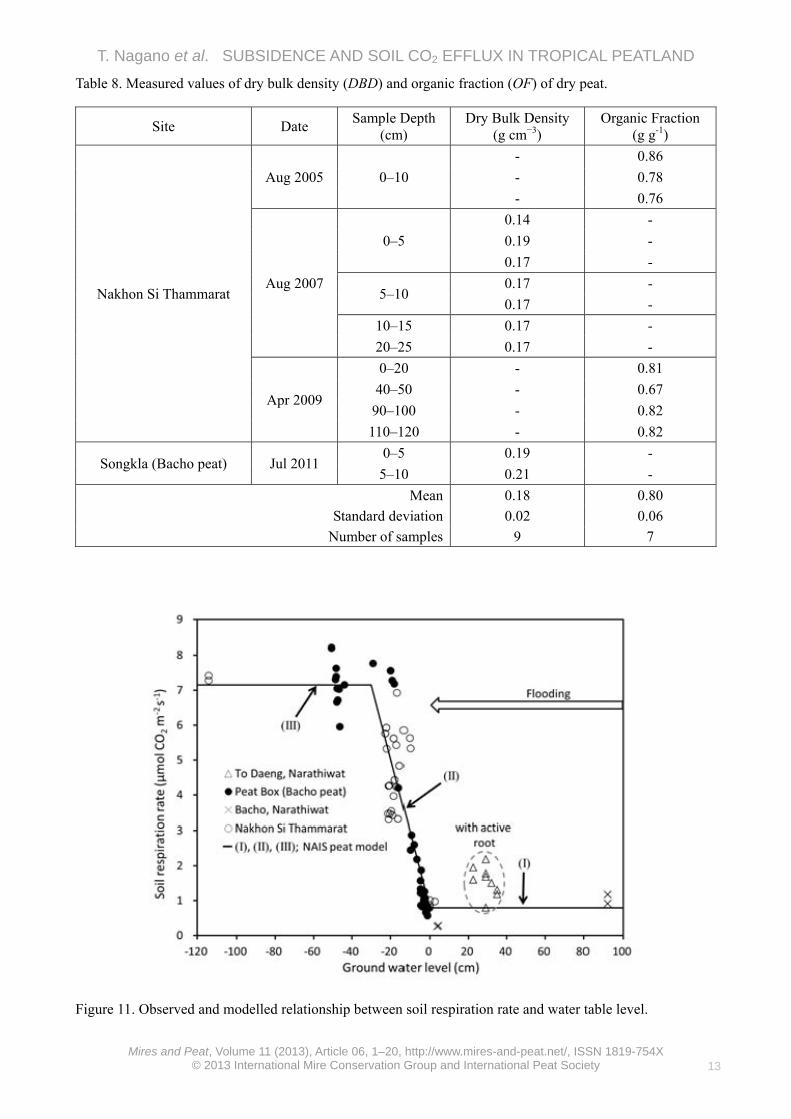
TOC in runoff water and peat properties The TOC concentrations in drainage water ranged from 12.9 to 72.4 mg C L-1, giving a mean value of 35.9 ± 16.5 mg C L-1 (n=22) (Table 7). Dry bulk density (DBD) ranged from 0.14 to 0.21 g cm−3, with a mean value of 0.18 ± 0.02 g cm−3 (n=9). The fraction of organic matter in dry peat (OF) ranged from 0.67 to 0.86 g g−1, with a mean value of 0.80 ± 0.06 g g−1 (n=7) (Table 8). Relationship between CO2 efflux rates and water table level All of the CO2 efflux data from the different experiments are plotted against water level at the time of collection in Figure 11. The instantaneous CO2 efflux values measured under flooded conditions at To Daeng and Bacho showed no trend
with GW, although the values for the flooded peat swamp forest at To Daeng formed a cluster of generally higher values for which a reason has been suggested above.
The CO2 efflux rates from the Nakhon Si Thammarat peatland and from the peat boxes were similar to those from the Bacho ditches when the water table was at the surface, and increased dramatically to around 7.8 μmol CO2 m−2 s−1as the water table descended to -30 cm. No further increase in CO2 efflux rate was observed, even though some of the measurements were made when GW was as low as -114 cm. The data for the translocated Bacho peat agreed well with the Nakhon Si Thammarat results down to water table level ~ -30 cm, then became independent of the position of the water table, ranging from 5.97 to 8.20 μmol CO2 m
−2 s−1, Table 7. Total organic matter (TOC) concentrations (mg L-1) in water collected from ditches at Bacho. Blank cells: no data.
at GW ~ -50 cm. These data reflect periods of low water table with sporadic and relatively light precipitation when all of the incident rainwater was absorbed by, and re-evaporated from, the layer of unsaturated peat above the water table. In other words, the wetting front arising from each rainfall event did not alter WT because it did not penetrate to the water table, but the peat in the unsaturated zone nonetheless experienced fluctuations in wetness that affected the CO2 efflux rate. The two observations from Nakhon Si Thammarat when the water table was at -114 cm support the conclusion that the CO2 flux rate reached an asymptote at GW around -30 cm. Derivation of the soil respiration model To enable us to explore how much of the observed peat subsidence could be accounted for by soil respiration, we developed an empirical three-stage model to summarise the relationship between CO2 efflux rate (μmol CO2 m
−2 s−1) and water table level (cm) described above, which is superposed on the plotted data (from which it is derived) in Figure 11.
Stage 1 (GW ≥ 0) represents flooded conditions (right-hand side of Figure 11). The mean CO2 efflux rate for this condition was calculated as the mean of all the relevant data from the Bacho canal (crosses, Table 4) and the Nakhon Si Thammarat peatland (open circles, Table 5), as 0.79 ± 0.33 (n=8). The CO2 efflux data from To Daeng (triangles, Table 4) were excluded from this calculation because, being obtained from natural peat swamp forest with relatively high root respiration rates, they were considered to be less representative of conditions on the degraded peatland at the locations of most of the subsidence poles.
For Stage 2 (-30 < GW < 0), a linear regression in Microsoft Excel with the y-axis intercept set at 0.79 (from Stage 1) gave the equation for soil respiration rate: PD′ = -0.21 GW + 0.79, r2 = 0.77 (n=49). This was derived from most of the data points for Nakhon Si Thammarat (open circles, n=18) and the boxes at Songkla (filled circles, n=31).
For Stage 3 (GW ≥ −30), the mean value of CO2 efflux for the translocated Bacho peat and the Nakhon Si Thammarat peatland was calculated as 7.15 ± 0.54 (n=12). This value showed good agreement with the value generated by the equation derived for Stage 2.
Thus, the NAIS (NAgano-IShida) Peat Model consists of three parts (Figure 11):
(I) under flooded conditions, PD′ remains constant regardless of water table position GW (cm), and
PD′ = 0.79 {GW ≥ 0} [1]
(II) PD′ increases linearly as the water table falls from 0 to -30 cm, and
PD′ = −0.21 GW + 0.79 {−30 < GW < 0} [2]
(III) PD′ is constant at water table levels below -30 cm, and
PD′ = 7.15 {GW ≤ −30} [3]
Simulations of peat subsidence Theory Peat subsidence (PS) reflects a combination of processes, namely: compression (shrinking) of the peat (PC) (negative values indicate swelling) due to changes in water content; decomposition of peat in situ (PD) through aerobic respiration of micro-organisms, releasing CO2 gas; anaerobic decomposition (PM) releasing methane (CH4); and losses of dissolved and particulate organic carbon in runoff water (PR). As illustrated by Figures 8–9 and Table 3, substantial quantities of peat may also be lost by fire (PF). On the other hand, any plant material added to the peat layer as litterfall and dead roots (PL) tends to oppose subsidence. Thus, total PS (cm) can be written as the sum of losses due to all of these processes: PS = PC + PD + PM + PR + PF – PL [4] Except for PC, all of the terms on the right-hand side of Equation 4 reflect changes in the carbon content of the peatland. If we adopt the assumption that, in the peatlands under investigation, the initial consolidation due to loss of water after drainage was completed during the 8+ years between the start of land conversion and the first subsidence pole measurements, so that the peat profile has been in a steady state where subsidence reflects only ongoing losses of peat (Couwenberg & Hooijer 2013) throughout the period of records, we can set PC = 0.
No published data were found for PL. However, the trees at Bacho were generally young and small, especially on the degraded peatland (Bacho 1–4). Therefore, we set PL = 0. The estimation of PM was beyond the scope of this study and, in effect, we also assume that PM = 0. Thus, with re-arrangement, Equation 4 is reduced to: PS - PF = PD + PR [5] Whereas the units of our measurements of PS and PF are cm of peat per month or per year, the terms on the right-hand side of Equation 5 have been measured as instantaneous or average CO2 flux rates (units μmol CO2 m−2 s−1), which we write as PD' and PR'. The two types of measurements are related through the volumetric carbon density of the peat, which is a function of its dry bulk density (DBD) in
T. Nagano et al. SUBSIDENCE AND SOIL CO2 EFFLUX IN TROPICAL PEATLAND
g cm-3, the organic fraction of the dry matter (OF) in g g-1, and the fraction of carbon in the organic matter (CF) in g C g-1. The conversion that relates measurements of carbon flux (μmol CO2 m
−2 s−1) to the data for PS and PF measured at the subsidence poles (cm y-1) is:
CFOFDBD
PRPDPFPS
''
10×3.784 2- [6]
where the constant (3.784 × 10⁻²) is a conversion factor to achieve equivalent units (12×10-6 g C μmol-1 CO2; 104 cm2 m-2; 3.1536×10⁷ s y-1). Calculations The values substituted in Equation 6 for the simulations of peat subsidence are explained below.
For each observation of subsidence, the value of PD′ (μmol CO2 m−2 s−1) (PD'm) corresponding to the associated field water level measurement was generated using Equations 1–3.
The mean total organic carbon (TOC) concentration in water collected from the drainage canal at Bacho, derived from the data in Table 7, was 35.9 mg C L-1. As a result, PR′
was estimated to be 0.11 μmol CO2 m−2 s−1.
The mean value of dry bulk density (DBD), 0.18 g cm−3, was calculated from the data in Table 8.
The mean value of OF, 0.80 g g−1, was also obtained from Table 8.
Literature values for the fraction of carbon in the organic matter (CF) range from 0.49 to 0.57 g C g−1 for tropical peat (Satrio et al. 2009, Page et al. 2011) and on this basis we adopted a value of 0.50 g C g−1.
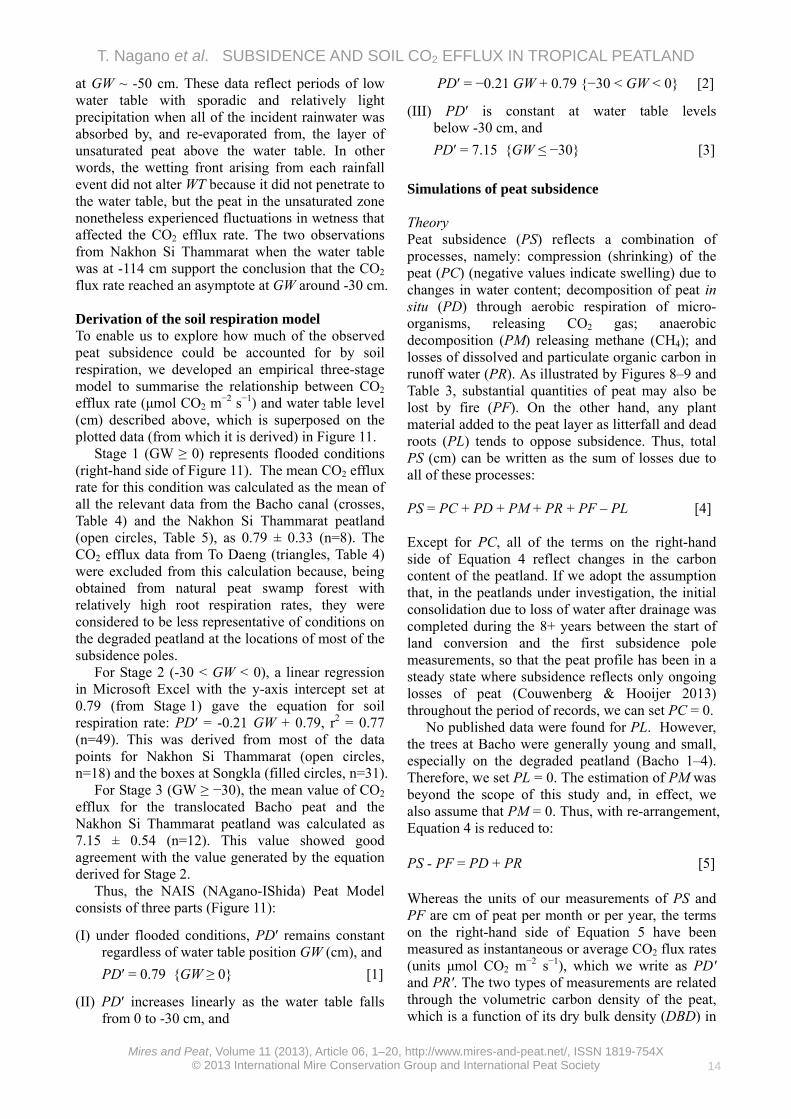
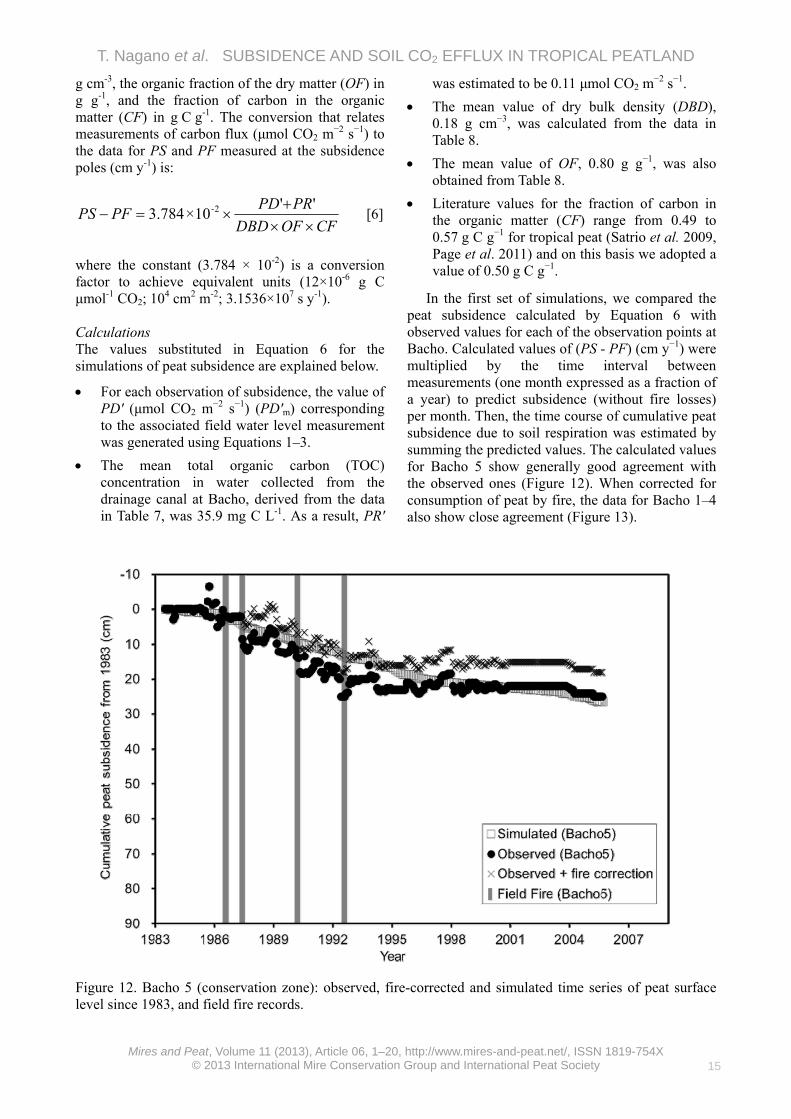
In the first set of simulations, we compared the peat subsidence calculated by Equation 6 with observed values for each of the observation points at Bacho. Calculated values of (PS - PF) (cm y−1) were multiplied by the time interval between measurements (one month expressed as a fraction of a year) to predict subsidence (without fire losses) per month. Then, the time course of cumulative peat subsidence due to soil respiration was estimated by summing the predicted values. The calculated values for Bacho 5 show generally good agreement with the observed ones (Figure 12). When corrected for consumption of peat by fire, the data for Bacho 1–4 also show close agreement (Figure 13).
Figure 12. Bacho 5 (conservation zone): observed, fire-corrected and simulated time series of peat surface level since 1983, and field fire records.
T. Nagano et al. SUBSIDENCE AND SOIL CO2 EFFLUX IN TROPICAL PEATLAND
Figure 13. Bacho 1–4 (degraded peatland): observed, fire-corrected and simulated time series of peat surface level since 1983 or 1989 (Bacho 4), and field fire records. In each case, the simulated data for Bacho 5 (conservation zone, Figure 12) are superposed for comparison.
T. Nagano et al. SUBSIDENCE AND SOIL CO2 EFFLUX IN TROPICAL PEATLAND
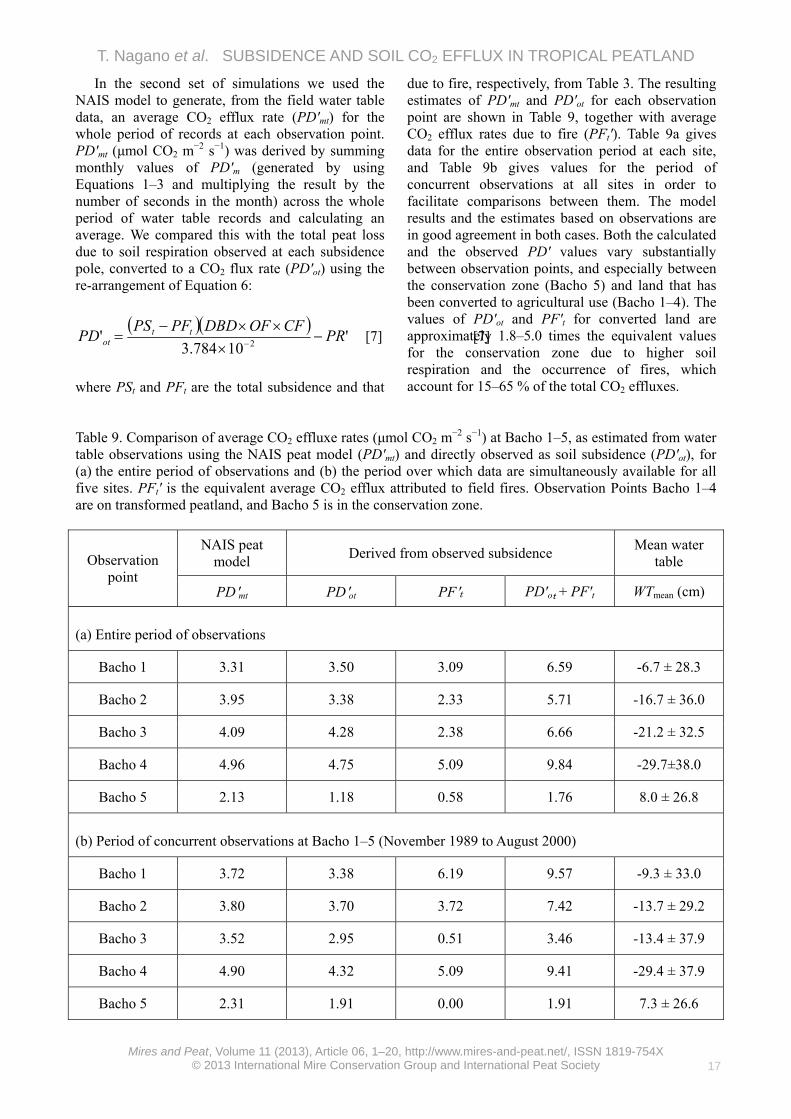
In the second set of simulations we used the NAIS model to generate, from the field water table data, an average CO2 efflux rate (PD′mt) for the whole period of records at each observation point. PD'mt (μmol CO2 m
−2 s−1) was derived by summing monthly values of PD'm (generated by using Equations 1–3 and multiplying the result by the number of seconds in the month) across the whole period of water table records and calculating an average. We compared this with the total peat loss due to soil respiration observed at each subsidence pole, converted to a CO2 flux rate (PD′ot) using the re-arrangement of Equation 6:
'10784.3
'2
PRCFOFDBDPFPS
PD ttot
[7] [7]
where PSt and PFt are the total subsidence and that
due to fire, respectively, from Table 3. The resulting estimates of PD'mt and PD'ot for each observation point are shown in Table 9, together with average CO2 efflux rates due to fire (PFt'). Table 9a gives data for the entire observation period at each site, and Table 9b gives values for the period of concurrent observations at all sites in order to facilitate comparisons between them. The model results and the estimates based on observations are in good agreement in both cases. Both the calculated and the observed PD' values vary substantially between observation points, and especially between the conservation zone (Bacho 5) and land that has been converted to agricultural use (Bacho 1–4). The values of PD'ot and PF't for converted land are approximately 1.8–5.0 times the equivalent values for the conservation zone due to higher soil respiration and the occurrence of fires, which account for 15–65 % of the total CO2 effluxes.
Table 9. Comparison of average CO2 effluxe rates (μmol CO2 m
−2 s−1) at Bacho 1–5, as estimated from water table observations using the NAIS peat model (PD'mt) and directly observed as soil subsidence (PD'ot), for (a) the entire period of observations and (b) the period over which data are simultaneously available for all five sites. PFt' is the equivalent average CO2 efflux attributed to field fires. Observation Points Bacho 1–4 are on transformed peatland, and Bacho 5 is in the conservation zone.
Observation point
NAIS peat model
Derived from observed subsidence Mean water
table
PD'mt PD'ot PF't PD'ot + PF't WTmean (cm)
(a) Entire period of observations
Bacho 1 3.31 3.50 3.09 6.59 -6.7 ± 28.3
Bacho 2 3.95 3.38 2.33 5.71 -16.7 ± 36.0
Bacho 3 4.09 4.28 2.38 6.66 -21.2 ± 32.5
Bacho 4 4.96 4.75 5.09 9.84 -29.7±38.0
Bacho 5 2.13 1.18 0.58 1.76 8.0 ± 26.8
(b) Period of concurrent observations at Bacho 1–5 (November 1989 to August 2000)
Bacho 1 3.72 3.38 6.19 9.57 -9.3 ± 33.0
Bacho 2 3.80 3.70 3.72 7.42 -13.7 ± 29.2
Bacho 3 3.52 2.95 0.51 3.46 -13.4 ± 37.9
Bacho 4 4.90 4.32 5.09 9.41 -29.4 ± 37.9
Bacho 5 2.31 1.91 0.00 1.91 7.3 ± 26.6
T. Nagano et al. SUBSIDENCE AND SOIL CO2 EFFLUX IN TROPICAL PEATLAND
DISCUSSION Direct observations of peat subsidence and implications The records of peat subsidence from Bacho are unusual (if not unique) in that they have been maintained for such a long period. They show that, even in the conservation zone, subsidence has been in progress at an average rate of 1.0 cm y-1 for the last 23 years. Thus, a hydrological connection to areas of transformed peat swamp forest might be inferred; or perhaps the fires that burned over this area affected the oxidation dynamics more subtly, e.g. by heating the peat surface or depositing ash, without actually burning any peat. Steady subsidence of the transformed areas has proceeded at approximately three (2.6–3.7) times the rate observed in the conservation zone, and this was boosted to 3.1–5.2 times by peat fires (Table 3).
High subsidence rates resulting from peat shrinkage usually occur immediately after drainage when the peat body is compressed mechanically due to the loss of supporting pore water pressure (loss of buoyancy; Schothorst 1977, Stephens et al. 1984, Kennedy & Price 2005, Couwenberg et al. 2010). Furthermore, Hooijer et al. (2012) report that compression was greatest within the first year after drainage and remained important for five years. Our peat subsidence measurements in the Bacho area started eight years after the natural peat swamp forest was initially drained. Despite this, its surface flooded during rainy seasons thereafter, and the water table was not low throughout the year (Table 3). Indeed, in some cases, the water table appeared to rise relative to the peat surface as subsidence proceeded and especially after fire (see Figures 8 and 9), which introduces the possibility that subsidence may be a self-limiting process because it leads to flooding which, in turn, reduces the rate of soil respiration and may help to reduce the incidence of fire.
Therefore, peat shrinkage resulting from drainage (PC in Equation 4) is assumed to be negligible, and the peat subsidence observed in the development zone (Table 9b) can be taken to reflect the release of 11.2–16.4 Mg C ha−1 y−1 through soil respiration and 13.1–36.2 Mg C ha−1 y−1 due to field fires, giving total average emissions of 24.3–52.6 Mg C ha−1 y−1 over the period (~11 years) of concurrent observations (November 1989–August 2000). The NAIS Peat Model It is well known that the direct measurement of soil respiration rates which is needed to establish robust estimates of greenhouse gas emissions from
peatlands is time consuming, expensive and difficult (e.g. Couwenberg & Hooijer 2013). Our experiences regarding access to the research site underline the potential for unexpected difficulties to arise when undertaking field research in this part of the world. Establishing a proxy variable that is easier to measure automatically or remotely than the gas fluxes themselves is a useful method for extending estimates of CO2 emssions to cover comparable time periods. The correspondence between the observed course of peat subsidence and simulations achieved using the simple empirical NAIS Peat Model is encouraging in this regard, since water table fluctuations can now be recorded at fine resolution between site visits using instruments such as the logging hydrobarometers that were employed during the later stages of the work reported here.
The results generated by the model also support the hypothesis that soil respiration (aerobic decomposition) is the dominant responsible process for the long-term peat subsidence observed. The realism of the model could be improved by incorporating higher-resolution time series of PR and site-specific estimates of the other causes of carbon loss (PM, PL) in Equation 4. However, the agreement between the observed and modelled estimates of PD' suggest that all other carbon fluxes are small relative to that due to soil respiration, and this is confirmed by consideration of two additional pieces of information.
Firstly, we used on-site measurements of TOC in drainage (ditch) water, carried out over a period of two years, to estimate PR′ at 0.11 μmol CO2 m
−2 s−1 in preference to an alternative estimate calculated from the mean of total POC and DOC concentrations (111 mg C L−1) in samples of ponding water collected at two locations on the Bacho peatland in November 1992 (Yoshioka et al. 2002). The latter samples were deemed to be much less representative of the long-term efflux of carbon in drainage water, but would still increase the estimate of PR′ to only 0.34 μmol CO2 m
−2 s−1. Secondly, on the basis of a published value of
7.16 Mg DW ha−1 y−1 for litterfall in a Melaleuca (M. cajuputi and M. viridiflora) forest in Australia (Finlayson et al. 1993), we estimate that the highest likely value of PL′ at Bacho would be 3.58 Mg C ha−1 y−1. The actual input of carbon as litter would range from this value down to zero, due to the recurring fires that may periodically remove vegetation.
The differences between corresponding values of PD'mt and PD'ot in Table 9 range from -0.19 to 0.95 μmol CO2 m−2 s−1, (which corresponds to -0.71 to 3.59 Mg C ha−1 y−1). These differences must arise mostly from the model error in PD'mt and the
T. Nagano et al. SUBSIDENCE AND SOIL CO2 EFFLUX IN TROPICAL PEATLAND
omission of an allowance for PL′ in the calculation of PD'ot. Applying the estimated range of PL′ values derived above conservatively adjusts the maximum estimated model error in calculating PD'mt to -1.14 to 0.95 μmol CO2 m
−2 s−1, again suggesting that the net magnitude of the omitted carbon fluxes is rather small.
Nonetheless, it would be useful to conduct a more formal (statistically verified) comparison of the model outputs with the field observations, as well as to explore its sensitivity to variation of all of its components. A possibility for refining the model arises from the apparent correlation between CO2
efflux rate and the air and soil temperatures that is apparent in Figure 13, as there may be potential here for establishing a second (temperature) surrogate for CO2 flux if needed. Also, it may be useful to revisit the question of whether a CO2 flux value derived from the To Daeng data may give a closer representation of the real situation at Bacho 5, where the peat surface was flooded at the times of 65 % of the subsidence observations (Table 3). Land management aspects Although an undisturbed tropical peatland is an ecosystem that stores carbon, that same ecosystem subsides and releases carbon into the atmosphere if subjected to land development involving drainage. In most cases, peat swamp forest is underlain by marine clay containing pyrite. Ultimately, the clay becomes exposed to air and sulphur contained in the pyrite oxidises to form highly acidic sulphates which rule out any further cultivation (Page et al. 2011), and this is often the ultimate reason for the abandonment of tropical peatland that has been converted to agriculture. Therefore, both to maintain land quality and to assist in the mitigation of global warming, it is necessary at least to re-wet degraded peatlands such that the stored carbon will be preserved and, better, to restore the natural hydrology and vegetation so that the system starts to accumulate peat once again. Where continuing use of the land is required, its management for sustainable biomass production is compatible with these objectives. Afforestation by planting Melaleuca cajuputi, which tolerates flooding (Yamanoshita et al. 2001, 2005), could also be an effective management measure. Suzuki et al. (1999) reported from a study of the net carbon balance of a secondary peat forest in the Bacho area that Melaleuca cajuputi could store 9.6 MgC ha−1 y−1 under permanently flooded conditions.
Appropriate management of groundwater is essential to these objectives. Our results showed that the soil respiration rate varied according to position of the water table, increasing substantially as the
water table descended. The inverse relationship between peat subsidence rates and water table conditions illustrated by Table 3 also underlines the importance of water management in this context. A potential application of the NAIS Peat Model is to help improve water table management so that carbon emissions from peatlands can be better controlled in the future.
For the Bacho peatland, permanent flooding could be achieved by installing a water gate in an appropriate location. This should enable soil respiration to be kept stable at about 3.0 Mg C ha−1 y−1 (equivalent to 0.8 μmol CO2 m−2 y-1). In addition, the danger of field fires on the transformed part of the peatland system could thus be dramatically reduced, to a level similar to that at Bacho 5 in the conservation zone. ACKNOWLEDGEMENTS This article arises from a presentation at the 14th International Peat Congress held in Stockholm, Sweden in June 2012. We thank Professor Jonathan Price, Professor Jack Rieley, Dr Olivia Bragg and three anonymous referees for their insightful and helpful comments on previous versions of the manuscript. Our research was facilitated by grants from the Ministry of Education, Culture, Sports, Science and Technology, Japan; No. 58041023 (1983), No. 59041018 (1984), No. 60041021 (1985), No. 08NP0901 (1995–1999), No. 13374002 (2001–2004) and No. 17255008 (2005–2008). We thank Mr. Tanit Nuyim (Royal Forest Department, Thailand) and the staff of Pikul Thong Royal Development Study Center, Thailand, for supporting the field activities. REFERENCES Couwenberg, J., Dommain, R. & Joosten, H. (2010)
Greenhouse gas fluxes from tropical peatlands in south-east Asia. Global Change Biology, 16(6), 1715−1732.
Couwenberg, J. & Hooijer, A. (2013) Towards robust subsidence-based soil carbon emission factors for peat soils in south-east Asia, with special reference to oil palm plantations. Mires and Peat, 12(01), 1–13.
Finlayson, C.M., Cowie, I.D. & Bailey, B.J. (1993) Litterfall in a Melaleuca forest on a seasonally inundated flood plain in tropical northern Australia. Wetlands Ecology and Management, 2, 177–188.
Hooijer, A., Silvius, M., Wösten, H. & Page, S.
T. Nagano et al. SUBSIDENCE AND SOIL CO2 EFFLUX IN TROPICAL PEATLAND
(2006) PEAT-CO2, Assessment of CO2 Emissions From Drained Peatlands in SE Asia. Delft Hydraulics Report Q3943, Delft, The Netherlands, 36 pp.
Hooijer, A., Page, S., Jauhiainen, J., Lee, W.A., Lu, X.X., Idris, A. & Anshari, G. (2012) Subsidence and carbon loss in drained tropical peatlands. Biogeosciences, 9, 1053–1071,
Kennedy, G.W. & Price, J.S. (2005) A conceptual model of volume-change controls on the hydrology of cutover peats. Journal of Hydrology, 302, 13–27, DOI: 10.1016/j.jhydrol. 2004.06.024.
Okazaki, M. & Yonebayashi, K. (1992) Sampling sites and sample soils - description and general characteristics. In: Kyuma, K., Vijarnsorm, P. & Zakaria, A. (eds.) Coastal Swamp Land in Southern Thailand and Malaysia, Nodai Center for International Programs, Tokyo University of Agriculture, Tokyo, 55−86.
Page, S.E., Rieley, J.O. & Banks, C.J. (2011) Global and regional importance of the tropical peatland carbon pool. Global Change Biology, 17, 798–818.
Piotrowska, N., Blaauw, M., Mauquoy, D. & Chambers, F.M. (2011) Constructing deposition chronologies for peat deposits using radiocarbon dating. Mires and Peat, 7(10), 1–14.
Satrio, A.E., Gandaseca, S., Ahmed, O.H. & Majid, M.A. (2009) Influence of chemical properties on soil carbon storage of a tropical peat swamp forest. American Journal of Applied Sciences, 6(11), 1969–1972.
Schothorst, C.J. (1977) Subsidence of low moor peat soils in the western Netherlands. Geoderma, 17, 265–291.
Stephens, J.C., Allen, L.H. & Chen, E. (1984) Organic soil subsidence. In: Holzer, T.L. (ed.) Man Induced Land Subsidence, Geological Society of America, Boulder, USA, 107–122.
Suzuki, S., Ishida, T., Nagano, T. & Matsukawa, S. (1997) Influences of deforestation on radiation and heat balances in tropical peat swamp forest in Thailand. Environmental Control in Biology, 35(4), 267−274 (in Japanese with English abstract).
Suzuki, S., Ishida, T., Nagano, T. & Waijaroen, S. (1999) Influences of deforestation on carbon
balance in a natural tropical peat swamp forest in Thailand. Environmental Control in Biology, 37(2), 115−128.
Suzuki, K. & Niyomdham, C. (1992) Phyto-sociological studies on tropical peat swamp. In: Kyuma, K., Vijarnsorm, P. & Zakaria, A. (eds.) Coastal Swamp Land in Southern Thailand and Malaysia, Nodai Center for International Programs, Tokyo University of Agriculture, Tokyo, 88−121.
Vijarnsorn, P. (1996) Soil Ecosystem of the Coastal Wetlands in Thailand. NODAI Research Institute, Tokyo University of Agriculture, Tokyo, 208 pp.
World Climate (2012) Average values for the period 1961–1990. Online at: http://www.climate-charts. com/Locations/t/TH48552.php; http://www. climate-charts.com/Locations/t/TH48568.php; and http://www.climate-charts.com/Locations/t/ TH48583.php. Accessed June 2013.
Yamanoshita, T., Masumori, M., Yagi, H. & Kojima, K. (2005) Effects of flooding on downstream processes of glycolysis and fermentation in roots of Melaleuca cajuputi seedlings. Journal of Forest Research, 10, 199–204.
Yamanoshita, T., Nuyim, T., Masumori, M., Tange, T., Kojima, K., Yagi, H. & Sasaki, S. (2001) Growth response of Melaleuca cajuputi to flooding in a tropical peat swamp. Journal of Forest Research, 6, 217–219.
Yonebayashi, K., Okazaki, M. & Pechayapisit, J. (1992) Woody fragments in tropical peat soils. In: Kyuma, K., Vijarnsorn, P. & Zakaria, A. (eds.) Coastal Lowland Ecosystems in Southern Thailand and Malaysia, Showado-Printing Company, Kyoto, 233–247.
Yoshino, K., Ishida, T., Nagano, T., Ishioka, Y. & Sirichuaychoo, W. (2002) Distribution of peat depth in tropical swamp peat area in Narathiwat of the southern part of Thailand. Rural and Environmental Engineering, 43, 13–22.
Yoshioka, T., Ueda, S., Miyajima, T., Wada, E., Yoshida, N., Sugimoto, A., Vijarnsorn, P. & Boonprakub, S. (2002) Biogeochemical properties of a tropical swamp forest ecosystem in southern Thailand. Limnology, 3, 51–59.
Submitted 31 Aug 2012, final revision 07 Dec 2013 Editor: Olivia Bragg
_______________________________________________________________________________________ Author for correspondence: Professor Toshihide Nagano, Faculty of Agriculture, Utsunomiya University, Japan Telephone: +81297580417; Email: [email protected] or [email protected]


![COMMENTARY Antibiotic Efflux Pumps · the drug efflux pumps in eucaryotic cells ( [7]; drug efflux transporters are classically energized by ATP). The second-ary active transporters,](https://static.documents.pub/doc/80x56/6132c0d4dfd10f4dd73aa6ef/commentary-antibiotic-efflux-pumps-the-drug-efflux-pumps-in-eucaryotic-cells-7.jpg)


