Subsidiary Initiatives in International Research and Development: A Survival Analysis D I S S E R T A T I O N of the University of St. Gallen Graduate School of Business Administration, Economics, Law and Social Sciences (HSG) to obtain the title of Doctor Oeconomiae submitted by Marcus Matthias Keupp from Germany Approved on the application of Prof. Dr. Oliver Gassmann and Prof. Dr. Andreas Herrmann Dissertation no. 3467 Difo-Druck, Bamberg
Transcript
Subsidiary Initiatives in International Research and Development:
A Survival Analysis
D I S S E R T A T I O N of the University of St. Gallen
Graduate School of Business Administration, Economics, Law and Social Sciences (HSG)
to obtain the title of Doctor Oeconomiae
submitted by
Marcus Matthias Keupp
from Germany
Approved on the application of
Prof. Dr. Oliver Gassmann
and
Prof. Dr. Andreas Herrmann
Dissertation no. 3467
Difo-Druck, Bamberg
II
The University of St. Gallen, Graduate School of Business Administration, Economics, Law and Social Sciences (HSG) hereby consents to the printing of the present dissertation, without hereby expressing any opinion on the views herein expressed. St. Gallen, May 14, 2008
The President Prof. Ernst Mohr, PhD
III
TABLE OF CONTENTS
SUMMARY ........................................................................................................................................................................ V
FOREWORD .................................................................................................................................................................... VI
LIST OF TABLES .......................................................................................................................................................... VII
LIST OF FIGURES ...................................................................................................................................................... VIII
1.1 TERMS AND DEFINITIONS ........................................................................................................................................... 2
1.2 THE RESEARCH PROBLEM ......................................................................................................................................... 2
1.3 STATE OF THE ART ..................................................................................................................................................... 6
1.4 RESEARCH GAPS AND RELEVANCE ........................................................................................................................... 8
1.5 RESEARCH QUESTIONS ............................................................................................................................................ 11
1.6 METHODOLOGY AND FURTHER STRUCTURE .......................................................................................................... 11
2. CONCEPTUAL DEVELOPMENT ............................................................................................................................ 12
2.1 A COMMUNICATION MODEL OF SUBSIDIARY INITIATIVES .................................................................................... 12
2.2 ANALYSIS OF THE SIX ELEMENTS ........................................................................................................................... 15
4. DATA AND METHODS .............................................................................................................................................. 33
4.1 RESEARCH SETTING ................................................................................................................................................. 33
4.2 POPULATION AND SAMPLE ....................................................................................................................................... 34
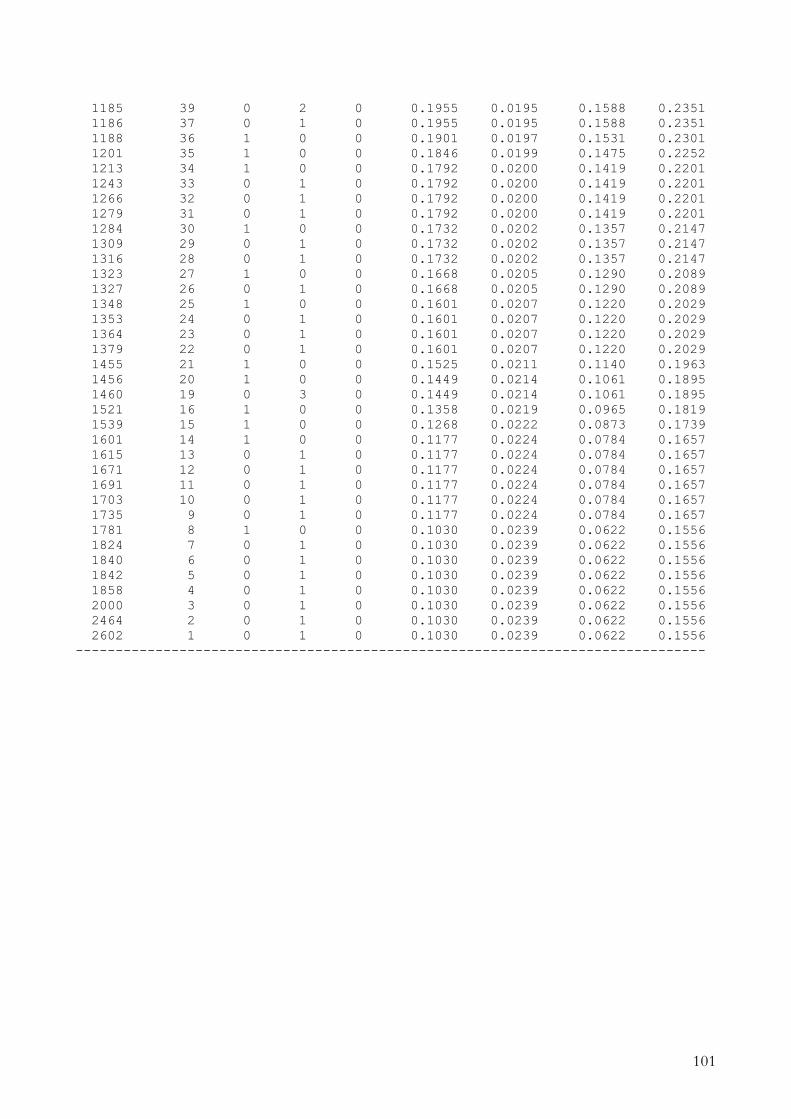
5.2.1 Graphical analysis for the overall data set ...................................................................................................... 50
5.2.2 Graphical analysis by comparing groups......................................................................................................... 53
5.2.3 Results of nonparametric tests .......................................................................................................................... 71
5.4.1 Comparative model estimation ......................................................................................................................... 77
5.4.2 Model post-estimation ....................................................................................................................................... 83
5.5 OUTCOMES OF HYPOTHESIS TESTING ..................................................................................................................... 85
6. DISCUSSION AND IMPLICATIONS ....................................................................................................................... 86
6.1 CAUSAL INFERENCES FROM FINDINGS .................................................................................................................... 86
6.2 IMPLICATIONS FOR RESEARCH ................................................................................................................................ 87
6.3 CONTRIBUTIONS TO THEORY ................................................................................................................................... 88
6.3.1 Contributions to theory on subsidiary initiatives ............................................................................................. 88
6.3.2 Contributions to theory on international R&D and the under-utilisation problem ....................................... 89
6.4 IMPLICATIONS FOR MANAGEMENT PRACTICE ........................................................................................................ 90
6.5 LIMITATIONS AND PATHS FOR FURTHER RESEARCH .............................................................................................. 91
MARCUS MATTHIAS KEUPP .................................................................................................................................... 125
V
Summary My dissertation examines why subsidiary initiatives differ with respect to their survival probability and identifies several initiative-related factors that cause this difference. I conduct this examination within the context of the global research and development (R&D) organisation of a multinational company (MNC). My research therefore intends to answer a primary research question: What
determines the probability of survival of an initiative sent by a foreign R&D subsidiary? To answer this research question, I proceed as follows: First, to frame the problem within both the subsidiary initiative and international R&D literature, I set out the problem of under-utilisation of R&D resources, that is, the effect that occurs when most innovations still come from the MNC's parent firm, even though the MNC controls the resources of its international R&D subsidiaries. Although past research has advocated that in such a setting, subsidiaries should take an entrepreneurial stance and send initiatives to the parent firm to achieve better leverage of their resources and capabilities, empirical results consistently suggest that the problem of under-utilisation is still not mitigated. This effect in turn suggests that most subsidiary initiatives are bound to fail. Thus, an investigation of why one initiative survives while another fails is appropriate. To address this problem, I first develop a theoretical model of the subsidiary initiative process, based on an analogy constructed on a foundation of communication psychology. This model identifies six elements that shape the initiative process. To ensure data availability for empirical testing and better control of unobserved variance, I then focus on one of these six elements, namely, initiative characteristics. Subsequently, I develop six hypotheses that describe initiative characteristics upon which the survival or failure of a subsidiary initiative may depend. After commenting on the statistical method of survival analysis that I employ throughout this dissertation, I test these hypotheses using a sample of 1,116 subsidiary initiatives that I collected from the global R&D organisation of a Swiss MNC. I extracted these initiative data directly from the firm's initiative database. This research setting allows me to collect unprecedented data on subsidiary initiatives, to rule out problems of unobserved between-firm heterogeneity, unobservable environmental influences, and measurement error from subjective respondents, and to study the MNC's intra-firm organisation directly rather than by proxy measures. The findings show that initiative survival is positively influenced by the social and geographical closeness of the issuing R&D subsidiary to headquarters, the initiative's alignment with the firm's core areas of activity, and the manager's past success record (i.e., the number of already recognised initiatives sent by that manager). Moreover, initiatives that propose exploitative innovation are more likely to survive than initiatives that propose exploratory innovation. However, inter-subsidiary collaboration has no significant influence on initiative survival. Finally, I discuss the findings and outcomes of my research and show their implications for theory development and management practice. I also comment on some limitations that suggest opportunities for further research.
VI
Foreword This dissertation is dedicated to all those human beings who have loved me, helped me, and supported me in my life. Without them, I would not be the man I am, I would not be in this place and position, and this dissertation would not exist. I humbly and profoundly thank them all.
VII
List of Tables TABLE 1: THE FIRM'S RESEARCH PROGRAMMES ...................................................................................................................... 35 TABLE 2: VARIABLES AND CODING ......................................................................................................................................... 37 TABLE 3: OVERVIEW OF PARAMETRIC SURVIVAL TIME MODELS ............................................................................................... 43 TABLE 4: FREQUENCY DISTRIBUTION OF INITIATIVES (SUCCESSFUL INITIATIVES IN BRACKETS). ............................................... 46 TABLE 5: DESCRIPTIVE STATISTICS BY VARIABLE .................................................................................................................... 47 TABLE 6: CORRELATIONS (I).................................................................................................................................................. 48 TABLE 7: CORRELATIONS (II) ................................................................................................................................................ 49 TABLE 8: CORRELATIONS (III) ............................................................................................................................................... 50 TABLE 9: CORRELATIONS (IV) ............................................................................................................................................... 50 TABLE 10: RESULTS OF NONPARAMETRIC TESTS ..................................................................................................................... 72 TABLE 11: SIGNIFICANCE OF SCHOENFELD AND SCALED SCHOENFELD RESIDUALS ................................................................ 73 TABLE 12: COMPARISON OF BEST-FITTING MODELS IN PROPORTIONAL HAZARD METRIC ......................................................... 78 TABLE 13: COMPARISON OF BEST-FITTING MODELS IN ACCELERATED FAILURE TIME METRIC .................................................. 79 TABLE 14: FINAL COMPARISON BETWEEN BEST-FITTING PARAMETRIC MODEL AND ANALOGOUS COX MODEL .......................... 85
List of Figures FIGURE 1: THE CLASSICAL COMMUNICATION MODEL AND THE ANALOGY FOR STRATEGIC INITIATIVES ..................................... 13 FIGURE 2: RAW DATA HISTOGRAM FOR SURVIVAL TIME .......................................................................................................... 45 FIGURE 3: KAPLAN-MEIER ESTIMATE OF THE SURVIVOR FUNCTION FOR THE COMPLETE SAMPLE ........................................... 51 FIGURE 4: NELSON-AALEN ESTIMATE OF THE HAZARD FUNCTION FOR THE COMPLETE SAMPLE .............................................. 51 FIGURE 5: KAPLAN-MEIER SURVIVOR FUNCTION AND CONVERTED NELSON-AALEN ESTIMATES .............................................. 52 FIGURE 6: NELSON-AALEN CUMULATIVE HAZARD FUNCTION AND CONVERTED KAPLAN-MEIER ESTIMATE .............................. 52 FIGURE 7: GAUSSIAN KERNEL SMOOTHED ESTIMATE OF THE HAZARD FUNCTION FOR THE COMPLETE SAMPLE. ....................... 53 FIGURE 8: KAPLAN-MEIER SURVIVOR ESTIMATE FOR INITIATIVES FROM SWISS VERSUS OTHER RESEARCH CENTRES ................. 55 FIGURE 9: NELSON-AALEN CUMULATIVE HAZARD ESTIMATE FOR INITIATIVES FROM SWISS VERSUS OTHER RESEARCH CENTRES
..................................................................................................................................................................................... 55 FIGURE 10: GAUSSIAN KERNEL SMOOTHED ESTIMATE OF THE HAZARD FUNCTION FOR INITIATIVES FROM SWISS VERSUS OTHER
RESEARCH CENTRES ...................................................................................................................................................... 56 FIGURE 11: KAPLAN-MEIER SURVIVAL ESTIMATE FOR INITIATIVES FROM SWEDISH VERSUS OTHER RESEARCH CENTRES .......... 56 FIGURE 12: NELSON-AALEN CUMULATIVE HAZARD ESTIMATE FOR INITIATIVES FROM SWEDISH VERSUS OTHER RESEARCH
CENTRES ....................................................................................................................................................................... 57 FIGURE 13: GAUSSIAN KERNEL SMOOTHED ESTIMATE OF THE HAZARD FUNCTION FOR INITIATIVES FROM SWEDISH VERSUS
OTHER RESEARCH CENTRES ........................................................................................................................................... 57 FIGURE 14: KAPLAN-MEIER SURVIVAL ESTIMATE FOR INITIATIVES FROM CHINESE VERSUS OTHER RESEARCH CENTRES .......... 58 FIGURE 15: NELSON-AALEN CUMULATIVE HAZARD ESTIMATE FOR INITIATIVES FROM CHINESE VERSUS OTHER RESEARCH
CENTRES ....................................................................................................................................................................... 58 FIGURE 16: GAUSSIAN KERNEL SMOOTHED ESTIMATE OF THE HAZARD FUNCTION FOR INITIATIVES FROM CHINESE VERSUS
OTHER RESEARCH CENTRES ........................................................................................................................................... 59 FIGURE 17: KAPLAN-MEIER SURVIVAL ESTIMATE FOR INITIATIVES FROM RESEARCH PROGRAMME 2 VERSUS OTHER RESEARCH
PROGRAMMES. .............................................................................................................................................................. 59 FIGURE 18: NELSON-AALEN CUMULATIVE HAZARD ESTIMATE FOR INITIATIVES FROM RESEARCH PROGRAMME 2 VERSUS OTHER
RESEARCH PROGRAMMES ............................................................................................................................................... 60 FIGURE 19: GAUSSIAN KERNEL SMOOTHED ESTIMATE OF THE HAZARD FUNCTION FOR INITIATIVES FROM RESEARCH
PROGRAMME 2 VERSUS OTHER RESEARCH PROGRAMMES ................................................................................................ 60 FIGURE 20: KAPLAN-MEIER SURVIVAL ESTIMATE FOR INITIATIVES FROM RESEARCH PROGRAMME 14 VERSUS OTHER RESEARCH
PROGRAMMES. .............................................................................................................................................................. 61 FIGURE 21: NELSON-AALEN CUMULATIVE HAZARD ESTIMATE FOR INITIATIVES FROM RESEARCH PROGRAMME 14 VERSUS OTHER
RESEARCH PROGRAMMES. .............................................................................................................................................. 61 FIGURE 22: GAUSSIAN KERNEL SMOOTHED ESTIMATE OF THE HAZARD FUNCTION FOR INITIATIVES FROM RESEARCH
PROGRAMME 14 VERSUS OTHER RESEARCH PROGRAMMES .............................................................................................. 62 FIGURE 23: KAPLAN-MEIER SURVIVAL ESTIMATE FOR INITIATIVES FROM RESEARCH PROGRAMME 17 VERSUS OTHER RESEARCH
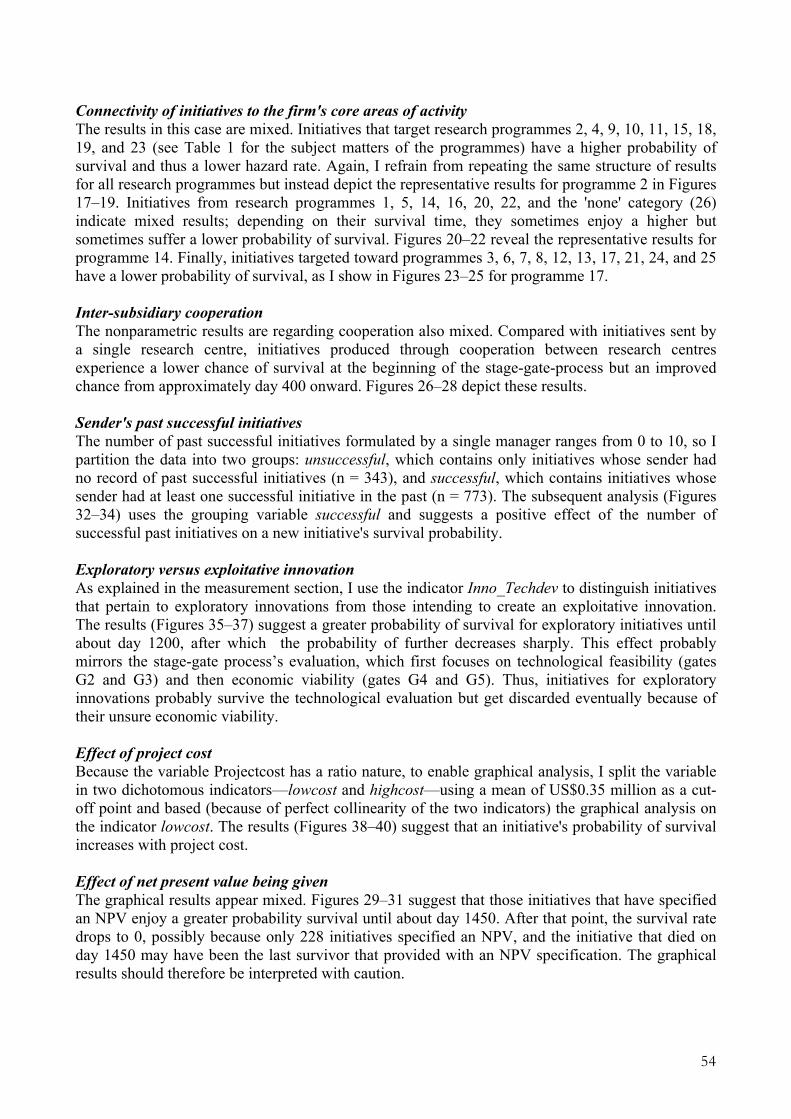
PROGRAMMES. .............................................................................................................................................................. 62 FIGURE 24: NELSON-AALEN CUMULATIVE HAZARD ESTIMATE FOR INITIATIVES FROM RESEARCH PROGRAMME 17 VERSUS OTHER
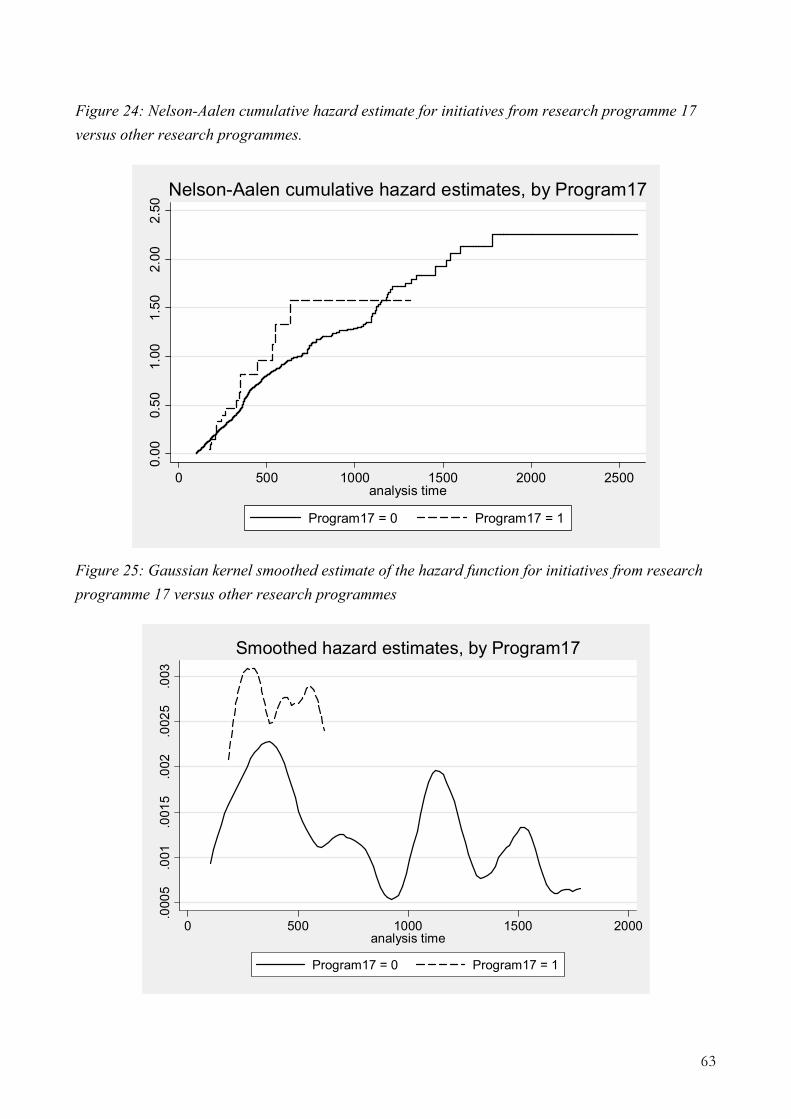
RESEARCH PROGRAMMES. .............................................................................................................................................. 63 FIGURE 25: GAUSSIAN KERNEL SMOOTHED ESTIMATE OF THE HAZARD FUNCTION FOR INITIATIVES FROM RESEARCH
PROGRAMME 17 VERSUS OTHER RESEARCH PROGRAMMES .............................................................................................. 63 FIGURE 26: KAPLAN-MEIER SURVIVAL ESTIMATE FOR INITIATIVES GENERATED BY INTER-CENTRE COOPERATION VERSUS OTHER
INITIATIVES ................................................................................................................................................................... 64 FIGURE 27: NELSON-AALEN CUMULATIVE HAZARD ESTIMATE FOR INITIATIVES GENERATED BY INTER-CENTRE COOPERATION
VERSUS OTHER INITIATIVES ............................................................................................................................................ 64 FIGURE 28: GAUSSIAN KERNEL SMOOTHED ESTIMATE OF THE HAZARD FUNCTION FOR INITIATIVES GENERATED BY INTER-
CENTRE COOPERATION VERSUS OTHER INITIATIVES ........................................................................................................ 65 FIGURE 29: KAPLAN-MEIER SURVIVAL ESTIMATE FOR INITIATIVES WHOSE SENDING MANAGER HAD AT LEAST ONE SUCCESSFUL
INITIATIVE IN THE PAST VERSUS OTHER INITIATIVES ........................................................................................................ 65 FIGURE 30: NELSON-AALEN CUMULATIVE HAZARD ESTIMATE FOR INITIATIVES WHOSE SENDING MANAGER HAD AT LEAST ONE
SUCCESSFUL INITIATIVE IN THE PAST VERSUS OTHER INITIATIVES .................................................................................... 66 FIGURE 31: GAUSSIAN KERNEL SMOOTHED ESTIMATE OF THE HAZARD FUNCTION FOR INITIATIVES WHOSE SENDING MANAGER
HAD AT LEAST ONE SUCCESSFUL INITIATIVE IN THE PAST VERSUS OTHER INITIATIVES ....................................................... 66 FIGURE 32: KAPLAN-MEIER SURVIVAL ESTIMATE FOR EXPLORATORY VERSUS EXPLOITATIVE INITIATIVES ................................ 67 FIGURE 33: NELSON-AALEN CUMULATIVE HAZARD ESTIMATE FOR EXPLORATORY VERSUS EXPLOITATIVE INITIATIVES ............. 67 FIGURE 34: GAUSSIAN KERNEL SMOOTHED ESTIMATE OF THE HAZARD FUNCTION FOR EXPLORATORY VERSUS EXPLOITATIVE
INITIATIVES ................................................................................................................................................................... 68 FIGURE 35: KAPLAN-MEIER SURVIVAL ESTIMATE FOR THE EFFECT OF ESTIMATED PROJECT COST .......................................... 68 FIGURE 36: NELSON-AALEN CUMULATIVE HAZARD ESTIMATE FOR THE EFFECT OF ESTIMATED PROJECT COST ....................... 69
IX
FIGURE 37: GAUSSIAN KERNEL SMOOTHED ESTIMATE FOR THE EFFECT OF PROJECT COST ..................................................... 69 FIGURE 38: KAPLAN-MEIER SURVIVAL ESTIMATE FOR INITIATIVES WITH DESIGNATED NPV CALCULATION VERSUS OTHER
INITIATIVES ................................................................................................................................................................... 70 FIGURE 39: NELSON-AALEN CUMULATIVE HAZARD ESTIMATE FOR INITIATIVES WITH DESIGNATED NPV CALCULATION VERSUS
OTHER INITIATIVES ........................................................................................................................................................ 70 FIGURE 40: GAUSSIAN KERNEL SMOOTHED ESTIMATE OF THE HAZARD FUNCTION FOR INITIATIVES WITH DESIGNATED NPV
CALCULATION VERSUS OTHER INITIATIVES ...................................................................................................................... 71 FIGURE 41: LOG-LOG CURVES FOR THE COVARIATE FROMCH ............................................................................................... 74 FIGURE 42: LOG-LOG CURVES FOR THE COVARIATE PASTSUCCESS ......................................................................................... 74 FIGURE 43: LOG-LOG CURVES FOR THE COVARIATE PROJECTCOST ........................................................................................ 75 FIGURE 44: COMPARISON OF KAPLAN-MEIER AND COX SURVIVOR FUNCTIONS FOR THE COVARIATE FROMCH ....................... 75 FIGURE 45: COMPARISON OF KAPLAN-MEIER AND COX SURVIVOR FUNCTIONS FOR THE COVARIATE PASTSUCCESS ................ 76 FIGURE 46: COMPARISON OF KAPLAN-MEIER AND COX SURVIVOR FUNCTIONS FOR THE COVARIATE PROJECTCOST ............... 76 FIGURE 47: COX-SNELL RESIDUALS FOR THE EXPONENTIAL MODEL ....................................................................................... 80 FIGURE 48: COX-SNELL RESIDUALS FOR THE WEIBULL MODEL ............................................................................................. 80 FIGURE 49: COX-SNELL RESIDUALS FOR THE LOG-NORMAL MODEL ....................................................................................... 81 FIGURE 50: COX-SNELL RESIDUALS FOR THE LOG-LOGISTIC MODEL ...................................................................................... 81 FIGURE 51: COX-SNELL RESIDUALS FOR THE GAMMA MODEL ................................................................................................ 82 FIGURE 52: COX-SNELL RESIDUALS FOR THE GOMPERTZ MODEL .......................................................................................... 82 FIGURE 53: SURVIVOR FUNCTION ESTIMATE OF THE BEST-FITTING LOG-NORMAL MODEL ....................................................... 83 FIGURE 54: HAZARD RATE ESTIMATE OF THE BEST-FITTING LOG-NORMAL MODEL .................................................................. 84 FIGURE 55: CUMULATIVE HAZARD RATE ESTIMATE OF THE BEST-FITTING LOG-NORMAL MODEL ............................................. 84
1
All animals are equal, but some animals are more equal than others.
—George Orwell, Animal Farm
Beatus ille qui procul negotiis.
—Horace, Liber Epodon, II, 1
2
1. Introduction 1.1 Terms and Definitions
In this dissertation, I repeatedly use concepts and operationalisations that are key to the understanding of the following arguments and hypotheses. I therefore define these notions here for future reference. Multinational company (henceforth, MNC). I conceive of a multinational company (MNC) as comprising a set of geographically dispersed subsidiaries that combine heterogeneous technological competencies and product-market responsibilities (Nohria and Ghoshal, 1997; Galunic and Eisenhardt, 2001). The firm typically consists of a parent firm (headquarters) and a number of subsidiaries based both within the same country as headquarters and abroad. All of these sub-units pursue competitive exchange relationships with one another (Halal, 1993; Galunic and Eisenhardt, 1996). A foreign subsidiary is any operational unit controlled by the MNC and situated outside the home country (Birkinshaw, 1997). Research and development (R&D). I use the Frascati manual definition of R&D, which entails basic research, applied research, and development work that leads to new devices, products, or processes (OECD, 2002: 30). Consequently, international R&D is the specific form of R&D that results from such activities being pursued by a certain distribution of R&D tasks across the MNC's headquarters and its international subsidiaries. Subsidiary initiative. I define the term 'initiative' using Birkinshaw's definition of a discrete, proactive undertaking that advances a new way for the corporation to use or expand its resources. An initiative is essentially entrepreneurial process, beginning with the identification of an opportunity and culminating in the commitment of resources to that opportunity. An initiative constitutes its own unit of analysis and exists separately from the firm (Birkinshaw, 1997). Recognition/Survival (used interchangeably). By recognition, I designate the final acceptance of an initiative. With recognition, an initiative achieves some form of sufficient legitimation, either in the form of a resource commitment or approval of further knowledge creation (Van de Ven, 1986). Recognition of an initiative thus marks the end of the initiative process (Birkinshaw, 1997). 1.2 The Research Problem
Multinational companies conduct an ever-increasing share of their innovation activities in countries other than their home country (Pearce and Singh, 1992; Cantwell, 1995; Granstrand, 1999; von Zedtwitz and Gassmann, 2002; UNCTAD, 2005). This statement may be correct if the growth of foreign R&D sites is taken as a measure of the increase of foreign R&D activities. In a survey that spanned 186 R&D-intensive multinational companies from 19 countries and 17 industry sectors, Doz et al. (2006) find that 66% of these firms' R&D sites were foreign sites, that is, located in a country other than the firm's headquarters. In 1975, 55% of all R&D sites were located in the respective firm's home country, 31% were located in Western Europe, 9% in the United States, and 5% in diverse other regions. By 2004, this picture had clearly changed toward a significant internationalisation of R&D: Now, only 34% of all R&D sites are located in the home country, compared with 28% in Western Europe, 16% in the United States, 9% in China, 5% in India, and 9% in other diverse regions. This spread of R&D activities demonstrates the increasing importance of China and India as destinations.
3
Theoretically, such a globally dispersed network of R&D units promises great benefits. In international innovation structures, the capabilities of each international subsidiary could be leveraged to contribute to the firm's global competitive advantage (Ghoshal and Nohria, 1989). In such an organisation, innovation is no longer simply the responsibility of the corporate centre (Nohria and Ghoshal, 1997). The parent firm has thus changed its role from 'technology creator' to 'technology organiser', so that foreign subsidiaries not only serve the traditional function of adapting the MNC's technology to local market needs but also become significant sources of technology development themselves (Cantwell, 2001). Therefore, in firms with a global R&D organisation, subsidiaries could act as contributors to or even leaders of innovation projects (Bartlett and Ghoshal, 1986) and thus provide major outflows of valued resources to the rest of the corporation (Gupta and Govindarajan, 1994). This presumed ability of MNCs to leverage their competencies across dispersed subsidiaries is considered an increasingly important source of competitive performance (Doz et al., 2001). There may also be cross-fertilisation effects between subsidiaries, in that operations of one subsidiary may benefit from inputs of other subsidiaries, so that an efficient system of subsidiary specialisation and interdependence emerges over time (Birkinshaw, 1996; Birkinshaw and Ridderstråle, 1999). Thus, the MNC is seen as a vehicle for worldwide learning across a multinational network of foreign subsidiaries (Hedlund 1986; Doz and Prahalad, 1987; Bartlett and Ghoshal, 1989; Nohria and Ghoshal, 1997). Unfortunately, research conducted in the past 15 years consistently suggests that in international R&D organisations, these benefits are largely theoretical and have hardly, if at all, been realised. All available data unanimously suggest that there is a problem of under-utilisation of R&D
resources—most innovations are created by the home country and headquarters R&D, whereas the R&D resources of foreign subsidiaries are neglected. Doz et al. (2006) find an odd distribution of R&D tasks, capabilities, and activities between home country and foreign R&D sites. Specifically, only 6% of the home country R&D sites they study performed customisation for local markets. However, 19% had a development centre with specific expertise, 9% had full development capabilities, 29% engaged in core-only technology research, and 40% had both core technology research and full development capabilities. In contrast, only 15% of the foreign R&D sites had both core technology research and full development capabilities, only 17% did core-only technology research, 13% had full development capabilities, 32% had a development centre with specific expertise, and 23% customised for local markets. The authors concluded that this asymmetric distribution signals that most core technology-oriented research and development 'stays at home', whereas foreign R&D sites remain largely restricted to development activities. Another striking finding of their study is the reluctance of firms to actively tap the potential that resides in their foreign R&D sites. Only around half of the 189 companies actively sought out dispersed knowledge in their global R&D network. Moreover, actions to leverage the dispersed knowledge that resides in foreign R&D sites appears to be the exception rather than the rule, as reflected in the relatively few international R&D projects (i.e., projects undertaken across multiple R&D sites and involving at least one foreign R&D site). Doz et al. (2006: 11) detail that irrespective of the growth of foreign R&D sites, the actual percentage of international R&D projects is, on average, 36% of all projects, and less than one-third of companies conduct at least half of their innovation projects across two or more sites. Ironically, the highest level of internationally dispersed R&D projects (48%) appears in the consumer goods sector (commonly regarded as 'low-tech'!), rather than in classical high-tech sectors such as electronics (44%), pharmaceutical (42%), chemical (33%), or automotive (32%) industries.
4
In turn, in 2006 even in the most 'internationalised' industry sector, approximately 52% of all innovations were developed without the involvement of any foreign R&D site and exclusively by home country sites—even though all those firms were 'global' MNCs that possessed and controlled international R&D sites and resources for international innovation processes and had the necessary technology for intra-firm knowledge exchange. These results are consistent with earlier findings. In his study based on 82 firms, Pearce (1990) finds that in only 25% of firms was 'promising' knowledge developed by subsidiaries or decentralised R&D laboratories actually transferred to the central laboratories. In 1991, a significant share of large U.S. firms across different sectors had very little or no international R&D at all (Patel and Pavitt, 1991), a situation that still prevailed in 2003: most R&D 'stays at home' (Benito et al., 2003). Fors (1997), in a study of 121 Swedish multinational manufacturing firms from 1965 to 1990, finds that approximately four-fifths of the gain in value added that was attributed to the home R&D was realised in the MNC's home plants. Analysing an in-depth case study from the pharmaceutical industry, Currie and Kerrin (2004) show that international R&D processes were infeasible, despite a generous resource and ICT infrastructure that enabled intra-firm knowledge exchange. Furthermore, though internal recombinations of dispersed intra-firm knowledge theoretically allow firms to establish and retain the competitive advantage that arises from such recombinations for a longer duration (Chesbrough and Teece, 1996), empirical results show that not all knowledge held by a firm gets used in its internal recombination processes (Podolny and Stuart, 1995). Almeida and Phene (2004) find that though foreign subsidiaries in general had slightly more linkages to the MNC than to the host country, these linkages were less likely to result in innovations. This observation holds throughout all industry sectors. It also shows that this phenomenon is not an effect of the unavailability of sophisticated ICT technology before 1995 (e.g., knowledge-sharing databases), but rather points to a structural problem. The findings of Perks and Jeffery (2006) suggest that though a successful innovation network configuration theoretically involves recognising where the innovation value resides in the network and developing capabilities and mechanisms to understand and access such value, practically, this effort is problematic for firms that remain embedded in their own base of knowledge and relationship patterns. Historically, firms have inadvertently acquired most foreign R&D units as a by-product of international mergers and acquisitions (Mowery, 1998; Cantwell and Mudambi, 2005). Many of these individual establishments have little or no history of cooperation, or they may have been competitors before the merger. It is therefore easy to imagine the managerial problems resulting from realigning and integrating these units into a new global innovation network. Persaud (2005) shows that the global dispersion of R&D activities does not necessarily lead to improvements in innovative capabilities and that very little research has been undertaken to show how the various R&D structures adopted by MNCs affect their abilities to generate and deploy innovations globally. Thus, the under-utilisation of international innovation networks, reported as early as 1990, still prevails, though companies have invested in ICT and intra-firm knowledge-exchange mechanisms. Again, this status points to structural problems that impede leveraging the expertise of foreign R&D subsidiaries and that are still undisclosed by research on international R&D. The probability of recognising the subsidiary's expertise thus does not seem to be merely a question of knowledge transfer.
5
All of these findings confirm a widespread effect: surprisingly few companies actually utilise the international research and development (R&D) structure of their foreign subsidiaries, despite legally possessing them and physically owning the necessary resources. Because it seems unlikely that firms would invest in international R&D sites and then not tap their potential, one can assume problems exist in the conduct of international R&D processes and in the communication among the firm's headquarters, home country R&D sites, and foreign R&D sites and that these problems have received little attention so far. Specifically, R&D subsidiaries do not seem to be 'heard' by headquarters. Some authors offered as a solution that such lack of leverage or integration of subsidiary R&D resources and capabilities results from less-than-perfect knowledge transfer relationships inside the firm. Consequently, this literature advocates improving intra-firm knowledge exchange through better information and communication technology (ICT), more interpersonal informal exchanges, incentive systems, and a culture capable of supporting the flow of knowledge (Almeida et al., 2003; Hansen and Nohria, 2004; Frost and Zhou, 2005). However, the above-cited studies published from 1990 to 2006 unanimously document that the under-utilisation of international R&D resources is due to neither missing intra-firm knowledge exchange relationships nor a of subsidiary resources or capabilities. Even if intra-firm databases exist that lower transaction cost and cover explicit knowledge about the physical location of intra-firm resources and capabilities, missing tacit information does not allow managers to reproduce and access that knowledge at low cost. Thus, the pure sharing and exchange of knowledge does not allow for creative recombinations (Haas and Hansen, 2005). From a resource-based perspective, failing to use readily available resources and capabilities of foreign R&D sites to generate innovations is not only highly inefficient, but also negatively affects the firm's competitive advantage. Subsidiary capabilities within a multinational firm that remain unleveraged cannot become part of firm-specific advantages (Birkinshaw et al., 1998). Thus, questions concerning the whole concept of international R&D and international innovation processes arise, and a critical observer might ask: What sense does international R&D make at all if the innovatory expertise of foreign R&D sites never gets recognised? Couldn't all the firm's innovations be generated at headquarters, instead of spending money on the costly and complex management processes entailed by an international R&D organisation? This problem is unlikely to be alleviated by headquarters’ action. Given the effect documented by Doz et al. (2006), namely, that most home country R&D sites rather than foreign R&D sites have full core technology and full development capabilities at their disposal, it is unlikely that those managers will engage in a time-consuming search or attempts to leverage subsidiary capabilities. Firms that traditionally have taken a central role in the strategic planning of their international R&D units are heavily constrained by the existing resources and capabilities within these units, so to change these structures is tedious if not impossible (Chiesa, 1996; Penner-Hahn, 1998; Taggart, 1998). Thus, it remains highly likely that the existence of traditional organisational routines, deeply embedded in everyday experience-based actions, continue to influence central mangers' propensity to set up an international innovation project. Overcoming such 'core rigidities' in innovation that result from organisational inertia involves considerable difficulties (Schelling, 1998). For example, communication costs associated with selective interventions in the various organisationally and technologically separated subsidiaries may be excessive (Rugman and Verbeke, 2003). Whereas the marginal cost of transmitting codified knowledge across geographic space does not depend on distance, the marginal cost of transmitting tacit knowledge does (Audretsch and Feldman, 1996). Excess communication resulting from the need for clarification and discussion leads to a massive increase in the costs implied by this exchange (Hansen and Nohria, 2004).
6
Thus, collaboration among international units of a firm is extremely expensive in an international setting and will not occur without a conscious policy of encouragement (Birkinshaw et al., 2002). These costs arise because valuable knowledge generally is based in personal, tacit experience. Thus, it needs to be replicated through the personal experiences of those to whom the knowledge is transferred. This replication can be expensive in terms of time and information costs. Intra-firm transaction costs that result from the need to reproduce knowledge to assess its potential benefits may represent the reason organisational models that advocate the creation of global competitive advantage by orchestrating internationally dispersed units simply fail in managerial practice (Rugman and Verbeke, 2003). However, the problem of under-utilisation of R&D resources might be alleviated from the subsidiary side. Research on corporate entrepreneurship has long stressed that subsidiaries should adopt an entrepreneurial stance and that subsidiary managers should make themselves corporate entrepreneurs and generate initiatives to determine a process for recognising their resources, knowledge, and capabilities (Birkinshaw, 1997; Floyd and Wooldridge, 2000). Otherwise, these resources remain unrecognised and therefore unleveraged, and they cannot become part of the firm's global competitive advantage (Birkinshaw et al., 1998). This thought in turn leads to the core of the research problem. On the one hand, as argued previously, headquarters’ R&D has little incentive to integrate the internationally dispersed R&D subsidiaries into the global innovation processes because of the excess communication costs and managerial problems such processes entail. On the other hand, if all subsidiary initiatives were successful, there would be no problem of under-utilisation of R&D resources, and all subsidiaries would, by virtue of their own entrepreneurship, be integrated in global innovation projects triggered by their own initiatives. Thus, if foreign R&D subsidiaries have formulated initiatives in the past, and still the problem of under-utilisation of R&D resources persists, there appears to be a problem with the survival of their initiatives. That is, if the resources of international R&D subsidiaries still are little recognised and under-utilised, despite their history of formulating and sending initiatives, the suspicion arises that most initiatives are unsuccessful and that few 'survive'. It remains unknown which factors determine the probability of survival of a subsidiary initiative promoted by a foreign R&D subsidiary. To show the relevance of this problem, I will proceed as follows: First, I discuss the state of the art of international R&D and subsidiary initiatives (section 1.3). Second, I identify research gaps emerging from the research problem (section 1.4). Third, I develop research questions to investigate the research problem (section 1.5). Fourth and finally, I set out my methodological approach and the future structure of my dissertation, with which I intend to answer the primary research questions (section 1.6). 1.3 State of the Art
International R&D
Most work on international R&D has a static and descriptive nature. This literature elaborates classification schemes and taxonomies to distinguish different types of foreign R&D units and their different tasks, which range from very basic product adaptations to global technology creations (Ronstadt, 1977; Behrman and Fischer, 1980; Pearce, 1991; Medcof, 1997; Chiesa, 2000). Others authors have been interested in categorising firms’ different approaches to organising and managing international R&D networks (von Zedtwitz and Gassmann, 2002) or examining the geographical distribution of foreign R&D sites (Patel and Vega, 1999).
7
Closely related to these contributions is more practitioner-oriented literature that is concerned with managing global R&D networks and therefore extensively discusses problems of managerial control and coordination (De Meyer and Mizushima, 1989; Granstrand et al., 1993; Boutellier et al., 2000). Yet there seems to be little consensus about what could be termed ‘best practices’ (Medcof, 2001). Other researchers have been more interested in why international R&D exists at all (Cheng and Bolon, 1993; Håkanson and Nobel, 1993) and what motivations a firm has to locate R&D activities abroad (Brockhoff, 1998). Specifically, these motives can be reduced to 'home-base augmenting' versus 'home-base exploiting' motives (Kuemmerle, 1999) or 'asset-based' versus 'asset-seeking' motives (Kogut, 1991). A review and summary of these arguments is available (Zander, 1999). Still, obstacles to innovation rooted in firms' internal configurations can lead to the decisions not to internationalise innovatory activities to a particular host country, despite its attractiveness (Baldwin and Lin, 2002; Galia and Legros, 2004). However, the major emphasis of prior research on international R&D has been determining how the parent firm's use of centralisation, formalisation, and socialisation mechanisms differs in terms of the configurations, tasks, and mandates of the foreign R&D subsidiaries (Nobel and Birkinshaw, 1998; Reger, 1999), as well as how the use of such mechanisms depends on contingencies such as the size of the R&D unit (Schmaul, 1995) or its local embeddedness (Andersson and Forsgren, 1996). Other contributions in this stream of research discuss the problems of finding the appropriate balance between controlling subsidiaries and giving them a certain degree of independence to enable their creative work (Brockhoff and Schmaul, 1996) or how to coordinate international R&D projects and the teams that execute them (Ambos and Schlegelmilch, 2004). Subsidiary initiatives
Burgelman (1983a) proposes that large, resource-rich firms probably have a pool of entrepreneurial potential at operational levels that will be expressed in autonomous strategic initiatives. Managers at the product/market level conceive of new business opportunities, then engage in project-championing activities to mobilise resources and create momentum for the projects’ further development. Thus, initiatives are a principle mechanism through which organisations develop new competitive advantages (McGrath et al., 1995). Initiatives continually compete for scarce management attention, which leads to a process of continuous variation, selection, and retention of initiatives (Burgelman, 1991). Corporate entrepreneurs (i.e., middle and operating managers) play a key role in this process (Zahra et al., 1999; Floyd and Wooldridge, 2000). Subsidiary initiatives represent a special type of such initiatives, insofar as they emerge in an international setting. That is, they are formulated by managers of a foreign subsidiary and transmitted to corporate-level managers at the parent firm (headquarters), who decide about its recognition. Because most subsidiary managers and staff probably have a 'middle' or 'operational' hierarchical position, a firm's international subsidiaries should be a significant source of initiatives. Birkinshaw et al. (1998) argue that by formulating initiatives, a subsidiary can drive (rather than just contribute to) the process of a firm's capability development. Thus, instead of waiting for recognition, subsidiaries can turn to corporate entrepreneurs that help determine the process of recognition (Birkinshaw, 1997).
8
A first stream of research on initiatives pertains to conceptual development. This research grounds the phenomenon of subsidiary initiatives in entrepreneurship literature, interpreting initiatives as primary manifestations of dispersed corporate entrepreneurship (Kirzner, 1973; Stevenson and Jarillo, 1990; Birkinshaw, 1997) and interpreting the subsidiary's role as a function of the initiative and efforts of its employees (Etemad and Dulude, 1986; Roth and Morrison, 1992). A related stream of literature considers the performance implications of such entrepreneurial behaviour and finds that subsidiaries' initiative-driven efforts significantly contribute to the firm's competitive advantage, maintain the firm's connection to local markets, and secure a competitive edge over firms whose innovations are generated on a purely national basis (Nohria and Ghoshal, 1997; Birkinshaw et al., 1998). However, the emphasis of research pertaining to subsidiary initiatives has been on studying the factors and antecedents that favour the emergence of initiatives. These contributions find that subsidiary initiative is positively associated with the contributory role of the subsidiary, its level of specialised resources, and the entrepreneurial actions of its management (Birkinshaw et al., 1998). Research on 'issue selling' is concerned with investigating how middle managers formulate, 'frame', and 'package' initiatives to promote their ideas to top management (Dutton and Ashford, 1993; Dutton et al., 1997; Ashford et al., 1998; Dutton et al., 2002; Ling et al., 2005). Other work investigates how social interactions among managers helps generate initiatives (Løvas and Ghoshal, 2000), how multiple teams can facilitate the initiative generation process (Bryson and Bromiley, 1993), how the cognitive idiosyncrasies of such teams affect the generation of strategic initiatives (McGrath et al., 1995), and how individuals generate ideas for strategic initiatives (Floyd and Wooldridge, 1999). 1.4 Research Gaps and Relevance
In this section, I show that neither research on international R&D nor on subsidiary initiatives has considered why some initiatives seem to be recognised, whereas others are not. Unless this question is answered, it is not possible to understand the extent to which foreign R&D subsidiaries can exert influence through their initiatives. And as long as this understanding is missing, it is not possible to understand why the problem of under-utilisation of foreign subsidiaries' R&D resources persists, despite their efforts to formulate and send initiatives. Indeed, despite a lot of theorising about subsidiary-specific and location-bound advantages, there is still no explanation of why, in most MNCs that call themselves 'global', firm-specific advantages come almost exclusively from the parent firm. For example, no information exists about how, if at all, firms turn location-bound subsidiary advantages into non–location-bound, firm-specific advantages (Rugman, 2005; Verbeke, 2005), and little systematic research considers the firm-level factors that may facilitate or impede the integration of knowledge in firms with global technology strategies (Frost and Zhou, 2005). Given the enormous business impact of this understanding—in terms of the wasted resources for possibly superfluous international innovation processes in the case of non-leverage and potential benefits in terms of realised leverage—a better understanding of why a foreign subsidiary's initiatives survive or do not would be highly desirable, especially to practising managers. First, any performance- or success-related measure of initiative survival simply does not exist. Literature on subsidiary initiatives has been almost exclusively concerned with studying facilitating conditions, such as the factors and settings that lead to initiatives emerging at all. However, how and why generated initiatives are successful, after they have been submitted, and how and why they fail remains unknown. Little empirical research pertains to how initiatives evolve into emergent routines (Floyd and Wooldridge, 2000).
9
For example, Walsh and Ungson (1991) and Leonard-Barton (1992) state that the ratification of a strategic initiative triggers a process of integration of this initiative, but this ratification is taken for granted, and no evidence is presented as to why one initiative may be ratified whereas others are not. Research has long noted that the effects of limited resources, bounded rationality, and incomplete information lead firms to direct their R&D efforts toward some areas at the expense of others and that some solutions form the foundation for future knowledge development but others become dead ends (Podolny and Stuart, 1995). However, every initiative entails a plan or an intended solution, and it is still unknown why firms allocate attention to the one and not another initiative. McGrath (2001) analyses how projects develop after an initiative has been recognised. However, this approach also leaves out the success-or-failure aspect; the research begins after an initiative has been recognised and after the project based on that initiative gets started. Why this initiative was successful while others have failed remains unknown. Birkinshaw (1997) gives some qualitative evidence on initiatives that have succeeded or failed; however, the factors responsible for their success or failure are neither modelled nor discussed. Similarly, literature on 'issue selling' is only concerned with how managers write up their initiative; what happens after submission, of if certain ways of packing and framing initiatives are more likely to make them succeed, remains unknown. These contributions centre on the question of how initiatives may be generated and what facilitates this generation, but they do not investigate whether or not the generated initiatives will ever be recognised. Finally, the attention-based view of the firm (Simon, 1947; Ocasio, 1997) suggests that initiatives from a particular sender must compete with other initiatives for scarce CEO attention; however, it is unknown why some initiatives receive more attention than others. Summarising these arguments in terms of Burgelman's (1991) variation–selection–retention framework, past research has concentrated almost exclusively on the variation of initiatives and neglected the selection aspect. To close this research gap would considerably advance understanding of strategy processes within firms and help clarify the attention allocation mechanisms of corporate-level managers. Furthermore, a success-factor element could be introduced into research on subsidiary initiatives, because any generation, framing, and packaging of initiatives would be useless if the generated initiative fails. This knowledge also would be important for practising managers, who would thus be informed about which factors will favour and which will deter an initiative's projected success. Specifically, it would allow them to assess the provocative question of why a firm should have costly international R&D resources and project organisations at all if the greatest part of all innovations still come exclusively from the parent firm.
10
Second, no data currently enable the study of intra-firm configurations of MNCs with international R&D that determine whether a subsidiary's resources and capabilities will be recognised by the global firm. To date, very little systematic evidence indicates how, when, and to what extent multinationals actually manage to exploit the potential of their foreign subsidiaries (Håkanson and Nobel, 2000). The process by which firms make internal choices with respect to knowledge, especially when such choices can lead to different paths, remains unexplored (Nerkar and Paruchuri, 2005). Because the approval of an initiative leads to the recognition of the foreign subsidiary's R&D resources, the study of initiative success also would allow researchers to judge the extent to which the MNC exploits the potential of its R&D subsidiaries. However, such a study requires taking the initiative itself as unit of analysis. Thus, intra-firm data on initiatives from international R&D subsidiaries are needed. Yet such intra-firm data are absent from extant research, which to date has worked with proxy measures and patent data (Argyres and Silverman, 2004; Rugman, 2005; Verbeke, 2005). Thus, collecting and analysing such data would not only bring direct intra-firm data to light for the first time but also enhance understanding of the way the initiative takes hold, its characteristics, and its history of success and failure. Nerkar and Paruchuri (2005) call for a stronger emphasis on studying the real decision-making processes, human behaviour, governance, and socioeconomic mechanisms, the direct result of which is the firm's configuration of its international innovation network. Extant research is not really clear about the causal-temporal structure of managerial choices relating to knowledge and organisation in multinational firms, and conceptual development is needed to provide a clear picture of what causally and temporally happens inside firms to make international innovation processes succeed (Foss, 2006). Thus, study of the survival or failure of initiatives, including the factors that cause this survival or failure, contributes to a better understanding of the causalities that govern an initiative's survival. Furthermore, the idea of taking initiatives as an analytical instrument to analyse international R&D processes is unprecedented. The cited contributions on subsidiary initiatives analyse manufacturing, not R&D subsidiaries. Given the idiosyncrasies and special problems of an international R&D organisation, as opposed to other internationalised business functions—such as the 'not-invented-here' syndrome (Katz and Allen, 1982) or the 'stickiness' of tacit knowledge (Szulanski, 1996)—the effects should be somewhat different. Thus, analysing initiatives of foreign R&D subsidiaries offers insights into both the configuration of international R&D networks and research on initiatives.
11
1.5 Research Questions
Given these problems and research gaps, the research interest underlying this dissertation can be constructed logically as follows: Assume the setting of an international R&D organisation of an MNC that consists of a headquarters R&D unit in the home country and a number of foreign R&D subsidiaries, which all formulate and send initiatives. To achieve recognition, an initiative by a particular foreign R&D subsidiary must be successful in the sense that some decision-making body in the firm approves it and allocates certain rights, project mandates, and resources, which means that it has decided to integrate that subsidiary's resources, knowledge, and capabilities into a global R&D project. Therefore, it is necessary to understand the factors that cause the recognition or non-recognition of the subsidiary's initiative, that is, the factors that make it 'successful'. And this necessity means that it is necessary to identify the 'success factors' that govern the initiative's probability of recognition. In the following, I use the term 'survival' to indicate that an initiative has successfully passed all stages of evaluation and decision making. Therefore, my main research question can be formulated as follows: What determines the probability of survival of an initiative sent by a foreign R&D subsidiary? This question entails several sub-questions: a) How and why do initiatives differ in their individual probability of survival?
b) Are initiatives from some foreign R&D subsidiaries more likely to survive than others?
c) What can subsidiary managers do to increase their initiatives' probability of survival?
1.6 Methodology and Further Structure
To answer my research questions, this dissertation builds on a broad foundation of available theory on subsidiary initiatives and headquarter–subsidiary relationships to develop the hypotheses; further exploratory research by qualitative methods is unnecessary. The goal of this dissertation is to develop and test hypotheses on the basis of extant theory and thus to contribute to the further development of that theory. Therefore, the research methodology is purely quantitative. My further approach to answer the research questions is as follows: I first develop a theoretical model of the subsidiary initiative process, based on an analogy constructed on a foundation of communication psychology (Section 2). This model enables me to identify six elements that shape the initiative process and have an impact on an initiative's survival or failure. For reasons of focus, data availability, and control of unobserved variance, I concentrate on one of these six elements, namely, initiative characteristics. Subsequently, I develop hypotheses that describe the initiative characteristics on which the survival or failure of an initiative may depend (Section 3). After commenting on the statistical method of survival analysis that I employ (Section 4), I test the hypotheses using a sample of 1,116 subsidiary initiatives, collected from the global R&D organisation of a Swiss MNC (Section 5). Finally, I discuss the findings and outcomes of my research and reveal their implications for theory development and practising managers, as well as some possibilities for further research (Section 6).
12
2. Conceptual Development
2.1 A Communication Model of Subsidiary Initiatives
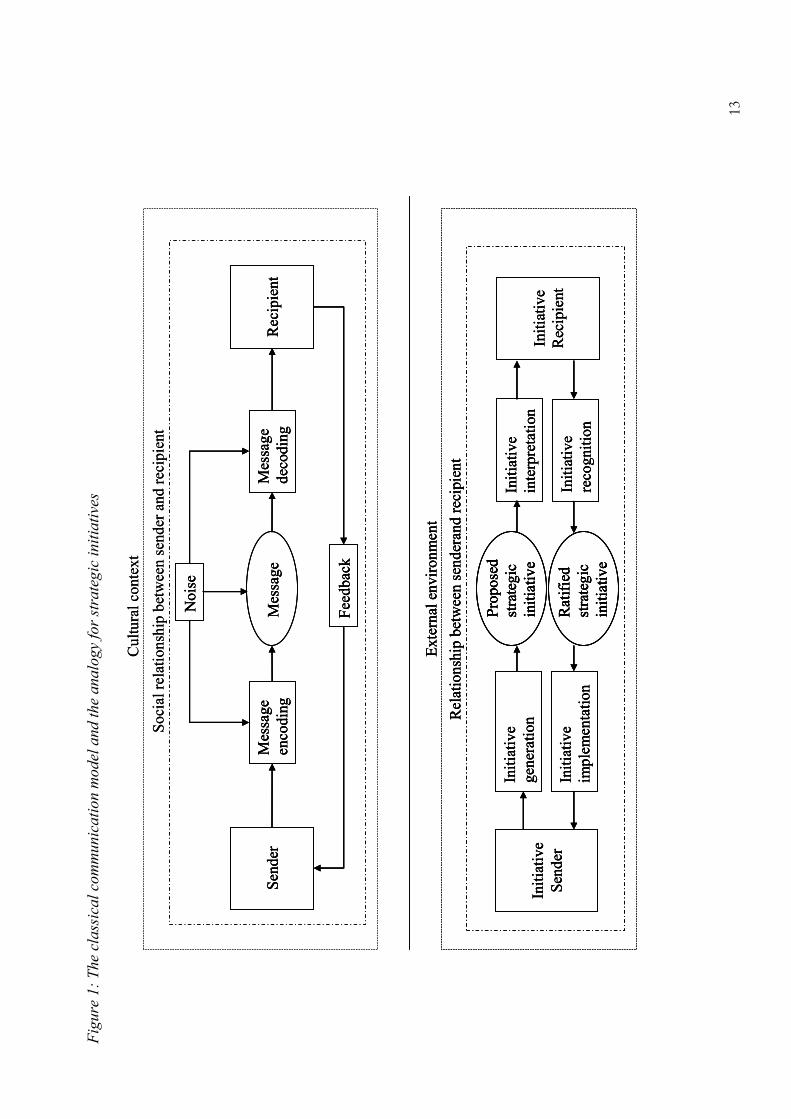
With the preceding literature review, I have shown the need to explore the factors that determine whether or not a subsidiary initiative is recognised. Therefore, it is also important to conceptualise the process from initiative generation to initiative implementation, to understand which obstacles and challenges a subsidiary initiative must overcome to survive. The following conceptual model tracks this process from generation to implementation.1 It thereby identifies six elements, whose empirical exploration will shed light on why a subsidiary initiative might survive. In the empirical part of this dissertation, I focus on one of these six elements, namely, initiative characteristics. I set out the reasons for doing so in Section 2.3. Lechner's (2005) recent meta-analysis of strategy process research suggests that strategy processes—including those initiated by subsidiary initiatives—can be analytically separated into the three elements: 'agenda building', 'decision making', and 'implementation'. Specifically, initiatives are an activity within the firm that evolve through the phases of variation, selection, and retention (Burgelman, 1991). Thus, I argue that by following the subsidiary initiative on its 'journey' through the stages from formulation to implementation, it is possible to identify the filtering mechanisms, governed by decision makers, that the initiative has to pass. Each of these filters can be thought of as a gateway through which the initiative must pass to proceed. The model I propose to depict this journey is built on an analogy from communication psychology (cf. figure 1). Communication psychology conceives of communication as a message sent by a sender to a recipient. In this model, as originally developed by Shannon (1948) and refined by Adler et al. (1996), a message to be sent needs to be encoded by the sender (e.g., by language, symbols, artefacts) and decoded by the recipient to allow transmission. It can be distorted by noise. Wiener (1986) adds that in the case of two-way communication, the recipient sends a reply to the message ('feedback') to the sender. Furthermore, Schultz von Thun (1998) finds that the success of communication (i.e., understanding of a message by the recipient as it was meant by the sender) depends not only on the correct use of coding and decoding mechanisms but also on the social relationship between the sender and recipient. Hofstede (2001) also finds that the result of communication processes is influenced by the cultural context of both the sender and the recipient.
1 Sections 2.1 and 2.2 draw on my paper 'International innovation and strategic initiatives: A research agenda', Research in International Business and Finance, special issue on 'International Innovation', 2008 (forthcoming, with O. Gassmann).
13
Figure 1: The classical communication model and the analogy for strategic initiatives
Sen
der
Mes
sag
e
enco
din
gM
essa
ge
Rec
ipie
nt
Mes
sag
e
dec
odin
g
Fee
db
ack
No
ise
So
cial
rel
atio
nsh
ip b
etw
een
sen
der
and
rec
ipie
nt
Init
iati
ve
Sen
der
Init
iati
ve
gen
erat
ion
Pro
po
sed
stra
teg
ic
init
iati
ve
Init
iati
ve
Rec
ipie
nt
Init
iati
ve
inte
rpre
tati
on
Init
iati
ve
imp
lem
enta
tion
Init
iati
ve
reco
gnit
ion
Rel
atio
nsh
ip b
etw
een s
end
eran
d r
ecip
ien
t
Exte
rnal
en
vir
on
men
t
Rat
ifie
d
stra
teg
ic
init
iati
ve
Cu
ltu
ral
conte
xt
Sen
der
Mes
sag
e
enco
din
gM
essa
ge
Rec
ipie
nt
Mes
sag
e
dec
odin
g
Fee
db
ack
No
ise
Sen
der
Mes
sag
e
enco
din
gM
essa
ge
Rec
ipie
nt
Mes
sag
e
dec
odin
g
Fee
db
ack
No
ise
So
cial
rel
atio
nsh
ip b
etw
een
sen
der
and
rec
ipie
nt
Init
iati
ve
Sen
der
Init
iati
ve
gen
erat
ion
Pro
po
sed
stra
teg
ic
init
iati
ve
Init
iati
ve
Rec
ipie
nt
Init
iati
ve
inte
rpre
tati
on
Init
iati
ve
imp
lem
enta
tion
Init
iati
ve
reco
gnit
ion
Rel
atio
nsh
ip b
etw
een s
end
eran
d r
ecip
ien
t
Exte
rnal
en
vir
on
men
t
Rat
ifie
d
stra
teg
ic
init
iati
ve
Init
iati
ve
Sen
der
Init
iati
ve
gen
erat
ion
Pro
po
sed
stra
teg
ic
init
iati
ve
Pro
po
sed
stra
teg
ic
init
iati
ve
Init
iati
ve
Rec
ipie
nt
Init
iati
ve
inte
rpre
tati
on
Init
iati
ve
imp
lem
enta
tion
Init
iati
ve
reco
gnit
ion
Rel
atio
nsh
ip b
etw
een s
end
eran
d r
ecip
ien
t
Exte
rnal
en
vir
on
men
t
Rat
ifie
d
stra
teg
ic
init
iati
ve
Rat
ifie
d
stra
teg
ic
init
iati
ve
Cu
ltu
ral
conte
xt
14
Using this analogy, I argue that the initiative the foreign R&D subsidiary sends can be conceived of as a message that needs to be encoded (formulated). This message is then communicated from the sender (foreign R&D subsidiary) to a recipient (decision-making manager at headquarters) who needs to decode (understand) it. If the initiative is rejected, the recipient communicates negative feedback to the sender. If it is recognised, the strategic initiative is ratified, a process through which it receives a mandate and resources for implementation (e.g., political support, official endorsement, rights, a budget). The sender (the foreign R&D subsidiary) then has to determine how to implement this endorsed initiative by transforming it into a project and determining the managerial actions that will lead to the desired result. Thus, only if the strategic initiative has successfully passed the complete communication process from formulation to implementation can it be considered a success. In all other cases, the initiative is never generated, not recognised, or not implemented. Prior literature specifies several postulates for a model that tracks strategic initiatives in a firm: It should recognise that many actors are involved, from the formulation through the implementation of a strategic initiative; thus, given this social complexity, it should analyse these activities and interactions as a collectivity (Floyd and Wooldridge, 2000). The model would have to incorporate multiple levels of analysis (Lewin and Volberda, 1999) as well as an intertemporal perspective to enable longitudinal research (D’Aveni, 1994). I believe my proposed model addresses these postulates for the following reasons. First, by its design, the model is able to account for social complexity, because it identifies the different elements that each contribute to or impede the transformation of a strategic initiative into realised organisational change. Each of these elements incorporates a different set of actors who engage in socially complex interactions. Second, the model follows an initiative over time, thus incorporating an intertemporal perspective and enabling longitudinal research. It can also recognise multiple units of analysis, depending on the respective element on which the analysis focuses. For example, the units of analysis for the 'sender' element would be the structural characteristics of the initiative-sending subsidiary, whereas for the 'recipient' element, they could include the decision-maker's cognitive processes when deciding whether to recognise the initiative. Moreover, the model addresses Floyd and Wooldridge's (2000) call for a study that tracks the idea–initiative–integration process for various strategic initiatives over a period of time within one organisation or cross-sectionally for multiple organisations. In the following, I analyse each of the model's six elements (sender, initiative, recipient, implementation, social relationship between sender and recipient, and environmental influences) with respect to how each influences the probability of the survival of an initiative.
15
2.2 Analysis of the Six Elements
2.2.1 Sender characteristics This element of the model deals with the properties of the foreign R&D subsidiary (the 'sender') that initiates, formulates, and sends the initiative. Unfortunately, not much guidance from extant research is available here. Analyses of sender characteristics, such as that by Ling et al. (2005), are generally restricted to asking how individuals generate initiatives and how social interactions between persons and managers influence the way the initiative is creates and formulated. However, with the exception of Birkinshaw (1997), very little work analyses how direct subsidiary characteristics may influence the initiative's success probability. Yet there is good reason to expect a considerable influence of such subsidiary characteristics. Some foreign R&D subsidiaries may be 'more equal' than others, an effect that should influence the chance that their strategic initiatives are recognised. Subsidiaries compete horizontally or vertically in the corporate 'marketplace' for charters, mandates, and influence (Galunic and Eisenhardt, 1996; Birkinshaw and Fry, 1998). Birkinshaw et al. (1998) also argue that subsidiary characteristics have an impact on the subsidiary's contributory role. A firm may opt to attribute a great degree of freedom to some subsidiaries while disregarding initiatives from all other subsidiaries and keeping them under total domination instead (Frost et al., 2002). For example, if a subsidiary has been explicitly recognised by the firm as a 'centre of excellence' (Frost et al., 2002) or been assigned a 'mandate' for certain R&D tasks (Cantwell and Mudambi, 2005), its initiatives should be recognised more often than those of other subsidiaries, because the recipient is likely to rely on a signalling effect that suggests that a subsidiary with such a special task or mandate must possess valuable specialised capabilities. This signal in turn means that such subsidiaries should be more likely than other subsidiaries to leverage their expertise for the global firm. The same effect can be expected if a subsidiary has been explicitly established by the firm to acquire new capabilities by interaction with a specific market or specialised industry cluster to benefit from spillovers (Jaffe et al., 1993). Likewise, the contributory role of a foreign subsidiary increases with its market scope and degree of international orientation (Birkinshaw and Hood, 2000). Thus, the more important a subsidiary is to the firm with respect to these characteristics (i.e., is it the firm's global research centre, or is it a development unit in a third-world country?), the more likely it is that its initiatives will be recognised. Consequently, research into such 'sender' characteristics is necessary to determine the extent to which the foreign R&D subsidiary's characteristics determine its chances to leverage its expertise. Such characteristics can range from subsidiary size and areas of activity to more sophisticated measures that depict tasks and capabilities. 2.2.2 Initiative characteristics
This part of the model deals with the characteristics of the initiative that the foreign R&D subsidiary sends. In an international innovation context, one can expect a number of peculiarities with respect to these initiatives that merit much more attention. First, the strategic initiatives need to be encoded so that the information can be transmitted to the recipient (e.g., in the form of a memo, email, or document template). Such codification of information enables the transfer of knowledge between individuals and groups (Adler and Borys, 1996; Zollo and Winter, 2002). However, in international R&D, this transmission is more difficult than in other contexts, because R&D knowledge often demands specialised technological knowledge and understanding, which the recipient may not possess. That is, R&D-related knowledge is characterised by a very high degree of tacitness and implicitness, so that written codification of such knowledge is tedious and hard to obtain (Nonaka, 1994).
16
Thus, one would expect that the harder it is to transform the highly tacit knowledge into codified (written) codification, the more difficult it is for the strategic initiative to be communicated and understood by the recipient. Second, whereas the marginal cost of transmitting explicit knowledge across geographic space does not depend on distance, the marginal cost of transmitting tacit knowledge does (Audretsch and Feldman, 1996), because valuable knowledge often is based on personal, tacit experience. Thus, it needs to be replicated through the personal experiences of those to whom the knowledge is transferred. This replication probably is expensive in terms of time and information cost. Third, this becomes even more complicated if the sender and recipient do not share the same mother tongue or are socialised in different cultural contexts. In an internationalised firm, the differences in national languages, cultures, and contextual understanding probably have an impact on how international business is conducted (Hofstede, 2001). Schultz von Thun's (1998) findings suggest that the meaning of a sender's message can change depending on whether the recipient interprets this message as data, an appeal, a social relationship, or a self-revelation by the sender. Because a strategic initiative can be considered a message encoded in the cultural context of the foreign R&D subsidiary, the recipient may not share this context and consequently may not understand the decoded message as it was intended. Moreover, the decoding of the initiative by the recipient demands a reproduction of the tacit knowledge the initiative entails (Rugman and Verbeke, 2003), which implies considerable intra-firm transaction costs (Hansen and Nohria, 2004). This cost also implies that such initiatives may be not understood as well as other initiatives, so the probability of rejection should be higher. However, the foreign R&D subsidiary might be expected to anticipate this effect and engage in activities to encode or transmit the tacit knowledge and thus enhance the chances of recognition of its initiative and the leveraging of its expertise. Fourth, though these activities relate to the encoding of the initiative, one can also think about the activities of the foreign R&D subsidiary that relate to the content of its initiatives. The subsidiary could take advantage of its knowledge that initiatives that build on an organisation’s competence are more likely to be selected than those that do not (Tushman and Anderson, 1986; Burgelman, 1994). Thus, the extent to which an initiative is perceived as competence enhancing by the recipient may significantly alter the likelihood of recognition of the initiative. Thus, the probability of recognition may be positively influenced if the initiative is 'close' to already existing organisational memory (Winter, 2000). Fifth, this closeness consideration would be especially advantageous for the foreign R&D subsidiary if the internal sphere of the MNC to which it belongs is characterised by a 'garbage can' decision-making process, in which solutions and problems freely 'float' in the organisation until a problem and a matching solution meet, more or less by chance (Cohen et al., 1972). If the foreign R&D subsidiary can manage to formulate its initiative such that is presents a sudden solution to a problem that has long been 'floating' inside the MNC, it is highly likely that this initiative will be recognised. Sixth, most newly created strategic initiatives are ambiguous, complex, and uncertain (Levinthal and March, 1993). Ambiguity can be expected to have an impact on managers' decision-making behaviour, because it suggests that the decision maker can only imperfectly assess the initiative, as reliable information about it may not be available because of the newness of the initiative's subject matter or because multiple interpretations of the information that the initiative conveys are possible (Garud and Van de Ven 1992; March 1994; McGrath et al. 1995, 1996). Thus, the projected performance of an initiative cannot be readily assessed, so managers are likely to resort to cues and heuristics when making their decisions, which means that some initiatives that, whether by coincidence or by planning of the sender, fit these cues and heuristics may have a superior probability of survival.
17
2.2.3 Characteristics of the decision-making recipient
Once the initiative has been transmitted to the recipient, who decides whether to recognise the initiative, this recipient's idiosyncrasies probably influence the initiative's probability of survival. Different initiatives originating from different foreign subsidiaries compete with one another for the recipient's attention, yet the recipient may have neither the time nor the specialised knowledge to judge all these initiatives on the basis of complete information (Watson and Wooldridge, 2005). Consequently, the recipient is confronted with information asymmetry and the constraints of a limited information processing capacity (Egelhoff, 1991). Complete information about the scope, extent, and geographical location of all resources and capabilities of all of the firm's subsidiaries may not be available or obtainable only at high cost. Thus, because managers can only imperfectly assess the quality of work, capabilities, and political and power relations in other subsidiaries, there is the risk that such limited information will lead to myopic or even erroneous decisions. The recipient is likely to anticipate the danger of such erroneous decisions, so there is a high probability the recipient will remain inert and prefer known solutions. For the recipient, it is less risky to reject an initiative than to take on the risk of accepting a 'wrong' initiative that may result in lost investments if the initiative's outcome does not live up to expectations. Corporate-level management may therefore select a simple 'let it be' or 'abort them all' option, without much further reasoning beyond arguments related to the presence of financial slack (or lack thereof) or consistency with broad company-level goals (or lack thereof) (Verbeke and Yuan, 2005). Corporate-level managers also can be assumed to be risk-averse when deciding whether to initiate an R&D project as an international or a headquarters-based project. Because corporate-level managers can only imperfectly assess the quality of work, capabilities, political power, and willingness to cooperate of decentralised subsidiaries, even if they can identify potentially beneficial subsidiary resources or capabilities, they still confront a certain risk that the subsidiary will fail to meet expectations. Therefore, corporate-level managers probably build up failsafe mechanisms in the form of excess capacities and redundancies. For example, if a peripheral unit of the firm is located in an emerging economy, central managers may perceive this unit as 'high risk' with respect to a possibly uncontrolled outflow of intellectual property rights once intra-firm knowledge exchange relationships with this unit are established. This risk aversion implies a selection problem: Instead of conducting a complete intra-firm search, managers may limit their search to those units that they know and with which they have had positive experiences in the past. This bias, in turn, probably influences the decision, such that a purely home-based approach to an R&D project should lead to the feeling that contingencies are 'better known' and that the future of such a project can be 'better predicted'. Therefore, such projects are likely to be perceived as entailing less risk, regardless of whether or not this perception meets reality. A moral hazard point of view also suggests that a boundedly rational headquarters manager will not necessarily maximise the utility of the global firm but rather his or her own. Such managers may be reluctant to set up an international R&D project at all because these projects not only demand complex communication and coordination structures but also involve agents from other intra-firm units that may compete with them for influence and career opportunities. Consequently, especially when managers' tasks are increasingly short-term oriented and their performance is quantitatively measured by meeting set targets, they may opt for pure self-protection and stick with those resources they know best and can most easily control. This behaviour, however, impedes the utilisation of the resources and capabilities of foreign R&D subsidiaries.
18
2.2.4 Characteristics of implementation
After the initiative has been recognised by the recipient, the initiative is 'ratified', in the sense that it is now endorsed with an implementation mandate and typically backed by a budget and top management support. The foreign R&D subsidiary now faces the task of achieving actual leverage by turning the initiative into realised organisational routines, products, or services. Only upon completion of this step will the initiative have led to a leverage of the subsidiary's expertise. Unfortunately, little empirical research exists on how initiatives evolve into emergent routines (Floyd and Wooldridge, 2000). This question of implementation is especially relevant in an international R&D context. If the subsidiary's expertise is to be leveraged to the global firm, other organisational units in the MNC will have to adapt themselves to the consequences of this leverage (e.g., to a new organisational routine the initiative has proposed, a new process, or in general a new way of doing things). However, those that have to implement the initiative may oppose it because they see it as inconsistent with the organisation's interest, their subunit's interest, or their personal self-interest (Guth and MacMillan, 1986). This opposition may result in behaviour such as foot dragging, passivity, feigned acceptance, hidden sabotage, or outright rejection by those who have to implement the initiative (Nutt, 1987). In an R&D context, the 'not-invented-here' syndrome, which describes the reluctance of R&D staff in a given organisational unit to accept knowledge from the outside their unit, can effectively impede the successful implementation of an initiative (Katz and Allen, 1982; Hayes and Clark, 1985). Similarly, the successful transfer of routines and knowledge from other subsidiaries primarily depends on the willingness of the receiving subsidiary to accept those transfers (Szulanski, 1996). Yet the 'not invented here' syndrome implies such acceptance between different R&D subsidiaries will be rather low, because an organisational unit's memory is not easily changed, and change brings the necessity for organisational learning and un-learning, which instils stress and fear (Walsh and Ungson, 1991; Piderit, 2000). 2.2.5 Characteristics of the sender–recipient relationship
Whereas a strategic initiative originating from top management is legitimised by the hierarchical rights of top management itself, an initiative from a subsidiary first must achieve this status of legitimation by convincing the recipient of its adequacy, as I argued previously with regard to the recognition of initiatives. Because parent–subsidiary relationships can have a considerable impact on the subsidiary's contributory role (Birkinshaw et al., 1998), there is good reason to believe that the relationship between sender and recipient is likely to influence the initiative's probability of recognition. Trusted relationships between the sender and recipient—colloquially referred to as 'politics' or 'good relations'— probably positively influence the chance for recognition because they significantly lower information asymmetry between the two parties. By its very nature, R&D is a risky task that demands high up-front investments but generates results that are unknown and that may prove of not immediate use or even worthless. Thus, foreign R&D subsidiaries that send initiatives need to signal that the R&D activities induced by the implementation of their initiative will be beneficial to the firm. Rogers (1983) and Goodman et al. (1980) find that if a subsidiary's knowledge has not proven useful in the past, it is more difficult to convince potential recipients and legitimise controversial integration efforts. Moreover, because much of the knowledge surrounding an initiative is still implicit and underdeveloped, participation is based more on bargaining, individual credibility, and interpersonal trust.
19
At this point, the need for strong social ties, trusted relationships, and their related issues becomes apparent (Butler and Cantrell, 1984; Burt, 1992; Hosmer, 1995). In addition, an expert and trustworthy source is more likely than others to influence the behaviour of a recipient (Perloff, 1993). The 'social capital' between sender and recipient influences the outcome and success of the strategy process (Løvas and Ghoshal, 2000). As in agency theory, agency costs and information asymmetry decrease only as agents and principals develop better relationships through repeated transactions; the recipient may regard a trusted relationship with the sender as a proxy for the initiative's trustworthiness. Consequently, the recipient is more likely to act favourably toward a strategic initiative that comes from a sender with whom he or she has had trusted exchange relationships in the past (e.g., previous successful initiatives). To sum up these arguments, repeated patterns of interaction increase the network ties between sender and recipient. Because every organisation has informal networks of advice, trust, and communication (Krackhardt and Hanson, 1993), it is likely that the existence of such networks of trusted relationships influences the propensity of recognition, as well as the probability of implementation success of the initiative. The relationship between the sender and recipient also can be expected to be shaped by the power distribution between them. Relationships between different units of a firm, especially between headquarters and subsidiaries, may be determined considerably by the power structure between them. This power structure determines how independently the foreign R&D subsidiary can perform and how much autonomy it receives in defining the scope, extent, and management of its activities (Mintzberg, 1983). These issues of independence and autonomy probably influence the success probability of an initiative in an international innovation processes, because a subsidiary's contributory role should be positively associated with its degree of autonomy (Birkinshaw et al., 1998). Once the subsidiary has managed to secure a certain extent of self-determination, it finds itself in a more powerful position with regard to its parent company, because it is in control of valuable local resources (Birkinshaw and Hood, 2000). Thus, a subsidiary that is vested with a high degree of independence or a larger resource endowment probably will be more self-confident about generating initiatives.
20
2.2.6 Environmental influences
In addition to intra-firm factors, environmental influences may have an impact on the probability of survival of an initiative. For example, Eisenhardt and Martin (2000) argue that radical changes in global technological developments can influence the recipient to favour strategic renewal (and thus to accept more initiatives than otherwise), because of a perceived need to adapt to these changes. Thus, environmental dynamics and complexity may influence the recipient's behaviour and have an impact on the initiative's probability of survival. A lot of other factors that could have at least a moderating influence on this success probability also might be considered, such as the structures of the particular industry in which the foreign R&D subsidiary is active, the various degrees of internationalisation between different industry sectors, global technology developments such as the emergence of the DVD standard, a strong growth rate, or a particular crisis of certain industries, among others. 2.3 Empirical Focus
To understand the survival and failure of subsidiary initiatives properly, the optimal approach would be to consider all of these elements simultaneously and in their interactions with one another in one measurement approach. However, such an approach is not feasible for several reasons. First, the elements differ in their unit of analysis, both in terms of the micro versus macro level (i.e., decision makers' cognitive processes versus environmental influence) and with regard to the unit of analysis (initiative versus subsidiary characteristics). Second, combining all elements into one measurement approach induces a significant degree of variance that can hardly be controlled for and thus is likely to distort results. Third, data availability would be hard to assure in the case of a simultaneous approach. It is therefore necessary to focus on a single element. In accordance with my research question, I take the individual initiative as my unit of analysis and focus on how the second element (initiative characteristics) influences the survival of subsidiary initiatives.
21
3. Hypotheses 3.1 Hypothesis 1
For this hypothesis, I first build the argument that the distance between headquarters and subsidiaries (geographical, cultural, and social distance) is negatively associated with the initiative’s survival likelihood. Specifically, I argue that initiatives from subsidiaries based in the same country as headquarters (i.e., closest to headquarters in geographical, cultural, and social terms) are more likely to survive than are initiatives from more remote subsidiaries. Geographical distance entails transaction costs, because the accuracy and richness of information transfers decrease with spatial distance, and communication costs, such as travel time and meetings (Krugman, 1991) or search and transfer costs (Hansen and Løvas, 2004), increase. Geographical distance can make it difficult to work together and may deter competence transfers (Kogut and Singh, 1988; Zaheer, 1995). Moreover, people tend to interact less with others as spatial distance increases (Allen, 1977). The greater the geographical distance between a subsidiary and headquarters, the less likely it is that interpersonal interactions between the initiative sender and corporate-level management will take place. In such settings, communication instead is conducted by email, videoconferencing, and other forms of cheap, long-distance communication. Therefore, geographical distance implies the absence of social closeness and personal interaction, which I suggest is key to the success of subsidiary initiatives on the basis of the following arguments. Making decisions under uncertainty and with incomplete information requires decision makers to draw inferences about future events (Schwenk, 1984). This setting is typical for decision situations involving subsidiary initiatives, because the subsidiaries' capabilities and the personal traits of its managers are imperfectly known to decision makers based at headquarters. Initiatives continually compete for scare management attention. An initiative must be 'sold' to the organisation’s strategic decision makers to become part of a firm’s formal strategy (Nonaka, 1994). The promotion of subsidiary initiatives to upper management layers is a navigational selling process that depends upon individuals’ characteristics, their communication styles, and their position within organisational social networks (Narayanan and Fahey, 1982). This selling process crucially depends on personal interactions to persuade and convince decision makers. Researchers studying such phenomena highlight the importance of heuristics and other signalling mechanisms used by decision makers (Kahneman and Tversky, 1979). Such heuristics can help reduce the uncertainty surrounding a choice. In the context of strategic decision making, managers typically look for such heuristics to support their underlying expectation of future events. One of the most important indicators or heuristics used by decision makers in general and managers in particular pertains to the centrality of the actors involved. Researchers employ the concept of centrality to indicate the status (Podolny, 1993), power (Brass and Burkhardt, 1993), and social capital (Ahuja, 2000) of an actor in an intra-firm network. Specifically, Ibarra (1993) shows that centrality is important for participation in innovative roles in an organisation. The centrality of individual positions in an intra-organisational network of inventors or an intra-firm knowledge network can predict the likelihood that knowledge created by a particular inventor is used in the firm's R&D activities (Nerkar and Paruchuri, 2005). A positive relationship also exists between an actor's centrality and his or her on individual performance (Mehra et al., 2001; Ahuja et al., 2003).
22
R&D managers network with influential managers—so-called promoters—within the headquarters R&D department who are willing to support their ideas, help them overcome barriers, and counter resistance movements of those that oppose the initiative (Witte, 1973: 47; Hauschildt, 1993: 126; Hauschildt and Kirchmann, 2001). Finally, managers with relational connections may feel better able to get the ear of top management to air their issues. Senders of initiatives who not only know corporate-level management but also have a personal relationship with them may benefit from the more favourable initial disposition of corporate-level managers toward their proposal (Dutton et al., 1997). Issues from connected managers will be heard more than those sent by unconnected managers (Kaplan, 1984; Ragins and Sundstrom, 1989). When the relationship between the seller of an initiative and critical decision makers in the organisation is warm, trusting, friendly, and open, people recognize upper managers as 'particular others and not just generalised actors playing broadly defined roles' (Schilit and Locke, 1982). When such trusting and warm relationships exist, potential sellers of an initiative may believe that their efforts will receive serious consideration from top management. The reciprocity expectations that typically accompany a good relationship also may strengthen potential sellers' hopes that their selling attempts will be treated seriously and fairly (Ashford et al., 1998). Thus, an actor with a high degree of centrality is likely to gain attention from corporate-level managers. Moreover, his or her centrality also probably serves as a cue for certain desirable properties of the initiative. Thus, a social perception of an the actor's centrality should be interpreted as a heuristic for the initiative's soundness and the trustworthiness of its subject matter. In turn, an actor with a high degree of centrality should be more likely to manage the selling and persuasion process successfully and can more likely count on the support of corporate-level managers than can actors with lesser a degree of centrality. An actor with high degree of centrality and relatedness is more likely to 'sell' an initiative than others, which, ceteris paribus, enhances the survival probability of such an actor's initiatives. Having established this link, the point that remains to be shown is the effect of proximity, such that when an actors' R&D unit is located closer to headquarters, the perceived centrality of an actor from that unit increases. Centrality is not a personal trait of an individual but rather a perception by others about this individual. That is, the perception of centrality gets constructed in the mind of others, so the chance of being regarded as central is highest when interactions with the people who construct this image (i.e., corporate-level managers) are frequent. After repeated communications, central managers probably construct images of the senders of initiatives. In addition, senders from R&D units closer to headquarters will have more frequent contact with managers at headquarters. They may know them from prior job assignments, have previously worked with them, have met them at socialising events, or have established networking and mentoring relationships with them over the course of their career. Such informal social relations are key determinants of the probability of survival of an initiative. Informal social relations are distinct from formal coordinating mechanisms, in that they are grounded in norms, habits, and personal reciprocity rather than authority based on a formal hierarchy (Emerson, 1962). These relations therefore imply that managers embedded in the same social structure exhibit a higher degree of trust and a higher capacity for information sharing and mutual problem solving than do managers with no informal relationship (Granovetter, 1985; Uzzi, 1997; Gupta and Govindarajan, 2000).
23
Moreover, constructing trusted relations with promoters takes time. Due to the shorter geographical distance, actors based close to headquarters are more likely, ceteris paribus, to meet more frequently with people from headquarters and thus are able to engage in a more intense informal social interactions than are actors from distant subsidiaries, who would have to invest considerable travel and time costs to achieve a similar level of social interaction. Thus, managers of an R&D unit based in the same country as the headquarters probably have more and deeper social connections with corporate-level managers at headquarters than do managers from more remote subsidiaries. These deeper social connections in turn lead to a greater perception of centrality and a higher probability of initiative survival, as argued previous. A second argument regarding the positive effect of geographic closeness between an R&D subsidiary and headquarters on an initiative's probability of survival pertains to the problem of cultural distance for remote organisational units. Cultural differences create detrimental effects for the initiative's probability of survival, on both the sender’s and the recipient’s side. The effects of cultural difference include uncertainty by the sender of the initiative (i.e., the foreign R&D subsidiary based in a country that is culturally different from headquarters). Cultural differences probably play roles in the intention and approach of subsidiary managers in their efforts to influence the organisation’s strategy. Given research showing that people with different cultural orientations perceive and behave differently (Bond and Smith, 1996; Earley and Erez, 1997; Chen et al., 1998), such differences should affect the way subsidiary and headquarters managers interact. Moreover, studies of upward influence indicate that people adjust their influence tactics to the context and to the target of their efforts to achieve success (Mowday, 1978; Kipnis et al., 1980; Schilit and Locke, 1982; Schilit and Paine, 1987). These findings suggest that those who formulate initiatives need to interpret the organisational context—and specifically the behaviour of corporate-level managers (e.g., whether they are open new to ideas, given the present business situation). For example, before people decide to act, they make appraisals of how encouraging, benign, or threatening a situation is (Lazarus and Folkman, 1984). Employees routinely monitor and read the attitudes and behaviours of top managers to predict how they are likely to respond to internal or external initiatives (Turner, 1980). The processes of sensing, interpreting, and judging presumably are highly culture bound. Local subsidiary managers’ cultural backgrounds probably influence their mental schema about whether, and how, to initiate selling of an issue and thus formulating initiatives (Ling et al., 2005). To assess weak signals such as a 'favourable organisational context', these managers must rely on cues, symbols, and interpretations of behaviours that are all culture-bound. Misunderstandings and misinterpretations may emerge because different cultural contexts may assign different meanings and implications to the same behaviour. Therefore, R&D managers from culturally different subsidiaries may feel uncertain about how to interpret cues that they receive from a culturally distinct headquarters and thus have difficulty sensing when the organisational context is right for sending the initiative. This uncertainty may include harmful misinterpretations, such as when managers think the moment to launch an initiative is not favourable when it actually is. This effect should influence the initiative's probability of survival. Successful sellers of initiatives can read contextual signs and cues that indicate the readiness to commit to, act upon, or consider an issue (Dutton et al., 2001). Analogously, those incapable of reading contextual signs and cues should be less successful in their selling attempts. And typically, those who probably cannot read such signals accurately are culturally distant managers in foreign R&D units. Furthermore, uncertainty and information asymmetry increase on the recipient side of the initiative, that is, among corporate-level managers. These managers receive an initiative from a foreign R&D in the form of a document, whose authors may have a different mindset because of their different national culture.
24
Working relations become more difficult when they involve employees located in different countries and when large cultural distance exists, including differences in power distance, uncertainty avoidance, masculinity, individualism, and long-term orientation (Hofstede, 2001). With increasing cultural distance and national differences, the level of comfort and trust toward a foreign subsidiary probably decreases, making it more difficult to work together (Barkema and Vermeulen, 1997). Such differences may increase the tendency to interact with others from the same culture or country (Earley and Mosakowski, 2000). A large cultural distance between organisational units relates negatively to the quality of their relationship, because levels of comfort and trust between the two parties tend to decrease with greater cultural distance, which makes working relationships quite difficult (Kogut and Singh, 1988). This difficulty probably will lead to corporate-level managers approaching initiatives from foreign R&D subsidiaries more critically or reservedly. Moreover, managers within firms are boundedly rational and lack complete information; therefore, they recombine their knowledge on the basis of different mechanisms that are developed on the basis of not only their experiences but also cues they receive from the environment (Walker, 1985; Simon, 1991). These cues, however, are culture and context bound (as argued previously), which can give rise to misunderstandings. Institutional distance—as expressed by differences in the shared social knowledge, mindsets, social values, and prevailing laws and regulations among different countries—influence managers' bounded rationality constraints as well (Scott, 1995; Kostova, 1999; Xu and Shenkar, 2002). Thus, greater institutional distance increases the likelihood that subsidiary management and corporate management will select different information bundles and even judge the same information differently (Verbeke and Yuan, 2005), an effect that gets exacerbated in a setting that involves cultural contexts. These effects also can lead to cognitive conflicts with the managers of foreign R&D subsidiaries. Issue sellers formulating an initiative use a repertoire of behaviours that constitute an interaction in their selling attempts (Goffman, 1981; Pentland, 1992). If a culturally remote R&D subsidiary formulates an initiative, it will embed this formulation (at least unconsciously) within its own cultural context, with regard to the structure of thought documented in the initiative, the ways of 'doing things', the extent to which planning, forecasting, and contingencies are planned for and documented, and so forth. All of these factors may be interpreted very differently in terms of their extent and importance. Subsidiary managers' behaviour, in turn, should be embedded in their respective national cultures, which may value traits such as, say, self-confidence, creativity, bluntness, or directness very differently than the headquarter manager's national culture. Thus, an initiative that is formulated to make perfect sense for the R&D subsidiary may be misunderstood by corporate-level managers as too detailed or superficial, over-planned or sloppily conceived, and so on. Thus, because the initiative signals the cultural perceptions of those who formulated it, cognitive dissonance may be expected to emerge because of the different cultural interpretations involved. Again, this dissonance probably leads corporate-level managers to take a more critical position and reject initiatives from culturally distant subsidiaries. Together, these arguments yield a prediction that the probability of survival of initiatives that originate from a country with minimal geographical, social, and cultural distance from headquarters (which means the actors' degrees of centrality and relatedness are high) will be greater than those of initiatives that originate from more distant countries. This condition of minimal distance is particularly satisfied if the R&D subsidiary and headquarters are located in the same country. Thus,
Hypothesis 1: A subsidiary initiative sent from a subsidiary based in the same country as the firm's
headquarters has a greater probability of survival than do initiatives sent from other R&D
subsidiaries.
25
3.2 Hypothesis 2
In this section, I build the argument that the probability of survival of an initiative depends on which R&D subsidiary sends the initiative. It is not a new idea to propose that the roles of subsidiaries vary (e.g., Ghoshal and Nohria, 1989). However, I develop a link detailing how these sources of difference probably have an impact on the probability of survival of the subsidiary's initiatives. Thus, I posit that some R&D subsidiaries will be 'more equal' than others with respect to their initiatives' probability of survival. A first important source of difference is the level of independence (including the freedom to collaborate with external parties) granted to an R&D subsidiary. Independence can vary considerably among subsidiaries (Birkinshaw et al., 1998). The stronger the power base of a subsidiary, the higher is its ability to take independent actions that may conflict with headquarters (Andersson and Forsgren, 1996; Mudambi, 1999; Young and Tavares, 2004). Thus, subsidiary independence is linked to the emergence of initiatives. At the bottom of the independence pyramid are those R&D units concerned solely with local development and without any autonomy—called 'technology transfer units' (Ronstadt, 1977), 'support units' (Pearce, 1991), 'technical support units' (Håkanson and Nobel, 1993), or 'local adaptors' (Nobel and Birkinshaw, 1998). Next come units that adapt technology for specific national markets and thus have a greater responsibility, called 'indigenous technology units' (Ronstadt, 1977), 'locally integrated laboratories' (Pearce, 1991), 'adaptive R&D units' (Håkanson and Nobel, 1993), or 'international adaptors' (Nobel and Birkinshaw, 1998). Finally, there are units concerned with the creation of new technology. These units normally enjoy the highest freedom and best resource endowments and have been called 'global technology units' (Ronstadt, 1977), 'internationally independent laboratories' (Pearce, 1991), 'generic R&D and research' (Håkanson and Nobel, 1993), or 'international creators' (Nobel and Birkinshaw, 1998). The firm controls each of these types in a different way by employing varying degrees of formalisation and centralisation. Nobel and Birkinshaw (1998) find that 'local adaptors' are managed with significantly higher levels of formalisation than are two other types. 'International adaptors' are managed predominantly through centralisation, with moderate levels of formalisation, and 'international creators' are controlled through relatively high levels of socialisation, low formalisation, and moderate levels of centralisation. Moreover, the three types differ in their intra-firm and extra-firm communication patterns. 'Local adaptors' have very limited communication with the parent company, and their communication with marketing and manufacturing units outside the local country is extremely low. Local adaptors thus have essentially no links with universities, even local ones, because their corporate role is limited to applied tasks, such as process improvement and product adaptation. 'International adaptors' have a significantly more international communication profile, but their relationships are predominantly with other corporate entities, not with external parties. Their communication with R&D and marketing units in other countries is very limited. Finally, 'international creators' have significantly more communication with local universities, foreign universities, foreign customers, and foreign suppliers, as well as significantly less communication with local customers. International creators also engage in more communication with virtually all other entities, in comparison with the other types and in strong communication with local manufacturing and marketing units (Nobel and Birkinshaw, 1998).
26
All these differences among R&D subsidiaries are highly likely to have an impact on the number and quality of their subsidiary initiatives. More independent subsidiaries are likely to be more entrepreneurial and generate more subsidiary initiatives (Verbeke and Yuan, 2007). However, this trend does not mean that their initiatives are more likely to survive, just because the subsidiary sends more initiatives than others. Yet subsidiaries that enjoy little independence and are allowed little or no communication with external parties will find it difficult to determine whether corporate-level managers are open to new ideas. Furthermore, because of their isolation, such subsidiaries have little chance to use the local market environment or collaborations with other firms, customers, or research institutions as external sources of inspiration and creativity. Consequently, initiatives emerging from such subsidiaries should be based on a much smaller and more imperfect information base than those of other subsidiaries, which enjoy more independence and outward communication. A second source of difference among subsidiaries is their age and experience. The development and recognition of subsidiary capabilities can be understood as a cumulative, path-dependent process (Birkinshaw, 1997; Frost, 2001). Foreign subsidiaries develop over time and take on increasingly specialised roles (Bartlett and Ghoshal, 1986; Jarillo and Martinez, 1990). Older, established subsidiaries typically go beyond the status of knowledge recipients and become sources of new knowledge creation. In such subsidiaries, entrepreneurial initiatives are expected to originate in the subsidiary itself, aided by a favourable corporate context (Birkinshaw and Hood, 2000). These subsidiaries also function as repositories of substantial knowledge bundles, including subsidiary-specific advantages, which permit entrepreneurial ventures (Birkinshaw, 2000; Rugman and Verbeke, 2003). Subsidiaries that have developed areas of strength that can be leveraged among other subsidiaries of the MNC are likely to be viewed as more salient entities in the overall organisation than are those who have failed to leverage such connections (Bartlett and Ghoshal, 1986; Hedlund, 1986; Gupta and Govindarajan, 2000). Thus, subsidiaries that have accumulated experience and capabilities over time have an evolutionary advantage compared with other subsidiaries. These advantages probably appear in their initiatives in the form of a high degree of signalled competence and experience. Therefore, their initiatives seem much more 'credible' to corporate-level managers compared with initiatives sent from young and relatively inexperienced subsidiaries that cannot yet employ such benefits of experience and specialisation. A third source of difference among subsidiaries that probably affects the probability of survival of their initiatives depends on the role the MNC has given the particular subsidiary to play. Medcof (1997) distinguishes eight types of extra-national technology units that differ with respect to the role the firm has given to them. Whereas some types do little more than basic adaptations of extant technology, others have been given assignments to develop new technology. Firms use such assignments to give some subsidiaries a special role as an instrument of strategic management. For example, some firms encourage building 'centres of excellence', such that a particular subsidiary that embodies a set of capabilities gets explicitly recognised by the firm as an important source of value creation, with the intention that these capabilities will be leveraged by and/or disseminated to other parts of the firm (Frost et al., 2002). Another instrument is the awarding of 'world product mandates', whereby a specific subsidiary receives global responsibility for a certain product or technology (Roth and Morrison, 1992; Cantwell and Mudambi, 2005).
27
Such subsidiaries, characterised by special roles and responsibilities, are much more likely to contribute to the firm's competitive advantage (Birkinshaw et al., 1998). For the survival of initiatives, this distinction means that these subsidiaries will use their mandate to signal their experience and trustworthiness; moreover, because their status as a special unit is known company-wide, their competence is known to most organisational decision makers. Thus, they can portray their initiatives as coming from a special and trustworthy source that merits attention, compared with the initiatives of unknown subsidiaries that cannot use any special designation as a signalling mechanism for the quality of their initiatives.
These arguments suggest that the categories of differences among subsidiaries imply very different levels of entrepreneurial behaviour inside the subsidiaries. Moreover, some subsidiaries will be able to use their special roles, experiences, responsibilities, and designations as signalling mechanisms for the quality and trustworthiness of their initiatives, whereas other subsidiaries will not have access to these possibilities. These effects will lead to a significant difference in the number of subsidiary initiatives sent, as well as in the quality of the initiatives sent. These two effects, in turn, will influence the initiative's probability of survival. Thus, I posit: Hypothesis 2: Initiative survival varies according to the subsidiary that sends the initiative.
3.3 Hypothesis 3
In this section, I build an argument pertaining to connectivity, namely, that the closer an initiative is to the firm's currently existing R&D programmes, the better is that initiative's chance of survival. In contrast, initiatives that target a programme remote from the firm's core technological capabilities or of lesser importance to the firm will have a lesser probability of survival. Any firm is under constant pressure to align its products and services to changing customer and market demands. Thus, initiatives proposing improvements to the firm's core products and/or technologies that directly address these customer demands should be received more favourably than initiatives that target an area of only minor importance to the firm (e.g., that benefit a smaller division that generates only a small amount of the firm's total turnover). In other words, the better the connectivity of the initiative to issues that are 'important' to the firm in terms of product and market volumes, the better the survival probability of that initiative will be. Managerial time and attention are scarce resources in organisations (Pfeffer, 1992). Both managers and non-managers compete to gain the attention of top policymakers to issues that they believe are important to the organisation. Thus, managerial attention cannot be taken for granted. It is typically divided among competing claims in ways that do not give an equal hearing to all parties (Simon, 1947; Cyert and March, 1963; Ocasio, 1997). In the context of the MNC, the heuristics that guide senior executives lead them to focus their attention on those markets with the greatest ‘weight’ in the corporate system, leaving smaller markets, or those a long way from headquarters, in the dark (Doz et al., 2001) When corporate-level managers are faced with subsidiary initiatives, their own corporate management context influences their bounded rationality constraints. The corporate management context reflects the aggregate attributes, such as the cognitive abilities, experience, and expertise of the top management team members, that make them more or less receptive to subsidiary initiatives (Verbeke and Yuan, 2005). They probably give their primary attention to those initiatives to which they can relate their personal goals. These goals are often geared toward enhancing the performance and sales volume of the firm's existing products. Therefore, managers are likely to focus their attention on those initiatives that they believe can help them realise such goals.
28
This situation should be the case particularly if initiatives are characterised by a signal or cue that they relate directly to the firm's core areas of activity (e.g., by focussing on one of the firm's core technologies or a leading product). However, if the initiative targets an area to which managers cannot relate their growth and performance goals (e.g., initiatives to compare product performances and generate strategic options rather than to improve extant products), its success probability can be expected to be lower. Middle managers formulating strategic initiatives exhibit behaviours in which they 'align' themselves with the cognitive patterns and goal-fit expectations of corporate-level managers. Those managers are aware of norm conformity, as evidenced by their sense that selling initiatives without a solution, data, or the backing of the chain of command creates image risk. If they feel they cannot relate their initiatives to corporate-level managers' goals and perceptions, middle managers probably hold back rather than undertaking this discretionary activity (Dutton et al., 1997). Empirical studies support this argument. Initiatives that attempt to implement strategic change will be those that are close to the firm's already existing pool of knowledge (Winter, 2000), such that initiative choice becomes bounded to well-known areas rather than new ones (Zahra et al., 1999). Initiatives that build on an organisation’s competence are more likely to receive attention than those that do not (Tushman and Anderson, 1986; Burgelman, 1994) Finally, the extent of upward influence on corporate strategy probably differs depending on whether the business relates to the core business of the firm. If the unit's business and the corporation's core business are related, the subsidiary manager will be strongly motivated to influence corporate strategy, because this relatedness affords opportunities for economies of scale and scope not available to managers of unrelated businesses (Watson and Wooldridge, 2005). Hence, the manager of a related business is more likely to become a sender of subsidiary initiatives. Relatedness also influences the receiver of such messages (corporate-level management). The subsidiary manager's experience in managing a business related to the strategic core of the corporation will lend credibility to, and encourage attention to, the manager's recommendations or other attempts to influence corporate strategy. In summary, relatedness probably is associated with influence attempts that fall within the corporation's 'dominant logic'. If dominant logic is thought of as a filter (Bettis and Prahalad, 1995), less related influence attempts may be perceived as less relevant and hence be filtered out (Watson and Wooldridge, 2005). Consequently, the initiative's survival probability should be influenced by how 'connected' the initiative is to the firm's current technological trajectories. In other words, an initiative that is not aligned with the firm’s focus will have a lower probability of survival. These arguments lead to the following hypothesis: Hypothesis 3: Initiative survival is positively associated with the initiative's connectivity to the
firm's core areas of activity.
29
3.4 Hypothesis 4
In this section, I suggest that if two or more subsidiaries collaborate to formulate an initiative, that initiative will have a higher probability of survival than initiatives proposed by a single subsidiary. First, seeking support from other subsidiaries opens up integrations of expertise, power, resources, and political connections among the subsidiaries. Seeking support from outsiders also represents a successful strategy among managers who formulate initiatives to 'sell' issues (Lyles and Reger, 1993). Second, selling issues together with others also relates to the political necessity of building a stronger coalition to articulate and motivate the investment of attention in an issue. In addition, a coalition also taps a broader range of resources (e.g., money, time) that can be used to convince top management that an issue is legitimate and important. By inviting others into their selling efforts, issue sellers enhance the likelihood that they will gain top management's attention (through greater visibility and collective influence). Third, involving others in selling attempts protects the seller from a specific impression-management concern, that is, being the sole voice promoting a particular issue. Because top management gets information from various sources, if a seller is the only voice for an issue, he or she might look bad in the eyes of top management (e.g., as deviant or out of synch with the organisation). If sellers involve others in their efforts however, they protect themselves against this possible loss of image. In summary, the more an issue seller brings others on board to help sell his or her issue, the greater the level of top management's attention invested in the issue (Dutton and Ashford, 1993), and thus, ceteris paribus, the greater the initiative's probability of survival should be. Furthermore, by building a coalition of actors that sees and understands the importance of an issue, the seller increases the chance that the coalition will include 'articulate, persuasive sponsors who can make the case' (Burgelman and Sayles, 1986: 89) that the issue is important. Knowledge required for recombination does not reside only in one particular individual in an organisation, nor is it distributed uniformly throughout the organisation. Rather, it resides in the groups of individuals and the routines that connect them (Nelson and Winter, 1982). In an intra-firm network, managers acting as knowledge brokers or boundary spanners can bring together different knowledge streams, which leads to richer content (Hargadon and Sutton, 1997). Teams in a subsidiary focused on new product development actively search for related technological competences in other subsidiaries, especially competences that fall in the same areas as those required by the team (Markides and Williamson, 1994; Farjoun, 1998). Thus, subsidiaries search for related competencies in other subsidiaries when they want to formulate an initiative jointly. Within-group communication channels may make product developers more aware of opportunities for leveraging competencies (Katz and Tushman, 1979; Hansen et al., 1999), so once managers in a particular subsidiary become aware of other subsidiaries' competences and perceive them as valuable and helpful for their initiative-crafting efforts, they probably will ask that subsidiary to collaborate in a joint initiative effort. Product development teams are often encouraged to develop strong cross-functional and cross-unit relations (Clark and Fujimoto, 1991; Eisenhardt and Tabrizi, 1995). Because many strategic initiative entail changes to the firm's product–market mix, the sender of an initiative can be expected to want to utilise such cross-relations. Also, even connections to subsidiaries that do not possess related competencies may offer unexpected benefits.
30
Although such subsidiaries may not possess the most directly relevant knowledge for a project team, working with them may lead to the discovery of unexpected benefits, such as novel combinations of existing technologies (Graebner, 2004). In turn, it would be rational for a subsidiary to search actively for such actors in other subsidiaries because of the beneficial effects this inclusion implies for the initiative's survival: The subsidiary can benefit from the signalling effect created if the other subsidiary has a world product mandate or is a centre of excellence; it can draw on the resources of others to complement its own or to overcome shortages; and it can tap into other researchers’ expertise and experience. Thus, access to knowledgeable individuals in other subsidiaries probably entails a multiplication of the opportunities for fruitful knowledge, which should strengthen the initiative's arguments and subject matter. Indeed, the degree of relatedness in competencies among an MNC's subsidiaries may lead to synergy benefits (Markides and Williamson, 1994). Moreover, the signalling effect of including company-known 'experts' in the initiative may serve to influence managers' bounded rationality. In combination, these effects should enhance the quality and trustworthiness of the initiative compared with a hypothetical initiative initiated by a subsidiary in isolation. Thus, its probability of survival is likely to be greater than that of initiatives conceived by one subsidiary in isolation. Therefore, Hypothesis 4: Initiative survival is positively associated with the number of cooperating
subsidiaries that jointly formulate the initiative.
3.5 Hypothesis 5
In this section, I build the rather straightforward argument that past success matters, that is, that an initiative proposed by persons who have already provided successful initiatives have a higher probability of success than do those formulated by less successful persons. Attributes of sellers' past histories and current situations can give them the credibility necessary to be successful in their selling attempts (Ashford et al., 1998). Studies of persuasion show that source credibility affects the believability of the seller's message (Hovland and Weiss, 1951; Petty and Cacioppo, 1986). Previously, I have argued that managers have limited attention spans and information-processing capacities and therefore rely on cues and signals, which they interpret as indicators of objective properties that would be tedious to assess. Here, I also argue that one such indicator is the 'success record' of the manager who sends the initiative (i.e., the number of initiatives successfully recognised in the past). Corporate-level managers probably believe that the history of someone who successfully has offered many initiatives will lead to future beneficial effects for the firm if it implements this person’s next initiative. In this vein, Ashford et al. (1998) consider the past record of issue-selling success a key factor of the credibility of the next issue-selling attempt. If sellers have been successful in the past, they probably consider their chances of success in the future more positively and therefore are more willing to sell an issue (which results, ceteris paribus, in such persons sending comparatively more initiatives than others). This positive assessment occurs because they generalise from their past experience of success in issue selling or from their general performance track record to the current specific act and assume that their credibility as an issue seller and their perceived probability of selling success is strong. Thus, they probably are more self-confident and assured in the process of selling the initiative and negotiating with other actors and corporate-level management for support.
31
A record of many past successful initiatives also generates an image of general job success. Image-perception theory suggests that in developing images of another, observers often attend to a few salient cues and then interpret subsequent information in a manner consistent with those cues (Staw, 1975). Moreover, other people actively use a person's success or reputation to draw inferences about that person's power and interpret his or her behaviour (Gioia and Sims, 1983). Thus, a manager's past success record will create an image among corporate-level managers that this manager will probably be successful in the future. Managers who have had many of their initiatives recognised also can be assumed to differ from other managers. Research on innovation champions and entrepreneurs suggests that certain types of people have a high propensity to 'sell issues' by embedding them in many initiatives. Specifically, they are more optimistic, and the persistence associated with optimism differentiates these innovation champions from non-champions (Howell and Higgins, 1990). High-performing business units and their managers should appear prominent and positive to the CEO, which enhances the ability of these managers to influence corporate strategy (Watson and Wooldridge, 2005). It is thus reasonable to assume that such persons, because of the image of optimism they project, will be regarded by corporate-level management as competent when it comes to implementing the initiative. Dutton et al. (2001) even speculate that if such persons build up a 'specialisation advantage' in terms of having their initiatives recognised, 'star sellers' (i.e., managers with a long track record of issue-selling success) will emerge over time. These arguments yield the following hypothesis: Hypothesis 5: Initiative survival is positively associated with the sending manager's past success
record, namely, the number of prior accepted initiatives sent by that manager.
3.6 Hypothesis 6
In this section, I build the final argument: Initiatives that propose exploitative innovation (e.g., incremental improvements to already existing products), rather than radical innovation (e.g., a new basic technology), have a higher probability of survival. I develop this argument on the basis of research on ambidexterity. Products and product technologies are subject to changes induced by new production technologies and technological discoveries. An initiative may encompass these developments, suggesting a change to the firm's existing products and/or technologies, through either radical (exploratory) or incremental (exploitative) innovation. Exploitative innovations are technological innovation activities that build on an existing technological trajectory and attempt to improve existing product–market positions, components, or architectures. Exploratory innovations are technological innovation activities aimed at entering new product market domains, which implies a shift to a different technological trajectory (Christensen, 1997; Benner and Tushman, 2002, 2003; He and Wong, 2004; Jansen et al., 2006). Exploitative innovations are associated with local search; therefore, the search strategy of the firm is to scan close and familiar areas, both technologically and geographically. Exploratory innovations are associated with distant, exploratory searches that advance into unknown and unfamiliar areas (March, 1991).
32
Discontinuous or radical innovations associated with exploratory activities imply fundamental changes to the current technology and thus transcend current organisational knowledge (Ahuja and Lampert, 2001). Any search that deviates too much from the firm's existing knowledge base will hurt product performance (Martin and Mitchell, 1998). Innovations that serve different customer sets or rely on new and unknown technologies are highly uncertain and difficult to measure (Henderson et al., 1998). Whereas the benefits of exploitation are certain, positive, and close in time, the returns on exploratory activities, if any, are distant and uncertain (March, 1991; Levinthal and March, 1993). The probability of finding valuable new knowledge elements is small, and even if a firm succeeds in doing so, the same product idea may already have been discovered (Katila and Ahuja, 2002). Even if exploratory search yields useable knowledge, acquisition cost and integration difficulties can outstrip the benefits of this knowledge (Sidhu et al., 2007). Moreover, exploitation activities are associated with quickly attainable goals and with a high probability of success, whereas exploration entails considerable risks and costs that may never be offset by the appropriate benefits. Past successes in exploitative tasks create path dependencies, because choices must vie for scarce resources and because prior investments already exist (Sidhu et al., 2007). Thus, path dependencies built as a result of previous resource allocation patterns create 'innovation traps' that restrict the commitment of resources in future periods. The selection of innovations therefore becomes biased toward exploitative innovations, as exploratory innovations get crowded out (Levinthal and March, 1993; Christensen, 1997; Benner and Tushman, 2002; Audia and Goncalo, 2007). The successful development of new products and processes also draws on accumulated experience, but this experience may be difficult and costly to codify systematically (Nonaka, 1994). For highly tacit technologies, the precise relationships between different design parameters and product performance are unknown, which increases the uncertainty of R&D projects. Project management research shows that managers classify a project as 'risky' when the likelihood of a bad result is great, the ability to influence it within the time and resource limits of the project is small, and its potential consequences are severe. Moreover, such risky projects have a greater probability of failure than others (Sitkin and Pablo, 1992; Smith, 1999). These conditions are typical for exploratory technology developments and thus get imposed upon an initiative that proposes to engage in such seemingly risky undertakings. Therefore, managers anticipate these risks and tend to engage in risk-avoidance behaviour. Finally, the impetus for innovation and the subsequent allocation of resources usually depends on the demands of existing customers in existing markets. Therefore, resource allocation processes generally nourish sustaining innovations that address current customers’ needs (Christensen and Bower, 1996). Because each resource unit can be allocated only to either exploration or exploitation (Christensen and Bower, 1996; Benner and Tushman, 2003; Garcia et al., 2003), corporate-level managers probably discard initiatives that propose exploratory innovation in favour of initiatives that propose exploitative innovation, because the latter entail neither the risk nor the high cost of exploratory activities. Thus, Hypothesis 6: Initiatives proposing an exploratory activity have a lesser probability of survival than
initiatives proposing an exploitative activity.
33
4. Data and Methods 4.1 Research setting
My research setting is a single Swiss multinational firm with a global R&D organisation, active in the electronic equipment industry. By choosing such a setting, I can concentrate on a single industry and thus control for unobservable environmental influences among different industries (Dean and Sharfman, 1996). Furthermore, this focus on a single firm allows control over unobserved heterogeneity between firms, which probably influences the way initiatives are treated and evaluated. For example, differing survival time of initiatives across firms may be due to firm-specific idiosyncrasies that are not directly observable. By choosing to analyse a single firm, I eradicate this problem. With this approach, I also follow the successful example of others who have also used single-firm settings to analyse intra-firm processes (e.g., Szulanski, 1996; Hansen, 2002). Due to the high confidentiality of the initiative data, I had to sign a confidentiality statement that I would not reveal the firm's name or those of the managers that had formulated initiatives. This firm's R&D activities are distributed over 10 so-called corporate research centres that conduct all of the firm's R&D activities. Each corporate research centre is a wholly owned subsidiary that has its own local management, resources, and R&D staff. The research centres are located in Europe (Switzerland, Germany, Italy, Norway, Sweden, Finland, Poland), the United States, China, and India. Together, they employ approximately 7,000 managers and R&D staff. They all send initiatives in an attempt to influence the firm's strategic decisions about which technologies to pursue and which products to develop. The firm's initiative process is a typical stage-gate process (cf. Cooper and Kleinschmidt, 1987). Every initiative must pass through six gates labelled 'G0' through 'G5'. The progress of an initiative along these gates is tracked by a Lotus Notes database accessible to all research centres. This database records a data set of substantial information about each initiative, such as date of submission, date of recognition or rejection, the sending manager's name and affiliation, an abstract of the initiative's subject matter, and many more details. Additional documents, presentations, and calculations associated with each initiative are attached to the data set. At each gate, corporate-level managers based in the firm's global R&D headquarters in Switzerland decide whether the initiative will be carried forward to the next gate or rejected. The decision to reject an initiative is final and cannot be reversed. Still, the database retains all data about a rejected initiative. Each initiative also is assigned a unique tag number that tracks its way through the gates. The actions and decisions taken at the various gates are as follows: Gate G0 marks the entry of the initiative into the database by the manager who formulated the initiative. Information about the initiative at this point consists of its projected cost and NPV calculation, the name of the sending manager, other managers from other research centres that want to collaborate in the foreseen project, a captive title, and Word documents and PowerPoint presentations that detail the initiative's economic and technical content. Gate G1 is the first formal evaluation, in which managers in the firm's global R&D headquarter in Switzerland determine whether the initiative meets basic criteria for eligibility. In Gates G2–G4, a board of headquarters managers and technical experts make decisions about the initiative's technological feasibility and economic viability. Finally, at gate G5, headquarters managers decide whether the initiative finally will be accepted or not. If it is, the manager who sent it receives a mandate and a project budget to start the intended project. For all gates, the date of decision is entered into the database immediately after the decision has been made. Thus, it is possible to both track the precise number of days that an initiative has remained in the system and assess whether it has 'survived' (i.e., successfully passed gate G5) or 'died' (i.e., was rejected at any of the gates G1–G5).
34
Therefore, the data coverage is extraordinary. Not only is all information about the initiatives objectively documented, but it is also free from subjective interpretation and measurement error. Moreover, because the database retains all time-related information on all initiatives, a survival analysis of their failure and the associated reasons becomes possible. 4.2 Population and sample
The population of initiatives consists of all documented initiatives in the database entered between January 1, 2000 (the day the firm adopted the stage-gate process) and February 22, 2007 (the day I collected the data). To collect the initiative data from the database, I collaborated with the CFO of the firm's global R&D organisation, his assistant, and two database experts that exported the Lotus Notes data into an Excel spreadsheet file. The database contains initiatives from not only corporate research centres (i.e., subsidiaries) but also corporate-level managers. However, only initiative data on initiatives sent from the research centres was extracted. This extraction yielded a sample of 1,377 initiatives contained in an Excel spreadsheet. I subsequently converted this file into a Stata data set. Next, I performed an initial data screening to check the information content and measurement accuracy of the data. This analysis required that I eliminate 189 initiatives because of excessive missing data (e.g., the sending manager had not entered any information about the initiative except the title). A further 72 initiatives had to be eliminated because they turned out to have been sent from corporate-level managers, not one of the research centres. For the rest of 1,116 initiatives, almost all information on the initiative was complete, including the dates when the decisions at the respective dates were made. Missing data among these 1,116 initiatives was less than 0.6% and completely random, so that no distortion effects from missing data arise. I therefore left the few missing values as they were instead of applying imputation procedures. All statistical analyses and model calculations rely on this final sample of 1,116 initiatives. 4.3 Measurement
4.3.1 Dependent variable
Consistent with the logic of survival time models (cf. Section 4.4.1), the dependent variable is an initiative's survival time. I measured this time as follows: If the initiative was finally accepted at gate G5, I calculated the survival time in days as the difference between the date the initiative was finally accepted and the date of gate G0 (i.e., the date the initiative entered into the database, which I interpret as the initiative's 'birthday'). If the initiative was rejected at any of the gates G1 to G5, I calculated the difference between the date of the rejection decision and the date of gate G0. Simultaneously, I created a dummy variable labelled death that logged the failure event by coding every initiative that failed prior to or at gate G5 as '1' and all other initiatives as '0'. 4.3.2 Independent variables
I order the discussion of how I measure the independent variables according to my six hypotheses. To test hypotheses 1 and 2, it is necessary to know which subsidiary sent the initiative. This information is coded in the database. I model this information as a multinomial variable that records the 'nationality' of each research centre. This variable is then decomposed into as an array of 10 dichotomous indicators (i.e., one indicator for each corporate research centre), which each take the value 1 if an initiative is sent from a particular research centre and 0 otherwise. This variable is labelled Research Centre Provenience.
35
Hypothesis 3 predicts a relationship between initiative survival and the direct applicability of the initiative's subject matter to the firm's technological trajectories. To measure this direct applicability, I use information about which research programme the sender of the initiative is targeting. Specifically, the firm has 25 research programmes, 2 of which serve exclusively to evaluate technology (i.e., they are remote from the firm's core areas of activity). Table 1 features all of the firm's research programmes. Table 1: The firm's research programmes
Programme No. Content of research programme
1 Advanced industrial communication 2 Automation networks and devices 3 Business technology evaluation 4 Catalysis and chemical processes 5 Control & optimisation 6 Distributed power and renewables 7 Engineering and service technologies 8 Industrial communication 9 Manufacturing technologies
10 Mechatronics 11 Mechatronics and robotics automation 12 MEMS/sensors 13 Nanotechnologies 14 Power device technologies 15 Power electronics 16 Power T&D applications 17 Sensors and microsystems 18 Sensors and signal processing 19 Software architecture & processes 20 Sustainability and global change 21 Technology evaluation 22 Upstream technologies 23 Utility systems and solutions 24 Various AT, PT, RD 25 Wireless communication
In addition to this list, which is encoded in the database, I created an additional programme (no. 26, or 'none') if an initiative did not target any of these programmes. The newly created variable is labelled Research Programme, which computationally can be decomposed in an array of 26 indicators that each take the value '1' if the initiative is targeted at a specific research programme (i.e., 'none' counts as a separate programme) and '0' otherwise. Thus, according to this measurement, I would expect that initiatives that target general programmes (nos. 3 and 21) or no research programme at all (no. 26) would have a significantly lower probability of survival, because these initiatives are not directly related to any core technology area of the firm. Programmes 3 and 21 intend to evaluate existing, rather than developing new, technologies or products, whereas programme 26 logs initiatives that target no specific research programme at all.
36
Hypothesis 4 requires measuring whether subsidiaries have foreseen collaboration possibilities with other subsidiaries upon submission of the initiative. In the firm's initiative database, this information is coded in a simple text line that details research centres that have collaborated to formulate the initiative. For each initiative, I analysed this text line and assessed whether the initiative was conceived by two or more subsidiaries. I coded this information as a variable labelled Inter-Centre Cooperation by assigning the value '0' to initiatives that were conceived in isolation and '1' to those conceived in collaboration with other research centres. Hypothesis 5 predicts that initiative survival will be positively associated with the senders' past success record, or the number of initiatives by that specific sender that have been recognised in the past. To measure this success record, I note that the database logs the name of the manager who sent the initiative in a separate text field. Thus, I regrouped the list of initiatives by this text field, which allowed me to analyse the number of initiatives each manager who was logged into the database had sent over time. I then analysed how many of these initiatives had been successful in the past by checking whether this initiative had been recognised at gate G5. For each manager, I added the number of recognised initiatives and coded this value as a variable labelled pastSuccess. Finally, I assigned the respective value of this variable to each initiative the respective manager had sent. Finally, Hypothesis 6 requires measuring whether the initiative's subject matter is exploratory or exploitative. To measure this difference, I recognise that the sender must mark whether an initiative's rationale is technology development (in this case, the database sets a flag 'TD') or product development ('PD'). Thus, by entering this information, the initiative-sending manager objectively documents whether his or her initiative adopts an exploratory or exploitative nature. Because the two indicators are perfectly collinear, I can construct an indicator labelled Inno_Techdev that takes on the value '1' if the database has set the flag 'TD' for the initiative, that is, if the initiative's rationale is exploratory technology development, and '0' otherwise. 4.3.3 Controls
Because my research setting entails studying a single firm within a single industry, the usual controls, such as firm size or industry affiliation, do not make sense. However, there are two important factors—project cost and the inclusion of a net present value (NPV) calculation—by which initiatives differ and that thus may be sources of unobserved heterogeneity. In the following sections, I describe why I choose to control for these two factors and how I model the respective control variables. First, each sender of an initiative must include a statement of estimated future project costs when submitting the initiative. This estimate is mandatory, because it serves to inform corporate-level managers about the intended magnitude of the project. It is likely that the subsidiaries (research centres) differ in the amount of cost they can spend on the project; thus, project cost can be interpreted as a proxy for the future resource endowment they will attribute to the project. Larger subsidiaries obviously should be better able to generate large-scale projects than smaller subsidiaries. Project cost thus may reflect pertinent factors, such as the number of R&D personnel engaged in the future project. Higher project costs are likely to be correlated with longer project durations, which Håkanson and Nobel (2000) find are positively associated with reverse technology transfer. Thus, a manager may be tempted to overstate project cost. Moreover, project cost could have a distorting effect because of the signalling effect conveyed to headquarters managers: Project cost is both a signal of the subsidiary's resource endowment, which adds credibility to the initiative, and a potential source of criticism if it is excessive. Thus, project cost could be a source of unobserved heterogeneity that must be controlled for. I model this control variable in a straightforward way by coding the projected future project cost, as entered into the database by the initiative-sending manager, into a ratio variable labelled Projectcost.
37
Second, upon submission of the initiative, the sending manager has the option (but not the obligation) to include a net present value (NPV) calculation. Although the calculation itself is included in the documents attached to the initiative, the computational result (i.e., the NPV value itself) is directly entered into the database. Because entering this value is optional, initiatives differ in terms of whether they specify an NPV value. I argue that the presence of an NPV should influence the decision-making manager's perception of the initiative. In particular, the sender may overstate the NPV to create a more favourable impression of the initiative's economic viability. The different cultural contexts in which subsidiaries are embedded may lead to over- and understatements of NPV, depending on whether the local culture deems that such behaviour is acceptable. The inclusion of an NPV value therefore may be a source of heterogeneity that needs to be controlled for. Upon inspection of the data, I found that the database had NPV data for only 228 out of 1,116 initiatives. I thus refrained from using the direct figure of NPV and instead constructed an indicator labelled NPV_yes, coded '1' if the database had logged an NPV value and '0' otherwise. Because that NPV data are missing for about two-thirds of the sample, including the direct figure as a continuous measure would not make sense. Finally, initiatives may be independent across but not within research centres, so that distortions from clustering effects could be possible. To prevent these, I decided to estimate all models with a cluster variable labelled InitiatingCRC to enable the estimation of a frailty component (cf. Section 4.4.5). Table 2 summarises my measurement approach.
Table 2: Variables and coding
Variable Code Name(s) Nature of Variable Used to Test
Survival time (in days) _t integer n/a (dependent variable) Failure event death dichotomous n/a (event tracking) Research centre provenience
fromCH (Switzerland)
fromCN (China)
fromDE (Germany)
fromFI (Finland)
fromIN (India)
fromIT (Italy)
fromNO (Norway)
fromPL (Poland)
fromSE (Sweden)
fromUS (USA)
dichotomous H1, H2
Research programme Program1
…
Program26
dichotomous H3
Inter-centre cooperation InterCrcCoop dichotomous H4 Past success record pastSuccess integer H5 Exploratory innovation Inno_Techdev dichotomous H6 Project cost (millions of U.S. dollars)
Projectcost ratio n/a (control)
Net present value NPV_yes dichotomous n/a (control) Initiating research centre
InitiatingCrC categorical n/a (used to control for frailty / clusters)
38
4.4 Survival analysis
I use survival analysis to construct and test survival time models of how long an initiative survives and simultaneously examine whether the initiative survives the stage-gate process beyond gate G5. I regress this information on the independent variables and controls to identify which effects significantly influence an initiative's survival time. Because this analytical technique is relatively new and statistically more demanding than first-generation methods, I next provide an overview of the principles of survival time analysis and its analytical possibilities. By doing so, I demonstrate how the powerful analytical properties of these models are appropriate for testing my hypotheses and thus providing answers to my research questions. Therefore, the following discussions are not abstract but connected to my specific research setting. 4.4.1 Principles of survival analysis and survival time models
Survival analysis was first used in epidemiological research and biostatistics. It analyses data in which the dependent variable is time until a failure occurs (survival time). In biostatistics, this failure (also called an event) is most commonly the death of an individual from a given population. In my research context, the event is the 'death' of an initiative if it is rejected at any of the gates G0 to G5. In this case, the initiative has been rejected for good, and the sender has no chance to pursue it further. There are different 'types' of failure: An individual may simply experience one type of failure, but several types of failure could compete (competing risks), or failure might occur more than once during the study period (recurrent event). In both cases, special models are required to model these settings. However, in my study setting, there is only one discrete failure time, namely, the point in time when the initiative is rejected. This rejection is final, so an initiative that fails has failed forever and has no chance of experiencing another failure. Therefore, I will not discuss models for competing risks or recurrent events (see Kleinbaum and Klein, 2005: 331ff., for an introduction to these models). A typical characteristic of survival-time data is right-censoring, which occurs for three reasons: The individual does not experience the failure before the study ends, an individual is lost during the study (most commonly, patients dropping out of a medical trial study), or an individual withdraws from the study by either experiencing the failure or for some other reason. The less common case of left-censoring exists when an individual's true survival time is less than or equal to that individual's observed survival time (Kleinbaum and Klein, 2005: 6-7). In my context, information on the survival of initiatives is right-censored because an initiative may be lost, some initiatives are successful beyond gate G5, and some initiatives fail at some gate prior to G5 (i.e., are rejected). Left-censoring does not occur in my data set. However, survival time models can handle this censoring by using all information available in the data set to estimate the survival time rather than discarding censored data (Hosmer and Lemeshow, 1999: 17-21). Survival analysis is based on survivor functions and hazard rates obtained from the population. Let T be a random variable for an initiative's survival time, t be a specific value of T, and F(t) denote the cumulative distribution function of T. The survivor function S(t) describes the probability that T exceeds t, that is, the probability that the initiative is not rejected prior to a given time t:
( ) ( ) 1 ( )S t P T t F t= > = − (1)
39
The density function of T, denoted by f(t), can be obtained by simple differentiation:
( ) (1 ( ))( ) '( )
dF t d S tf t S t
dt dt
−= = = − (2)
From these two functions, the hazard rate h(t)—also known as the inverse of Mill's ratio—can be obtained. The hazard rate describes the instantaneous rate of failure, or the instantaneous potential per unit time that the initiative is rejected, given that the initiative has survived up to time t. It has units of [1/t] and can be conveniently derived from the survivor function and the density function, as follows:
0
( | ) ( ) '( )( ) lim
( ) ( )t
P t T t t T t f t S th t
t S t S t∆ →
≤ < + ∆ ≥= = = −
∆ (3)
Thus, the hazard rate is directly determined by the survivor function and its derivative. A direct equivalent to the survivor function, the hazard function H(t), can now be obtained easily by integrating the hazard rate function over time:
0
( ) ( )t
H t h u du= ∫ (4)
Because it is unlikely that the hazard rate is determined solely by time but also relies on a vector of covariates xj, the hazard rate can be specified in general terms, where the hazard for the j-th initiative is some function g(.) of time t and the product of a row vector2 xj of covariates and a column vector βx of regression coefficients (Cleves et al., 2004: 19), as follows:
0( ) ( , )j x jh t g t β= +β x (5)
Depending on how the hazard rate is specified (if at all), the choice among nonparametric, semi-parametric, and parametric survival analysis is determined: If the hazard rate is not specified a priori but computed by directly estimating the survivor function from the data, the model is called nonparametric (see Section 4.4.2). If the hazard is decomposed into a baseline hazard and a function r(β0 + βxxj), where the baseline hazard is not specified a priori, the model is called semi-parametric (see Section 4.4.3). If survival time itself is assumed to follow a known distribution which is specified a priori, the model is called parametric (see Section 4.4.4). 4.4.2 Nonparametric survival analysis
Nonparametric analysis estimates the survivor function directly from the data without any a priori distributional assumptions regarding the hazard rate or the survivor function. Neither are any effects of covariates modelled, and the comparison of the survival experience occurs at a qualitative level across the values of the covariates (Cleves et al., 2004: 90). Therefore, nonparametric survival analysis restricts to estimates of the hazard and survivor functions as such and to comparisons across groups. Nevertheless, given the absence of distributional assumptions, it is a robust tool that enables the identification of significant patterns in the data and thus contributes to future model building procedures. I use three nonparametric techniques: the Kaplan-Meier estimator, the Nelson-Aalen estimator, and nonparametric tests for significant group differences.
2 Following international standard notation, I use bold font to designate vectors and matrices, to distinguish them from coefficients.
40
The Kaplan-Meier estimator is a nonparametric estimate of the survivor function S(t), that is, of the probability that an initiative will be rejected past time t. It is given by
|
ˆ( )j
j j
j t t j
n dS t
n ≤
−=
∏
(6)
where nj is the number of initiatives at risk at time tj, and dj is the number of failures at time tj (Kaplan and Meier, 1958). Its standard error is computed as follows (Kalbfleisch and Prentice, 2002: 18):
2
2
( )ˆ ( )
ln
j
j j j j
j j
j j
d
n n dt
n d
d
σ−
= −
∑
∑
(7)
In data sets with many observations, this estimator produces a long list of how many initiatives were at risk at time t, how many failed, and the chance of survival of the next initiative. Graphically, across all observations, a Kaplan-Meier curve shows the decreasing probability of survival over time. Because of the intuitive appeal of these graphs, I use Kaplan-Meier graphs for the nonparametric analysis. For the interested reader, I provide the output of the Kaplan-Meier survivor estimates in Appendix A. Whereas the Kaplan-Meier estimator estimates the survivor function, the Nelson-Aalen estimator estimates the hazard function. It can thus be thought of as a 'mirror' to the Kaplan-Meier estimator and is given by (Nelson, 1972; Aalen, 1978):
|
ˆ ( )j
j
j t t j
dH t
n ≤
= ∑ (8)
where nj is the number of initiatives at risk at time tj, and dj is the number of failures at time tj. Its standard error is given by (Aalen, 1978)
2
2|
ˆ ( )j
j
j t t j
dt
nσ
≤
= ∑ (9)
In the remainder of this dissertation, I analyse Nelson-Aalen graphs. For the interested reader, I provide the output of the Nelson-Aalen cumulative hazard estimates in Appendix B. In addition to graphing the estimated survivor and hazard functions, I determine whether initiatives' survival probabilities differ significantly across groups. Nonparametric tests indicate the possible existence of such significant group differences. I will consider the log-rank (Mantel and Haenszel, 1959), Wilcoxon-Breslow (Gehan, 1965; Breslow, 1970), Tarone-Ware (Tarone and Ware, 1977), and Peto-Peto-Prentice (Peto and Peto, 1972; Prentice, 1978) tests. All four tests examine the null hypothesis that there is no significant difference between the survivor functions of the k groups being compared, where k may vary from 2 to infinity.
41
All tests are based on the general idea of testing the equality of survivor functions across two or more groups by comparing expected and observed counts of failed initiatives across failure times. They vary in power according to the way in which the null hypothesis is violated (Cleves et al., 2004: 115). Stata (2005: 300-304) provides the estimators, standard errors, and statistics of these tests. The latter three are all variations of the log-rank test statistic, derived by applying different weights at the j-th failure time. The Wilcoxon-Breslow and Tarone-Ware tests place more emphasis on the information at the beginning of the survival curve, so that early failures receive more weight than later failures. The Peto-Peto-Prentice test weights the j-th failure time by the survival estimate calculated over all groups combined. I will not use the Fleming-Harrington (Harrington and Fleming, 1982) test because it allows the user to specify two weighting parameters to choose whether earlier or later survival times should be given more weight (Kleinbaum and Klein, 2005: 58, 64-65). However, in my data set, this choice would be arbitrary, because an initiative may fail at any time during the stage-gate process. 4.4.3 Semi-parametric survival analysis and the Cox model
Semi-parametric methods decompose the hazard rate function of equation (5) into a baseline hazard, denoted by h0(t), and a function r that specifies the functional form of the vector product of covariates and coefficients:
0( ) ( ) ( ( ))j x jh t h t r t= β x . (10)
The most popular means to specify the functional form of r(.) is by choosing the exponential, which yields the Cox model (Cox, 1972):
( ( ))
0( ) ( ) x j t
jh t h t e= β x. (11)
This specification has several desirable properties. Because the baseline hazard is not given a particular parameterisation, it remains unestimated. Thus, the Cox model does not make assumptions about the distribution of the hazard function. Nevertheless, a reasonably good estimate of regression coefficients and hazard ratios can be obtained. Initial assumptions about the shape of the hazard function are not required, so the model is remarkably robust in its approximation of the correct parametric model. Computationally, the Cox model is estimated by maximum likelihood method (Kleinbaum and Klein, 2005: 96-98). Extensive discussions of the Cox model are available in existing literature (Hosmer and Lemeshow, 1999: 87-108; Cleves et al., 2004: 121ff). However, the Cox model rests on the vital assumption of proportional hazards. This assumption states that one initiative's hazard is proportional to that of another initiative. In other words, the quotient of the two hazard ratios is constant over time (Kleinbaum and Klein, 2005: 107-108). If this assumption is violated, the Cox model is not an appropriate model for the data, and parametric models should be preferred. The proportional hazard assumption can be tested computationally and graphically. Computationally, the proportional hazards assumption is tested by calculating Schoenfeld and scaled Schoenfeld residuals and testing if they are significantly different from 0. Technically, the Schoenfeld residual is the difference between the covariate value for the failed observation and the weighted average of the covariate values (weighted according to the estimated relative hazard from a Cox model) over all those subjects at risk of failure when the j-th subject failed. The scaled Schoenfeld residual modifies the original Schoenfeld residual so that a covariate-dependent assessment of the proportional hazard assumption becomes possible (Cleves et al., 2004: 179).
42
Grambsch and Therneau (1994) offer statistical discussions of Schoenfeld residuals. Whereas the simple Schoenfeld residual only allows for a global test of whether the proportional hazards assumption holds for the model as such, the calculation of scaled Schoenfeld residuals assesses whether the assumption holds for each covariate. Thus, those covariates for which the assumption does not hold can be identified. Graphical methods for testing the proportional hazards assumption compare the curves of the negative log of the estimated survivor function to the curve of the log of survival time. If the proportional hazard assumption holds, the two curves must be parallel (Hess, 1995). A second method uses the Kaplan-Meier observed survival curves to assess their goodness of fit with curves for the same variable predicted by the Cox model (Garrett, 1997). If log-log curves or Kaplan-Meier and Cox survivor functions intersect, the proportional hazards assumption is violated (Kleinbaum and Klein, 2005: 139-145). I use both methods to arrive at a robust assessment. After all, because the baseline hazard remains unestimated, a Cox model is only an approximation of an underlying parametric model, so that strictly speaking, parametric models should be preferred if a specific functional form of the hazard can be theoretically expected. Although several methods exist to deal with the violation of the proportional hazard assumption within a Cox model (e.g., inclusion of time-varying components, or stratification; see Kleinbaum and Klein, 2005: 173-256 for details), they are inferior because the parametric model is more likely to specify the correct functional form of the hazard. 4.4.4 Parametric survival analysis
Parametric survival models assume that survival time follows a known distribution. The main difference from semi-parametric models lies in the dependent variable survival time. Semi-parametric models such as the Cox model can compute regression coefficients; however, the distribution of the outcome remains unknown, and the baseline hazard remains unspecified. These limitations do not apply to parametric models, because they assume time to follow some distribution whose probability density function can be expressed in terms of ancillary parameters. Once a probability density function is specified for survival time, the corresponding survival and hazard functions can be determined (Kleinbaum and Klein, 2005: 262). Specifically, if there are theoretical considerations regarding the possible shapes of the hazard function, parametric models are superior to semi-parametric models. Parametric models can be expressed by two metrics: the proportional hazard (PH) and the accelerated failure time (AFT). Some parametric models can be specified in both metrics, but others can only be specified in one. Table 3 provides an overview of the most common parametric models and the metrics they accommodate. For simplicity, the index j is omitted. Note that the AFT metric across models differs only in the distribution of the error term u, which is Gumbel (exponential and Weibull model), standard normal (log-normal model), or irregular (log-logistic, Gamma, and Gompertz models). Cleves et al. (2004: 197-245) provide the specifications of the irregularly distributed error terms. But for the exponential model, all parametric models have ancillary parameters that determine the functional form of the hazard rate function. Note that the Gamma model has two such parameters.
43
Table 3: Overview of parametric survival time models
Parametric Model Metric Functional Form Parameter
Exponential PH, AFT 0( ( ))( ) .x th t e constλ+= = =β β x (PH)
0ln( ) xt uβ= + +β x (AFT)
None
Weibull PH, AFT 0( ( ))1( ) x tph t pt e+−= β β x (PH)
0ln( ) xt uβ= + +β x (AFT)
p
Log-normal AFT only 0ln( ) xt uβ= + +β x σ
Log-logistic AFT only 0ln( ) xt uβ= + +β x γ
Gamma AFT only 0ln( ) xt uβ= + +β x κ, σ
Gompertz PH only 0( ( ))( )( ) x tth t e eγ += β β x γ
Although the use of the PH as opposed to the AFT metric yields the same result regarding the significance or nonsignificance of a covariate, the coefficients and their standard errors must be interpreted very differently, depending on which metric the model uses. The underlying assumption for AFT models is that the effect of covariates is multiplicative (proportional) with respect to survival time, whereas for PH models, the underlying assumption is that the effect of covariates is multiplicative with respect to the hazard. Thus, AFT models describe a 'stretching out' or 'contraction' of survival time as a function of predictor variables. The key measure of the metric is the acceleration factor that enables an evaluation of the effect of covariates on survival time (Kleinbaum and Klein, 2005: 266-267). In contrast, the hazard ratios obtained from the PH metric permit analysing the effect of the covariates on the hazard. In my research setting, I estimate and compare all possible parametric models to evaluate their fit to my data, Moreover, I compare these models with the Cox model and determine the best fitting model using the procedures described in Section 4.5. 4.4.5 Shared and unshared frailty
Frailty is a random component designed to account for variability due to unobserved heterogeneity that is otherwise unaccounted for by the other covariates. Unshared frailty refers to heterogeneity among individual initiatives, whereas shared frailty refers to clusters of initiatives that are assumed to share the same frailty (Kleinbaum and Klein, 2005: 294-308). Frailty is normally assumed to follow either an inverse Gaussian or a Gamma distribution. The significance or nonsignificance of frailty is determined by including an additional parameter θ in the model and performing a likelihood ratio test to determine whether θ is significantly different from 0. Cleves et al. (2004: 278-280) offer a statistical discussion of frailty models. The consideration of shared frailty applies specifically to my research setting, because all of the 1,116 initiatives come from the firm's 10 corporate research centres. Thus, it is reasonable to assume that initiatives within each cluster will not be independent of one another. Instead, they may share resources and interlace, and several initiatives may have been sent by the same manager. Initiatives probably cluster with respect to their provenience from the corporate research centres and therefore may be independent across, but not within, clusters. Therefore, I estimate my models with a shared frailty component that interprets the corporate research centres as clusters of initiatives to ensure the results are robust against such unobserved heterogeneity.
44
4.5 Model selection and optimisation strategy
Given the multitude of possible models and parameterisations, the questions emerges: How can we obtain the best fitting model for the data? To identify this best fitting model, I first evaluate whether the proportional hazard assumption of the Cox model holds for my data. On this result, I will base my decision to engage in semi-parametric modelling at all. To cross-compare parametric models, I will calculate Akaike information criteria (AIC), determine the significance of ancillary parameters, and calculate residuals to evaluate model fit. See Greene (2003: 160) for a discussion of the AIC. The reasons for this approach are as follows: First, because the standard likelihood ratio χ² test is only appropriate when models are nested, using the AIC provides a robust way to compare parametric models, because the AIC does not require models to be nested for comparison. Therefore, the AIC can compare models with different numbers of predictors and different numbers of observations. The best fitting model results in the lowest AIC, because the AIC penalises each model's log-likelihood to reflect the number of parameters estimated, so that a model with many predictors leads to a higher AIC. Second, the significance of the specific model's ancillary parameter(s) offers a good indicator of the appropriateness of the model for the data (Herrmann et al., 2007). Finally, the calculation of Cox-Snell residuals helps assess how well the model fits the data. The basic idea of Cox-Snell residuals is that if the model fits the data, these residuals should have a standard exponential distribution with λ = 1. One way to verify this fit graphically is to calculate an empirical estimate of the cumulative hazard function based on the Kaplan-Meier survival estimates, taking the Cox-Snell residuals as the time variables and the censoring variable as previously, and plotting it against the residuals. If the model fits the data, the plot should be a straight line with a slope of 1 (Stata, 2005: 258) . 4.6 Statistical software used For all statistical analyses, I use the software Stata, Vol. 9.2. I document how I obtain the tables, figures, and results by including the full Stata command lines in Appendix C.
45
5. Findings 5.1 Descriptive statistics
Figure 2 gives the raw data histogram of survival time. Of the 1,116 initiatives in the sample, 706 failed prior to or at gate G5, for a raw survival rate of 38.4%. Note that the first initiative failed after 101 days (cf. listed output in Appendices A and B), which explains the histogram's initial gap. The survival time clearly is not normally distributed but rather resembles a log-normal distribution. 895 initiatives were submitted from single research centres without any cooperation from other research centres, and 221 involved cooperation with at least one other centre. Furthermore, 228 of the 1,116 initiatives included an NPV calculation. Finally, 779 initiatives intended to do exploitative product developments, whereas 317 focused on exploratory technology development.
Figure 2: Raw data histogram for survival time
0.001
.002
.003
Density
0 500 1000 1500 2000 2500Survival time
Histogram of initiatives' survival times
In the following pages, I provide Table 4 to detail the provenience of the initiatives from the different research centres, which research programmes they addressed, and how successful they were. Table 5 gives descriptive statistics (minima, maxima, means, and standard deviations) pertaining to all variables. For better readability, I partition the correlation matrix into Tables 6–9, which depict Spearman correlations for all variables. Because most of the variables are not normally distributed, I used nonparametric Spearman instead of Pearson correlations.
46
Table 4: Frequency distribution of initiatives (successful initiatives in brackets).
* p < 0.05, ** p < 0.01, *** p < 0.001. 5.2 Nonparametric analysis
5.2.1 Graphical analysis for the overall data set
Figure 3 shows the Kaplan-Meier survival estimate for the whole sample, together with pointwise 95% Greenwood confidence bands. Until day 101, all initiatives survive (probably because the decision-making team participates in only a few meetings in which they decide which initiatives to carry on beyond gate G1). After day 101, the survivor function is sloped strongly, indicating that many initiatives 'die' over the following period. From about day 600 onward, the negative slope decreases, indicating a decreasing initiative mortality. This result points to the existence of an initial 'killer phase' during the early gates of the stage-gate process, whereas an initiative that survives these early gates subsequently has a smaller probability of 'dying'. Figure 4 shows the Nelson-Aalen estimate of the cumulative hazard, together with 95% confidence bands. These results reflect those of the Kaplan-Meier survival estimates. To compare both estimates, I transform the Nelson-Aalen estimate of the hazard function into a survivor function by exponentiating the negative of the Nelson-Aalen estimate to the basis of Euler's constant e. Similarly, I transform the Kaplan-Meier survivor estimate of the survivor function into a cumulative hazard function by taking the negative log of the Kaplan-Meier estimate (cf. Cleves et al., 2004: 108). Figures 5 and 6 show the results. The results of both estimators are very close, so the specific statistical properties of the two estimators appear to have no effect on the structural results.
51
Figure 3: Kaplan-Meier estimate of the survivor function for the complete sample
0.25
.5.75
1
0 500 1000 1500 2000 2500analysis time
95% CI Survivor function
Kaplan-Meier survival estimate
Figure 4: Nelson-Aalen estimate of the hazard function for the complete sample
01
23
0 500 1000 1500 2000 2500analysis time
95% CI Cumulative hazard
Nelson-Aalen cumulative hazard estimate
52
Figure 5: Kaplan-Meier survivor function and converted Nelson-Aalen estimates
0.2
.4.6
.81
0 500 1000 1500 2000 2500analysis time
K-M survivor function Nelson-Aalen survivor function
Figure 6: Nelson-Aalen cumulative hazard function and converted Kaplan-Meier estimate
0.5
11.5
22.5
0 500 1000 1500 2000 2500analysis time
N-A cumulative hazard K-M cumulative hazard
53
An estimate of the overall hazard function for these data appears in Figure 7. This estimate is based on a Gaussian kernel-smoothed estimate of the hazard (Klein and Moeschberger, 2003: 167) and also shows pointwise 95% confidence bands. The figure reveals several 'peaks' in the hazard distribution at approximately day 400, day 1100, and day 1500. These peaks probably reflect the gates at which corporate-level managers make the decision to carry the initiative forward to the next gate.
Figure 7: Gaussian kernel smoothed estimate of the hazard function for the complete sample.
0.001
.002
.003
.004
.005
0 500 1000 1500 2000analysis time
95% CI Smoothed hazard function
Smoothed hazard estimate
5.2.2 Graphical analysis by comparing groups
The subsequent graphical analyses do not allow a determination of whether a difference in the survival time or hazard is significant. However, I include the graphical analyses specifically to depict the respective probabilities. Section 5.2.3 uses nonparametric tests to examine whether these differences are significant. Research centre provenience
Initiatives from the Swiss research centre enjoy a higher probability of survival than initiatives from all other research centres. Figures 8–10 show Kaplan-Meier survivor estimates, Nelson-Aalen cumulative hazard estimates, and the estimated smoothed hazard functions, respectively. For the Swedish and U.S. research centres, the evidence is mixed, such that the curves plotted according to the survivor and cumulative hazard estimates intersect several times, indicating that in some phases, initiatives from these research centres have a better chance of survival, whereas in other phases, this probability is comparable to that of other initiatives. To avoid unnecessary replication of the structure of results, only the results for the Swedish research centre are shown graphically (Figures 11–13). Initiatives from the research centres based in China, Germany, Finland, India, Italy, Norway, and Poland have lower probabilities of survival. Due to the repetitive nature of this result, I only show the graphical results for the Chinese research centre (Figures 14–16).
54
Connectivity of initiatives to the firm's core areas of activity
The results in this case are mixed. Initiatives that target research programmes 2, 4, 9, 10, 11, 15, 18, 19, and 23 (see Table 1 for the subject matters of the programmes) have a higher probability of survival and thus a lower hazard rate. Again, I refrain from repeating the same structure of results for all research programmes but instead depict the representative results for programme 2 in Figures 17–19. Initiatives from research programmes 1, 5, 14, 16, 20, 22, and the 'none' category (26) indicate mixed results; depending on their survival time, they sometimes enjoy a higher but sometimes suffer a lower probability of survival. Figures 20–22 reveal the representative results for programme 14. Finally, initiatives targeted toward programmes 3, 6, 7, 8, 12, 13, 17, 21, 24, and 25 have a lower probability of survival, as I show in Figures 23–25 for programme 17. Inter-subsidiary cooperation
The nonparametric results are regarding cooperation also mixed. Compared with initiatives sent by a single research centre, initiatives produced through cooperation between research centres experience a lower chance of survival at the beginning of the stage-gate-process but an improved chance from approximately day 400 onward. Figures 26–28 depict these results. Sender's past successful initiatives
The number of past successful initiatives formulated by a single manager ranges from 0 to 10, so I partition the data into two groups: unsuccessful, which contains only initiatives whose sender had no record of past successful initiatives (n = 343), and successful, which contains initiatives whose sender had at least one successful initiative in the past (n = 773). The subsequent analysis (Figures 32–34) uses the grouping variable successful and suggests a positive effect of the number of successful past initiatives on a new initiative's survival probability. Exploratory versus exploitative innovation
As explained in the measurement section, I use the indicator Inno_Techdev to distinguish initiatives that pertain to exploratory innovations from those intending to create an exploitative innovation. The results (Figures 35–37) suggest a greater probability of survival for exploratory initiatives until about day 1200, after which the probability of further decreases sharply. This effect probably mirrors the stage-gate process’s evaluation, which first focuses on technological feasibility (gates G2 and G3) and then economic viability (gates G4 and G5). Thus, initiatives for exploratory innovations probably survive the technological evaluation but get discarded eventually because of their unsure economic viability. Effect of project cost
Because the variable Projectcost has a ratio nature, to enable graphical analysis, I split the variable in two dichotomous indicators—lowcost and highcost—using a mean of US$0.35 million as a cut-off point and based (because of perfect collinearity of the two indicators) the graphical analysis on the indicator lowcost. The results (Figures 38–40) suggest that an initiative's probability of survival increases with project cost. Effect of net present value being given
The graphical results appear mixed. Figures 29–31 suggest that those initiatives that have specified an NPV enjoy a greater probability survival until about day 1450. After that point, the survival rate drops to 0, possibly because only 228 initiatives specified an NPV, and the initiative that died on day 1450 may have been the last survivor that provided with an NPV specification. The graphical results should therefore be interpreted with caution.
55
Figure 8: Kaplan-Meier survivor estimate for initiatives from Swiss versus other research centres
0.00
0.25
0.50
0.75
1.00
0 500 1000 1500 2000 2500analysis time
fromCH = 0 fromCH = 1
Kaplan-Meier survival estimates, by fromCH
Figure 9: Nelson-Aalen cumulative hazard estimate for initiatives from Swiss versus other research
centres
0.00
0.50
1.00
1.50
2.00
2.50
0 500 1000 1500 2000 2500analysis time
fromCH = 0 fromCH = 1
Nelson-Aalen cumulative hazard estimates, by fromCH
56
Figure 10: Gaussian kernel smoothed estimate of the hazard function for initiatives from Swiss
versus other research centres
0.0005
.001
.0015
.002
.0025
0 500 1000 1500 2000analysis time
fromCH = 0 fromCH = 1
Smoothed hazard estimates, by fromCH
Figure 11: Kaplan-Meier survival estimate for initiatives from Swedish versus other research
centres
0.00
0.25
0.50
0.75
1.00
0 500 1000 1500 2000 2500analysis time
fromSE = 0 fromSE = 1
Kaplan-Meier survival estimates, by fromSE
57
Figure 12: Nelson-Aalen cumulative hazard estimate for initiatives from Swedish versus other
research centres
0.00
0.50
1.00
1.50
2.00
2.50
0 500 1000 1500 2000 2500analysis time
fromSE = 0 fromSE = 1
Nelson-Aalen cumulative hazard estimates, by fromSE
Figure 13: Gaussian kernel smoothed estimate of the hazard function for initiatives from Swedish
versus other research centres
.0005
.001
.0015
.002
.0025
0 500 1000 1500 2000analysis time
fromSE = 0 fromSE = 1
Smoothed hazard estimates, by fromSE
58
Figure 14: Kaplan-Meier survival estimate for initiatives from Chinese versus other research
centres
0.00
0.25
0.50
0.75
1.00
0 500 1000 1500 2000 2500analysis time
fromCN = 0 fromCN = 1
Kaplan-Meier survival estimates, by fromCN
Figure 15: Nelson-Aalen cumulative hazard estimate for initiatives from Chinese versus other
research centres
0.00
0.50
1.00
1.50
2.00
2.50
0 500 1000 1500 2000 2500analysis time
fromCN = 0 fromCN = 1
Nelson-Aalen cumulative hazard estimates, by fromCN
59
Figure 16: Gaussian kernel smoothed estimate of the hazard function for initiatives from Chinese
versus other research centres
0.001
.002
.003
.004
.005
0 500 1000 1500 2000analysis time
fromCN = 0 fromCN = 1
Smoothed hazard estimates, by fromCN
Figure 17: Kaplan-Meier survival estimate for initiatives from research programme 2 versus other
research programmes.
0.00
0.25
0.50
0.75
1.00
0 500 1000 1500 2000 2500analysis time
Program2 = 0 Program2 = 1
Kaplan-Meier survival estimates, by Program2
60
Figure 18: Nelson-Aalen cumulative hazard estimate for initiatives from research programme 2
versus other research programmes
0.00
0.50
1.00
1.50
2.00
2.50
0 500 1000 1500 2000 2500analysis time
Program2 = 0 Program2 = 1
Nelson-Aalen cumulative hazard estimates, by Program2
Figure 19: Gaussian kernel smoothed estimate of the hazard function for initiatives from research
programme 2 versus other research programmes
.0005
.001
.0015
.002
.0025
0 500 1000 1500 2000analysis time
Program2 = 0 Program2 = 1
Smoothed hazard estimates, by Program2
61
Figure 20: Kaplan-Meier survival estimate for initiatives from research programme 14 versus other
research programmes.
0.00
0.25
0.50
0.75
1.00
0 500 1000 1500 2000 2500analysis time
Program14 = 0 Program14 = 1
Kaplan-Meier survival estimates, by Program14
Figure 21: Nelson-Aalen cumulative hazard estimate for initiatives from research programme 14
versus other research programmes.
0.00
0.50
1.00
1.50
2.00
2.50
0 500 1000 1500 2000 2500analysis time
Program14 = 0 Program14 = 1
Nelson-Aalen cumulative hazard estimates, by Program14
62
Figure 22: Gaussian kernel smoothed estimate of the hazard function for initiatives from research
programme 14 versus other research programmes
0.0005
.001
.0015
.002
.0025
0 500 1000 1500 2000analysis time
Program14 = 0 Program14 = 1
Smoothed hazard estimates, by Program14
Figure 23: Kaplan-Meier survival estimate for initiatives from research programme 17 versus other
research programmes.
0.00
0.25
0.50
0.75
1.00
0 500 1000 1500 2000 2500analysis time
Program17 = 0 Program17 = 1
Kaplan-Meier survival estimates, by Program17
63
Figure 24: Nelson-Aalen cumulative hazard estimate for initiatives from research programme 17
versus other research programmes.
0.00
0.50
1.00
1.50
2.00
2.50
0 500 1000 1500 2000 2500analysis time
Program17 = 0 Program17 = 1
Nelson-Aalen cumulative hazard estimates, by Program17
Figure 25: Gaussian kernel smoothed estimate of the hazard function for initiatives from research
programme 17 versus other research programmes
.0005
.001
.0015
.002
.0025
.003
0 500 1000 1500 2000analysis time
Program17 = 0 Program17 = 1
Smoothed hazard estimates, by Program17
64
Figure 26: Kaplan-Meier survival estimate for initiatives generated by inter-centre cooperation
versus other initiatives
0.00
0.25
0.50
0.75
1.00
0 500 1000 1500 2000 2500analysis time
InterCrcCoop = 0 InterCrcCoop = 1
Kaplan-Meier survival estimates, by InterCrcCoop
Figure 27: Nelson-Aalen cumulative hazard estimate for initiatives generated by inter-centre
cooperation versus other initiatives
0.00
0.50
1.00
1.50
2.00
2.50
0 500 1000 1500 2000 2500analysis time
InterCrcCoop = 0 InterCrcCoop = 1
Nelson-Aalen cumulative hazard estimates, by InterCrcCoop
65
Figure 28: Gaussian kernel smoothed estimate of the hazard function for initiatives generated by
inter-centre cooperation versus other initiatives
0.0005
.001
.0015
.002
.0025
0 500 1000 1500 2000analysis time
InterCrcCoop = 0 InterCrcCoop = 1
Smoothed hazard estimates, by InterCrcCoop
Figure 29: Kaplan-Meier survival estimate for initiatives whose sending manager had at least one
successful initiative in the past versus other initiatives
0.00
0.25
0.50
0.75
1.00
0 500 1000 1500 2000 2500analysis time
successful = 0 successful = 1
Kaplan-Meier survival estimates, by successful
66
Figure 30: Nelson-Aalen cumulative hazard estimate for initiatives whose sending manager had at
least one successful initiative in the past versus other initiatives
0.00
2.00
4.00
6.00
0 500 1000 1500 2000 2500analysis time
successful = 0 successful = 1
Nelson-Aalen cumulative hazard estimates, by successful
Figure 31: Gaussian kernel smoothed estimate of the hazard function for initiatives whose sending
manager had at least one successful initiative in the past versus other initiatives
0.002
.004
.006
.008
0 500 1000 1500 2000analysis time
successful = 0 successful = 1
Smoothed hazard estimates, by successful
67
Figure 32: Kaplan-Meier survival estimate for exploratory versus exploitative initiatives
0.00
0.25
0.50
0.75
1.00
0 500 1000 1500 2000 2500analysis time
Inno_Techdev = 0 Inno_Techdev = 1
Kaplan-Meier survival estimates, by Inno_Techdev
Figure 33: Nelson-Aalen cumulative hazard estimate for exploratory versus exploitative initiatives
0.00
0.50
1.00
1.50
2.00
2.50
0 500 1000 1500 2000 2500analysis time
Inno_Techdev = 0 Inno_Techdev = 1
Nelson-Aalen cumulative hazard estimates, by Inno_Techdev
68
Figure 34: Gaussian kernel smoothed estimate of the hazard function for exploratory versus
exploitative initiatives
0.001
.002
.003
0 500 1000 1500 2000analysis time
Inno_Techdev = 0 Inno_Techdev = 1
Smoothed hazard estimates, by Inno_Techdev
Figure 35: Kaplan-Meier survival estimate for the effect of estimated project cost
0.00
0.25
0.50
0.75
1.00
0 500 1000 1500 2000 2500analysis time
lowcost = 0 lowcost = 1
Kaplan-Meier survival estimates, by lowcost
69
Figure 36: Nelson-Aalen cumulative hazard estimate for the effect of estimated project cost
0.00
1.00
2.00
3.00
4.00
0 500 1000 1500 2000 2500analysis time
lowcost = 0 lowcost = 1
Nelson-Aalen cumulative hazard estimates, by lowcost
Figure 37: Gaussian kernel smoothed estimate for the effect of project cost
0.001
.002
.003
0 500 1000 1500 2000analysis time
lowcost = 0 lowcost = 1
Smoothed hazard estimates, by lowcost
70
Figure 38: Kaplan-Meier survival estimate for initiatives with designated NPV calculation versus
other initiatives
0.00
0.25
0.50
0.75
1.00
0 500 1000 1500 2000 2500analysis time
NPV_yes = 0 NPV_yes = 1
Kaplan-Meier survival estimates, by NPV_yes
Figure 39: Nelson-Aalen cumulative hazard estimate for initiatives with designated NPV
calculation versus other initiatives
0.00
1.00
2.00
3.00
0 500 1000 1500 2000 2500analysis time
NPV_yes = 0 NPV_yes = 1
Nelson-Aalen cumulative hazard estimates, by NPV_yes
71
Figure 40: Gaussian kernel smoothed estimate of the hazard function for initiatives with designated
NPV calculation versus other initiatives
0.002
.004
.006
0 500 1000 1500 2000analysis time
NPV_yes = 0 NPV_yes = 1
Smoothed hazard estimates, by NPV_yes
5.2.3 Results of nonparametric tests
Prior to this point, I have used graphical analysis to explore the data and shown the relative survivor functions and cumulative hazard distributions. The diagrams seem to suggest that survival time and cumulative hazard differ with respect to all covariates; however, graphical analysis does not allow me to conclude whether such differences are significant. Therefore, in this section, I use nonparametric tests to test their significance. Table 10 shows the results of all tests (cf. Section 4.4.2 for their description), which are all unstratified, because any further decomposition of the data into subgroups is not justified on any systematic grounds. Again, the indicators successful and lowcost serve to condense the integer variable pastSuccess and the ratio variable Projectcost into dichotomous categories for subsequent testing with group comparisons. Tests could not be performed for each subclass of the variables ResearchCenterProvenience and Research Program because these variables have 10 and 26 values, respectively, such that a one-on-one group comparison is not possible. The results suggest that survival time differs significantly between initiatives when an NPV calculation is specified, as a result of the project cost, according to the sending manager's past success record, and depending on whether the initiative proposes an exploratory or exploitative innovation. However, inter-subsidiary cooperation does not seem to have a significant influence on an initiative's probability of survival. Although nonparametric tests allow the detection of significant group differences, their information is restricted to whether such differences are present. Moreover, only one covariate can be tested at a time. Therefore, I now conduct semi-parametric and parametric analysis by estimating models that not only consider all covariates simultaneously but also allow the detection of the direction and magnitude of each covariate’s effect on an initiative's survival probability.
72
Table 10: Results of nonparametric tests
Nonparametric test
Log-Rank test
Wilcoxon-Breslow test
Tarone-Ware test
Peto-Peto-Prentice test
InterCrcCoop
χ2 =
1.2
3, p>
χ2 =
0.2
665 n
s.
χ2 =
0.0
6, p>
χ2 =
0.8
274 n
s.
χ2 =
0.1
1, p>
χ2 =
0.7
375 n
s.
χ2 =
0.0
1, p>
χ2 =
0.9
048 n
s.
NPV_yes
χ2 =
44.2
6, p>
χ2 =
0.0
001***
χ2 =
37.4
4, p>
χ2 =
0.0
001***
χ2 =
43.2
0, p>
χ2 =
0.0
001***
χ2 =
40.8
9, p>
χ2 =
0.0
001***
successful
χ2 =
251.7
0, p>
χ2 =
0.0
001***
χ2 =
156.7
3, p>
χ2 =
0.0
001***
χ2 =
195.1
2, p>
χ2 =
0.0
001***
χ2 =
184.2
7, p>
χ2 =
0.0
001***
Inno_Techdev
χ2 =
5.9
6, p>
χ2 =
0.0
146*
χ2 =
6.0
5, p>
χ2 =
0.0
146*
χ2 =
6.3
6, p>
χ2 =
0.0
117*
χ2 =
5.9
6, p>
χ2 =
0.0
146*
lowcost
χ2 =
148.9
8, p>
χ2 =
0.0
001***
χ2 =
109.7
4, p>
χ2 =
0.0
001***
χ2 =
130.2
3, p>
χ2 =
0.0
001***
χ2 =
124.1
1, p>
χ2 =
0.0
001***
* p
< 0
.05, ** p
< 0
.01, *** p
< 0
.001, ns
not
signif
ican
t.
73
5.3 Semi-parametric analysis
As I stated previously, I ground my decision to engage in semi-parametric modelling on my examination of whether the proportional hazards assumption holds. If so, semi-parametric modelling is appropriate. If not, parametric analysis provides better results. Therefore, I test the proportional hazards assumption both graphically and computationally. 5.3.1 Computational test of the proportional hazards assumption
Table 11 shows the outcomes of the computational tests, which assesses whether the assumption holds both globally and by covariate. The null hypothesis posits that the proportional hazards assumption is not violated. The results are based on the best-fitting Cox model for the data and clearly indicate that the proportional hazards assumption is violated not only globally but also for the three covariates fromCH, pastSuccess, and Projectcost.
Table 11: Significance of Schoenfeld and scaled Schoenfeld residuals
Variable ρ χ2 df p > χ
2
fromCH 0.04484 10.34 1 0.0013** fromSE 0.00852 0.41 1 0.5227 ns. Program3 0.01389 0.43 1 0.5111 ns. Program21 0.02752 2.30 1 0.1297 ns. pastSuccess -0.01657 5.31 1 0.0213* NPV_yes 0.02209 0.53 1 0.4652 ns. InterCrcCoop 0.00231 0.05 1 0.8154 ns. Inno_Techdev 0.01455 0.32 1 0.5700 ns. Projectcost 0.04346 5.61 1 0.0178* Global test 17.07 9 0.0477*
* p < 0.05, ** p < 0.01, *** p < 0.001, ns not significant. 5.3.2 Graphical assessment of the proportional hazards assumption
The computational tests suggest that three covariates violate the proportional hazards assumption. To check this result, I compare the log-log curves for these covariates, adjusted for all other variables (cf. Cleves et al., 2004: 183). Figures 41–43 show the results, which corroborate the computational findings. For the covariates fromCH and pastSuccess, the respective log-log curves intersect several times, whereas for the covariate Projectcost, transformed using the indicator lowcost, the curves are not parallel. Similar results emerge when I compare the curves of the Kaplan-Meier and Cox survivor functions, as Figures 44–46 reveal. Again, the curves intersect several times; thus, the proportional hazards assumption is clearly violated.
74
Figure 41: Log-log curves for the covariate fromCH
-20
24
68
-ln[-ln(S
urvival Probability)]
4 5 6 7 8ln(analysis time)
fromCH = 0 fromCH = 1
Figure 42: Log-log curves for the covariate pastSuccess
-50
510
-ln[-ln(S
urvival Probability)]
4 5 6 7 8ln(analysis time)
pastSuccess = 0 pastSuccess = 1
pastSuccess = 2 pastSuccess = 3
pastSuccess = 4 pastSuccess = 5
pastSuccess = 10
75
Figure 43: Log-log curves for the covariate Projectcost
-20
24
68
-ln[-ln(S
urvival Probability)]
4 5 6 7 8ln(analysis time)
lowcost = 0 lowcost = 1
Figure 44: Comparison of Kaplan-Meier and Cox survivor functions for the covariate fromCH
0.00
0.20
0.40
0.60
0.80
1.00
Survival Probability
0 500 1000 1500 2000 2500analysis time
Observed: fromCH = 0 Observed: fromCH = 1
Predicted: fromCH = 0 Predicted: fromCH = 1
76
Figure 45: Comparison of Kaplan-Meier and Cox survivor functions for the covariate pastSuccess
Figure 46: Comparison of Kaplan-Meier and Cox survivor functions for the covariate Projectcost
0.00
0.20
0.40
0.60
0.80
1.00
Survival Probability
0 500 1000 1500 2000 2500analysis time
Observed: lowcost = 0 Observed: lowcost = 1
Predicted: lowcost = 0 Predicted: lowcost = 1
77
5.3.3 Outcome for the appropriateness of semi-parametric modelling
Both the computational and the graphical results suggest that a semi-parametric model is not the correct specification for these data. Because parametric models are superior in this case, I refrain from applying measures such as time-varying components or stratification to override the violation of the proportional hazards assumption, because the parametric models fit the data better. In other words, I avoid further semi-parametric analysis and directly continue with parametric analysis, because such models should fit the data better. For a final comparison, however, I will estimate an additional Cox model with the same structure of covariates as the best-fitting parametric model, then compare the fit of this semi-parametric model according to the AIC criterion to determine if the Cox model might have approximated the parametric result well enough.
5.4 Parametric analysis
5.4.1 Comparative model estimation
I estimate a model for each possible distributional assumption, as detailed in Section 4.4.4, by a stepwise procedure in which I first enter only the controls in the model and then incrementally add covariates. After each incremental step, I observed whether the model fit statistics and AIC improved. When this process converged on a model whose fit would not improve further, I retained this model as the best-fitting one, given the respective distributional specification. In all models, I specify a frailty component θ according to the research centre that sent an initiative as cluster variable and an inverse-Gaussian frailty distribution.3 Tables 12 and 13 show the comparison of all models according to their respective metrics, which enhances the comparison of the coefficients. To enhance mutual comparability, I provide the exponential and Weibull model results in the AFT metric. Note that from the total sample of 1,116 initiatives, 4 are dropped from the model calculations because of their missing data. Such a case-wise deletion of observations with missing data is the most conservative approach to handling missing data and therefore the least likely to distort the results. Note that Tables 12 and 13 are not directly comparable, because Table 12 uses the PH metric to report hazard ratios, whereas Table 13 uses an AFT metric and reports acceleration factors. Because gamma-distributed shared frailty components for the Gamma model are not supported by Stata Vol. 9.2., I substitute the share(.) option with the cluster(.) option to account for possible frailty effects. However, the results unanimously suggest that no frailty effect is present in the data. The primary result of this comparison is that the log-normal model fits the data best. Although the gamma model is slightly superior in terms of AIC, the kappa parameter of the gamma model is not significant, which indicates that the underlying assumption of a gamma distribution for the data is not met. To double-check this result, I calculate Cox-Snell and deviance residuals to assess graphically how well each model fits the data. For each model, I plot the Cox-Snell residuals against a reference line with a slope of 1. Figures 47–52 show the results. For the log-normal model, the Cox-Snell residuals are closest to the reference line, which signals that the log-normal model fits the data best.
3 A comparison with a gamma-distributed frailty results in no significant change in any coefficients.
78
Table 12: Comparison of best-fitting models in proportional hazard metric
Log likelihood -1178.6188 -1080.855 -1151.4217 LR χ
2 (df) 280.43 (7) 393.78 (10) 331.03 (10)
p > χ2 0.0000*** 0.0000*** 0.0000***
Ancillary
parameters
none p=1.5557*** (0.0286) γ=0.0008*** (0.0001)
ln(θ) -18.8731 -25.6947 -20.5457 LR test of θ=0 ns. ns. ns. AIC 2375.238 2187.972 2328.843 Observations 1112 1112 1112
* p < 0.05, ** p < 0.01, *** p < 0.001, ns not significant. Standard errors in parentheses.
79
Table 13: Comparison of best-fitting models in accelerated failure time metric
Model
Exponential
Weibull
Log-normal
Log-logistic
Gamma
fromCH
0.2
169* (
0.0
929)
0.1
828** (
0.0
606)
0.1
609** (
0.0
619)
0.1
658** (
0.0
627)
0.1
526*** (
0.0
308)
fromSE
0.2
000* (
0.0
978)
0.1
348* (
0.0
648)
0.1
689** (
0.0
661)
0.1
675** (
0.0
650)
0.1
484*** (
0.0
320)
Program3
-0
.3906* (
0.1
552)
-0.3
560* (
0.1
722)
-0.3
339**(0
.1700)
-0.3
498** (
0.1
134)
Program10
0.7
228* (
0.2
924)
Program15
0.2
167* (
0.0
944)
0.1
455** (
0.0
522)
Program21
-0.7
157** (
0.3
053)
-0.7
061*** (
0.1
965)
-0.5
838** (
0.2
283)
-0.5
301** (
0.2
130)
-0.5
782*** (
0.1
560)
InterCrcCoop
-0.0
877 n
s. (
0.0
663)
-0.1
012 n
s. (
0.0
669)
-0.0
818 n
s. (
0.0
737)
NPV_yes
0.5
828*** (
0.1
353)
0.4
359*** (
0.0
895)
0.3
791*** (
0.0
804)
0.3
665** (
0.0
818)
0.3
873*** (
0.0
782)
pastSuccess
0.1
982*** (
0.0
343)
0.1
473*** (
0.0
234)
0.1
132*** (
0.0
164)
0.1
076*** (
0.0
186)
0.1
153* (
0.0
547)
Inno_Techdev
-0.3
605*** (
0.1
045)
-0.3
675*** (
0.0
692)
-0.1
987** (
0.0
679)
-0.2
343*** (
0.0
674)
-0.2
042* (
.0963)
Projectcost
1.5
105*** (
0.1
780)
1.2
498*** (
0.1
230)
0.7
043*** (
0.0
692)
0.9
651*** (
0.0
948)
0.7
137** (
0.2
140)
Constant term
5.8
488*** (
0.0
688)
5.9
312*** (
0.0
4574)
5.7
628*** (
0.0
476)
5.7
152*** (
0.0
472)
5.7
604*** (
0.0
454)
Log likelihood
-1178.6
188
-1080.8
55
-1058.5
08
-1060.1
217
-1057.4
021
LR χ2 (df)
280.4
3 (
7)
393.7
8 (
10)
271.1
2 (
9)
254.3
0 (
9)
199.3
7 (
10)
p > χ2
0.0
000***
0.0
000***
0.0
000***
0.0
000***
0.0
000****
Ancillary
parameters
none
p=
1.5
557*** (
0.0
286)
σ=
0.7
642*** (
0.0
278)
γ=0.4
415*** (
0.0
137)
σ=
0.7
609*** (
0.0
366)
κ=
0.0
274 n
s. (
0.2
157)
ln(θ)
-18.8
731
-25.6
947
-18.2
407
-18.0
700
LR test of θ=0
ns.
ns.
ns.
ns.
AIC
2375.2
38
2187.9
72
2141.0
16
2144.2
43
2140.8
04
Observations
1112
1112
1112
1112
1112
* p
< 0
.05, ** p
< 0
.01, *** p
< 0
.001, ns
not
signif
ican
t. S
tandar
d e
rrors
in p
aren
thes
es.
80
Figure 47: Cox-Snell residuals for the exponential model
02
46
0 1 2 3 4 5Cox-Snell residual
cumulative hazard Cox-Snell residual
Exponential Model
Figure 48: Cox-Snell residuals for the Weibull model
02
46
0 1 2 3 4 5Cox-Snell residual
cumulative hazard Cox-Snell residual
Weibull Model
81
Figure 49: Cox-Snell residuals for the log-normal model
01
23
4
0 1 2 3 4Cox-Snell residual
cumulative hazard Cox-Snell residual
Log-Normal
Figure 50: Cox-Snell residuals for the log-logistic model
01
23
45
0 .5 1 1.5 2 2.5Cox-Snell residual
cumulative hazard Cox-Snell residual
Log-Logistic Model
82
Figure 51: Cox-Snell residuals for the Gamma model
01
23
4
0 1 2 3 4Cox-Snell residual
cumulative hazard Cox-Snell residual
Gamma model
Figure 52: Cox-Snell residuals for the Gompertz model
02
46
8
0 2 4 6 8Cox-Snell residual
cumulative hazard Cox-Snell residual
Gompertz model
83
5.4.2 Model post-estimation
Figures 53–55 show the survival, hazard rate, and cumulative hazard functions of the best-fitting log-normal model. The hazard rate function estimate has a clear, log-normally distributed shape (cf. Figure 54). Table 14 also compares the best-fitting log-normal parametric model with a Cox model. I estimate this Cox model using the same structure of covariates and including the variable InitiatingCRC as a cluster variable to account for possible between-group differences. The fit of this Cox model clearly is much worse; its AIC more than trebles the log-normal model's AIC. Thus, the Cox model fits the data much worse than the log-normal model, even considering that the proportional hazards assumption is violated. When comparing the models, note that the Cox model, by definition, has no constant term (Cleves et al., 2004: 127-130). Furthermore, the effect sizes are not directly comparable, because the log-normal model uses an AFT metric.
Figure 53: Survivor function estimate of the best-fitting log-normal model
0.2
.4.6
.81
Survival
0 500 1000 1500 2000 2500analysis time
Log-normal regression
84
Figure 54: Hazard rate estimate of the best-fitting log-normal model
.0005
.001
.0015
.002
Hazard function
0 500 1000 1500 2000 2500analysis time
Log-normal regression
Figure 55: Cumulative hazard rate estimate of the best-fitting log-normal model
01
23
4Cumulative Hazard
0 500 1000 1500 2000 2500analysis time
Log-normal regression
85
Table 14: Final comparison between best-fitting parametric model and analogous Cox model
Log likelihood -1058.508 Log pseudolikelihood -4265.0681 LR χ
2 (df) 271.12 (9)
Wald χ2 (df) 9893.06 (9)
p > χ2 0.0000*** 0.0000***
Ancillary parameters σ=0.7642*** (0.0278) None ln(θ) -18.2407 -14.8372 LR test of θ=0 ns. ns. AIC 2141.016 8548.136 Observations 1112 1112
* p < 0.05, ** p < 0.01, *** p < 0.001, ns not significant. Standard errors in parentheses. 5.5 Outcomes of hypothesis testing
The log-normal model fits the data best; therefore, it becomes possible to infer rejection or support of my six hypotheses from that model’s acceleration factors. Hypothesis 1 is supported. Initiatives sent from the research centre based in Switzerland (i.e., same country as headquarters) have a significantly higher probability of survival. Hypotheses 2 is also supported, because initiatives sent from the research centres based in Switzerland and Sweden have a significantly higher probability of survival than do those sent from other research centres. Hypothesis 3 is partially supported. As predicted, initiatives targeted at programmes involved with evaluation, rather than product or technology improvements, have a significantly lower probability of survival. However, there is no significant effect on survival time for initiatives that are submitted without subject matter (i.e., programme no. 26, 'none'). Hypothesis 4 is not supported. I find no significant influence of inter-subsidiary collaboration on initiative survival. On the contrary, the negative (though insignificant) coefficient seems to suggest that the more subsidiaries collaborate in a joint initiative, the less likely this initiative is to survive. Hypothesis 5 is supported: There is a positive and significant influence of the sending manager's past success record (i.e., number of initiatives recognised in the past) on initiative survival. Hypothesis 6 is also supported. That is, the initiatives that intend to conduct exploratory technology development, rather than exploitative product improvements, have a significantly lower probability of survival. Finally, both controls are significant, which indicates that initiative survival is positively associated with both estimated future project cost and the presence of an NPV calculation.
86
6. Discussion and Implications
6.1 Causal inferences from findings
The confirmation of Hypotheses 1 and 2 suggests that some initiatives are indeed 'more equal' than others. This finding lends support to the argument that geographical distance leads to social distance, including fewer informal social contacts with corporate-level managers and less perceived centrality of remote subsidiary managers. Table 4 also suggests a cultural effect: Fewer initiatives come from research centres located in cultural environments characterised by a high degree of ambiguity intolerance and conflict avoidance (e.g., India, China) than from other research centres. These results therefore suggest that initiatives from more remote subsidiaries may not be received as favourably as initiatives sent from R&D subsidiaries that are based in the same country as the firm's headquarters. The partial confirmation of H3 suggests that subsidiary managers would be well-advised to tailor their initiatives to the firm's core areas of activity rather than addressing business areas of lesser importance, such as just evaluating existing instead of proposing new solutions. However, even if the initiative does not 'fit' into one of the existing areas of activity, its survival time does not appear to change. A possible explanation for this outcome recognises that an initiative can either target a technological domain that combines several other domains (so that it does not fit a single area of activity) or propose entrance into a new area of activity already pursued by competitors. This trend would not contradict the findings related to H6, because though such technology would be new to the firm, it would not be new to the industry and thus would not necessarily fall victim to managers' criticism of exploratory contents. These findings also lend support to the argument that the extent of upward influence on corporate strategy differs depending on whether the business managed is related to the core business of the firm (Watson and Wooldridge, 2005). Although they find no empirical support for this hypothesis, my findings confirm their arguments. The rejection of H4 demands some explanation. Why, despite all the contributions that indicate inter-subsidiary collaboration is beneficial, does a jointly conceived initiative suffer from a lower probability of survival? Several explanations are possible. First, it is not easy to collaborate in a joint R&D effort across large distances. Personal interactions among R&D staff is necessary for R&D success (Katz and Allen, 1982). Studies of communication patterns in industrial R&D departments show that specialised laboratories tend to develop unique organisational cultures, including special language schemes and codes and unique goal orientations (Allen, 1977; Katz and Tushman, 1979). Second, though the emergence of such 'sub-cultures' can facilitate communication, creativity, and problem-solving within the group, they severely inhibit the efficiency of communication with external partners and other intra-organisational units (Lawrence and Lorsch, 1967). An initiative formulated by one group of R&D staff can comprise the tacit knowledge of the individual researchers more easily, whereas such combinations across R&D subsidiaries, separated by large spatial distances, become much harder as the marginal cost of transmitting tacit knowledge increases (Audretsch and Feldman, 1996). Namely, communication among R&D researchers becomes more difficult when the laboratories are located far from each other (De Meyer, 1991).
87
These problems probably have repercussions for the initiative in several ways. For example, a collaborative initiative's content may result from political compromises among different 'sub-cultures', which could hinder its technological excellence if certain researchers refuse to collaborate with outside staff. The distribution, among the collaborating subsidiaries, of the intellectual property that results from the developed product or technology also may be unresolved. Corporate-level managers are likely to anticipate such problems when deciding about an initiative, so these adverse effects may offset the benefits of collaboration. That is, managers probably appreciate the combined technological expertise of different subsidiaries but also remain acutely aware of the associated structural problems. The confirmation of H5 demonstrates a particular case of inequality between initiatives and shows that a manager's past success record matters. This finding lends strong support to the developments of Section 3.5, as well as Dutton and Ashford's (2001) presumption that over time, 'star sellers' of initiatives emerge in organisations. In 23 initiatives in this sample, seven or more (!) of the respective manager's initiatives had been recognised in the past. These managers clearly have an almost evolutionary advantage when it comes to formulating and 'selling' initiatives. Finally, the confirmation of H6 demonstrates the well-documented tension between exploration and exploitation and confirms that managers often prefer exploitative over exploratory activities (Levinthal and March, 1993; March, 1991). The graphical analysis regarding this result is most interesting (cf. Figures 32–34). The distribution of survival times suggests that most initiatives with an exploratory content survive the initial gates G1 and G2 but then perish quickly after gates G3 and G4. It appears such initiatives get evaluated positively in terms of their technological feasibility, but at a later stage, managers' risk-avoidance concerns and fear of unpredictable risks leads to their rejection at gates G3 and G4, as managers assess the initiative's economic viability. 6.2 Implications for research
These collective findings provide several answers to my initial research questions (cf. Section 1.5). I answer the main research question and subquestions (a) and (b) in this section, leaving subquestion (c) to Section 6.4, where I discuss some implications for management practice. First, the main research question asked: What determines the probability of survival of an initiative
sent by a foreign R&D subsidiary? My findings suggest that the geographical closeness of the sending R&D subsidiary to the headquarters, the alignment of the initiative with the firm's core areas of activity, exploitative rather than exploratory content, and past success of the manager who sent the initiative all positively influence the initiative's probability of survival. Collaboration with other subsidiaries, in contrast, does not significantly influence this probability. Second, subquestion (a) asked: How and why do initiatives differ in their individual probability of survival? I address this question on both a conceptual basis, by constructing a model of the initiative’s 'journey', and empirically, by exploring initiative characteristics that may influence this probability. My findings suggest that initiatives differ in their individual probability of survival because they are both 'objectively' and 'subjectively' different from one another. 'Objectively', an initiative's subject matter co-determines how favourably it will be received by corporate-level managers. Initiatives that propose action perceived as risky (e.g., exploratory technology development, activities outside the firm's core areas of activity) will be met with more criticism and therefore, ceteris paribus, have a lesser probability of survival. 'Subjectively', the more informal social relations with corporate-level managers the sending manager has, the more central he or she is perceived to be; moreover, the better his or her past success record, the higher is his or her signalled ability to implement this particular initiative successfully.
88
Both effects induce a positive signalling effect that corporate-level managers probably interpret as a heuristic for the initiative's future success. Thus, such initiatives generally are met more favourably than others and, ceteris paribus, have a higher probability of survival. Third, subquestion (b) asked: Are initiatives from some foreign R&D subsidiaries more likely to
survive than others? Given my findings, the answer to this question is straightforward: Initiatives sent from a subsidiary based in the same country as the firm's headquarters have a significantly higher probability of survival; moreover, the probability of survival differs significantly between subsidiaries. 6.3 Contributions to theory
6.3.1 Contributions to theory on subsidiary initiatives
First, my dissertation directly studies characteristics of initiatives on which their very survival depends. This type of study is, to the best of my knowledge, unprecedented in extant literature. Having revealed the influence of these characteristics on an initiative's probability of survival, it is now possible to determine why some initiatives are accepted, whereas others are not. Second, to the best of my knowledge, this study is the first to use the concept of initiatives as an analytical tool to study the intra-firm organisation of an MNC's R&D organisation. Prior studies of subsidiary initiative tend to ignore R&D subsidiaries and focus instead on manufacturing units. Because this analytical method successfully indicates the reasons that initiatives differ in survival time, the concept of using initiatives as an analytical instrument to analyse intra-firm processes seems quite promising for additional research, not only pertaining to international R&D but related to any organisational subsystem of an MNC characterised by communications between headquarters and subsidiaries. Third, my findings provide empirical support for some of Dutton and Ashford's (1993) presumptions. They postulate that corporate-level managers' attention to an initiative increases if the initiative signals expertise relevant to a particular issue domain (proposition 6), and is framed as strategic (proposition 9). My findings support these propositions by showing that if an initiative is ('strategically') targeted to one of the firm's core areas of activity ('domain'), and if it proves its relevance by proposing exploitative innovation targeted at existing products and technologies, rather than suggesting the exploratory development of a new technology, it is more likely to survive. Fourth, in terms of Burgelman's (1991) variation-selection-retention framework, my study treats the much neglected area of selection; most other literature to date remains concerned with analysing the conditions in which initiatives are likely to emerge. My dissertation, however, carries this analysis onto the second stage of the framework to show why initiatives may truly survive after generation. Fifth and finally, in terms of data quality, my dissertation provides a new type of data that is vastly superior to previously used data. Because I extracted all initiative data directly from the focal firm's database, I was able to collect objective data about the firm's initiatives. Specifically, my measurements of the survival time, the failure event, and the initiatives’ characteristics remain free of any subjective judgements or measurement error induced by the individual perceptions of the respondents. Thus, these data have very high reliability, especially in contrast with qualitative anecdotal evidence about why an initiative might fail. My measurement approach also prevents the results from suffering from some well-known measurement problems that never can be ruled out completely when the data come from questioning individual respondents (e.g., priming, respondent bias). Thus, my dissertation answers the call for intra-firm data on firms’ international R&D operations, which are mostly absent in extant research (Argyres and Silverman, 2004; Rugman, 2005; Verbeke, 2005).
89
6.3.2 Contributions to theory on international R&D and the under-utilisation problem
My dissertation is one of the very few studies that looks at the intra-firm configuration of MNCs’ international R&D organisation by using actual intra-firm data instead of proxies. Previous literature has been characterised by the use of either proxy measures, such as patent data or aggregated financial indicators, or qualitative and anecdotal studies about the (mainly managerial) problems of managing international R&D structures. My dissertation thus advances study of the intra-firm sphere to the firm level itself but still enables deduction through quantitatively testable hypotheses. In Section 1.2, I asked, given the persistent problem of under-utilisation of international R&D resources, of what use is international R&D at all? Couldn't all the firm's innovations be generated at headquarters, instead of spending money on costly and complex management processes entailed by an international R&D organisation? My results suggest that this sceptical depiction simply is not the case. Although only 38.4% of initiatives survive the process, and though initiatives from an R&D subsidiary based in the same country as corporate headquarters have a better chance of survival, the findings do not imply that conducting international R&D at all is irrational. My data set clearly demonstrates that initiatives emerge from all international research centres. Subsidiaries thus appear to have a natural interest in being integrated into the firm's global innovation processes and leveraging their resources and capabilities to the global firm, because such a leveraging increases their status, scope of tasks, and power within the organisation (Birkinshaw et al., 1998). The question, thus, is not whether international R&D makes sense at all but rather why so few initiatives survive in a global R&D organisation. My findings suggest that two obstacles are responsible for this effect. First, an initiative-sending subsidiary must win the 'initiative competition' or 'initiative race' against its sister subsidiaries. However, this race is characterised by unequal starting conditions. My findings suggest that certain subsidiaries and initiative-sending managers have 'ecological' or 'evolutionary' advantages that have grown over time on the basis of the subsidiaries' and managers' informal relations, centrality, experience, and past success. Those who can capitalise on such advantages will find it easier to make their initiatives survive. Second, due to the inherent risks of R&D, corporate-level managers' cognitive structures highlight risk-avoidance behaviour. These corporate-level managers conceivably might be held responsible for the failure of initiatives that they recognised but that resulted in projects that failed to meet their technological and economic objectives. An initiative needs to overcome these steep mental barriers to survive. Therefore, actors with informal social relations with corporate-level managers and a good past success record are more likely to convince corporate-level managers that they can control these risks. Together, both effects demonstrate the hurdles an initiative must overcome. On this basis, I suggest that the problem of under-utilisation of R&D resources does not imply that international R&D as such is pointless but rather that the tedious and persistent structural problems in communications between headquarters and subsidiaries impede a better utilisation of international R&D resources. Thus, my findings confirm Rugman and Verbeke's (2003) rather pessimistic prediction regarding the leverage and combination of internationally dispersed resources and capability into one global competitive advantage. With the recognition that leverage, as advocated by normative organisational models such as the 'transnational' (Bartlett and Ghoshal, 1989) or the 'global heterarchy' (Hedlund, 1986) models, often fails to take place, prior literature advocates improving intra-firm knowledge exchange through better information and communication technology (ICT), more interpersonal informal exchange, incentive systems, and a culture capable of supporting the flow of knowledge (Almeida et al., 2003; Hansen and Nohria, 2004; Frost and Zhou, 2005).
90
However, my findings imply that neither of these measures can significantly improve the leverage of subsidiaries' R&D resources and capabilities. The problem is not a less-than-perfect use of the means of communication but the two obstacles that every single initiative must overcome to survive and be recognised. Bluntly, the number of and sizes of knowledge-sharing databases in a firm will not relate to leverage success. If leverage occurs as soon as a subsidiary's initiative gets recognised, which means that subsidiary receives a project mandate and is integrated into a global R&D project with the parent firm, then my findings suggest that the leverage of dispersed R&D resources depends on initiative survival. This survival, in turn, depends on both 'subjective' factors (managers' informal social relations with corporate-level managers, perceived centrality) and 'objective' factors (initiatives' alignment with the firm's core areas of activity, exploitative rather than exploratory innovation). All of these effects are totally unrelated to previous literature's recommendations. This disconnect should not be surprising, because all past advice regarding how to achieve leverage has been based on either proxy measures, such as patent data, or anecdotal qualitative evidence (e.g., Reger, 2004). The question that remains open, then, considering the identification of the two central hurdles to initiative survival and thus the means to resolve the under-utilisation problem, centres on what individual managers can do to ensure their initiatives overcome these hurdles. Subsidiary managers cannot count on corporate-level managers changing their social networks or risk perceptions anytime soon, so I suggest that the central issue for managers in remote R&D subsidiaries is to build a reputation of trust and usefulness around their initiatives. In the next section, I detail how they might do so. 6.4 Implications for management practice
The discussed hurdles to initiative survival, and thus to the leveraging of subsidiaries' R&D resources and capabilities, create a challenge for subsidiary managers. They have to face the problem of how to improve their initiatives' probability of survival. The answer to this question also answers subquestion (c) of my research questions here, namely, What can managers in foreign
subsidiaries do to increase their initiatives' probability of survival?
Prior research suggests that managers cite 'overcoming intra-organisational distance' as the greatest problem in their efforts to achieve leverage of their subsidiaries' resources and capabilities, whereas 'better knowledge exchange' and 'better information and communication technology infrastructure' rank among the least frequently cited reasons (von Zedtwitz et al., 2004). Similarly, Doz et al. (2006) find that companies refer to 'breaking down organisational and functional barriers' as one of the three most serious challenges associated with conducting global innovation processes. Birkinshaw et al. (1998) suspect that the resources and capabilities of subsidiary units are very poorly understood by parent and sister company managers around the world. Subsidiary managers formulating initiatives thus face two challenges, reflecting my previous discussions: a 'subjective' and an 'objective' challenge. Subjectively, subsidiary managers should attempt to foster informal social interaction with headquarter managers and thereby build up informal social contacts and improve their own centrality, which 'simulates' a geographically close subsidiary. Subsidiary managers should also look actively for promoters, either in 'close' subsidiaries whose managers are favoured by the parent firm or inside headquarters itself to find external 'political' support for their initiatives.
91
On the 'objective' level, subsidiary managers must structure their initiatives to encourage corporate-level managers to react more favourably to them. My findings demonstrate that managers should refrain from sending initiatives that aim to undertake exploratory innovation and should carefully align their initiative with the firm's core areas of activity. This recommendation may also mean postponing initiatives that have personal appeal to the sending manager but do not fit the current organisational climate regarding which initiatives seem 'appropriate' or 'risky' to corporate-level mangers. Thus, initiative senders should carefully observe the current 'political' intra-firm situation before deciding which initiatives to send. Finally, managers should not invest in resources to foster initiatives conceived jointly with other subsidiaries but rather should allocate their efforts to advocate for their own areas of specialisation. My results clearly suggest that inter-subsidiary collaboration does not significantly improve an initiative's probability of survival. 6.5 Limitations and paths for further research
First, my research design controls for intra-industry and inter-firm heterogeneity by concentrating on a single firm in a single industry. Therefore, I cannot analyse how the probability of initiative survival may vary between firms. Moreover, I do not consider any possible environmental influences. For example, in times of crisis, when strategic renewal is urgently needed, corporate-level managers may be more open to any initiative and thus look on initiatives from remote subsidiaries just as favourably as they would on those from close ones. Additional studies should analyse the influence of these sources of variance. Second, my dissertation studies a specific organisational subsystem (namely, the global R&D organisation) of a particular type of firm (namely, an MNC). Therefore, my results, though generalisable, are generalisable only to initiatives in international R&D networks. The findings are not readily generalisable to other internationalised business functions (e.g., international manufacturing). Thus, further studies could test whether my findings can be replicated in other organisational subsystems and other types of firms. Third, returning to my conceptual model of the initiative process (cf. Section 2), I lay my empirical focus on the element of initiative characteristics, which implies that the other five elements of the model, each of which may influence the initiative's probability of survival, remain unexplored. Additional research could therefore turn to the analysis of these elements, such as by asking how the decision-making process among corporate-level managers, their cognitive characteristics, and personal traits influence an initiative's probability of survival. Fourth, again returning to Burgelman's (1991) variation-selection-retention framework, my dissertation extends the empirical analysis of initiatives to the 'selection' category. This point, however, immediately implies that the 'retention' category remains largely untouched by empirical research, apart from a few exceptions, such as McGrath (1995). The selection phase is not the end of the initiative process, because initiatives still need to be implemented, which entails a major concern, namely, integrating the initiative into the fabric of the firm (Burgelman, 1983b). According to Kanter (1982), this phase requires 'moving into action' and consists of handling interference or opposition, maintaining momentum and continuity, implementing secondary redesign and changes, and communicating externally to the various project stakeholders. Thus, an initiative may well survive the selection stage, but it still faces the challenge of turning into a successful project that delivers value to the firm. Consequently, further research should continue my studies by analysing the subsample of recognised initiatives and asking why these initiatives evolve, or do not evolve, into successful projects.
92
Appendix A. Listed output of Kaplan-Meier Survivor Function Estimates for the Complete Data Set
This output was created by using the Stata command sts list , enter nosh.
Beg. Survivor Std.
Time Total Fail Lost Enter Function Error [95% Conf. Int.]
C. List of Stata commands used to produce tables, figures, and results
Table
Stata command line(s) used to create it
Init
ial
set-
up
Sts
et _
t, f
ailu
re(d
eath
= =
1)
Tab
le 4
1. co
unt
if f
rom
_i=
=1 &
Pro
gra
m_j=
=1;
i=1,…
,10;
j=1, …
,26
2. co
unt
if f
rom
_i=
=1 &
Pro
gra
m_j=
=1 &
fai
lure
==
0;
i=1,…
,10;
j=1, …
,26
Tab
le 5
su
m _
t fr
om
CH
-fro
mU
S P
rogra
m1-P
rogra
m26 I
nte
rCrc
Coo
p N
PV
_y p
astS
uc
Inno
_T
ech P
roje
ctc
Tab
le 6
pw
corr
s P
rogra
m1-P
rogra
m26 _
t In
terC
rcC
oo
p N
PV
_yes
pas
tSucc
ess
Inno
_T
ech P
roje
ctco
st, si
g s
pea
rman
T
able
7
pw
corr
s P
rogra
m1-P
rogra
m26 f
rom
CH
-fro
mU
S, si
g s
pea
rman
T
able
8
pw
corr
s fr
om
CH
-fro
mU
S _
t In
terC
rcC
oo
p N
PV
_yes
pas
tSucc
ess
Inno
_T
ech P
roje
ctco
st, si
g s
pea
rman
T
able
9
pw
corr
s _t
Inte
rCrc
Coop N
PV
_yes
pas
tSucc
ess
Inno
_T
ech P
roje
ctco
st, si
g s
pea
rman
T
able
10
For
each
<var
iable
>:
sts
test
<var
iable
>, al
tern
atin
g w
ith (
l) (
w)
(tw
) (p
) T
able
11
1. st
cox f
rom
CH
fro
mS
E P
rogra
m3 P
rogra
m21 p
astS
ucc
ess
NP
V_yes
Inte
rCrc
Coo
p I
nno
_T
echdev
Pro
ject
c,
schoen
f(sc
h*)
scal
eds(
sc_*)
clust
er(I
ni)
2. st
phte
st, d
Tab
les
12, 13
Ex
ponen
tial
model
: st
reg fr
om
CH
fr
om
SE
P
rogra
m21 N
PV
_ p
astS
uc
Inno
_T
echdev
Pro
ject
c , d(e
xp)
shar
ed(I
nit
iati
ng
_C
RC
) fr
ail
(invg)
tim
e W
eibull
model
: st
reg fr
om
CH
fr
om
SE
P
rog
ram
3 P
rogra
m10 P
rogra
m15 P
rogra
m21 I
nte
rCr
NP
V_y
pas
tSuc
Inno
_T
echdev
Pro
ject
c,
d(w
eib)
shar
ed(I
nit
iati
ng
_C
RC
) fr
ail(
inv
g)
tim
e L
og-n
orm
al m
odel
: st
reg fr
om
CH
fro
mS
E P
rogra
m3 P
rogra
m21 I
nte
rCrc
Coo
p N
PV
_yes
pas
tSucc
ess
Inno
_T
echdev
Pro
ject
c , d(l
ogn)
shar
ed(I
nit
iati
ng
_C
RC
) fr
ail(
invg)
L
og-l
ogis
tic
model
: s
treg
fr
om
CH
fr
om
SE
Pro
gra
m3 P
rogra
m21 I
nte
rCrc
Coop N
PV
_yes
pas
tSucc
ess
Inno
_T
echdev
Pro
ject
c ,
d(l
oglo
g)
shar
ed(I
nit
iati
ng
_C
RC
) fr
ail(
invg)
G
amm
a m
odel
: st
reg fr
om
CH
fro
mS
E P
rogra
m3 P
rogra
m15 P
rogra
m21 I
nte
rCr
NP
V_yes
pas
tSucc
ess
Inno
_T
echdev
Pro
ject
c ,
d(g
am)
clust
er(I
ni)
Note that Stata 9.2 does not yet support the use of gamma-distributed frailty with gamma models. Therefore, I controlled for frailty
effects in the Gamma model by using the 'cluster' option.
Tab
le 1
4
Log-n
orm
al m
odel
: as
above
Cox m
odel
: st
cox f
rom
CH
fro
mS
E P
rogra
m3 P
rogra
m21 I
nte
rCrc
Coo
p N
PV
_yes
pas
tSucc
ess
Inno
_T
echdev
Pro
ject
c,
clust
er(I
nit
iati
ng
_C
RC
)
113
Figure Stata command line(s) used to create it
Figure 2 hist _t, width(50) Figure 3 sts graph gwood444 Figure 4 sts graph, na cna Figures 5, 6 1. sts gen kmS = s
2. sts gen naH = na 3. gen naS=exp(-naH) 4. gen kmH=-log(kmS) 5. label var kmS "K-M survivor function" 6. label var naS "N-A survivor function" 7. label var kmH "K-M cumulative hazard" 8. label var naH "N-A cumulative hazard" 9. label var _t "analysis time" 10a. line kmS naS _t, c(J J) sort [figure 5] 10b. line naH kmH _t, c(J J) sort [figure 6]
For each best-fitting model: 1. predict cs, csnell 2. stset cs, failure(death) 3. sts gen km=s 4. sts gen H=-ln(km) 5. label var H "cumulative hazard" 6. line H cs cs, sort
References Aalen, O.O. 1978. Nonparametric inference for a family of counting processes. Annals of Statistics
6: 701-726. Adler, P.S., Borys, B. 1996. Two types of bureaucracy: enabling and coercive. Administrative
Science Quarterly 41: 61-89. Adler, R.B., Rosenfeld, L.B., Towne, N. 1996. Interplay: the process of interpersonal
communication. New York: Harcourt Brace. Ahuja, G. 2000. The duality of collaboration: Inducements and opportunities in the formation of
interfirm linkages. Strategic Management Journal 21(3): 317-343. Ahuja, G., Lampert, C. 2001. Entrepreneurship in the large corporation: A longitudinal study of
breakthrough innovation. Strategic Management Journal 22: 521-543. Ahuja, M.K., Galletta, DF, Carley, K.M. 2003. Individual centrality and performance in virtual
R&D groups: An empirical study. Management Science 49(1): 21-38. Allen, T.J. 1977. Managing the flow of technology. Cambridge, MA: MIT Press. Almeida, P., Phene, A. 2004. Subsidiaries and knowledge creation: The influence of the MNC and
host country on innovation. Strategic Management Journal 25: 847-864. Almeida, P., Song, J., Grant, R.M. 2003. Are firms superior to alliances and markets? An empirical
test of cross-border knowledge building. Organization Science 13: 147-161. Ambos, B., Schlegelmilch, B. 2004. The use of international R&D teams: An empirical
investigation of selected contingency factors. Journal of World Business 39(1): 37–48. Andersson, U., Forsgren, M. 1996. Subsidiary embeddedness and control in the multinational
corporation. International Business Review 5(5): 487-508. Argyres, N.S., Silverman, B.S. 2004. R&D, organization structure and the development of
corporate technological knowledge. Strategic Management Journal 25: 929-958. Ashford, S.J., Rothbard, N.P., Piderit, S.K., Dutton, J.E. 1998. Out on a limb: the role of context
and impression management in selling gender-equity issues. Administrative Science
Quarterly 43: 23-57. Audia, P.G., Goncalo, J.A. 2007. Past success and creativity over time: A study of inventors in the
hard disk drive industry. Management Science 53: 1-15. Audretsch, D.B., Feldman, M.P. 1996. R&D spillovers and the geography of innovation and
production. American Economic Review 86(3): 630-640. Baldwin, J., Lin, Z. 2002. Impediments to advanced technology adoption for Canadian
manufacturers. Research Policy 31: 1-18. Barkema, H.G., Vermeulen, F. 1997. What differences in the cultural backgrounds of partners are
detrimental for international joint ventures? Journal of International Business Studies 28: 845-865.
Bartlett, C.A., Ghoshal, S. 1986. Tap your subsidiaries for global reach. Harvard Business Review 64: 87-94.
Bartlett, C.A., Ghoshal, S. 1989. Managing across borders - the transnational solution. Cambridge, MA: MIT Press.
Behrman, J.N., Fischer, W.A. 1980. Overseas R&D Activities of Transnational Companies. Cambridge, MA: Oelgeschlager, Gunn and Hain.
Benito, G., Grogaard, B., Narula, R. 2003. Environmental influences on MNE subsidiary roles: Economic integration and the Nordic countries. Journal of International Business Studies 34: 443-456.
Benner, M.J., Tushman, M.L. 2002. Process management and technological innovation: A longitudinal study of the photography and paint industries. Administrative Science Quarterly 47: 676-706.
Benner, M.J., Tushman, M.L. 2003. Exploitation, exploration, and process management: The productivity dilemma revisited. Academy of Management Review 28: 238-256.
116
Bettis, R.K., Prahalad, C.K. 1995. The dominant logic: Retrospective and extension. Strategic Management Journal 16: 5-14.
Birkinshaw, J. 1996. How multinational subsidiary mandates are gained and lost. Journal of International Business Studies 27(3): 467-495.
Birkinshaw, J. 1997. Entrepreneurship in multinational corporations: The characteristics of subsidiary initiatives. Strategic Management Journal 18(3): 207-229.
Birkinshaw, J. 2000. Entrepreneurship in global firms. London: Sage. Birkinshaw, J., Fry, N. 1998. Subsidiary initiatives to develop new markets. Sloan Management
Review 39(3): 51-61. Birkinshaw, J., Hood N., Jonsson, S. 1998. Building firm-specific advantages in multinational
corporations: The role of subsidiary initiative. Strategic Management Journal 19(3): 221-241.
Birkinshaw, J., Hood, N. 2000. Characteristics of foreign subsidiaries in industry clusters. Journal of International Business Studies 31(1): 141-154.
Birkinshaw, J., Nobel, R., Ridderstråle, J. 2002. Knowledge as a contingent variable: Do the characteristics of knowledge predict the organizational structure? Organization Science 13: 274-289.
Birkinshaw, J., Ridderstråle, J. 1999. Fighting the corporate immune system: A process study of subsidiary initiatives in multinational corporations. International Business Review 8: 149-180.
Bond, M.H., Smith, P.B. 1996. Cross-cultural social and organizational psychology. Annual Review of Psychology 47: 205-235.
Boutellier, R., Gassmann, O., von Zedtwitz, M. (Eds.). 2000. Managing global innovation. 2nd ed. Berlin: Springer.
Brass, D.J., Burkhardt, M.E. 1993. Potential power and power use: An investigation of structure and behavior. Academy of Management Journal 36(3): 441-470.
Breslow, N.E. 1970. A generalized Kruskal-Wallis test for comparing k samples subject to unequal patterns of censorship. Biometrika 57: 579-594.
Brockhoff, K. 1998. Internationalization of research and development. Berlin: Springer. Brockhoff, K., Schmaul, B. 1996. Organization, autonomy, and success of international dispersed
R&D facilities. IEEE Transactions on Engineering Management 43(1): 33-40. Bryson, J., Bromiley, P. 1993. Critical factors affecting the planning and implementation of major
projects. Strategic Management Journal 14: 319-337. Burgelman, R.A. 1983a. A process model of internal corporate venturing in the diversified major
firm. Administrative Science Quarterly 28: 223-244. Burgelman, R.A. 1983b. Corporate entrepreneurship and strategic management: Insights from a
process study. Management Science 29: 1349-1364. Burgelman, R.A. 1991. Interorganizational ecology of strategy making and organizational
adaptation: theory and field research. Organization Science 2: 239-262. Burgelman, R.A., 1994. Fading memories: a process theory of strategic business exit in dynamic
New York: The Free Press. Burt, R.S. 1992. The social structure of competition. In N. Nohria and R.G. Eccles (Eds.), Networks
in organizations, Boston: Harvard Business School Press, 57-91. Butler, J.K., Cantrell, R.S. 1984. A behavioral decision theory approach to modeling dyadic trust in
superiors and subordinates. Psychological Reports 55: 19-28. Cantwell, J. 1995. The globalisation of technology: What remains of the product cycle model?
Cambridge Journal of Economics 19: 155-174.
117
Cantwell, J. 2001. Innovation and information technology in MNE, in: Rugman, A.M., Brewer, T.L. (Eds.), The Oxford Handbook of International Business, Oxford University Press, Oxford (UK), 431-456.
Chen, C.C., Chen, X.P., Meindl, J.R. 1998. How can cooperation be fostered? The cultural effects of individualism - collectivism. Academy of Management Review 23: 285-304.
Cheng, J., Bolon, D.S. 1993. The management of multinational R&D: A neglected topic in international business research. Journal of International Business Studies 24: 1-18.
Chesbrough, H.W., Teece, D.J. 1996. When is virtual virtuous? Organizing for innovation. Harvard Business Review 73(3): 65-73.
Chiesa, V. 1996. Managing the internationalization of R&D activities. IEEE Transactions on Engineering Management 43(1): 7-23.
Chiesa, V. 2000. Global R&D project management and organization: a taxonomy. Journal of Product Innovation Management 17(5): 341-359.
Christensen, C. 1997. The innovator's dilemma. Harvard Business School Press, Boston, MA. Christensen, C.M., Bower, J.L. 1996. Customer power, strategic investment, and the failure of
leading firms. Strategic Management Journal 17: 197-218. Clark, K.B., Fujimoto, T. 1991. Product Development Performance: Strategy, Organization, and
Management in the World Auto Industry. Harvard Business School Press: Boston, MA. Cleves, M.A., Gould, W.W., Gutierrez, R.G. 2004. An introduction to survival analysis using Stata.
College Station, TX: Stata Press. Cohen, M.D., March, J.G., Olsen, J.P. 1972. A garbage can model of organizational choice.
Administrative Science Quarterly 17(1): 1-25. Cooper, R.G., Kleinschmidt, E.J. 1987. New products: What separates winners from losers? Journal
of Product Innovation Management 4: 169-184. Cox, D.R. 1972. Regression models and life tables (with discussion). Journal of the Royal
Statistical Society B 34: 187-220. Currie, G., Kerrin, M. 2004. The limits of a technological fix to knowledge management.
Management Learning 35(1): 9-29. Cyert, R. M., March, J. G. 1963. A behavioral theory of the firm. Englewood Cliffs: Prentice-Hall. D'Aveni, R.A. 1994. Hypercompetition. New York: The Free Press. De Meyer, A. 1991. Tech talk: How managers are stimulating global R&D communication. Sloan
Management Review 33: 49-58. De Meyer, A., Mizushima, A. 1989. Global R&D management. R&D Management 19: 135-146. Dean, J.W., Sharfman, M.P. 1996. Does decision process matter? A study of strategic decision-
making effectiveness. Academy of Management Journal 39: 368-396. Doz, Y. L., Santos, J., Williamson, P. 2001. From global to metanational: How companies win in
the knowledge economy. Boston: Harvard Business School Press. Doz, Y., Prahalad, C.K. 1987. The multinational mission - balancing local demands and global
vision. New York: The Free Press. Doz, Y., Wilson, K., Veldhoen, S., Goldbrunner, T., Altman, G., 2006. Innovation: Is global the
way forward? INSEAD: Fontainebleau. Dutton, J.E., Ashford, S.J. 1993. Selling issues to top management. Academy of Management
Review 18: 397-428. Dutton, J.E., Ashford, S.J., Lawrence, K.A., Miner-Rubino, K. 2002. Red light, green light: Making
sense of the organizational context for issue selling. Organization Science 13(4): 355-369. Dutton, J.E., Ashford, S.J., O’Neill, R.M., Hayes, E., Wierba, E.E. 1997. Reading the wind: How
middle managers assess the context for selling issues to top managers. Strategic
Management Journal 18(5): 407-425.
118
Dutton, J.E., Ashford, S.J., O’Neill, R.M., Lawrence, K.A. 2001. Moves that matter: Issue-selling and organizational change. Academy of Management Journal 44(4): 716-736.
Earley, P.C., Erez, M. 1997. New perspectives on international industrial/organization psychology. San Francisco: New Lexington Press.
Earley, P.C., Mosakowski, E. 2000. Creating hybrid team cultures: An empirical test of transnational team functioning. Academy of Management Journal 43: 26-50.
Egelhoff, W.G. 1991. Information-processing theory and the multinational enterprise. Journal of International Business Studies 22: 341-368.
Eisenhardt, K.M., Martin, J.A. 2000. Dynamic capabilities: What are they? Strategic Management
Journal 21: 1105-1121. Eisenhardt, K.M., Tabrizi, B.N. 1995. Accelerating adaptive processes: Product innovation in the
global computer industry. Administrative Science Quarterly 40: 84-111. Emerson, R.M. 1962. Power-dependence relations. American Sociological Review 27: 31-41. Etemad, H., Dulude, L.S. 1986. Managing the multinational subsidiary. London: Croom Helm. Farjoun, M. 1998. The independent and joint effects of the skills and spatial bases of relatedness in
diversification. Strategic Management Journal 19(7): 611-630. Floyd, S.W., Wooldridge, B. 1999. Knowledge creation and social networks in corporate
entrepreneurship: The renewal of organizational capability. Entrepreneurship Theory and Practice 23(3): 123-143.
Floyd, S.W., Wooldridge, B. 2000. Building strategy from the middle: Reconceptualizing strategy process. Thousand Oaks, CA: Sage.
Fors, G. 1997. Utilization of R&D results in the home and foreign plants of multinationals. Journal of Industrial Economics 45(3): 341-358.
Foss, N.J. 2006. Knowledge and organization in the theory of the multinational corporation: Some foundational issues. Journal of Management and Governance 10: 3-20.
Frost, T. 2001. The geographic sources of foreign subsidiaries' innovations. Strategic Management
Journal 22(2): 101-123. Frost, T., Birkinshaw, J., Ensign, P., 2002. Centres of excellence in multinational corporations.
Strategic Management Journal 23(11): 997-1018. Frost, T., Zhou, C. 2005. R&D co-practice and 'reverse' knowledge integration in multinational
firms. Journal of International Business Studies 36: 676-687. Galia, F., Legros, D. 2004. Complementarities between obstacles to innovation: Evidence from
France. Research Policy 33: 1185-1199. Galunic, C.D., Eisenhardt, K.M. 1996. The evolution of intracorporate domains: Divisional charter
losses in high-technology, multidivisional corporations. Organization Science 7(3): 255-282. Galunic, C.D., Eisenhardt, K.M. 2001. Architectural innovation and modular corporate forms.
Academy of Management Journal 44: 1229-1249. Garcia, R., Calantone, R., Levine, R. 2003. The role of knowledge in resource allocation to
exploration versus exploitation in technologically oriented organizations. Decision Sciences 34: 323-49.
Garrett, J.M. 1997. Graphical assessment of the Cox model proportional hazards assumption. Stata Technical Bulletin 35: 9-14.
Garud, R., Van de Ven, A. 1992. An empirical evaluation of the internal corporate venturing. Strategic Management Journal 13: 93-109.
Gehan, E.A. 1965. A generalized Wilcoxon test for comparing arbitrarily singly censored data. Biometrika 52: 203-223.
Ghoshal, S., Nohria, N. 1989. Internal differentiation within multinational corporations. Strategic Management Journal 10: 323-337.
Gioia, D.A., Sims, H.P. 1983. Perceptions of managerial power as a consequence of managerial behavior and reputation. Journal of Management 9: 7-26.
Goffman, E. 1981. Forms of talk. Philadelphia: University of Philadelphia Press.
119
Goodman, P.S., Bazerman, M., Conlon, E. 1980. Institutionalization of planned organizational change. In B.M. Staw and L.L. Cummings (Eds.), Research in Organizational Behavior, Greenwich, CT: JAI Press, 215-246.
Graebner, M. 2004. Momentum and serendipity: How acquired leaders create value in the integration of technology firms. Strategic Management Journal 25(8-9): 751-777.
Grambsch, P.M., Therneau, T.M. 1994. Proportional hazards tests and diagnostics based on weighted residuals. Biometrika 81: 515-526.
Granovetter, M. 1985. Economic action and social structure: The problem of embeddedness. American Journal of Sociology 91(3): 481-510.
Granstrand, O. 1999. Internationalization of corporate R&D: A study of Japanese and Swedish corporations. Research Policy 28: 275-302.
Granstrand, O., Håkanson, L., Sjölander, S. 1993. Internationalization of R&D - A survey of some recent research. Research Policy 22: 413-430.
Greene, W.H. 2003. Econometric Analysis. 5th ed. Upper Saddle River, NJ: Prentice-Hall. Gupta, A. K., Govindarajan, V. 2000. Knowledge flows within multinational corporations. Strategic
Management Journal 21: 473-496. Gupta, A.K., Govindarajan, V. 1994. Organizing for knowledge within MNCs. International
Business Review 3(4): 443-457. Guth, W.D., MacMillan, I.C. 1986. Strategy implementation versus middle manager self-interest.
Strategic Management Journal 7: 313-327. Haas, M.R., Hansen, M.T. 2005. When using knowledge can hurt performance: The value of
organizational capabilities in a management consulting company. Strategic Management
Journal 26: 1-24. Håkanson, L., Nobel, R. 1993. Foreign research and development in Swedish multinationals.
Research Policy 22: 373-396. Håkanson, L., Nobel, R. 2000. Technology characteristics and reverse technology transfer.
Management International Review 40(1): 29-84. Halal, W. E. (1993). Internal Markets. New York: Wiley. Hansen, M.T. 2002. Knowledge networks: Explaining effective knowledge sharing in multiunit
companies. Organization Science 13(3): 232-248. Hansen, M.T., Løvas, B. 2004. How do multinational companies leverage technological
competencies? Moving from single to interdependent explanations. Strategic Management
Journal 25: 801-822. Hansen, M.T., Nohria, N. 2004. How to build collaborative advantage. MIT Sloan Management
Review Fall: 22-30. Hansen, M.T., Nohria, N., Tierney, T. 1999. What’s your strategy for managing knowledge?
Harvard Business Review 77(2): 106-116. Hargadon, A., Sutton, R.I. 1997. Technology brokering and innovation in a product development
firm. Administrative Science Quarterly 42: 716-749. Harrington, D.P., Fleming, T.R. 1982. A class of rank test procedures for censored survival data.
Biometrika 69: 553-566. Hauschildt, J. 1993. Innovationsmanagement. München: Vahlen. Hauschildt, J., Kirchmann, E. 2001. Teamwork for innovation - the 'troika' of promotors. R&D
Management 31: 41-49. Hayes, R.H., Clark, K.B. 1985. Exploring the sources of productivity differences at the factory
level. New York: Wiley. He, Z.L., Wong, P.K. 2004. Exploration vs. exploitation: An empirical test of the ambidexterity
hypothesis. Organization Science 15: 481-94. Hedlund, G., 1986. The hypermodern MNC - A heterarchy. Human Resource Management 25(1):
9-35.
120
Henderson R., Del Alamo, J., Becker, T., Lawton, J., Moran, P., Shapiro, S. 1998. The perils of excellence: Barriers to effective process improvement in product-driven firms. Production Operations Quarterly 7: 2-18.
Herrmann, A., Kaiser, C., Heitmann, M. 2007. Survival-Modelle in der betriebswirtschaftlichen Forschung - Grundidee, Methodik, Anwendungen. Die Unternehmung 1/2007: 43-70.
Hess, K.R. 1995. Graphical methods for assessing violations of the proportional hazards assumption in Cox regression. Statistics in Medicine 14: 1707-1723.
Hofstede, G. 2001. Culture’s consequences. 2nd ed. Thousand Oaks, CA: Sage. Hosmer, D.W., Lemeshow, S: 1999. Applied survival analysis. New York: Wiley. Hosmer, L.T. 1995. Trust: The connecting link between organizational theory and philosophical
ethics. Academy of Management Review 20: 379-403. Hovland, C.I., Weiss, W. 1951. The influence of source credibility on communication effectiveness.
Public Opinion Quarterly 15: 635-650. Howell, J.M., Higgins, C.A. 1990. Champions of technological innovation. Administrative Science
Quarterly 35: 317-341. Ibarra, H. 1993. Network centrality, power, and innovation involvement: Determinants of technical
and administrative roles. Academy of Management Journal 36(3): 471-501. Jaffe, A., Trajtenberg, M., Henderson, R. 1993. Geographic localization of knowledge spillovers as
evidenced by patent citations. Quarterly Journal of Economics 108(3): 577-598. Jansen, J.P., Van Den Bosch, F.A., Volberda, H.W. 2006. Exploratory innovation, exploitative
innovation, and performance: Effects of organizational antecedents and environmental moderators. Management Science 52: 1661-1674.
Jarillo, J.-C., Martinez, J.L. 1990. Different roles for subsidiaries: The case of multinational corporations in Spain. Strategic Management Journal 11(7): 501-512.
Kahneman, D., Tversky, A. 1979. Prospect theory: An analysis of decision under risk. Econometrica 47: 263-291.
Kalbfleisch, J.D., Prentice, R.L. 2002. The statistical analysis of failure time data. 2nd ed. New York: Wiley
Kanter, R. M. 1982. The middle manager as innovator. Harvard Business Review 60: 95-105. Kaplan, E.L., Meier, P. 1958. Nonparametric estimation from incomplete observations. Journal of
the American Statistical Association 53: 457-481. Kaplan, R.E. 1984. Trade routes: The manager's network of relationships. Organizational Dynamics
Spring: 37-52. Katila, R., G. Ahuja. 2002. Something old, something new: A longitudinal study of search behavior
and new product introduction. Academy of Management Journal 45: 1183-94. Katz, R., Allen, T.J. 1982. Investigating the not invented here syndrome: A look at the performance,
tenure and communication patterns of 50 R&D project groups. R&D Management 12(1): 7-19.
Katz, R., Tushman, M. 1979. Communication patterns, project performance, and task characteristics: An empirical evaluation and integration in an R&D setting. Organizational Behavior and Human Performance 23: 139-162.
Kipnis, D., Schmidt, S.M., Wilkinson, I. 1980. Intraorganizational influence tactics: Explorations in getting one's way. Journal of Applied Psychology 65: 440-452.
Kirzner, I. M. 1973. Competition and Entrepreneurship. Chicago: University of Chicago Press Klein, J.P., Moeschberger, M.L. 2003. Survival Analysis: Techniques for censored and truncated
data. 2nd ed. New York: Springer. Kleinbaum, D.G., Klein, M. 2005. Survival analysis: A self-learning text. 2nd ed. New York:
Springer. Kogut, B. 1991. Country capabilities and the permeability of borders. Strategic Management
Journal 12: 33-47.
121
Kogut, B., Singh, H. 1988. The effect of national culture on the choice of entry mode. Journal of International Business Studies 19: 411-433.
Kostova, T. 1999. Transnational transfer of strategic organizational practices: A contextual perspective. Academy of Management Review 24(2): 308-324.
Krackhardt, D., Hanson, J.R. 1993. Informal networks: The company behind the chart. Harvard Business Review 71(4): 104-111.
Krugman, P. 1991. Increasing returns and economic geography. Journal of Political Economy 99: 483-499.
Kuemmerle, W. 1999. The drivers of foreign direct investment into research and development. Journal of International Business Studies 30(1): 1-24.
Lawrence, P. R., Lorsch, J. W. 1967. Differentiation and integration in complex organizations. Administrative Science Quarterly 12: 1-47.
Lazarus, R.S., Folkman, S: 1984. Stress, Appraisal, and Coping. New York: Springer. Lechner, C. 2005. A primer to strategy process research. Göttingen: Cuviellier Verlag. Leonard-Barton, D. 1992. Core capabilities and core rigidities: A paradox in managing new product
development. Strategic Management Journal 13: 111-125. Levinthal, D.A., March, J.G. 1993. The myopia of learning. Strategic Management Journal 14: 95-
112. Lewin, A.Y., Volberda, H.W. 1999. Prolegomena on coevolution: A framework for research on
strategy and new organisational forms. Organization Science 10(5): 519-534. Ling, Y., Floyd, S., Baldridge, D. 2005. Toward a model of issue-selling by subsidiary managers in
multinational organizations. Journal of International Business Studies 36: 637-654. Løvas, B., Ghoshal, S. 2000. Strategy as guided evolution. Strategic Management Journal 21: 875-
896. Lyles, M.A., Reger, R.K. 1993. Managing for autonomy in joint ventures: A longitudinal study of
upward influence. Journal of Management Studies 30(3): 383-404. Mantel, N., Haenszel, W. 1959. Statistical aspects of the analysis of data from retrospective studies
of disease. Journal of the National Cancer Institute 22: 719-748. March, J.G. 1991. Exploration and exploitation in organizational learning. Organization Science 2:
71-87. March, J.G. 1994. A primer on decision making. New York: Free Press. Markides, C., Williamson, P. 1994. Related diversification, core competencies and corporate
performance. Strategic Management Journal 15: 149-167. Martin, X., Mitchell, W. 1998. The influence of local search and performance heuristics on new
design introduction in a new product market. Research Policy 26: 753-771. McGrath, R.G. 2001. Exploratory learning, innovative capacity, and managerial oversight. Academy
of Management Journal 44: 118-131. McGrath, R.G., MacMillan, I.C., Venkataraman, S. 1995. Defining and developing competence: A
strategic process paradigm. Strategic Management Journal 16: 251-275. McGrath, R.G., Tsai, M., Venkataraman, S., MacMillan, I. 1996. Innovation, competitive advantage
and rent: A model and test. Management Science 42(3): 389-403. Medcof, J.W. 1997. A taxonomy of internationally dispersed technology units and its application to
management issues. R&D Management 27(4): 301-318. Medcof, J.W. 2001. Resource-based strategy and managerial power in networks of internationally
dispersed technology units. Strategic Management Journal 22: 999-1012. Mehra, A., Kilduff, M., Brass, D.J. 2001. The social networks of high and low self-monitors:
Implications for workplace performance. Administrative Science Quarterly 46(1): 121-146. Mintzberg, H. 1983. Power in and around organizations. Prentice-Hall, Englewood Cliffs, NJ. Mowday, R. 1978. The exercise of upward influence in organizations. Administrative Science
Quarterly 23: 137-156.
122
Mowery, D.C., 1998. The changing structure of the US national innovation system: Implications for international conflict and cooperation in R&D policy. Research Policy 27: 639-654.
Mudambi, R. 1999. MNE internal capital markets and subsidiary strategic independence. International Business Review 8(2): 197-211.
Narayanan, V.K., Fahey, L. 1982. The micropolitics of strategy formulation. Academy of Management Review 7: 25-34.
Nelson, R.R., Winter, S.G. 1982. An evolutionary theory of economic change. Cambridge, MA: Harvard University Press.
Nelson, W. 1972. Theory and applications of hazard plotting for censored failure data. Technometrics 14: 945-965.
Nerkar, A., Paruchuri, S. 2005. Evolution of R&D capabilities: The role of knowledge networks within a firm. Management Science 51(5), 771-785.
Nobel, R., Birkinshaw, J. 1998. Innovation in multinational corporations: Control and communication patterns in international R&D operations. Strategic Management Journal
19(5): 479-496. Nohria, N., Ghoshal, S. 1997. The differentiated network - organizing multinational corporations
for value creation. San Francisco: Jossey-Bass. Nonaka, I. 1994. A dynamic theory of organizational knowledge creation. Organization Science
5(1): 14-37. Nutt, P. 1987. Identifying and appraising how managers install strategy. Strategic Management
Journal 8: 1-14. Ocasio, W. 1997. Towards an attention-based view of the firm. Strategic Management Journal 18:
187-206. OECD (2002). Frascati Manual 2002. Paris: OECD. Patel, P., Pavitt, K. 1991. Large firms in the production of the world's technology: An important
case of 'non-globalisation'. Journal of International Business Studies 22(1): 1-21. Patel, P., Vega, M. 1999. Patterns of internationalisation of corporate technology: Location vs.
home country advantages. Research Policy 28: 145-155. Pearce, R. 1990. The internationalisation of research and development. London: Macmillan. Pearce, R. 1991. The globalization of R&D by TNCs. CTC Reporter 31: 13-16. Pearce, R:, Singh, S. 1992. Globalizing research and development. London: Macmillan. Penner-Hahn, J.D. 1998. Firm and environmental influences on mode and sequence of foreign
research and development activities. Strategic Management Journal 19: 149-168. Pentland, B. 1992. Organizing moves in software support hot lines. Administrative Science
Quarterly 37: 527-548. Perks, H., Jeffery, R. 2006. Global network configuration for innovation: A study of international
fibre innovation. R&D Management 36(1): 67-83. Perloff, R.M. 1993. The dynamics of persuasion. Erlbaum, Hillsdale, NY. Persaud, A. 2005. Enhancing synergistic innovative capability in multinational corporations: An
empirical investigation. Journal of Product Innovation Management 22: 412-429. Peto, R., Peto, J. 1972. Asymptotically efficient rank invariant test procedures (with discussion).
Journal of the Royal Statistical Society 135: 185-206. Petty, R.E., Cacioppo, J.T. 1986. Communication and persuasion: Central and peripheral routes to
attitude change. New York: Springer. Pfeffer, J. 1992. Managing with power: Politics and influence in organizations. Boston: Harvard
Business School Press. Piderit, S.K. 2000. Rethinking resistance and recognizing ambivalence: a multidimensional view of
attitudes toward an organizational change. Academy of Management Review 25(4): 783-794. Podolny, J.M. 1993. A status based model of market competition. American Journal of Sociology
98(4): 829-872.
123
Podolny, J.M., Stuart, T.E. 1995. A role-based ecology of technological change. American Journal of Sociology 100(5): 1224–1260.
Prentice, R.L. 1978. Linear rank tests with right-censored data. Biometrika 65: 167-179. Ragins, B.R., Sundstrom, E. 1989. Gender and power in organizations: A longitudinal perspective.
Psychological Bulletin 105: 51-88. Reger, G. 2004. Coordinating globally dispersed research centres of excellence: The case of Philips
electronics. Journal of International Management 10: 51-76. Reger, G. 1999. How R&D is coordinated in Japanese and European multinationals. R&D
Management 29(1): 71-88. Rogers, E. 1983. The diffusion of innovation. New York: The Free Press. Ronstadt, R.C. 1977. Research and Development abroad by U.S. Multinationals. New York:
Praeger. Roth, K., Morrison, A.J. 1992. Implementing global strategy: Characteristics of global subsidiary
mandates. Journal of International Business Studies 23(4): 715-736. Rugman, A. 2005. The regional multinationals. Cambridge University Press, Cambridge, UK. Rugman, A., Verbeke, A. 2003. Extending the theory of the multinational enterprise: Internalization
and strategic management perspectives. Journal of International Business Studies 34: 125-137.
Schelling, M.A., 1998. Strategic management of technological innovation. McGraw-Hill, New York.
Schilit, W.K., Locke, E.A. 1982. A study of upward influence in organizations. Administrative Science Quarterly 27: 304-316.
Schilit, W.K., Paine, F.T. 1987. An examination of the underlying dynamics of strategic decisions subject to upward influence activity. Journal of Management Studies 24: 161-187.
Schmaul B. 1995. Organisation und Erfolg internationaler Forschungs- und
Entwicklungseinheiten. Wiesbaden: Gabler. Schultz von Thun, F. 1998. Miteinander reden. Band 1: Störungen und Klärungen. 18th edition.
Reinbek bei Hamburg: Rowohlt Taschenbuch Verlag. Schwenk, C.R. 1984. Cognitive simplification processes in strategic decision making. Strategic
Management Journal 5(2): 111-128. Scott, R. 1995. Institutions and Organizations. Thousand Oaks, CA: Sage. Shannon, C.E. 1948. Mathematical theory of communication. Bell System Technical Journal 27,
379-423 and 623-656. Sidhu, J.S., Commandeur, H.R., Volberda, H.W. 2007. The multifaceted nature of exploration and
exploitation: Value of supply, demand, and spatial search for innovation. Organization Science 18: 20-38.
Simon, H.A. 1947. Administrative behavior: A study of decision-making in organizations. Chicago: MacMillan.
Simon, H.A. 1991. Organizations and Markets. Journal of Economic Perspectives 5: 25-44. Sitkin, S.B., Pablo, A.L. 1992. Reconceptualizing the determinants of risk behavior. Academy of
Management Review 17(1): 9-38. Smith, P.G. 1999. Managing risk as product development schedules shrink. Research Technology
Management 42(5): 25-32. Stata. 2005. Survival analysis and epidemiological tables. College Station, TX: Stata Press. Staw, B.M. 1975. Attribution of the 'causes' of performance: A general alternative interpretation of
cross-sectional research on organizations. Organizational Behavior and Human
Performance 13: 414-432. Stevenson, H. H., Jarillo, J.-C. 1990. A paradigm of entrepreneurship: Entrepreneurial management.
Strategic Management Journal 11: 17-27. Szulanski, G. 1996. Exploring internal stickiness: Impediments to the transfer of best practice
within the firm. Strategic Management Journal 17 (winter special issue): 27-43.
124
Taggart, J.H. 1998. Determinants of increasing R&D complexity in affiliates of manufacturing multinational corporations in the UK. R&D Management 28(2): 101-110.
Tarone, T.M., Ware, J.H. 1977. On distribution-free tests for equality of survival distributions. Biometrika 64: 156-160.
Turner, B.A. 1980. Exploring the industrial subculture. London: Macmillan. Tushman, M.L., Anderson, P. 1986. Technological discontinuities and organizational environments.
Administrative Science Quarterly 31: 439-465. UNCTAD United Nations Conference on Trade and Development. 2005. World Investment Report
2005: Transnational corporations and the internationalization of R&D. New York and Geneva: United Nations.
Uzzi, B. 1997. Social structure and competition in interfirm networks: the paradox of embeddedness. Administrative Science Quarterly 42: 35-67.
Van de Ven, A. 1986. Central problems in the management of innovation. Management Science 32: 590-607.
Verbeke, A (Ed.). 2005. Internationalization, international diversification, and the multinational enterprise. Elsevier: Oxford, UK.
Verbeke, A. Yuan, W. 2007. Entrepreneurship in multinational enterprises: A Penrosean perspective. Management International Review 47(2): 241-258.
Verbeke, A., Yuan, W. 2005. Subsidiary autonomous activities in multinational enterprises: A transaction cost perspective. Management International Review, special issue 2/2005, 31-52.
Von Zedtwitz, M., Gassmann, O. 2002. Market versus technology drive in R&D internationalization. Research Policy 31: 569-588.
Von Zedtwitz, M., Gassmann, O., Boutellier, R. 2004. Organizing global R&D: Challenges and dilemmas. Journal of International Management 10: 21-49.
Walker, G. 1985. Network position and cognition in a computer software firm. Administrative Science Quarterly 30: 103-130.
Walsh, J.P., Ungson, G.R. 1991. Organizational memory. Academy of Management Review 16: 57-91.
Watson, A., Wooldridge, B. 2005. Business unit manager influence on corporate-level strategy formulation. Journal of Managerial Issues 17(2): 147-161.
Wiener, N. 1986. Human use of human beings: Cybernetics and society. New York: Avon Books. Winter, S.G. 2000. The satisficing principle in capability learning. Strategic Management Journal
21: 981-996. Witte, E. 1973. Organisation für Innovationsentscheidungen. Göttingen. Xu, D., Shenkar, O. 2002. Institutional distance and the multinational enterprise. Academy of
Management Review 27(4): 608-618. Young, S., Tavares, A.T. 2004. Centralization and autonomy: Back to the future. International
Business Review 13(2): 215-237. Zaheer, S. 1995. Overcoming the liability of foreignness. Academy of Management Journal 38:
competence development. Entrepreneurship Theory and Practice 23(3): 169-189. Zander, I., 1999. How do you mean 'global'? An empirical investigation of innovation networks in
the multinational cooperation. Research Policy 28: 195-214. Zollo, M., Winter, S.G. 2002. Deliberate learning and the evolution of dynamic capabilities.
Organization Science 13: 339-351.
125
Marcus Matthias Keupp Education
2004-2008 Doctoral student in business administration University of St. Gallen 2000-2001 Graduate student in international business and finance University of Warwick, Warwick Business School 1997-2003 Undergraduate and graduate studies University of Mannheim Work experience
2004-2007 Research Associate at the Institute of Technology Management, University of St. Gallen
2002 German Diplomatic Service at Bangkok and Wellington embassies 1999-2004 Industry internships during and after studies in various industries