N 2 Fixation and Rhizosphere Ecology of Aspalathus line'1:is subsp. linearis (Rooibos tea) by Mmboneni Leonard Muotbe Botany Department University of Cape Town September 1997 Presented for the Degree of Master of Science
Transcript
N 2
Fixation and Rhizosphere Ecology of Aspalathus line'1:is
subsp. linearis (Rooibos tea)
by
Mmboneni Leonard Muotbe
Botany Department
University of Cape Town
September 1997
Presented for the Degree of Master of Science
The copyright of this thesis vests in the author. No quotation from it or information derived from it is to be published without full acknowledgement of the source. The thesis is to be used for private study or non-commercial research purposes only.
Published by the University of Cape Town (UCT) in terms of the non-exclusive license granted to UCT by the author.
Contents
Acknowledgements
Abstract
Chapter 1: General Introduction
1.1 Economic Importance of Asptdathus linearis
subsp. linearis
1.2 Ecological Constraints to Increased Yields of
Asptdathus linearis subsp. linearis as Tea
1.2.1 Biological Factors
1.2.2 Soil Factors
1.2.3 Rhizosphere Effects
Chapter 2: General Materials and Methods
2.1 Plant Culture
2.11 Plant Nutrient Solutions
2.12 Plant Growth in Sand
2.1. 3 Plant Growth in Potted Clanwilliam Soil
2.1.4 Plant Growth in Modified Leonard Jar Assemblies
vii
viii
1
l
2
5
8
11
15
15
15
15
16
17
11
2.2 Soils 20
2.2.1 Collection of Field Soil for pH Measurements 20
2.2.2 Collection of Soil for Use as Inocula 21
2.2.3 Fertilizer Application to Field Soil 21
2.3 Plant and Soil Analysis 23
2. 3 .1 Soil Organic Matter Content 23
2.3.2 Total Nitrogen Determination by Kjeldahl Method 23
2.3.4 Determination of Total and Plant-Available Phosphorus 24
2.3.5 1sN/14N Isotopic Determinations for Measuring N2 Fixation 26
2.3.5.1 1sN Natural Abundance Technique 26
2.3.5.2 1sN Dilution Method 28
2.3.6 Leaf Chlorophyll Determination 29
2.4 Bacterial Cultures 30
2.4.1 Bradyrhizobium Isolation from Root Nodules 30
2.4.2 Preparation of Bacterial Cultures and Measurement of
Cell Growth
2.5 Statistical Analysis
Chapter 3: Symbiotic response of Asptdathus linearis subsp.
linearis (Rooibos tea) Plant to Nutrition Under
Glasshouse Conditions.
3.1 Introduction
31
32
33
33
3.2 Material and Methods
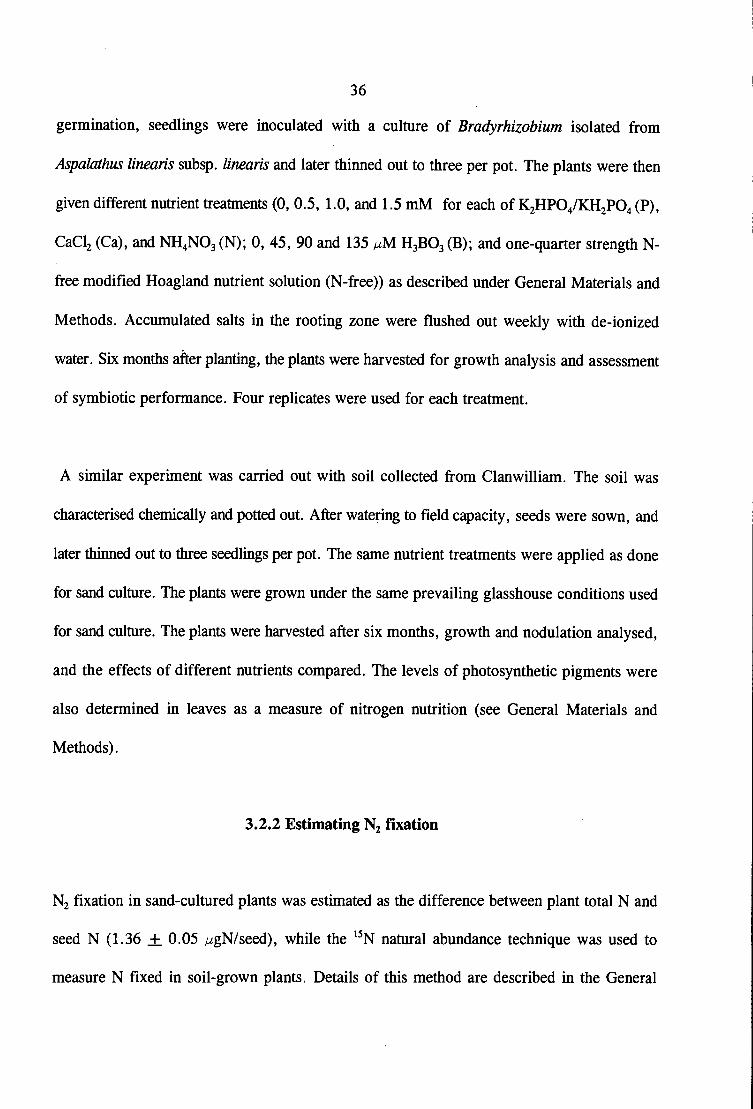
3.2.1 Plant Culture in Sand and Soil
3.2.2 Estimating N2 Fixation
32.3 Plant Culture in Leonard Jars
3.2.4 Statistical Analysis
3.3 Results
3. 3. 1 Soil Analysis
111
3.3.2 Nutrient Effects on Photosynthetic Pigments
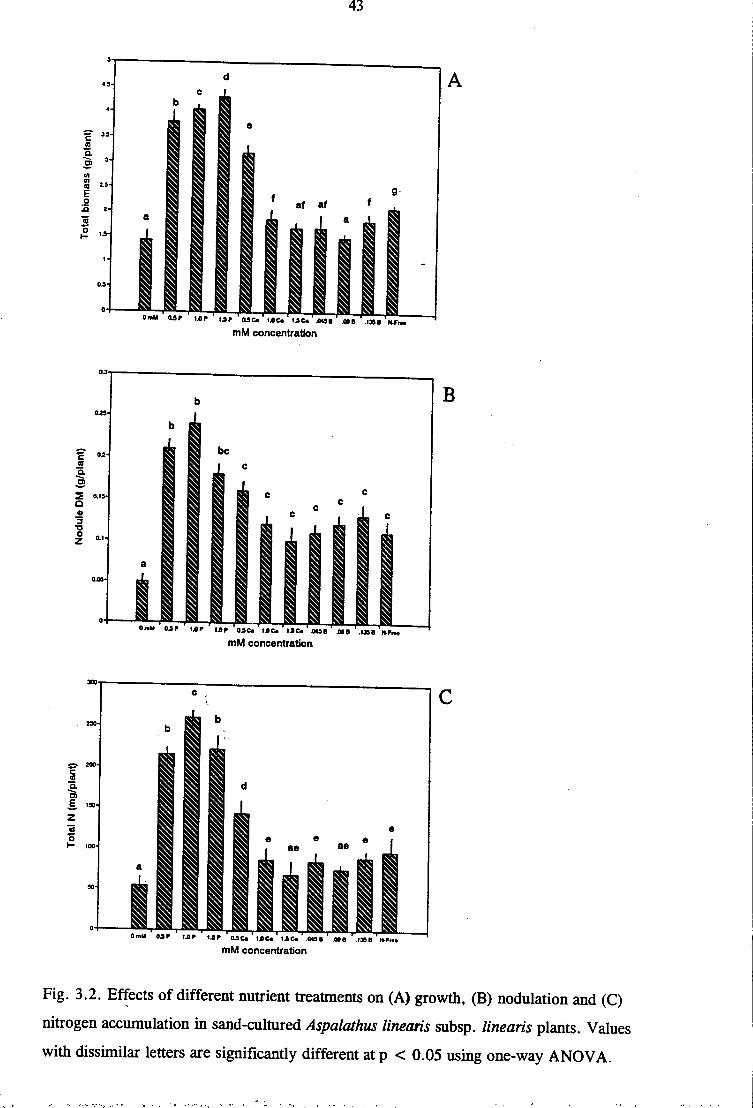
3. 3. 3 Effects of Nutrients on Growth
3.3.4 Nutrient Effects on Nodulation
3.3.5 Effects of Nutrient Supply on Total N and Fixed N
Content of Legumes
3.3.6 Nodulation Response of Aspalathus linearis subsp.
linearis to Inoculation with Different Soils
3.4 Discussion
3.4.1 Growth and Symbiotic Response of A. linearis subsp.
linearis to Nutrient Supply
3.4.2 Expanding Rooibos Tea Cultivation Beyond the Cedarberg
Region
35
35
36
37
38
38
38
38
39
39
40
41
so
50
54
IV
Chapter 4: Estimates of N2 Fixation in Aspalathus linearis subsp.
linearis Using 15N Natural Abundance and 15N Dilution
Techniques.
4.1 Introduction
4.2 Materials and Methods
4.2.1 Experiment I: Assessing the Symbiotic Dependence of
Aspalathus linearis subsp. linearis on Different No3•
Regimes in the Glasshouse
4.2.2 Experiment II: On-farm Determination of the Effects of
N, P, and Ca Application on N2 Fixation in the Legume
Using 15N Natural Abundance
4.2.3 Experiment 3: Effects of Plant Age on N2 Fixation of
Field-Grown Aspalathus linearis subsp. linearis Using
15N Natural Abundance
4.3 Results
4.3.1 Plant Growth and Symbiotic response to N03• in Glasshouse
Study Using 15N Dilution
56
56
58
58
59
60
61
61
4.3.2 Effects of Fertilization on Growth and N2 Fixation in Field Plants 61
4.3.3 Effects of Age on Growth and N2 Fixation in the Field
4.4 Discussion
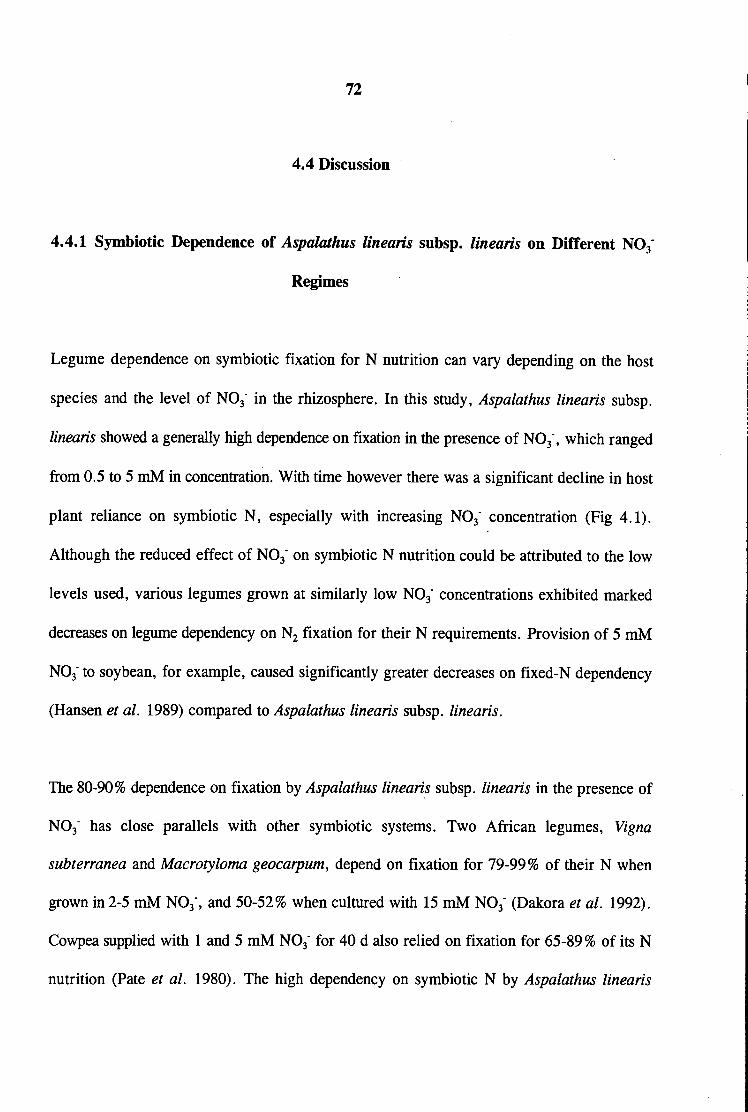
4. 4. 1 Symbiotic Dependance of Aspalathus linearis subsp. linearis
62
72
v
on Different N03- Regimes
4.4.2 Symbiotic Nitrogen Nutrition of Aspalathus linearis subsp.
linearis in the Field
Chapter 5: Nodulation Specific Elevation of Rhizosphere pH by
72
74
Aspalathus linearis subsp. linearis 77
5. 1 Introduction 77
5. 2 Materials and Methods 78
5.2.1 Initial Rhizosphere pH Experiments in the Glasshouse 78
5.2.2 Rhizosphere pH Experiments in the Field 79
5.2.3 Effects of Inoculation and Nitrate Supply on Rhizosphere pH 80
5.2.4 Measurements of pH in Soil and Root Exudates 81
5.2.5 Estimation of Alkalinity in Root Exudates 82
5. 2. 6 Statistical Analysis 82
5.3 Results 82
5. 3 .1 Glasshouse Studies of Rhizosphere pH in Aspalathus linearis
subsp. linearis 82
5.3.2 Field Measurements of Rhizosphere in Aspalathus linearis
subsp. linearis · 83
5.3.3 Field Measurements of Rhizosphere in Six Non-Legume Species 83
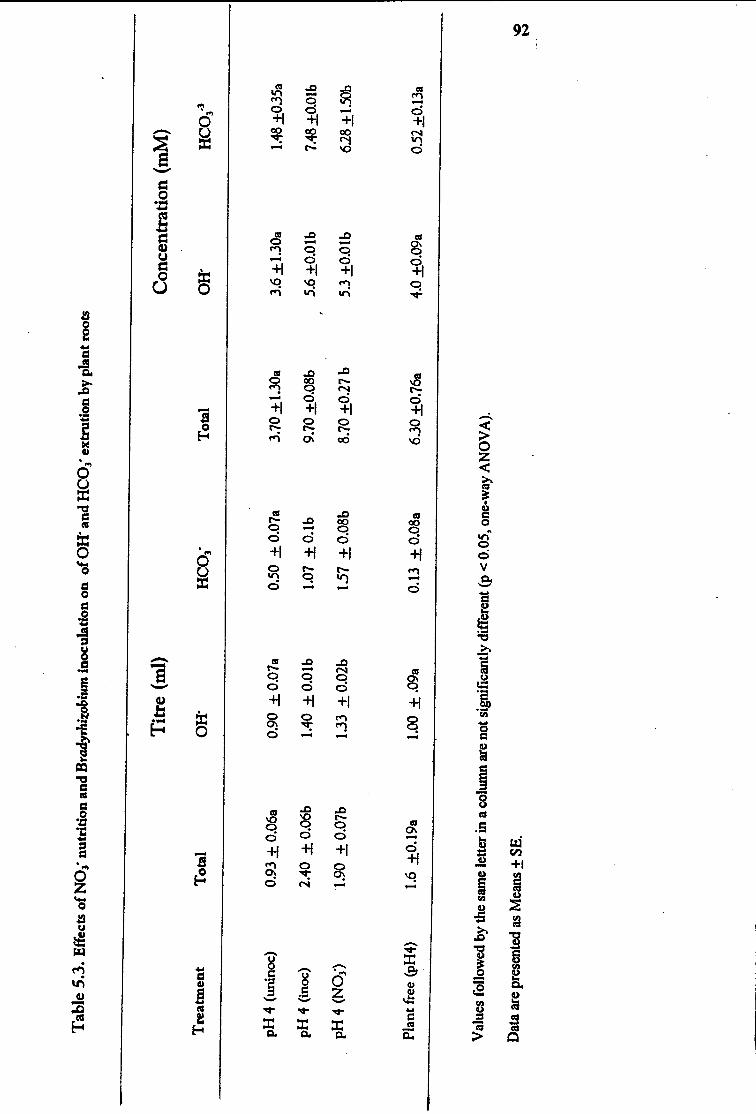
5.3.4 Nitrate Supply and Bradyrhiwbium Effects in Rhizosphere
pH of Aspalathus linearis subsp. linearis
5 .4 Discussion
84
93
VI
Chapter 6: Low pH Tolerance and Adaptive Response of Bradyrhizobial
Isolates from Aspalathus spp. and Amphithalea ericif olia
in the Western Cape
6.1 Introduction
6.2 Materials and Methods
6.2.1 Isolation of Bradyrhiwbium Cells from Root Nodules
6.2.2 Experiment I: Assessing Acid Tolerance of Indigenous
Bradyrhizobial Strains
6.2.3 Experiment II: Determining the Adaptive Response of
Indigenous Bradyrhizobia to Low pH
6.2.4 Experiment III: Testing Growth Effects of Aspalathus
linearis subsp. linearis Root Extracts on Bradyrhizobial
at Low pH
6.3 Results
99
99
100
100
101
101
102
102
6.3.1 Low pH Tolerance of Native Bradyrhizobia 102
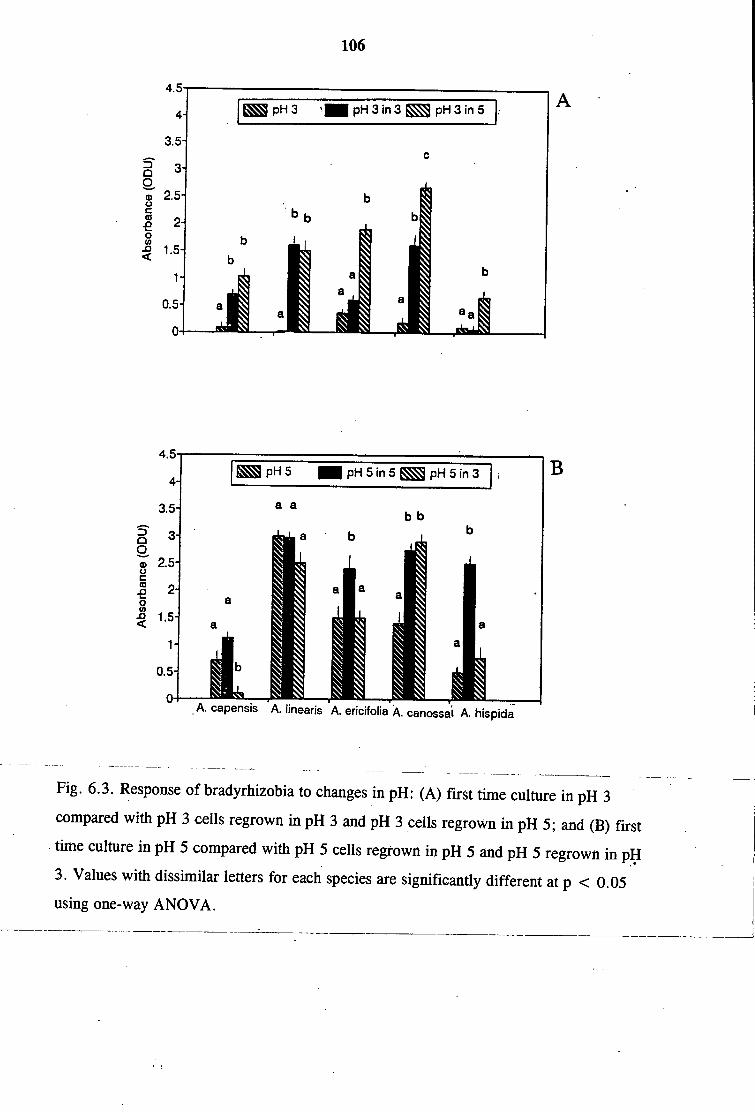
6.3.2 Adaptive Response of Bradyrhizobial Isolates to Low pH 103
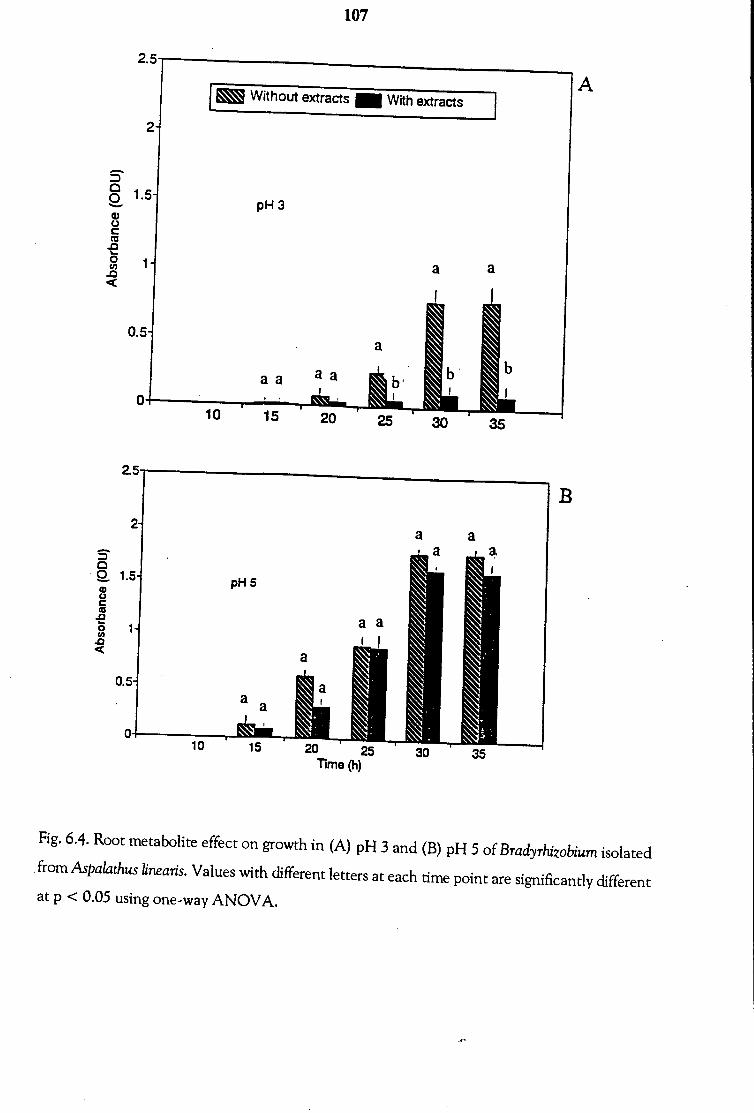
6.3.3 Effects of Root Metabolites on Bradyrhizobial Growth
at Low pH 103
6.4 Discussions 108
6.5 Conclusions 110
Chapter 7: General Discussion and Conclusions 111
vii
References 117
Appendix 139
Vlll
Acknowledgements
I am grateful to Dr. Felix D. Da.kora, my supervisor for his assistance, encouragement, and
considerable patience during the course of this study. His advisory comments and support both
in the laboratory and in the field were inestimable.
Special thanks to Mr Willie Nel who generously made his Rooibos tea farms available for field
experimentation. The Rooibos Tea. Board is thanked for its assistance with valuable information
regarding Rooibos tea farming.
I thank Takie Masutha and Martin Nelwamondo for their assistance with glasshouse, lab work,
and their perseverance on field trips that required hard labour. Special thanks to Karen
Wienand, Gonzalo Aguilar, Henry Botha, Desmond Barnes, Joey Jacobs, Raymond Carelse,
and Robert Jacobs for their assistance and technical advice in the field, glasshouse and
laboratory. Terry Trinder-Smith is thanked for his help in identifying fynbos species. I also
thank my brothers Mashudu, A vhammboni, Takalani and Vho-Sam for their immense support
and encouragement. The thesis is dedicated to my Mum and Dad, Vho-Khavhatondwi
Tshinakaho Grace and Vho-Jim Muothe Ravuluvulu.
I am grateful to UCT for the award of a Mellon Fellowship and to the Foundation for Research
Development and the URC, University of Cape Town for supporting the running costs of my
project through funds awarded to my supervisor, Dr. F. D. Dakora.
IX
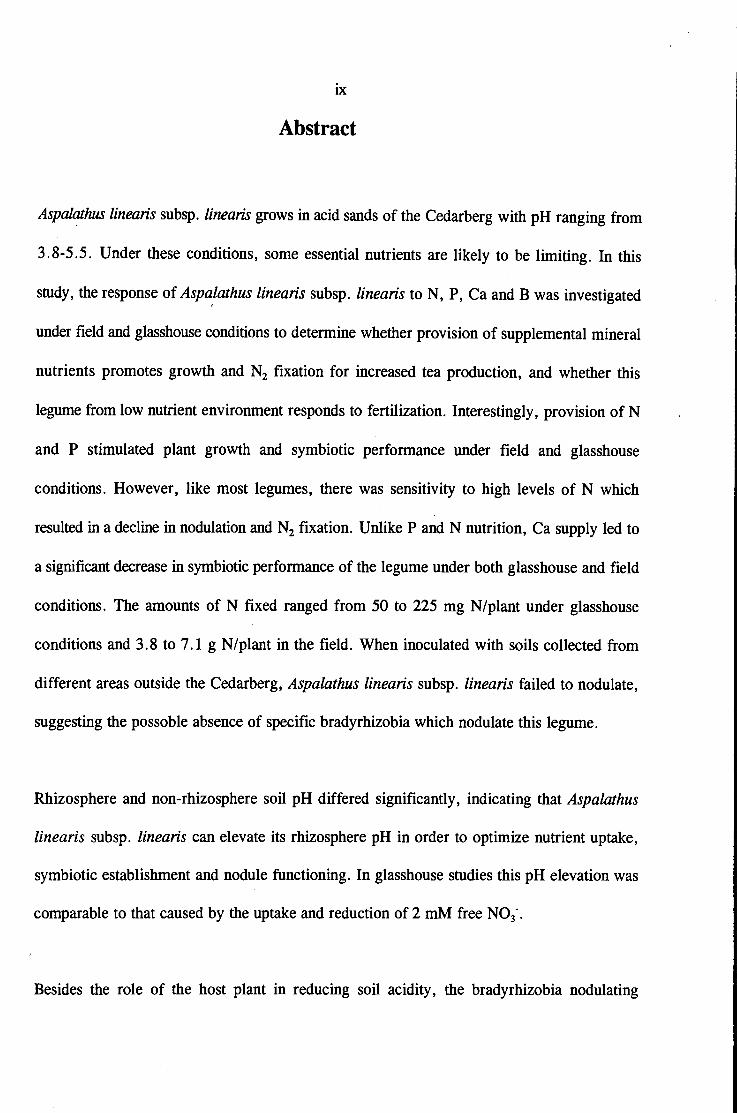
Abstract
Aspalathus linearis subsp. linearis grows in acid sands of the Cedarberg with pH ranging from
3.8-5.5. Under these conditions:, some essential nutrients are likely to be limiting. In this
study, the response of Aspalathus linearis subsp. linearis to N, P, Ca and B was investigated I
under field and glasshouse conditions to determine whether provision of supplemental mineral
nutrients promotes growth and N2 fixation for increased tea production, and whether this
legume from low nutrient environment responds to fertilization. Interestingly, provision of N
and P stimulated plant growth and symbiotic performance under field and glasshouse
conditions. However, like most legumes, there was sensitivity to high levels of N which
resulted in a decline in nodulation and N2 fixation. Unlike P and N nutrition, Ca supply led to
a significant decrease in symbiotic performance of the legume under both glasshouse and field
conditions. The amounts of N fixed ranged from 50 to 225 mg N/plant under glasshouse
conditions and 3.8 to 7.1 g N/plant in the field. When inoculated with soils collected from
different areas outside the Cedarberg, Aspalathus linearis subsp. linearis failed to nodulate,
suggesting the possoble absence of specific bradyrhizobia which nodulate this legume.
Rhizosphere and non-rhizosphere soil pH differed significantly, indicating that Aspalathus
linearis subsp. linearis can elevate its rhizosphere pH in order to optimize nutrient uptake,
symbiotic establishment and nodule functioning. In glasshouse studies this pH elevation was
comparable to that caused by the uptake and reduction of 2 mM free N03".
Besides the role of the host plant in reducing soil acidity, the bradyrhizobia nodulating
x
Aspalathus linearis subsp. linearis and other fynbos legumes are also highly tolerant. These'
isolates were capable of surviving at pH 3 and forming effective nodules at pH 4. Taken
together, the results of this study suggest that Rooibos tea production can be enhanced with P
and N fertilization and that growth, nodulation and N2 fixation in Rooibos tea plants is not
limited by soil acidity.
1
Chapter 1
General Introduction
The fynbos is home to many N2-fixing legumes, with the genus Aspalathus alone containing
some 245 species from three subgenera (Dahlgren 1968). Aspalathus linearis subsp. linearis
(Burm. Fil.) R. Dahlgr is one of the few economic legumes in the fynbos that has become a
cultivated crop. The species can grow up to 1.5 m high, and is fairly drought resistant,
probably obtaining most of its water from deep capture by means of its long taproot (up to 2
m below ground). There are four naturally occurring forms of this plant: Rooi Tea (red
tea),Vaal Tea, Swart Tea (Black tea), and Rooibruin Tea. The Rooi tea is subdivided into two
types, the Nortier which has been selected, improved and cultivated; and the Cedarberg which
is similar but has broader and coarser leaves, and grows wild in the Cedarberg mountains.
Aspalathus linearis subsp. linearis has a very limited distribution; it grows only in the Cape
Province, especially in the Cedarberg mountains anP, similar higher areas of the Northern
Cape (Morton 1983). Seedlings are sensitive to frost and snow, but mature plants are adapted
to both cold winters and hot summers (Morton 1983).
1.1 Economic importance of Aspa/.athus linearis subsp. linearis
Use of the wild plant by the Hottentots for tea was first reported by the botanist Carl
2
Thurnberg in 1772 and this led to its domestication and cultivation by the early settlers
(Morton 1983). With a high demand for the tea world-wide, total land cropped to the legume
has increased with time (Fig. 1.1) with a corresponding rise in production (Fig. 1.2). Current
projections indicate that by the year 2000, both total land under tea cultivation and quantity
of tea produced will have doubled (Figs. 1.1 and 1.2).
Compared to oriental tea, Rooibos tea is a caffeine-free beverage with significant medicinal
value. It is often prescribed against nervous tension, allergies and various stomach and
indigestive problems (Petereit et al. 1991). The tea is low in tannins (Morton 1983) and has . .
been suggested to have anti-ageing effects because of its high content of anti-oxidants
(Yoshikawa et al. 1990). Rooibos tea also contains various flavonoids, including quercitrin
and luteolin (which have anti-spasmodic properties (Snyckers and Salemi 1974)), aspalatin (a
dihydroxychalcone) and the flavones orientin and iso-orientin, which together account for its
flavour and anti-oxidant effects (Robak and Gryglawski 1988). Rooibos tea is therefore a
natural medicinal beverage. However, its increased production is constrained by many factors.
1.2 Constraints to Production of Aspal.athus linearis subsp. linearis as Tea
As with most agricultural crops, Rooibos tea yields are constrained by many environmental
factors, such as the chemical, physical and biological components of soil.
Fig 1.2. Annual Rooibos tea production (Landbou Weekblad, 1996).
5
1.2.1 Biological Factors
Plant roots, their associated microflora and the microfauna constitute the major biological
factors in soil which can affect Rooibos tea production. The association between plant roots
and microoganisms in soil can be beneficial, harmful or neutral (Lych 1990; Marschner 1995).
Examples of beneficial interactions in soil include the legumel(Brady)rhizabium symbiosis and
vesicular-arbuscular mycorrhizal (V AM) infections. In most natural and agricultural
ecosystems, these two associatiofils improve the nitrogen and phosphorus nutrition of plants
(Marschner 1995). Like other legumes, the productivity of Aspalathus linearis subsp. linearis
is determined by its effective nodulation and N2 fixation, which in turn depend on the
interaction of the bacterium with its host, and the influence of the external environment. The
soil bacteria that nodulate Rooibos tea plants are species of the slow-growing Bradyrhizabium
genus (Staphorst and Strijdom 1975), similar to those which nodulate cowpea.
Various studies (Staphorst and Strijdom 1975; Deschodt and Strijdom 1976; Marumo 1996)
have shown that members of the genus Aspalathus are specific in their Bradyrhizabium
requirements. Although Aspalathus linearis subsp. linearis can nodulate with bradyrhizobia
isolated from Aspalathus cordata, A. divaricata, A. bijlora, and A. hispida (Staphorst and
Strijdom 1975), no effective nodules were formed when 15 bacterial isolates from 14 other
legumes were used to inoculate the species (Deschodt and Strijdom 1976), indicating host
strain specificity. Thus the absence of the appropriate bacterial strain even within the Cape
region could constrain nodulation and growth of Aspalathus linearis subsp. linearis. To expand
the cultivation of Rooibos tea beyond the Cape region would therefore require testing for the
6
presence of the relevant homologous bacteria in those soils. If found absent, an inoculant strain
would have to be used to promote nodulation.
So far, however, little is known about the bradyrhizobia that nodulate Rooibos tea plants,
whether in relation to their distribution, and/or factors that affect their symbiotic performance.
Whatever the case, the poor nitrogen status of the Cedarberg soils would suggest that Rooibos
tea plants probably meet a significant proportion of their nitrogen nutrition from symbiotic
fixation.
Besides N2 fixation, another important symbiotic association that affects legume plant growth
in the fynbos is VA mycorrhizal infection. Mycorrhizal fungi infect plant roots and provide
an intimate link between the soil environment and the functional nutrient-absorbing system of
the plant (Reid 1990). In legumes, growth stimulation by VA fungi can improve plant nutrition
and indirectly promote increased nodulation and N2 fixation (Marschner 1995). Mycorrhizal
infections of roots have been found to also enhance the host plant's water and nutrient uptake,
especially phosphorus and nitrogen. Apparently, the mycorrhizal roots exude chelating acids
which promote phosphorus nutrition (Tinker 1975). In some plants, growth increases of up to
100-fold have been obtained with infection by VA fungi (Marschner 1995). Although
mycorrhizal infections can improve P uptake from insoluble phosphate compounds, they are
ineffective in providing additional phosphorus if endogenous soil phosphorus levels are already
high. Another contribution of VA mycorrhizae to plant growth is their ability to protect plants
from pathogens while improving microbial colonization of roots through provision of carbon
(Curl and Truelove 1986). Mycorrhizal infections of some Aspalathus species have been
L----~-----------~
7
reported by Hoffman and Mitchell (1986) and Allsop and Stock (1993). However, little has
been documented on the role of V AM in phosphorus and nitrogen nutrition of the species as
well as its water relations. It is therefore unclear what contribution they make to overall plant
growth in Aspalathus linearis subsp. linearis.
In addition to mutualistic symbionts, the soil also harbours many bacterial and fungal
pathogens which directly affect plant health. Seedlings of Aspalathus linearis subsp. linearis
suffer a great deal of mortality as a consequence of fungal infections (RTC 1993). Some of
the fungal species identified which commonly cause seedling mortality and great economic loss
to Rooibos tea farmers in the Cedarberg area include Macrophormina phaseolina,
Neocosmospora vasinfecta, Pythium spp. and Rhizoctonia. Some fungal pathogens such as
Fusarium oxysporum, F. solani and Phomopsis, infect both seedlings and adult plants, and are
the main cause of their death (Lamprecht pers. com). Damping- off and "red leaf" are
characteristic symptoms of fungal pathogens infection of Rooibos tea plants. Some of these
fungal pathogens also infect other leguminous crops in the Cape region such as Medicago
sativa L. and some annual Medicago species (Lamprecht et al. 1988; Denman 1992).
Although bacterial species are also be involved in seedling mortality of various plants, these
have not yet been documented for Aspalathus linearis subsp. linearis. Field observations also
show that many Rooibos tea plants die at the age of 4 or 5 years; and by the 6th year, there
is almost 100 % mortality. Whether this death of old plants under both farm and natural
conditions is due to soil-borne pathogens, remains to be determined. It has been suggested that
fungal pathogens which lie dormant in soils are activated into growth when plant roots exude
8
growth-stimulating chemical compounds into the soil (Curl and Truelove 1986). Whether roots
of Rooibos tea plants release flavonoids and other compounds into the soil which stimulate
growth of fungal pathogens, and lead to root infection and plant death, is yet to be examined.
1.2.2 Soil Factors
The fynbos is characterized by winter rainfall, summer drought, and nutrient-poor acid soils
of Table Mountain sandstone origin (Morton 1983). A variety of individual chemical stresses
and their interactions can operate in these soils to limit plant growth. Soil acidity constrains
plant productivity in about 25% of the world's agricultural soils and its correction with lime
has been proved to be an expensive agricultural process (Munns 1986). In the Clanwilliam
area, where Rooibos tea is cultivated, soil pH ranges from 4.5 - 5.5 (Morton 1983), or even
lower. Thus, at such low pHs, growth of plants is likely to be constrained by a number of
factors including nutrient deficiencies and toxicities (Marschner 1993).
In the fynbos, nitrogen and phosphorus have been suggested to be the most likely to limit plant
growth and productivity (Stock and Allsopp 1992). Total soil nitrogen is less than 0.1 %, total
phosphorus 0.02 % , and total exchangeable cations, about 5 meq /100 g (Specht and Moll,
1983). Besides nitrogen and phosphorus, other nutrients also play an important role in plant
growth processes; their absence or low supply can affect plant growth. Excessive levels of free
and exchangeable aluminium and mangansese, and/or deficiencies of phosphorus, calcium,
magnesium and micronutrients such as molybdenum, which typify low pH soils, inhibit plant
growth.
9
Past studies on nutritional physiology have focussed mainly on agricultural species and their :
cultivars which do well on highly fertile soils. Consequently, our understanding of how plants
from nutrient-poor soils behave in response to fertilization has remained limited. Although
these plants from nutrient-poor soils may be genetically or physiologically adjusted to cope
with low nutrient supply, increasing the soil nutrient pool through fertilization could promote
growth rate. However, a study on the fynbos species Leucospermum parile and Phylica
cephalantha showed only a small increase in shoot growth with N fertilization during the first
growing season, while P supply decreased growth in both species (Witkowski 1988).
Similarly, the shrubs, Protea repens, and Erica pluckenetii showed differing responses to
fertilization (Lamb and Klaussner, 1988). Erica pluckenetii responded positively to phosphorus
supply but not to nitrogen, which had a negative effect on overall plant growth. But a
combined application of the two nutrients produced a marked increase in growth of E.
pluckenetii while vegetative growth declined with fertilization of P. repens (Lamb and
Klaussner 1988). An increase in shoot and root dry mass was observed in Leucospermun parile
exposed to Long Ashton's solution (Abraham (1988). This findings clearly indicate that no
generalizations can be made regarding the response of nutrient-poor plants to fertilizer
application. However, Rooibos tea has become such an important commercial crop for the
country that the need to explore its increased productivity through research is absolutely
essential.
A recent study (Dakora and Keya 1997) has indicated that soils, which suffer from nutrient
imbalances, can alter. significantly the symbiotic performance of field-grown legumes.
However, whether current rates of N2 fixation in Aspalathus linearis subsp. linearis are
10
affected by nutrient imbalances, remains to be determined. It is also unclear whether there is
any direct relationship between N2 fixation and tea yield in Aspalathus linearis subsp. linearis.
If there is, then studies on factors which limit symbiotic N2 fixation are likely to promote
increased Rooibos tea production.
Soil chemical factors can also determine plant growth and distribution in natural ecosystems.
Consequently, plant species can be classified in terms of their distribution in soils; for
example, some plant species may be acidophiles; calcifuges, calcicoles, halophytes or
glycophytes, while others are metallophytes (Marschner 1995). The cultivation of Aspalathus
linearis subsp. linearis is confined to the Cedarberg region and this raises questions as to what
factors are limiting its cultivation to that part of the Cape. Whether these are climate, soil or
water related, remains to be seen.
In the Cedarberg, water availability could be a major problem affecting productivity of plants,
especially in N2 fixing legumes. In general, water potentials near field capacity are optimal for
nodulation and N2 fixation in legumes. However, a water deficit of only 2.5 bars can
significantly reduce fixation (Graham 1984). Besides, soil populations of Bradyrhiwbium are
more persistent under conditions of moisture deficit than Rhiwbium species due to the ability
of the former to maintain a lower internal water content than the latter (Robson and Bottomley
1991), indicating bacterial differences in drought resistance .
Nodulation in Rooibos tea is profuse during winter when there is adequate soil moisture from
rainfall and low in summer because of drought. In fact, nodulation and fixation are not only
11
limited at this stage by drought, but also by nodule senescence as a consequence of drought.
Interestingly, field observation suggest that Rooibos tea plants grow better during the dry
summer season than winter possibly due to increased availability of light for photosynthesis.
However, they probably do so by relying on deep water capture achieved by means of their
long extended taproot system (2 m long in 1-2 yr old plants).
1.2.3 Rhizosphere Effects
The "rhizosphere", often defined as a narrow zone of soil under the influence of living roots,
is characterized by leakage or exudation of chemical substances that affect microbial activity
(Curl and Truelove 1986). Activity in the rhizosphere environment is therefore biologically
determined by the interaction of the soil, the plant and the microorganisms associated with the
plant roots. With N2 fixing plants, the rhizosphere is an exciting but complex zone to study.
These nodulating plants rel~ase various phenolic compounds that promote bacterial and fungal
growth, cause chemoattraction of microbes to legume roots, and transcribe nod genes in
symbiotic rhizobia and bradyrhizobia (Dakora and Phillips 1996). However, other compounds
are also released which inhibit nod gene expression and/or fungal spore germination during
the establishment of bacterial and fungal symbioses (Dakora and Phillips 1996). Thus,
survival of V AM and bradyrhizobial symbionts in the rhizosphere, their multiplication,
subsequent infection of the host plant and growth of the host plant itself are strongly governed
by the rhizosphere interactions. The extent of these interactions can be altered if another stress
factor exists in the soil environment. Acid stress, for example, affects rhizobial survival and
multiplication in the rhizosphere, and can alter root infection, nodule formation and N2 fixation
12
in the host plant (Lie 1969; Lie 1974; and Munns 1977; Glenn and Dilworth 1991; Glenn and
Dilworth 1994; Tiwari et al. 1996a, b). However, studies by various workers (Lindstrom et
al. 1985) show that acid-tolerant rhizobia and bradyrhizobia do exist, and the ability of these
strains to survive low pH is determined by acid-tolerant genes (Glenn and Dilworth 1991). The
bradyrhizobial strains which nodulate Rooibos tea plants in acid soils (pH 3.8-5.5) must
harbour similar genes which regulate bacterial survival under such conditions of high acidity.
Plants adapted to acid soils such as those used for cultivation of Aspalathus linearis subsp.
linearis employ a variety of rhizosphere mechanisms to cope with adverse chemical factors.
These mechanisms are either regulated separately (e.g. those of manganese and aluminium
tolerance) where different plant parts employ different mechanisms in dealing with toxicity of
these elements (Marschner 1995), or interactively (e.g. those of aluminium tolerance and
phosphorus acquisition) where aluminium tolerance is related to the ability of plants to utilize
phosphorus in the presence of aluminium (Freire 1984). The roots of some plants release
organic compounds which modify the rhizosphere's chemical environment, including pH (Curl
and Truelove 1986; Jungk 1991). Certain species adapted to low pH soils are therefore likely
to chemically modify their rhizosphere pHs to levels high enough for optimizing beneficial
rhizosphere interactions such as nodule formation with rhizobia. Whether Rooibos tea plants
operate in this way to cope with high acidity is yet to be studied.
It is evident from most studies (Curl and Truelove 1986; Jungk 1991; Marschner 1995) that
interactions at the rhizosphere level between the soil, its microflora and fauna, and the plant
have a tremendous effect on plant nutrition through root-exudate solubilization of insoluble
13
compounds, and control of pathogen populations. Rhizosphere pH also has an effect on the
release of nod gene-inducing flavonoids by legumes. Studies with subterranean clover indicate
that the nod gene-inducing activity of root exudates decreased when seedlings were grown in
solution culture below pH 5 (Richardson et al. 1988). However, with acid-tolerant legumes,
nod gene induction by root exudates remains unaffected by pH (Howieson et al. 1992a,b).
Some plants are also able to use organic acids in their root exudates to overcome toxicities
associated with extreme acidity. Similar mechanisms have evolved in plants for adapting to
nitrogen-limited ecosystems similar to the fynbos. An example of such a chemical exuded by
plant roots is the aluminium-complexing citric acid which provides protection against harmful
effects of free aluminium in highly acidic soils while serving to improve phosphorus
acquisition (Marschner 1995). The non-mycorrhizal artic sedge (Eriophorum vaginatum)
utilizes organic nitrogen either from hydrolysing proteins or from direct uptake of amino acids;
and these accounts for about 60% of its nitrogen requirements (Chapin et al. 1993).
Roots of several crop plants growing under phosphorus-deficient soils have been reported to
also secrete acid phosphatases into the rhizosphere for hydrolysing organic phoshorus
compounds into the inorganic form for uptake by plants (Hausling and Marschner 1989). Since
Aspalathus linearis subsp. linearis grows naturally in acid soils characterized by nitrogen and
phosphorus deficiency, it would be interesting to know what mechanisms the plant uses to
enhance nutrient uptake.
In this study, Chapter 3 examines the response of Aspalathus linearis subsp. linearis to
14
nutrient supply under glasshouse conditions.
Chapter 4 similarly assesses symbiotic response to fertilization under field conditions.
Chapter 5 investigates the role of legume root exudates in modifying the rhizosphere pH
for symbiotic establishment.
Chapter 6 examines acid tolerance in bradyrhizobia from legumes indigenous to the Cape.
15
Chapter 2
General Materials and Methods
2.1 Plant Culture
2.1.1 Plant Nutrient Solutions
All plant cultures in the glasshouse received nutrients either as modified Hoagland nutrient
solution or micromolar to millimolar concentrations of single nutrient elements. Nutrient
solutions were routinely prepared in de-ionised water using the protocol of Hoagland (Hewitt
1966; see Appendix 2A). Concentrations of CaC12 (Ca), KH2P04'K2HP04 (P) and NH4N03
(N) used in this study included 0, 0.5, 1.0 and 1.5 mM, together with three levels of H3B03
(B) namely 45, 90 and 135 µM. For 15N enriched experiments, the nutrient solution was
adjusted to contain different concentrations of nitrate with differing levels of 15N label. This
was achieved by using 99 atom percent K15N03 and KN03 (0.366% 15N natural abundance).
The concentrations of nitrate used were 0.5, 1.0, 2.0, and 5 mM containing 20, 10, 5 and 2
atom % 15N respectively.
2.1.2 Plant Growth in Sand
Sand purchased from Consol Industrial Minerals in Athlone, Cape Town, was potted into
freely-draining 3 L pots. The sand-filled pots were then watered to field capacity and sown
16
with scarified seeds of Aspalathus linearis subsp. linearis (Burm, f.) R. Dahlgr. obtained from
the Rooibos Tea Company in Clanwilliam. After germination, seedlings were inoculated with
aliquots of nodule macerate from field-grown plants of Aspalathus linearis subsp. linearis to
promote nodulation. The macerate was prepared by squashing washed nodules collected from
field grown Aspalathus linearis subsp. linearis plants in Clanwilliam in 250 ml sterile distilled
water using a pestle and mortar. About 50 ml aliquot of the broth was then applied to
seedlings. Three weeks after germination, the seedlings were thinned out to three per pot and
the different nutrient treatments imposed. Each pot received 300 ml of the treatment nutrient
solution three times a week. The plants were then left to grow in the glasshouse at 28115 °C
day/night temperature. After 6 months, the plants were harvested and separated into shoots,
roots and nodules. Nodules were counted, and all samples oven-dried to constant weight at
70°C. After measuring dry matter, the samples were ground for total nitrogen determination.
2.1.3 Plant Growth in Potted Clanwilliam Soil
Soil samples collected from four adjacent Rooibos tea fields in Clanwilliam were placed in
clean polyethylene bags and transported to the glasshouse. After taking sub-samples for
chemical characterization, the soil was potted out, watered to field capacity, and seeds of
Aspalathus linearis subsp. linearis sown at 2-5 mm depth. Three weeks after planting,
seedlings were thinned out to three per pot and immediately provided with the different
nutrient treatments. Each pot received 300 ml of the treatment nutrient solution twice a week
for up to 6 months when the experiment was terminated. At harvest, plants were separated into
shoots, roots and nodules. Photosynthetic leaf tissues were sampled for chlorophyll
17
determination prior to oven-drying at 70 °C for 72 h. The dried samples were weighed, milled
and . analysed for total nitrogen. During harvest, the soil mass covering roots was used for
measurement of pH.
2.1.4 Plant Growth in Modified Leonard jar Assemblies
Two types of experiments were conducted using this set-up, one involved testing different soil
inocula for their nodulation capacity with Aspalathus linearis subsp. linearis, and the other
assessed the effects of inoculation and No3• supply on rhizosphere pH. Leonard jars were
assembled as described by Vincent (1970) with minor modifications. A wick was passed
through the mouth of a beer bottle that had its bottom cut off to provide a flat ground finish.
This wick was secured in the neck with a wad of cotton wool to aid capillary rise of nutrient
solution from reservoir to rooting medium in the growth vessel when the bottle was inverted
and fitted into the jar as shown in Fig 2.1. Prior to fitting the upper part of the assembly, the
jar was filled with one-quarter strength N-free nutrient solution up to three-quaters of its
volume. Sand or vermiculite was used as rooting medium to fill the inverted beer bottle up to
about 2 cm below the top. After wetting the sand or vermiculite with about 20 ml nutrient
solution, one-half petri-dish was used as lid to cover the top to prevent contamination. The
whole assembly was then autoclaved. On removal from the autoclave, the Leonard jars were
allowed to cool in the laminar flow hood.
For experiments involving soil inocula, vermiculite was used as the rooting medium. After
sterilization, five seeds of Aspalathus linearis subsp. linearis were sown aseptically per jar
18
in the laminar flow hood. With the petri-dish in place as lid, the seeds were left to germinate
in each jar. After germination, seedlings were inoculated with 100 ml soil suspension prepared
r------a
--
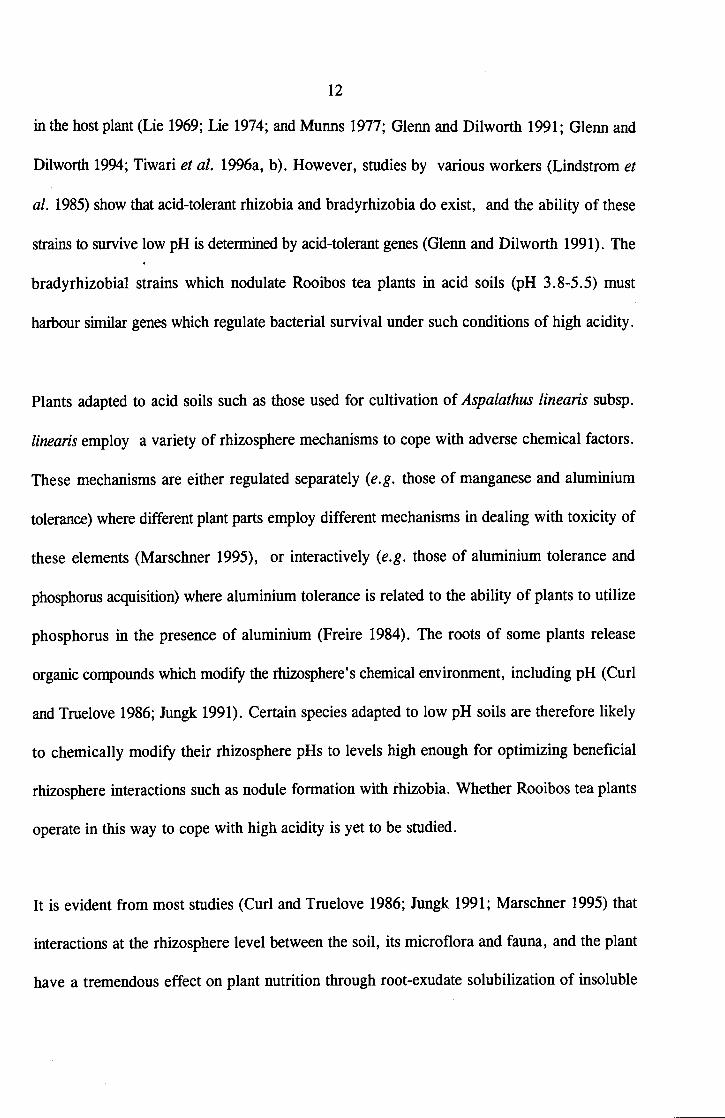
Fig. 2.1. Modified Leonard jar assembly (Vincent 1970).
a: Petri-dish (removed after seeedling emergence) b: Cotton wool (added after seedling emergence) c: Aluminium foil (covering assembly during sterilization, remaining to cover the junction
between the bottle and the jar) · d: Inverted bottomless bottle e: Sand or vermiculite f: Wick h: Jar i: Seedling solution (1/4 strength) k: Cotton wool
19
from shaking 200 g of each soil type in 500 ml sterile distilled water for a period of one hour.
Three days after inoculation, the petri-dishes were replaced with sterilized cotton wool as anti
contamination mulch. The Leonard jars were then removed from the laminar flow hood to the
glasshouse where plants were allowed to grow for 12 weeks. At harvest, nodulation was
assessed and plant fresh weights determined.
The Leonard jar assemblies were used in a second set of experiments to test the effects of
inoculation and N03- supply on rhizosphere pH. Here, sand was used as rooting medium
instead of vermiculite. The Leonard jars were filled with N-free nutrient solution maintained
at pH 4 or 6.8 with HCl or NaOH. In one case, the nutrient solution was altered to contain 2
mM N03- (KN03). After autoclaving, about 15 seeds of Aspalathus linearis subsp. linearis
were sown per jar and left to germinate in the laminar flow hood. Immediately after
germination, the inoculation treatment was imposed and plants left to grow either as
uninoculated, Bradyrhiwbium-inoculated or 2 mM No3• -fed, in rooting medium maintained
at pH 4.0 or 6.8. Four replicates were used for each treatment. After inoculation, all petri
dishes were replaced with transparent, light-penetrable, sterile plastic bags held in place over
the Leonard jars by means of rubber bands to avoid contamination, while providing enough
space for plant growth and sufficient light for photosynthesis. The jars were removed from the
laminar flow hood to the glasshouse where they were left to grow for two months. At harvest,
nodulation and plant growth were assessed, and the pH of nutrient solution bathing roots
determined.
• '... •.· · 1 ~·~ ••
20
2.2 Soils
2.2.1 Collection of Field Soil for pH Measurements
Field soils were collected from Clanwilliam using a pickaxe to dig 5-10 cm away from the tap
root system around the plant. The root-rich soil in the zone around the tap root was then
shovelled into labelled plastic bags, and sealed. About 0.5 kg soil was collected from the
rhizosphere of each plant selected from 1-, 2-, 3-, and 4 yr- old fields of Aspalathus linearis
subsp. linearis. Similar soils were collected from in-between rows, and from ploughed areas
lying between planted rows of Aspalathus linearis subsp. linearis and uncultivated fields. The
root-free soils collected from these plant-free areas were referred to as "non.:.rhizosphere
soils". In all instances, four replicates of rhizosphere and non-rhizosphere soil samples were
collected for each age group of plants. Another four replicates of soil samples were collected
from an uncultivated land adjacent to the Rooibos tea plantation. The results obtained from
measurements of soil reaction showed that pH of the rhizosphere, compared to non-rhizosphere
soil, was altered by Rooibos tea plants.
To test whether this modification of rhizosphere pH was unique to plants growing in
Clanwilliam soil, four replicate soil samples were collected from the rhizospheres of each of
6 different non-legume species growing in the uncultivated fallow land adjacent to the Rooibos
tea plantations. These non-legume plants included Anthospermum sp., Leucospermum sp.,
Wildenowia sp., Serruria sp., Leucadendron sp., and Nylandtia sp. About 24 non-rhizosphere
soils were also collected from the same site as controls and their pHs measured for comparison
21
with rhizosphere soils.
2.2.2 Collection of Field Soils for Use as Inocula
Soils were collected from seven different locations in South Africa (Clanwilliam, Eisenberg,
Oudsthom, Knysna, Gauteng, Khalavha and Phiphidi) and two in Namibia (Nina Junction and
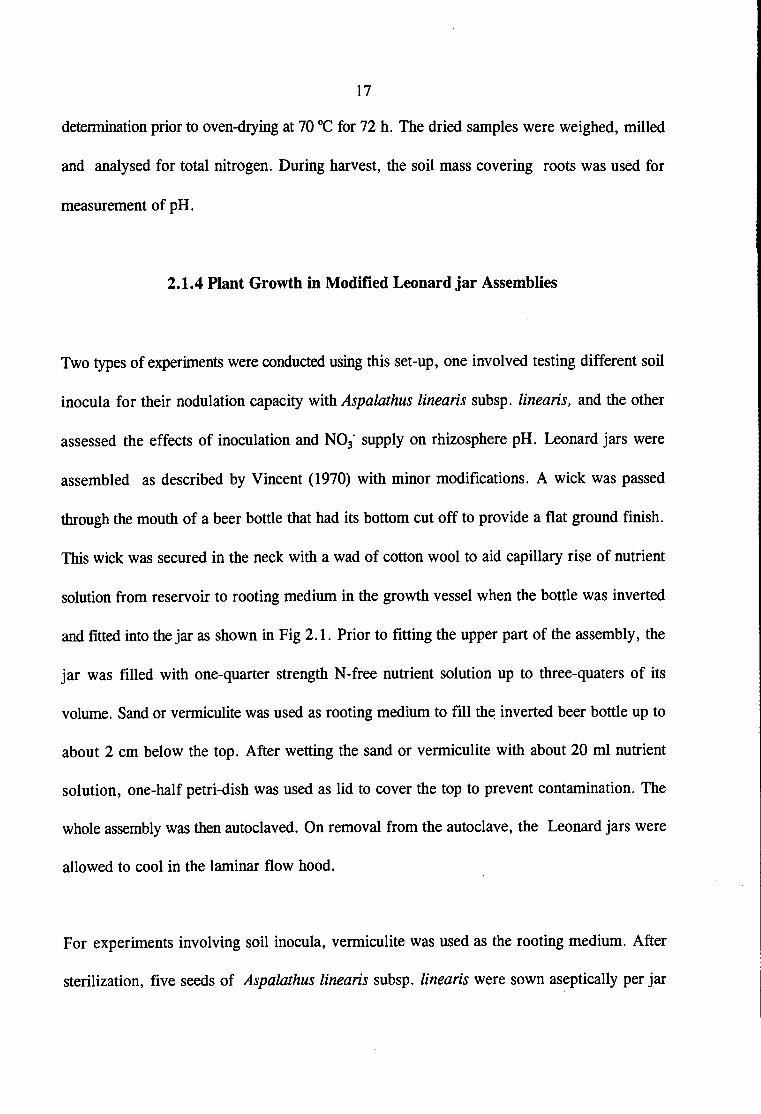
Sandveld) as shown in Fig. 2.2. In some instances, these soils were collected from
rhizospheres of tropical legumes as described previously.
2.2.3 Fertilizer Application to Field Soil
Three different levels (low, medium and high) of the mineral nutrients Ca, P and N were
applied as CaC12, K2HP04'KH2P04 , and NH4N03 in solution form to field plants. Prior to
application of nutrients, soil surrounding the below ground parts of the plant was weeded and
a hole prepared to facilitate solution retention and uptake by roots. The three levels of
application contained 5 mM (low); 25 mM (medium); and 50 mM (high) concentrations of the
respective nutrient elements. Nutrient application was done in three stages, the first at the
beginning of the rainy season in May, the second in June, and the third in August 1995.
Fertilized plants were left to grow for 8 months to allow nutrient uptake and metabolism. At
harvest, plants were separated into roots, shoots, and nodules. Unfertilized plants were also
harvested to serve as control. The shoots were air-dried for a week after which leaves were
separated from the stems. Branches, stems and roots were then cut into smaller pieces, and
oven dried at 70 °C to constant weight. Samples were then removed and ground before being
9
8 •
•
6
•
22
0
Fig.2.2. Distribution of soils collected for infectivity test on Aspa/rhus linearis subsp. linearis
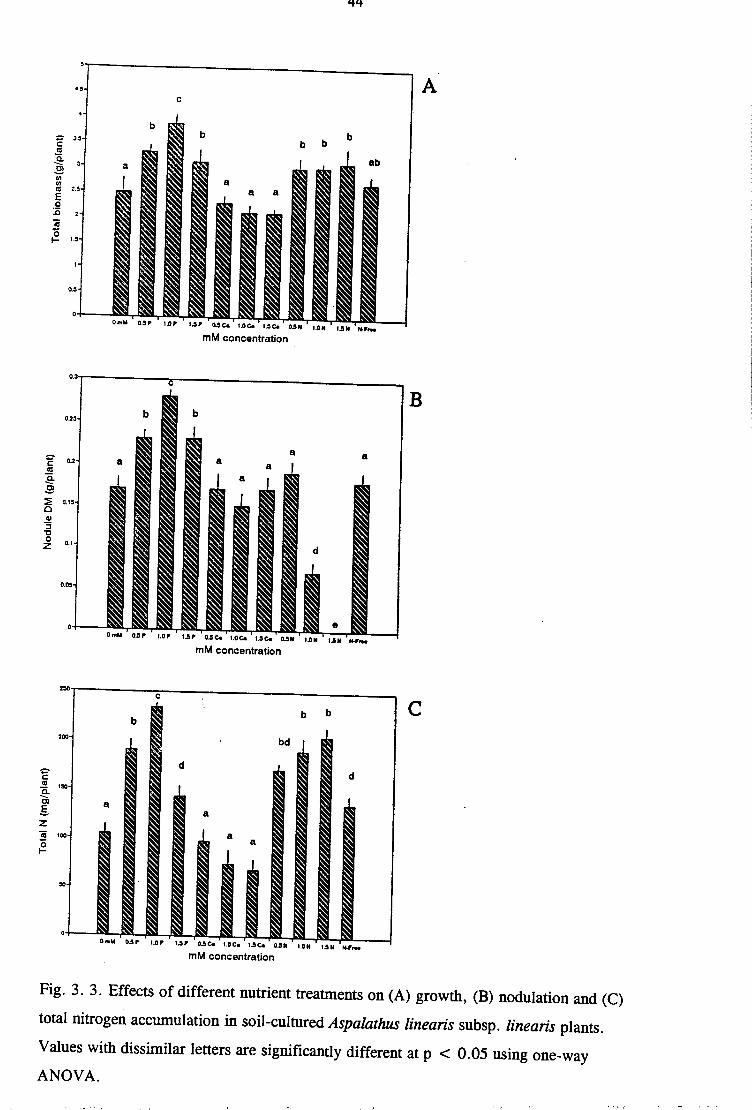
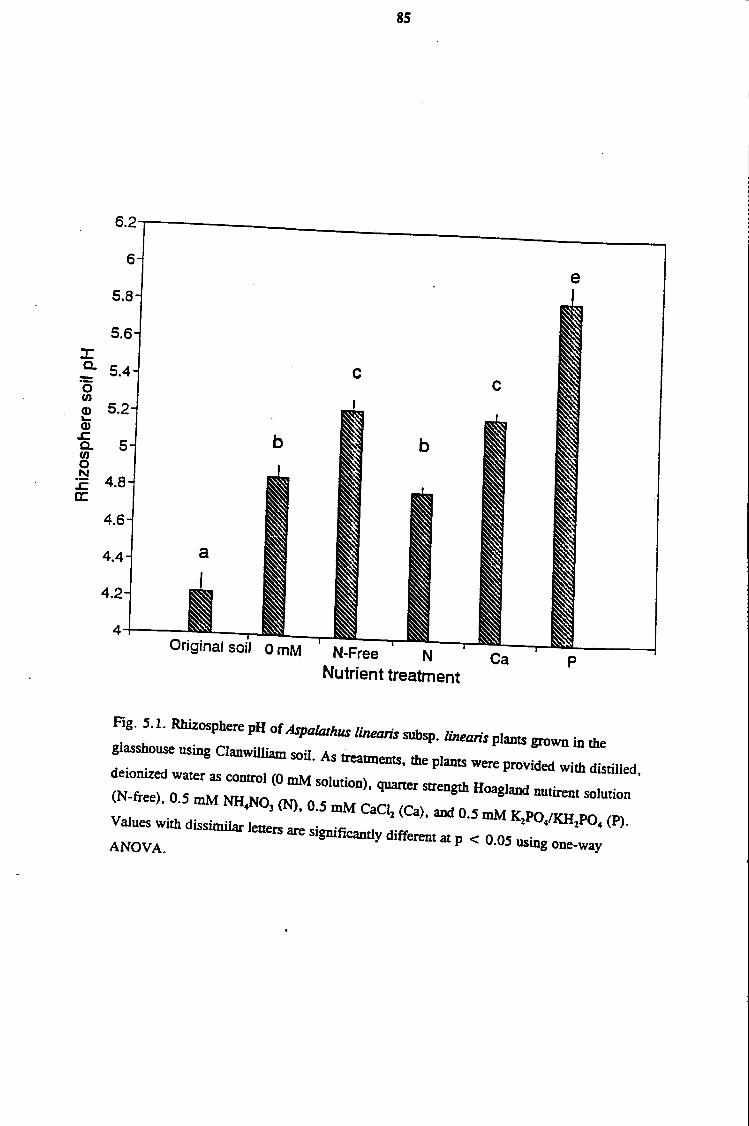
Fig. 3. 3. Effects of different nutrient treatments on (A) growth, (B) nodulation and (C)
total nitrogen accumulation in soil-cultured Aspalathus linearis subsp. linearis plants.
Values with dissimilar letters are significantly different at p < 0.05 using one-way
ANOVA.
45
a
8
I~ Sand cultUre - Soil cultura ij A .
... OmM 0.SP I.OP t.SP OJIC. t.OC.
mM concentration
OnlM Cl.SP 1.0P t..5P 0.SC.
mM concentration
a c 200
~ 200 as 7i Ci ..§. ... "O Q)
~ z 100
.. Omll .... 1.0• .... o.oc. l.OC. l.oC. ...,_
mM concentration
Fig. 3.4. Comparison of nutrient effect on (A) growth, (B) nodulation and (C) nitrogen fixation
of Aspalathus linearis plants grown in sand and Clanwilliam soil.
Values with dissimilar letters at each concentration are significantly different at p < 0.05 using
one~way ANOV A.
46
40
b b A
35
30 c - Cd cd c: <ti a. 25
d d -.:::-QI
d .0 E 20 ::J c: QI
'3 'O 15 0 z
~ c: <ti a. ...... Cl
.s 'O QI x
;;::::
z
10
5
0
1.5 P 0.5 Ca 1.0 Ca 1.5 Ca .045 B .09 B .135 B N-Free
mM concentration
3001--------------------------,
c
250
200
150
100
50
O'+---
b
d
e e e e
ae ae
1.5 P 0.5 Ca 1.0 Ca 1.5 Ca .045 B .09 B .135 B N-Ftee
mM concentration
B
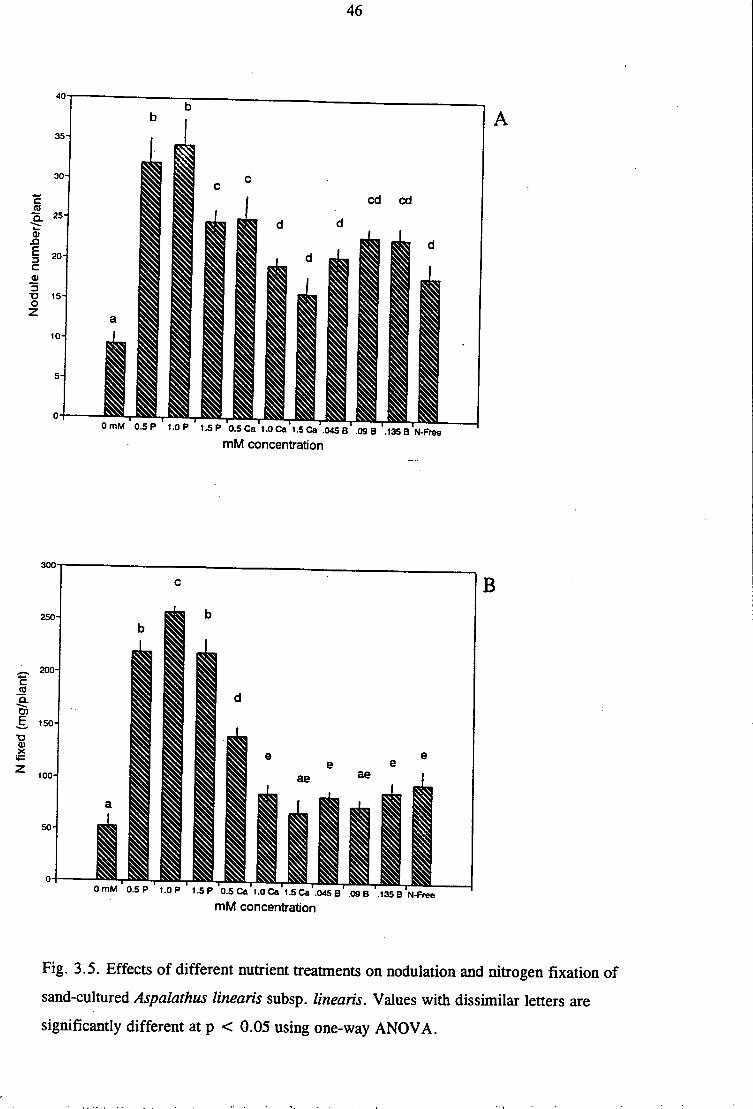
Fig. 3.5. Effects of different nutrient treatments on nodulation and nitrogen fixation of
sand-cultured Aspalathus linearis subsp. linearis. Values with dissimilar letters are
significantly different at p < 0.05 using one-way ANOVA.
47
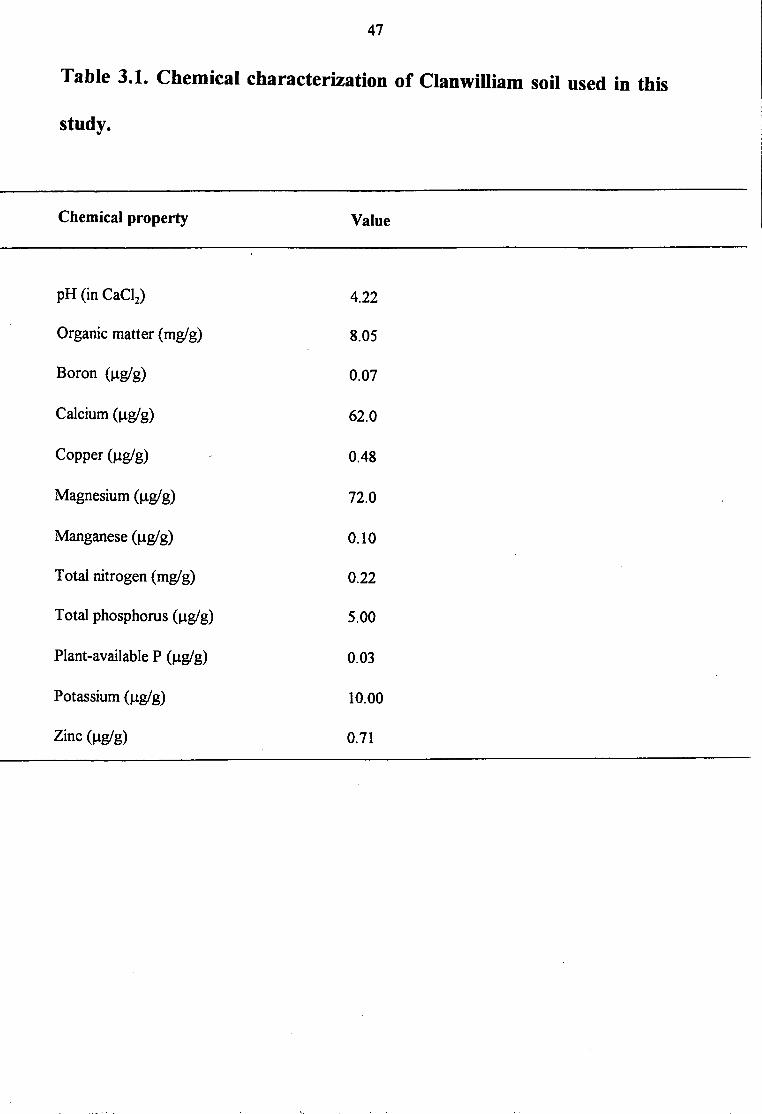
Table 3.1. Chemical characterization of Clanwilliam soil used in this
study.
Chemical property Value
pH (in CaCl2) 4.22
Organic matter (mg/g) 8.05
Boron (µgig) 0.07
Calcium (µgig) 62.0
Copper (µgig) 0.48
Magnesium (µgig) 72.0
Manganese(µg/g) 0.10
Total nitrogen (mg/ g) 0.22
Total phosphorus (µgig) 5.00
Plant-available P (µgig) 0.03
Potassium (µgig) 10.00
Zinc (µgig) 0.71
I 48
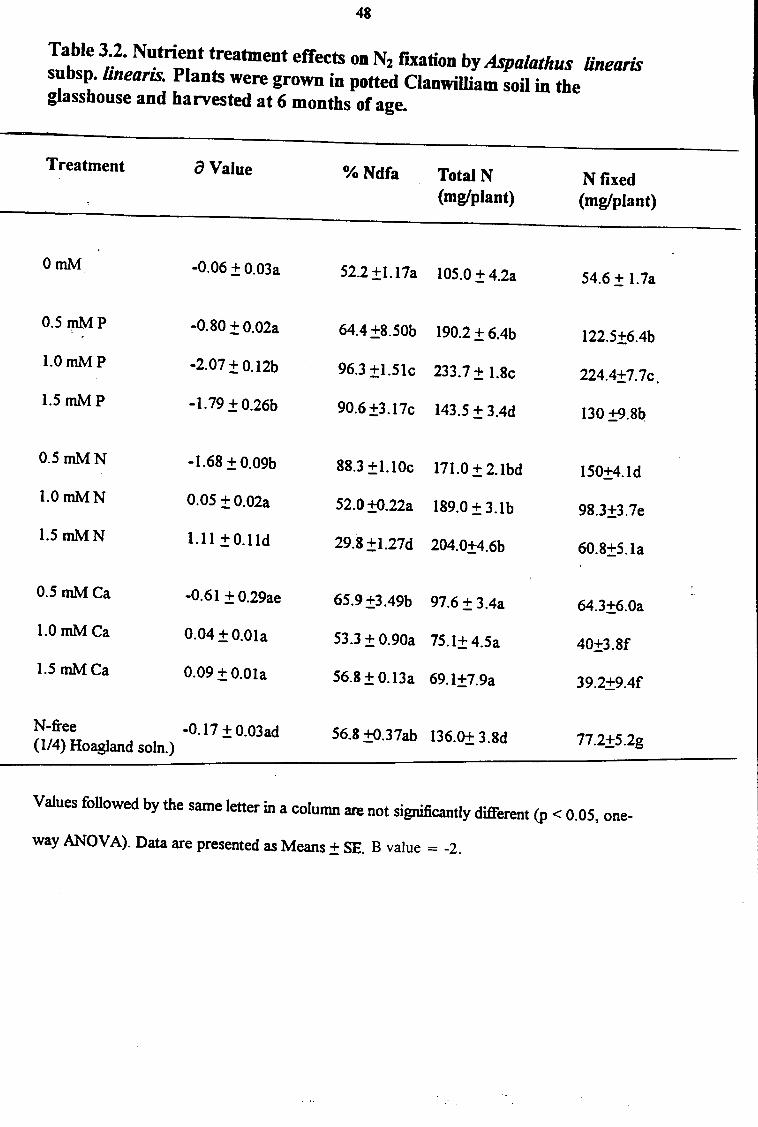
Table 3.2. Nutrient treatment effects on N2 fJXation by Aspalathus linearis subsp. linearis. Plants were grown in potted Clanwilliam soil in the glasshouse and harvested at 6 months of age.
Treatment a Value
OmM -0.06 ± 0.03a
0.5111M p -0.80 ± 0.02a
l.OmMP -2.07 ± 0.12b
1.5 mMP - I. 79 ± 0.26b
0.5mMN -1.68 ± 0.09b
1.0mMN 0.05 ±0.02a
1.5 mMN 1.11±0.lld
0.5mMCa -0.61±0.29ae
l.OmMCa 0.04 ± 0.0la
1.5 mMCa 0.09 ±0.0la
N-free -0.17 ± 0.03ad (I/4) Hoagland soln.)
%Ndfa Total N (mg/plant)
52.2±1.17a 105.0±4.2a
64.4 ±8.50b 190.2 ± 6.4b
96.3 ±l.5lc 233.7 ±I.Sc
90.6 ±3. l 7c 143.5 ± 3.4d
88.3 ±1.lOc 171.0 ± 2.lbd
52.0±0.22a 189.0 ± 3.lb
29.8±1.27d 204.0±4.6b
65.9±3.49b 97.6 ± 3.4a
53.3 ±0.90a 75.1± 4.Sa
56.8± 0.13a 69.1±7.9a
56.8 ±Q.37ab 136.Q± 3.Sd
N fixed (mg/plant)
54.6 ± l.7a
122.5±6.4b
224.4±7. 7c.
130 ±9.Sb
150±4.ld
98.3±3.7e
60.8±5.la
64.3±6.0a
40±3.Sf
39.2±9.4f
77.2±5.2g
Values followed by the same letter in a column are not significantly different (p < 0.05, one-
way ANOV A). Data are presented as Means± SE. B value = -2.
49
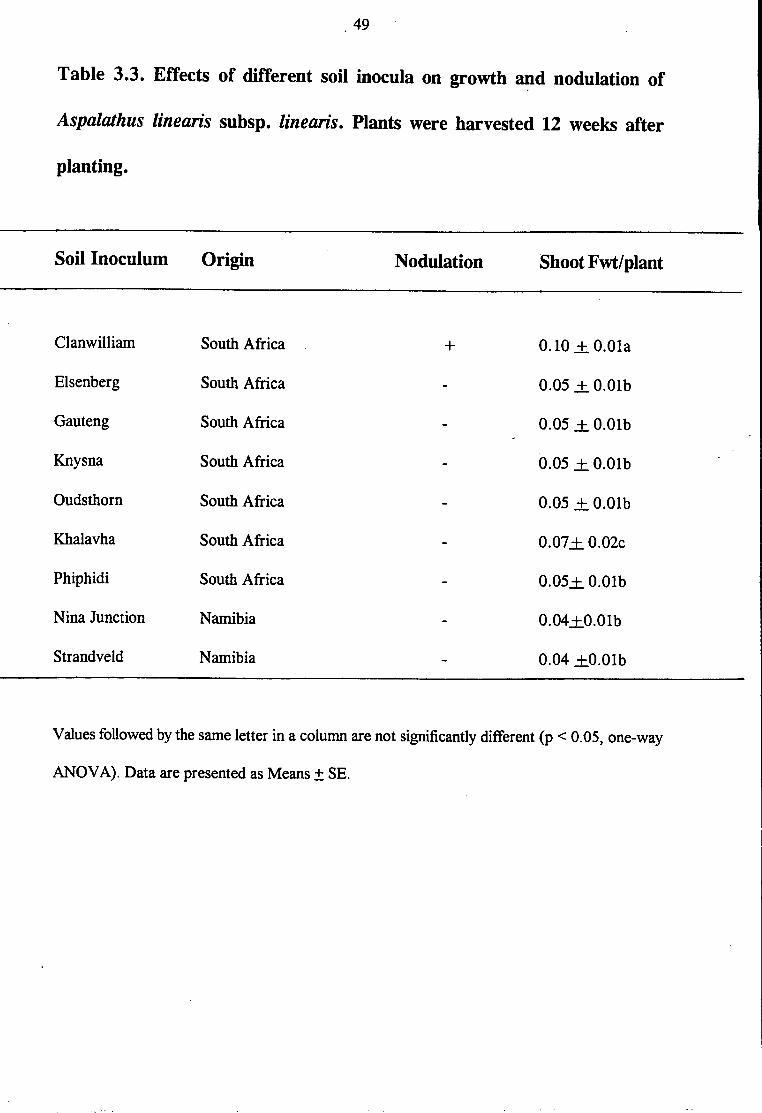
Table 3.3. Effects of different soil inocula on growth ~d nodulation of
Aspalathus linearis subsp. linearis. Plants were harvested 12 weeks after
planting.
Soil Inoculum Origin Nodulation Shoot Fwt/plant
Clanwilliam South Africa + 0.10 + O.Ola
Eisenberg South Africa 0.05 + O.Olb
Gauteng South Africa 0.05 .± O.Olb
Knysna South Africa 0.05 + O.Olb
Oudsthorn South Africa 0.05 + O.Olb
Khalavha South Africa 0.07+ 0.02c
Phiphidi South Africa 0.05+ O.Olb
Nina Junction Namibia 0.04+0.0lb
Strand veld Namibia 0.04 +0.0lb
Values followed by the same letter in a column are not significantly different (p < 0.05, one-way
ANOV A). Data are presented as Means± SE.
'
~
50
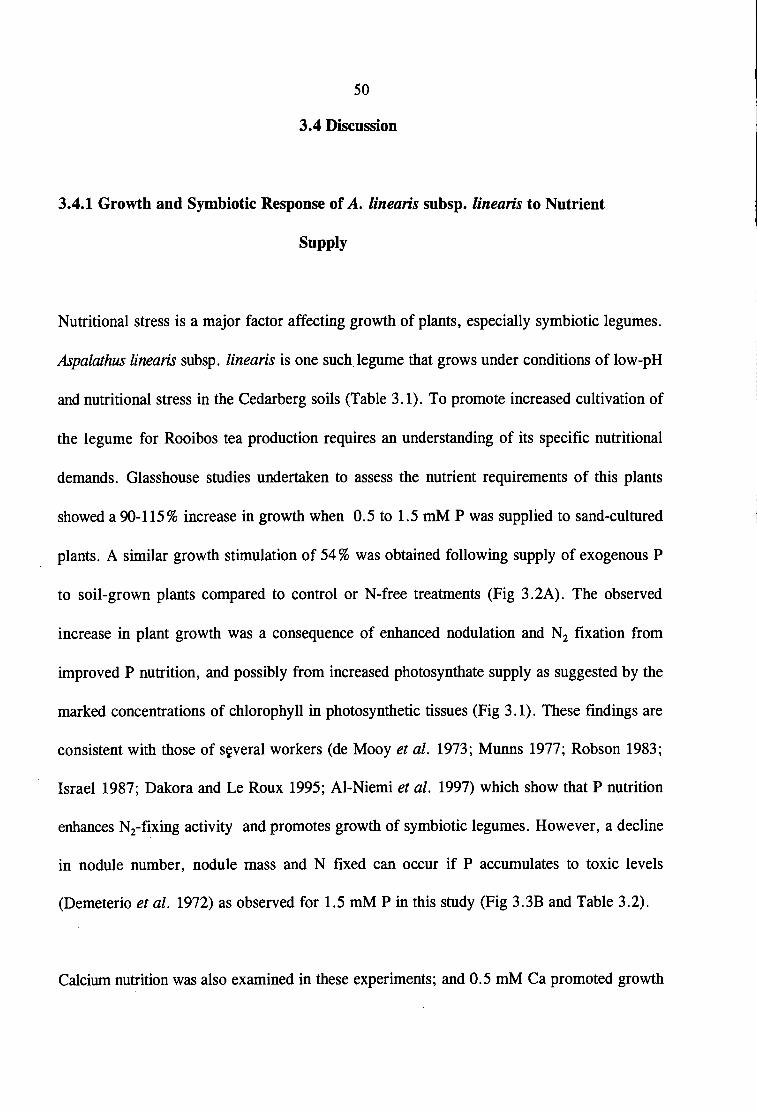
3.4 Discussion
3.4.1 Growth and Symbiotic Response of A. linearis subsp. linearis to Nutrient
Supply
Nutritional stress is a major factor affecting growth of plants, especially symbiotic legumes.
Aspalathus linearis subsp. linearis is one such legume that grows under conditions of low-pH
and nutritional stress in the Cedarberg soils (Table 3.1). To promote increased cultivation of
the legume for Rooibos tea production requires an understanding of its specific nutritional
demands. Glasshouse studies undertaken to assess the nutrient requirements of this plants
showed a 90-115% increase in growth when 0.5 to 1.5 mM P was supplied to sand-cultured
plants. A similar growth stimulation of 54% was obtained following supply of exogenous P
to soil-grown plants compared to control or N-free treatments (Fig 3.2A). The observed
increase in plant growth was a consequence of enhanced nodulation and N2 fixation from
improved P nutrition, and possibly from increased photosynthate supply as suggested by the
marked concentrations of chlorophy 11 in photosynthetic tissues (Fig 3. 1). These findings are
consistent with those of s~veral workers (de Mooy et al. 1973; Munns 1977; Robson 1983;
Israel 1987; Dakora and Le Roux 1995; Al-Niemi et al. 1997) which show that P nutrition
enhances N2-fixing activity and promotes growth of symbiotic legumes. However, a decline
in nodule number, nodule mass and N fixed can occur if P accumulates to toxic levels
(Demeterio et al. 1972) as observed for 1.5 mM Pin this study (Fig 3.3B and Table 3.2).
Calcium nutrition was also examined in these experiments; and 0.5 mM Ca promoted growth
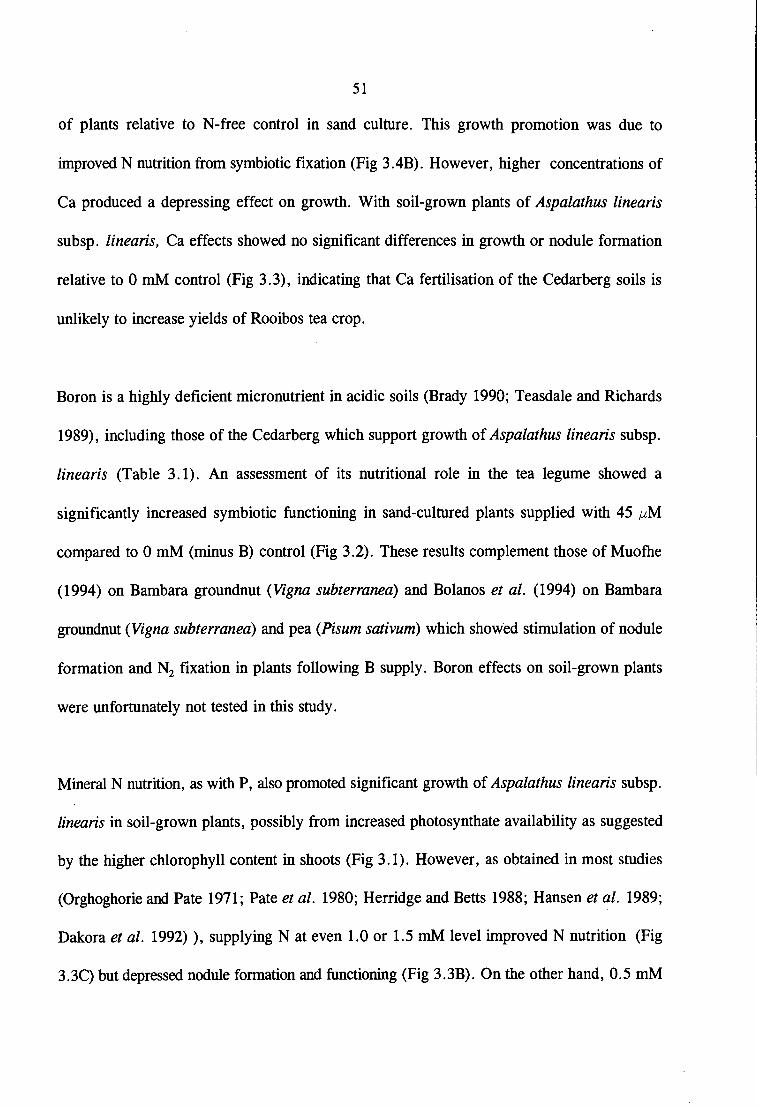
51
of plants relative to N-free control in sand culture. This growth promotion was due to
improved N nutrition from symbiotic fixation (Fig 3.4B). However, higher concentrations of
Ca produced a depressing effect on growth. With soil-grown plants of Aspalathus linearis
subsp. linearis, Ca effects showed no significant differences in growth or nodule formation
relative to 0 mM control (Fig 3.3), indicating that Ca fertilisation of the Cedarberg soils is
unlikely to increase yields of Rooibos tea crop.
Boron is a highly deficient micronutrient in acidic soils (Brady 1990; Teasdale and Richards
1989), including those of the Cedarberg which support growth of Aspalathus linearis subsp.
linearis (Table 3.1). An assessment of its nutritional role in the tea legume showed a
significantly increased symbiotic functioning in sand-cultured plants supplied with 45 µM
compared to 0 mM (minus B) control (Fig 3.2). These results complement those of Muofhe
(1994) on Bambara groundnut (Vigna subterranea) and Bolanos et al. (1994) on Bambara
groundnut (Vigna subterranea) and pea (Pisum sativum) which showed stimulation of nodule
formation and N2 fixation in plants following B supply. Boron effects on soil-grown plants
were unfortunately not tested in this study.
Mineral N nutrition, as with P, also promoted significant growth of Aspalathus linearis subsp.
linearis in soil-grown plants, possibly from increased photosynthate availability as suggested
by the higher chlorophyll content in shoots (Fig 3.1). However, as obtained in most studies
(Orghoghorie and Pate 1971; Pate et al. 1980; Herridge and Betts 1988; Hansen et al. 1989;
Dakora et al. 1992) ), supplying Nat even 1.0 or 1.5 mM level improved N nutrition (Fig
3.3C) but depressed nodule formation and functioning (Fig 3.3B). On the other hand, 0.5 mM
52
N stimulated N2 fixation in Aspalathus linearis subsp. linearis (Table 3.2), indicating that a
low supply of this nutrient as "starter N" could promote early symbiotic establishment in
seedlings and increase yields of Rooibos tea under field conditions. This enhancing effect of
low levels of combined N on symbiotic activity has been reported before (Ogoghorie and Pate
1971; Hill-Cottingham and Lloyd-Jones 1980), and is related to the lag phase between root
infection and the onset of N2 fixation (Marschner 1995). "Starter N" thus helps to overcome
N stress in legume seedlings prior to the commencement of vigorous N2 fixation.
Symbiotic N nutrition in plants was assessed using 15N natural abundance technique and the
difference in N yield between plant total N and seed N. The P treatments promoted greater
plant dependence on N2 fixation for N nutrition in both sand- and soil-cultured plants (Fig
3.3B; Table 3.2). In fact, all parameters of symbiotic functioning, including %Ndfa (N derived
from fixation), total N, and N fixed were significantly higher in P-fed plants, and this was
consistent with the markedly lower a 15N values obtained (Table 3.2). However, although the
extent of dependence by Ca-fed plants on symbiotic N2 fixation was the same as in plants
provided with N-free or 0 mM treatments (Table 3.2), N uptake by these N-free or 0 mM
plants was 1.7- to 2-fold higher compared to those fed 1.5 mM Ca, indicating that soil N
uptake by Aspalathus linearis subsp. linearis was inhibited by Ca supply. Whether this
inhibition is genotype-specific, remains to be determined. However, 0.5 mM Ca increased the
legume's dependence on symbiotic fixation for its N nutrition (Table 3.2). These results
suggest that even with adequate Ca supply for symbiotic establishment (Lowther 1970; Andrew
1976), the positive effects of Ca on symbiosis can be negated if nutritional imbalances affect
the uptake of other nutrients.
53
A comparison of plant growth and symbiotic performance in soil versus sand culture revealed
a similar pattern in response to the different nutrient applications (Fig 3. 5). Except for 0 mM
and N-free treatments where soil-grown plants were significantly (p < 0.05) better than those
from sand, plant growth was either the same for both soil and sand cultures (e.g. at 1. 0 mM,
1.5 mM Ca or 1 mM P), or significanly lower in soil (e.g. at 0.5 mM, 1.5 mM P or 0.5 mM
- Ca; see Fig 3.5A). By contrast, soil-grown plants nodulated better than those from sand.
Consequently, nodule DM was significantly (p < 0.05) higher in most treatments where plants
were grown in soil (Fig 3.5B). However, the amounts of N fixed in soil-grown plants were in
most instances significantly lower than those from corresponding treatments in sand culture
(Fig 3.5C). This disparity could only be attributed to a build-up of salts in soil culture which
impaired nodule functioning, in contrast to sand culture where plants were routi_nely flushed
with de-ionised water to prevent salt accumulation from nutrient application. Although some
of the studies (e.g. Marumo 1995) have been done on N2 fixation in Aspalathus linearis subsp.
linearis, compared to this study, differences exist in the absolute amounts of N fixed possibly
due to differences in growth conditions and age of the plants.
Growth rates of plants from nutrient-poor soils such as those of the Cedarberg are likely to be
genetically controlled to be at a low level, in keeping with the low nutrient supply from soil.
As shown in Table 3. 1, the endogenous soil concentrations of nutrients in the Cedarberg are
extremely low, e.g. 5.0 µMP, 220 µMN and 62.0 µM Ca. So, increasing nutrient supply to
Aspalathus linearis subsp. linearis, which is a nutrient-poor species, should be expected to
cause nutrient toxicity from increased accumulation in tissues rather than increased growth
rates. However, this was not the case. Increasing the micromolar nutrient concentrations in
54
Clanwilliam soil up to 1.5 mM promoted growth rates by 33-54% in P- and N-fed plants
compared to those growing in same soil but without any nutrient supplement (Fig 3. 3A).
Although there was no growth response to Ca supply (Fig 3. 3A), it was not due to Ca toxicity
but rather to Ca inhibition of N uptake (Table 3.1). Clearly, the response obtained with N and
P application in this study challenges the notion that growth of plants from nutrient-poor soils
are genetically pre-determined by the low nutrient condition.
3.4.2 Expanding Rooibos tea Cultivation Beyond the Cedarberg Region
A major factor determining the expansion in cultivation of any agricultural legume into new areas
is its ability to nodulate with native rhizobia or bradyrhizobia. The results of this study (Table 3 .2)
have clearly shown that bradyrhizobia from a wide range of soils within South Africa and Namibia
cannot nodulate Aspalathus linearis subsp. linearis, indicating that total absence or paucity of the
appropriate bacterial populations was responsible for the lack of nodulation. Even soil from
Eisenberg Research Station, which is part of the fynbos, was unable to nodulate Aspalathus
linearis subsp. linearis possibly due to bacterial absence as a consequence of continuous
agricultural cropping for over a 100 years without re-introduction of Aspalathus linearis subsp.
linearis. As to be expected, plants which nodulated with Clanwilliam soil showed improved
growth and symbiotic performance compared to the non-nodulated ones in other soils. These
results suggest that the establishment of Aspalathus linearis subsp. linearis in new areas would
be constrained by lack ofbradyrhizobia. Thus, expanding the Rooibos tea cultivation beyond the
Western Cape would require inoculation with high levels of effective Bradyrhizobium, as done
in similar situations in Australia (Parker and Chatel 1982).
"
55
The areas from which most of the soils were collected for this study are home to many tropical
legumes. Thus, bradyrhizobial numbers are likely to be high. The absence of bacterial cells per se
is therefore unlikely to account for the observed lack of nodulation. It is common knowledge that
the compatibility of a legume with its microsymbiont is a major factor affecting nodule formation
(Robson and Bottomley 1991). Except a few strains which nodulate a wide range of legumes,
most legume-bacterial interactions are specific. Rhizobium NGR324 (Price et al. 1992), which
was initially isolated from the non-legume Parasponia andersonii, is a strain with broad host
range and often used as a promiscuous nodulation marker (Masutha et al. 1997). The basis of
nodulation success or failure in host-strain interactions relates to the nature of signal molecules .'
exchanged between the legume and its bacterial partner during nodule formation (Phillips et al.
1995). The nodulation specificity of Aspalathus linearis subsp. linearis has been reported
(Staphorst and Strijdom 1975). As obtained in this study (Table 3.3), none of 15 Rhizobium
strains isolated from 14 legume species belonging to 11 genera could form effective nodules with
Aspalathus linearis subsp. linearis.
While the results of this study have shown symbiotic response of Aspalathus linearis subsp.
linearis to nutrient supply, the behaviour of plants under controlled conditions in the glasshouse
can differ significantly from that in the field. The next chapter will discuss N2 fixation by
Aspalathus linearis subsp. linearis under field conditions.
56
Chapter 4
Estimates of N2 fixation in Aspalathus linearis subsp. linearis using
15N natural abundance and 15N dilution techniques.
4.1 Introduction
Increased use has been made of techniques involving the stable 15N isotope of nitrogen for
measuring Ni fixation in legumes as they offer direct and reliable means for distinguishing the
proportions of N derived from soil, added fertilizer, or the atmosphere (Ledgard et al. 1985;
Shearer and Kohl 1983; Ofori et al. 1987). All these 15N methods rely on the sources of
nitrogen used for plant growth, being isotopically different in composition.
So far, measurements of Ni fixation using 15N methodology have largely centred on grain and
pasture legumes either grown in glasshouses or on research stations (Pate et al. 1980; Ledgard
et al. 1985; Ofori et al. 1987; Dakora et al. 1992), with relatively limited data on legumes
from farmers' fields (Peoples et al. 1995). Compared to agricultural species, shrub and tree
legumes suffer more from lack of information, in terms of the contribution of Ni fixation to
the nitrogen economy of plants themselves. This is possibly due to their lower economic value
and/ or difficulty in uprooting trees and shrubs for assessment of total biomass and nitrogen
content. Various techniques for measuring Ni fixation in shrub and tree species have been
well described (Danso et al. 1992).
57
Consequently, data on estimates of N2 fixation are available for only a few tree and shrub
legumes on a world-wide basis. In the Sonoran Desert, Prosopis is reported to derive about
43-61 % of its nitrogen nutrition from symbiotic fixation, while some acacias obtain only a
negligible amount of their nitrogen biologically (Shearer et al. 1983). This is in sharp contrast
to the understorey acacias in the Jarrah forest of S.W. Australia which depend on N2 fixation
for 31 - 99 % of their nitrogen requirements (Hansen and Pate 1987). A study on selected
Aspalathus species in the fynbos has shown a dependance of up to 100% in N2 fixation (Cocks
1994). In Namibia, members of the Mimosaeae also show a strong variation in their reliance
on symbiotic fixation for nitrogen nutrition, with dependency values ranging from a low 2 %
up to 71 % along an aridity gradient (Schulze et al. 1991). In Tanzania, some tree legumes
tested were found to derive about 44 % of their nitrogen from symbiotic source (Hogberg
1986). Taken together, these findings suggest that N2-fixing shrub and tree legumes vary in
their level of dependency on biological nitrogen for their nitrogen nutrition. The N2-fixing
potential of tree legumes covers a wide range, from less than 20 up to 300 kg N fixed/ha per
year (Dommergues 1987; Langkamp et al. 1979), a likely consequence of environmental
influence such as water, soil factors, and temperature, which directly reduce nodulation and
N2 fixation in the African setting than the genetics of the plant or the microsymbiont (Dakora
and Keya 1997).
In chapter 3, estimates of N2 fixation were done for Aspalathus linearis subsp. linearis.
However, because those experiments were performed under controlled conditions in the
glasshouse, extrapolating the results directly into the field could be misleading. The aim of this
study was to assess fixation by field plants of Aspalathus linearis subsp. linearis in relation to
58
nutrient supply and plant age using the 15N natural abundance method, and to additionally
measure the symbiotic dependence of the legume on different N03- regimes using 15N dilution
technique in glasshouse studies.
4.2 Materials and Methods
Three experiments were performed in this study to assess symbiotic nitrogen nutrition in
relation to plant age and presence of N03- under field conditions.
4.2.1 Experiment 1: Assessing the symbiotic Dependence of Aspalathus linearis subsp.
linearis on Different N03- Regimes in the Glasshouse
The 15N dilution technique was used to measure dependence of Aspalathus linearis subsp.
linearis on N2 fixation as opposed to N03-. To achieve this, seeds of the legume were sown
directly into wet sand maintained at field capacity. Seedlings were inoculated with a 1 ml
culture of the appropriate Bradyrhizobium isolated from Aspalathus linearis subsp. linearis,
and later thinned out to three per pot. The plants were regularly irrigated with N-free nutrient
solution up to the age of five months, when they began to receive N03- with different levels
of 15N label from 99% K15N03 as described in the General Materials and Methods. The
concentrations of N03- used included 0.5, 1.0, 2.0, and 5 mM containing 20, 10, 5 and 2 atom
% 15N respectively.
Plants were harvested at 7, 14, 21 and 28 d after supplying 15N-labelled N03-, and separated
59
into nodules, roots, and shoots. These 15N-enriched samples were oven-dried at 70 °C,
weighed, ground, packaged, and sent to the Mass Spectrometer Facility of the ARC Institute
for Soil, Climate and Water, for 15N analysis. Samples of the K15N03 salt were also analysed
for 15N.
The percentage of nitrogen derived from NO; fertilizer ( % NdfF) was calculated using the 15N
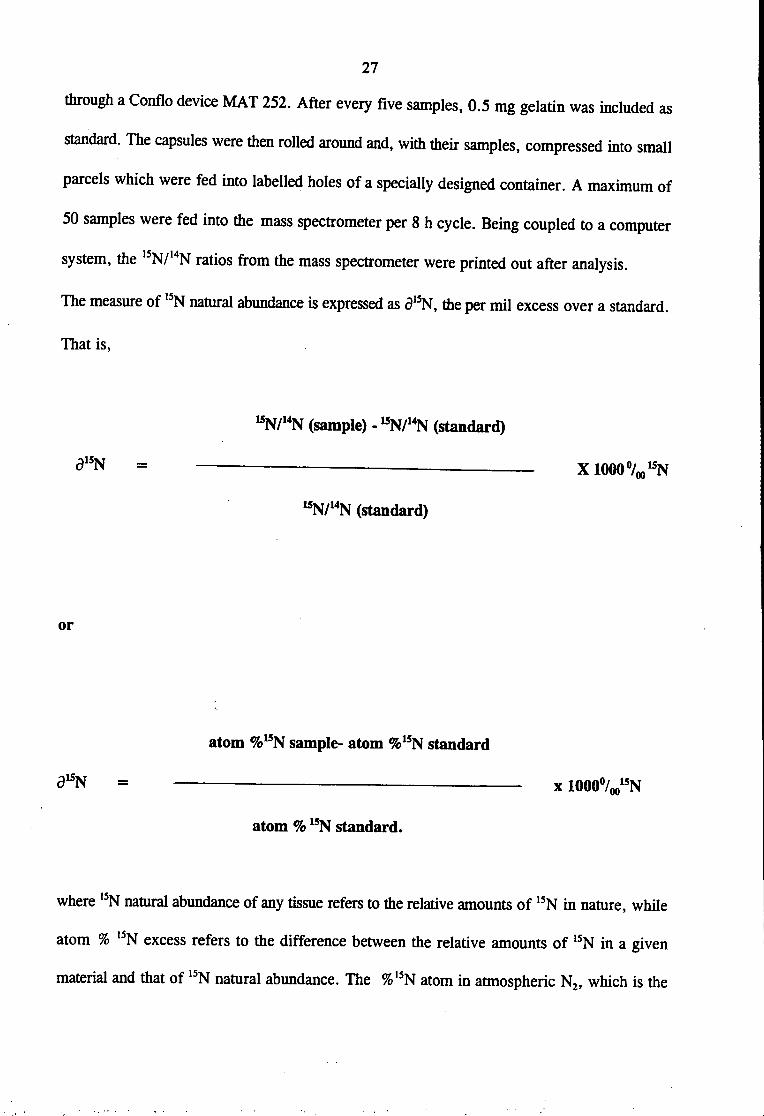
content of plant tissues as:
% 15N at. excess in plant sample
%NdfF - x 100
%15N at. excess in fertilizer
N derived from fertilizer = %NdfF x total N and N fixed is the difference between total N
and N derived from fertilizer.
4.2.2 Experiment 2: On-farm Determination of the Effects of N, P, and Ca Application
on N2 Fixation in Aspalathus linearis subsp. linearis Using 15N Natural Abundance
This study was conducted on the farm of Mr Willie Nel, a Rooibos tea farmer, in the
Clanwilliam area. About 50 healthy plants of Aspalathus linearis subsp. linearis were selected
in a 2-yr-old farm, and 0, 5, 25 and 50 mM concentrations of Ca, N and Pas CaC12, NH4N03,
and KH2POiK2HP04 applied to different plants in 3 split-applications in May, June, and
August 1995. The treated plants were harvested together with reference plants 8 months later,
as detailed in the General Materials and Methods. The reference plant was identified to be a
60
non-nodulated Aspalathus sp. (possibly Aspalathus ericifolia). The experimental plants were
separated into nodulated roots and shoots, oven-dried at 70 °C, weighed, and finely ground.
Weighed micro-samples were then analysed in a mass spectrometer (NA 1500 NC connected
to a Conflo device MAT 252) for 15N/14N ratios as described in the General Materials and
Methods. The nitrogenous compound gelatin was included as standard during 15N analysis.
The amount of N fixed in each organ was calculated as: P x total N in organ, where P is
defined as the proportion of N fixed in legume and calculated from the equation outlined in
the General and Materials and Methods.
4.2.3 Experiment 3: Effects of Plant Age on N2 Fixation of Field-Grown Aspalathus
linearis subsp. linearis Using 15N Natural Abundance
Rooibos tea plants at the age of 1, 2, and 3 yr were similarly dug up and separated into
component parts (nodulated roots and shoots), oven-dried, weighed, and finely ground (2 mm
sieve). A non-nodulated, non-fixing Aspalathus species was included as reference plant for
determining soil nitrogen uptake by legume. Weighed samples were· analysed on a mass
spectrometer for 15N/14N ratios as described in the General Materials and Methods. Samples
of gelatin were routinely included as N-containing standard during 15N analysis. Amounts of
N fixed were calculated as described before (see General Materials and Methods for
equations).
61
4.3 Results
4.3.1 Plant Growth and Symbiotic Response to N03" in a Glasshouse Study using 15N
Dilution
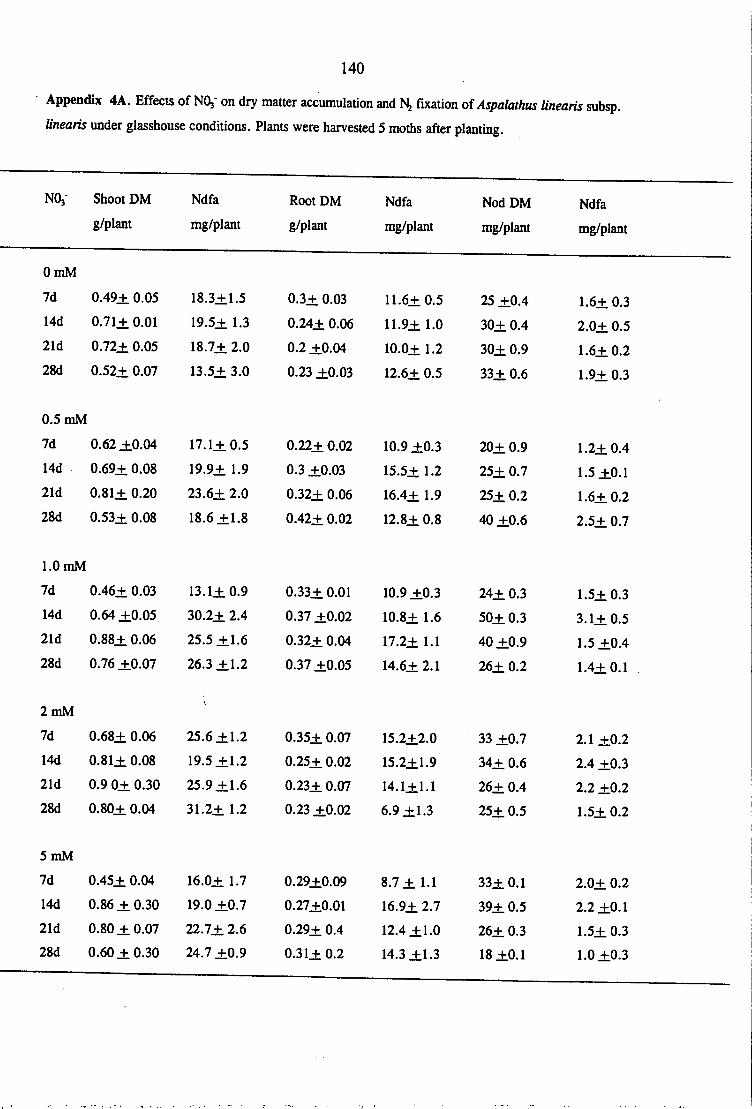
Plant growth remained unaltered 7 or 14 dafter N03- supply; however by 21 or 28 d, total
DM was significantly higher in all plants receiving N03- compared to controls (Table 4.1).
Of the N03--fed plants, those relying on 1 or 2 mM levels also showed significantly (p <
0.05) better growth compared to plants fed 0.5 or 5 mM N03- (Table 4.1; Appendix 4A).
There was no consistent pattern in the response of nodule DM to N03- supply at each harvest
date (Table 4.1). However at 28 d, nodule DM showed a typical response to N03-; in that,
increasing N03- concentration caused a significant (p < 0.05) decline in nodule mass.
However, comparing nodule DM of the 4 harvests at each N03- level revealed significantly (p
< 0.05) greater nodule mass at 14, 21 and 28 d after supplying 0. 0.5 and 1.0 mM N03-
compared to that at 7 din the same concentrations (Table 4.1), indicating uninhibited nodule
growth with time at those levels of N03- supply.
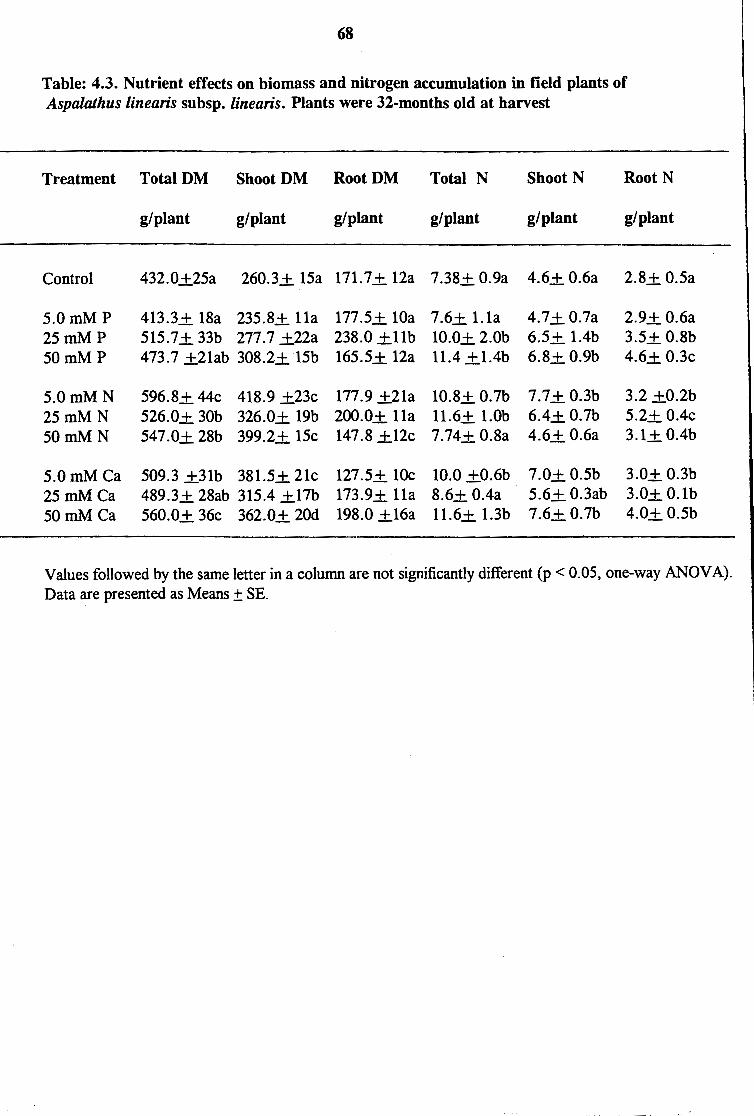
4.3.2 Effects of Fertilization on Growth and N2 Fixation in Field Plants
In general, nutrient application significantly increased total biomass in field plants compared
to control (Table 4.3). This was due largely to increased shoot dry matter than root (Table
62
4.3). Total N content of plant was also generally higher with fertilization. As with shoot and
root dry matter, N allocation to shoot was greater than to root (Table 4.3).
Measurements of various symbiotic parameters showed significant differences between
fertilized and unfertilized control plants. Plants receiving P and N treatments produced
significantly lower ~ 15N values compared to controls and those supplied with Ca (Table 4.4;
Appendix 4B). N derived from fixation also increased significantly with fertilization except
at 5 mM N or 5 mM Ca, where the levels were the same as control. The amounts of N fixed
were greater in plants fed mineral nutrients compared to controls. As a result, fertilized plants
contributed more to the N economy of the ecosystem compared to unfertilized ones (Table
4.4). The increase in N2 fixation with nutrient supply ranged from 4 up to 85%. The average
a15N value for gelatin was 6.75.
4.3.3 Effects of Plant Age on Growth and N2 Fixation in the Field
Growth analysis showed that the 2- and 3-yr-old plants accumulated significantly more biomass
compared to 1-yr-old (Table 4.5). This was due more to significant differences in root dry
matter than shoot (Table 4.5). Plant total N, shoot N and root N were greater in the 2- and 3-
yr-old plants compared to 1-yr-old. However, the 3-yr-old plants were also significantly higher
in N content, but not biomass, compared to 2-yr-old plants.
Measurement of various symbiotic parameters showed a strong age effect, especially in 3-yr
old plants. The 615N values for 3-yr-old plants were significantly lower than 1- or 2-yr-old
63
(Table 4.6). As a result, N derived from fixation, amount of N fixed per plant and the
potential N contribution to the ecosystem were all significantly higher in the 3-yr-old compared
to 1- or 2-yr-old plants (Table 4.6, Appendix 4C)).
c:: 0
·;::: cu >< ... ti:
c:: 0 Cl.) (.) c:: Q.)
"C c:: dJ c.. Q.)
"C
~
64
120
100
80
60
40
20
0
28d Days after NQ3- supply
OmM 0.SmM
1.0mM 2.0mM
Fig. 4.1. Symbiotic performance of Aspalathus linearis subsp. linearis with changes in
NQ3• concentration and time.
·, .
-.. ~ -~ 6 -~ ~ ca -0. :::s . "' ~ ('3
~
4
3
2
1
0
65
7d 14d 21d Days after No1- supply
2Bd
O.SmM 1.0mM
2.0mM 5.0mM
Fig. 4.2. Amount of NO]-N uptake by nodulated Aspalathus linearis subsp linearis plants
with changes in N03" concentration and time.
66
Table 4.1. Effects of NQ3- supply on growth, nodulation, and N yield of Aspalathus
linearis subsp. linearis under glasshouse conditions. Plants were harvested 5 months
Values followed by the same letter in a column are not significantly different (p < 0.05, one-way ANOVA).
Data are presented as Means ± SE.
67
Table 4.2. Amounts of N fixed following N03- application to glasshouse-grown plants of
Aspalathus linearis subsp. linearis. Plants were harvested 5 months after planting.
N fixed (mg/plant)
days after N03- supply
(mM) 7 14 21 28
0 25.0± l.5a 30.0± l.2a 30.0± l.6a 33.0± l.9a
0.5 29.2± 0.5a 34.9±1.3ab 39.5± l.7b 31.2 ±2.0-a
1.0 27.2± 0.8a 34.7±2. lab 40.16 ±l.4b 36.6± 2.3a
2.0 34.9± l.2b 31.9± l.4a 35.1± 3.0b 31.9 ±0.7a
5.0 23.2± l.3a 32.0 ±2.6a 29.4±2.4a 3 l.5±1.3a
Values followed by the same letter in a column are not significantly different (p < 0.05, one-way
ANOV A). Data are presented as Means± SE.
68
Table: 4.3. Nutrient effects on biomass and nitrogen accumulation in field plants of Aspmathus linearis subsp. linearis. Plants were 32-months old at harvest
Treatment Total DM Shoot DM Root DM Total N Shoot N Root N