Substance Abuse in Ingham County and the Capital Area September 2009 Prepared for Ingham Substance Abuse Prevention Coalition Lansing, Michigan www.drugfreeingham.org Compiled by Ingham County/City of Lansing Community Coalition for Youth Mason, Michigan www.ingham.org/ce/ccy.htm
Transcript
Substance Abuse in Ingham County and the Capital Area
September 2009
Prepared for Ingham Substance Abuse Prevention Coalition
Lansing, Michigan www.drugfreeingham.org
Compiled by Ingham County/City of Lansing Community Coalition for Youth
Mason, Michigan www.ingham.org/ce/ccy.htm
Acknowledgements: The Community Coalition for Youth would like to convey appreciation to Public Sector Consultants, Inc. for allowing portions of the narrative from the September 2007 Substance Abuse in Ingham County and the Capital Area report to be reprinted as well as their willingness to make consultation available as needed.
PERCENTAGE OF ADULTS WHO REPORT BINGE DRINKING IN THE PAST 30 DAYS ........................................................ 27 PERCENTAGE OF ADULTS WHO REPORT HEAVY DRINKING, 2003 AND 2006 ............................................................ 27 PERCENTAGE OF STUDENTS WHO HAD THEIR FIRST DRINK OF ALCOHOL BEFORE AGE 13 ............................................ 27 PERCENTAGE OF STUDENTS WHO HAVE HAD AT LEAST ONE DRINK OF ALCOHOL IN THEIR LIFETIME, BY GRADE .............. 28 PERCENTAGE OF STUDENTS WHO HAVE HAD AT LEAST ONE DRINK OF ALCOHOL IN THE PAST 30 DAYS, BY GRADE ......... 28 PERCENTAGE OF STUDENTS WHO REPORT BINGE DRINKING IN THE PAST TWO WEEKS ............................................... 28 YOUTH PERCEPTION OF PARENTS’ ATTITUDES TOWARD UNDERAGE DRINKING .......................................................... 28 ALCOHOL-RELATED ARRESTS ........................................................................................................................... 29 ARRESTS FOR DRIVING UNDER THE INFLUENCE .................................................................................................... 29 ALCOHOL-INDUCED DEATHS, THREE-YEAR AVERAGE RATES ................................................................................... 29 FATAL MOTOR VEHICLE CRASHES INVOLVING ALCOHOL ........................................................................................ 30 PERCENTAGE OF STUDENTS WHO SMOKED THEIR FIRST CIGARETTE BEFORE AGE 13 .................................................. 30 PERCENTAGE OF STUDENTS WHO REPORT SMOKING CIGARETTES AT LEAST ONCE IN THEIR LIFETIME ............................. 30 PERCENTAGE OF STUDENTS WHO REPORT SMOKING CIGARETTES AT LEAST ONCE IN THE PAST 30 DAYS ........................ 30 PERCENTAGE OF STUDENTS WHO REPORT SMOKING HALF A PACK OR MORE OF CIGARETTES PER DAY IN THE PAST 30 DAYS31 YOUTH PERCEPTION OF PARENTS’ ATTITUDES TOWARD SMOKING BY YOUTH, INGHAM COUNTY .................................. 31 YOUTH PERCEPTION OF PARENTS’ ATTITUDES TOWARD SMOKING BY YOUTH, INGHAM COUNTY .................................. 31 PERCENTAGE OF ADULTS WHO ARE CURRENT SMOKERS ....................................................................................... 31 LIVE BIRTHS WITH MOTHERS WHO SMOKED DURING PREGNANCY INGHAM COUNTY AND CAPITAL AREA, 2002–2006 ... 32 PERCENTAGE OF HOMES WITH SECONDHAND SMOKE, 2000, 2003, AND 2006 ....................................................... 32 PERCENTAGE OF STUDENTS WHO HAVE USED ILLEGAL DRUGS DURING THEIR LIFETIME, BY TYPE OF DRUG ................... 32
PERCENTAGE OF STUDENTS WHO HAVE USED ILLEGAL DRUGS ONE OR MORE OF THE PAST 30 DAYS, BY TYPE OF DRUG .. 32 DRUG-RELATED ARRESTS ................................................................................................................................ 33 NUMBER OF ARRESTS BY TYPE OF DRUG ............................................................................................................ 33 PERCENTAGE OF TREATMENT ADMISSIONS BY PRIMARY DRUG, FY 2001-2007 ........................................................ 33 ADMISSIONS TO TREATMENT VS. ESTIMATED NEED FOR TREATMENT, FY06 ............................................................. 34 CHILD ABUSE AND NEGLECT, 2005 ................................................................................................................... 34 DOMESTIC VIOLENCE OFFENDERS USE OF ALCOHOL AND OTHER DRUGS, 2005-2006 ............................................... 34
Substance Abuse in Ingham County and the Capital Area 1
Introduction
The impact of alcohol, tobacco, and illegal drugs is far reaching, affecting individuals, families, and our entire community. In addition to the health consequences for individuals, substance abuse and addiction are also linked to crime, child abuse and neglect, domestic violence, teen pregnancy, chronic welfare, and poor school performance. The costs to our community include public dollars spent on treatment, law enforcement, criminal justice and corrections, health care, child and family welfare, and education, as well as the costs of lost productivity, lost earnings, and years of potential life lost.
In the 2001 report Shoveling Up: The Impact of Substance Abuse on State Budgets, the National Center on Addiction and Substance Abuse estimated that the burden of alcohol, tobacco, and illegal drug abuse and addiction on public programs in Michigan was approximately $2.75 billion, or 12 percent of the state budget in 1998. And for each dollar spent on prevention, treatment, and research, $1,464 is spent on state programs “shoveling up the wreckage” of substance abuse and addiction.1
Targeted and effective prevention efforts can reduce the burden of substance abuse and addiction on public programs. Treatment is also cost-effective because it reduces the costs to state programs in the short term and prevents future costs, as well as reducing the human suffering for parents and children, classmates, friends, and neighbors in addition to the abuser. Without help, many people will not recover from their addiction, and unfortunately, there is a huge gap between the number of people with alcohol and other drug dependencies or addictions and the number who use treatment services. An estimated 893,000 people in Michigan were in need of substance abuse treatment in the past year yet did not receive it. 2
While treatment for addiction and dependency occurs at the individual level, use and abuse of alcohol, tobacco, and illegal drugs is an issue that must be addressed by our entire community. Each of us can play a role in preventing and reducing substance use and abuse.
IMPACT OF SUBSTANCE USE AND ABUSE
The impact of abuse of alcohol and illegal drugs on the Michigan criminal justice system is clear. Approximately 13 percent of the inmates in prison in 2008 were there as a result of an alcohol or drug-related offense.3 However, the proportion of inmates who are substance abusers is even greater. As of July 2008, 61 percent of Michigan prisoners reported having a substance abuse problem upon intake into the corrections system.4
In an analysis prepared by the Lansing Police Department, a single substance-abusing individual having multiple contacts with the department over a 22-year period resulted in costs of nearly $240,000. This estimate includes the costs of processing the individual through the law
1 The National Center on Addiction and Substance Abuse at Columbia University, Shoveling Up: The Impact of
Substance Abuse on State Budgets, January 2001. 2 Office of Drug Control Policy, Michigan Department of Community Health, Michigan 2007 State Snapshot of
Treatment and Prevention, July 2008. 3 2003 Statistical Report, Michigan Department of Corrections.
4 July 2008 Monthly Production Report to the Michigan Department of Corrections from the Michigan Department
of Information Technology.
Substance Abuse in Ingham County and the Capital Area 2
enforcement system, jail time, court processing, and emergency health services; it does not include the costs of all social services or medical care provided to this individual.
Additional local data show that the link between substance abuse and crime begins at an early age. In 2007, 42 percent of teens participating in the Lansing Teen Court program self-reported having tried alcohol or other drugs. Thirty percent of teen participants were deemed to have serious substance abuse problems and were referred for substance abuse treatment.
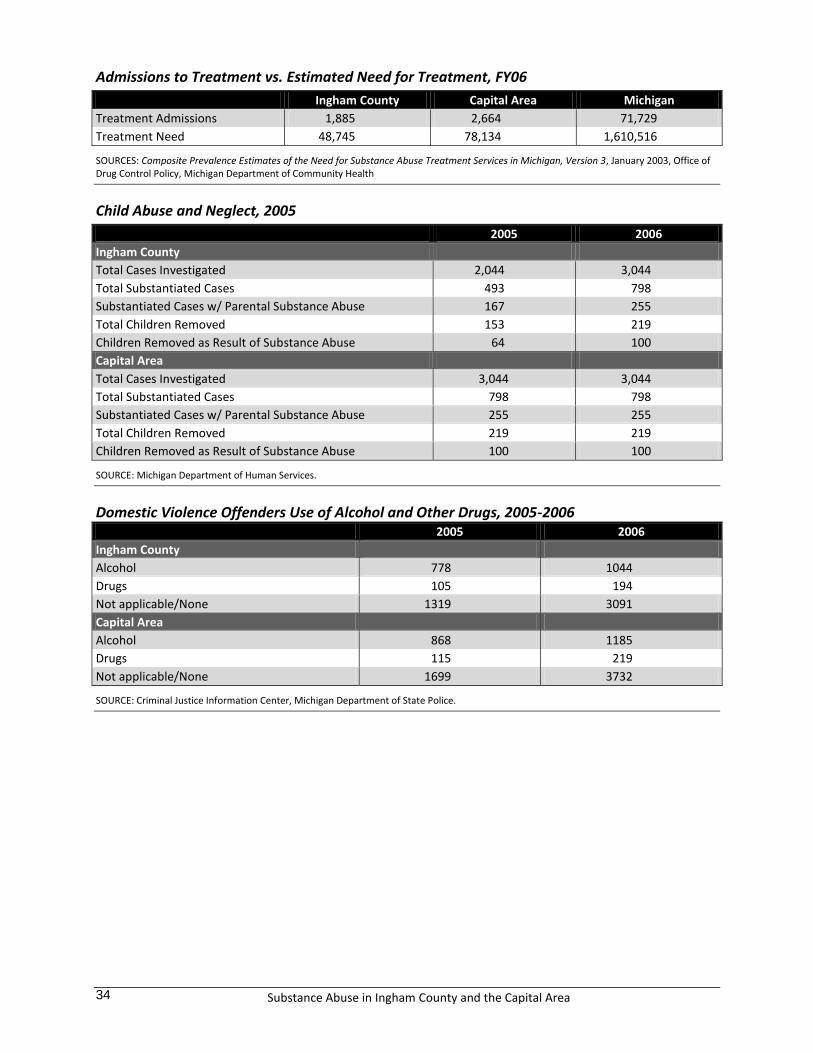
Young children also suffer consequences as victims of substance abuse by adults. In its 2005 Annual Report, the Michigan Foster Care Review Board notes that parental substance abuse “has been the most consistent and significant of barriers to *permanently placing temporary wards+ . . . over the past ten years.” In households where child abuse and neglect is identified, parental substance abuse is often also present. In 2005, parental substance abuse was identified in 34 percent of substantiated child abuse and neglect cases in Ingham County and 32 percent of cases in the capital area. Of children removed from the home, 42 percent in Ingham County and 46 percent in the capital area were removed as a result of parental substance abuse.
In 2006, nearly 29 percent of domestic violence offenders in Ingham County were reportedly under the influence of alcohol or other drugs at the time of the offense. In the same year, approximately 27 percent of domestic violence offenders in the capital area were under the influence of alcohol or other drugs at the time of the offense.
The following sections of this report provide detailed information on selected indicators showing both the scope of the problem and the harm caused by the use and abuse of alcohol, tobacco, and illicit drugs in Ingham County and the capital area, which comprises Clinton, Eaton, and Ingham Counties. The data in this report updates the report Substance Abuse in Ingham County and the Capital Area prepared by Public Sector Consultants for the Ingham Substance Abuse Prevention Coalition in September 2007.
Information included in this report was obtained primarily from the Michigan Departments of Community Health, Human Services, State Police, and Corrections; the Centers for Disease Control and Prevention; and the Mid-South Substance Abuse Commission (MSSAC). The MSSAC Prevention Needs Assessment Survey (PNA), conducted for the first time in 2004, again in 2006, and finally in 2008 is the primary source for several indicators of substance abuse among youth in this report. The PNA is a survey of students in grades 6, 8, 10, and 12 in schools that elect to participate in the survey within MSSAC’s 9-county region. The PNA is designed to assess students’ involvement in a specific set of problem behaviors as well as their exposure to a set of scientifically validated risk and protective factors. As a result of participation in the PNA survey being self-selected and not random, and because participation increased substantially from 2004 to 2006, valid comparisons cannot be made between the two surveys. This report only includes data from the 2006 and 2008 PNA. Also referenced is the 2008 MiPHY survey, or the Michigan Profile for Healthy Youth, which will replace the PNA survey in the future. The MiPhy still measures youth risk and protective factors, but surveys 7th, 9th, and 11th grades. Some Ingham County schools took the MiPHY for the first time in 2008, while others took the PNA survey for the last time. Were applicable, the MiPHY is referenced.
Substance Abuse in Ingham County and the Capital Area 3
Alcohol
Alcohol is the single most commonly abused substance. Young people are more likely to drink alcohol than they are to smoke cigarettes or use any illicit drug. More than two-fifths of all adults in Michigan (42 percent) and in Ingham County (49 percent) who received treatment from a publicly funded substance abuse program between September 2006 and October 2007 reported alcohol as their primary substance of use and were treated for an alcohol-related disorder. In addition to serious health conditions, alcohol use is linked to injuries and deaths from traffic crashes, falls, fires, and drowning. It is also a factor in homicide, suicide, domestic violence, and child abuse.
Indicator: Binge and heavy drinking by adults
Measures
Binge drinking: Percentage of women who report having four or more drinks of alcohol and men who report having five or more drinks of alcohol on a single occasion on one or more of the past 30 days
Heavy drinking: Percentage of women who report consuming alcohol in excess of one drink per day and men who report consuming alcohol in excess of two drinks per day on average
Why is this indicator important?
Binge drinking results in high blood alcohol levels, which can cause blackouts and even death. Binge drinking also increases the likelihood of other risky behaviors, such as unsafe sex, driving under the influence, and use of illicit drugs. Long-term heavy drinking increases the risk for high blood pressure, heart rhythm irregularities, stroke, cirrhosis and other liver disorders, and certain forms of cancer.
How is Ingham County doing on this indicator?
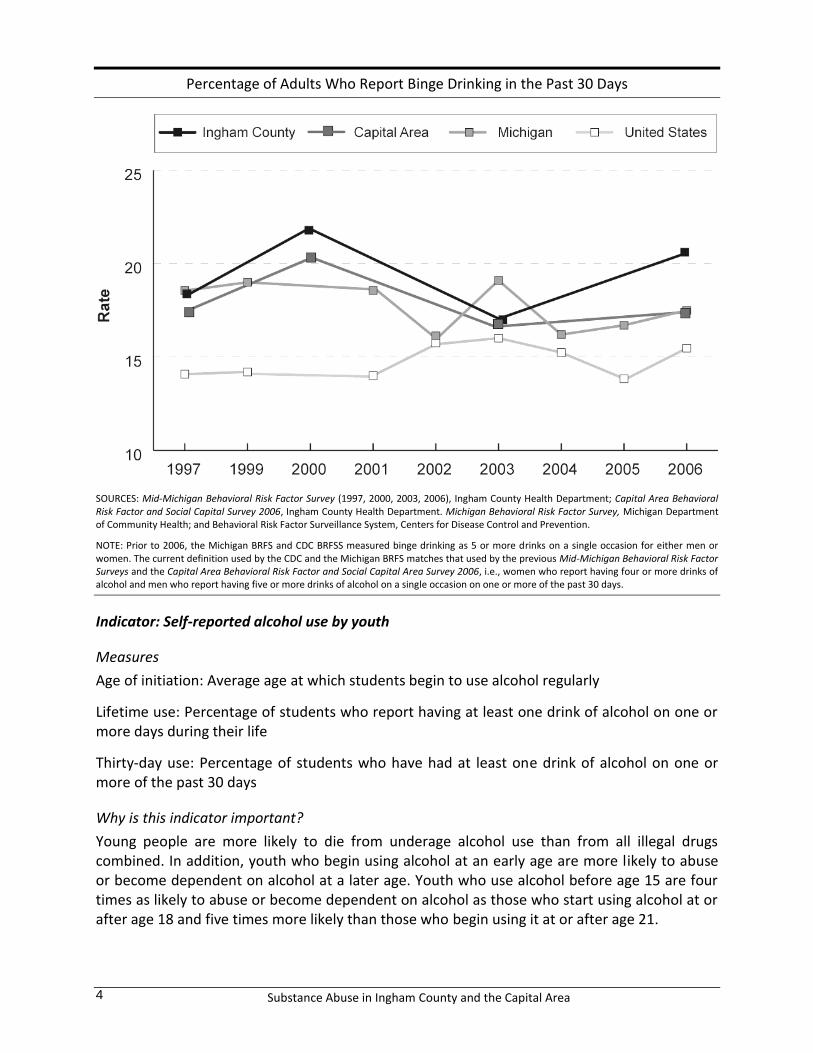
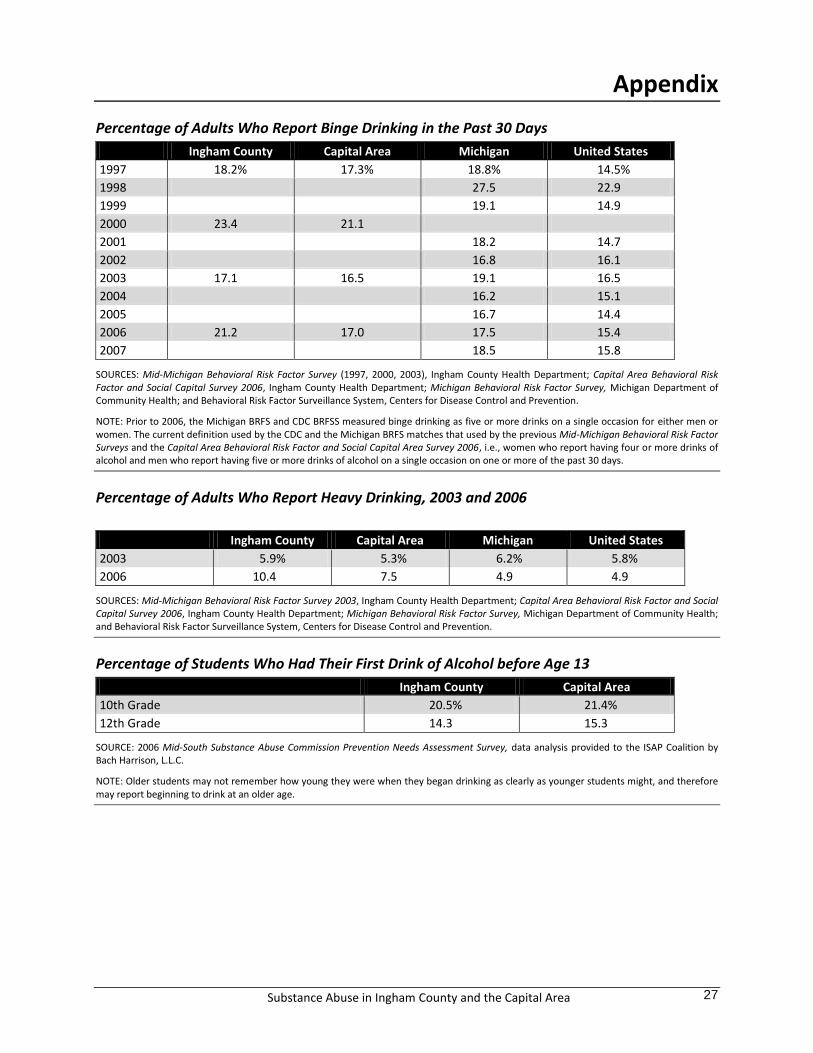
According to the 2006 Capital Area Behavioral Risk Factor and Social Capital Survey, the percentage of adults in Ingham County who are heavy drinkers (10.4 percent) is nearly one and a half times that of the capital area (7.5) and more than twice the percentage of the state (4.9).
In 2006, the percentage of adults in Ingham County who engaged in binge drinking (21.2) was higher than that of the capital area (17.0), the state (17.5), and the U.S. (15.4). Over time, the county has generally had a higher percentage of adults who binge drink than the capital area, Michigan, or the U.S.
Substance Abuse in Ingham County and the Capital Area 4
Percentage of Adults Who Report Binge Drinking in the Past 30 Days
SOURCES: Mid-Michigan Behavioral Risk Factor Survey (1997, 2000, 2003, 2006), Ingham County Health Department; Capital Area Behavioral Risk Factor and Social Capital Survey 2006, Ingham County Health Department. Michigan Behavioral Risk Factor Survey, Michigan Department of Community Health; and Behavioral Risk Factor Surveillance System, Centers for Disease Control and Prevention.
NOTE: Prior to 2006, the Michigan BRFS and CDC BRFSS measured binge drinking as 5 or more drinks on a single occasion for either men or women. The current definition used by the CDC and the Michigan BRFS matches that used by the previous Mid-Michigan Behavioral Risk Factor Surveys and the Capital Area Behavioral Risk Factor and Social Capital Area Survey 2006, i.e., women who report having four or more drinks of alcohol and men who report having five or more drinks of alcohol on a single occasion on one or more of the past 30 days.
Indicator: Self-reported alcohol use by youth
Measures
Age of initiation: Average age at which students begin to use alcohol regularly
Lifetime use: Percentage of students who report having at least one drink of alcohol on one or more days during their life
Thirty-day use: Percentage of students who have had at least one drink of alcohol on one or more of the past 30 days
Why is this indicator important?
Young people are more likely to die from underage alcohol use than from all illegal drugs combined. In addition, youth who begin using alcohol at an early age are more likely to abuse or become dependent on alcohol at a later age. Youth who use alcohol before age 15 are four times as likely to abuse or become dependent on alcohol as those who start using alcohol at or after age 18 and five times more likely than those who begin using it at or after age 21.
Substance Abuse in Ingham County and the Capital Area 5
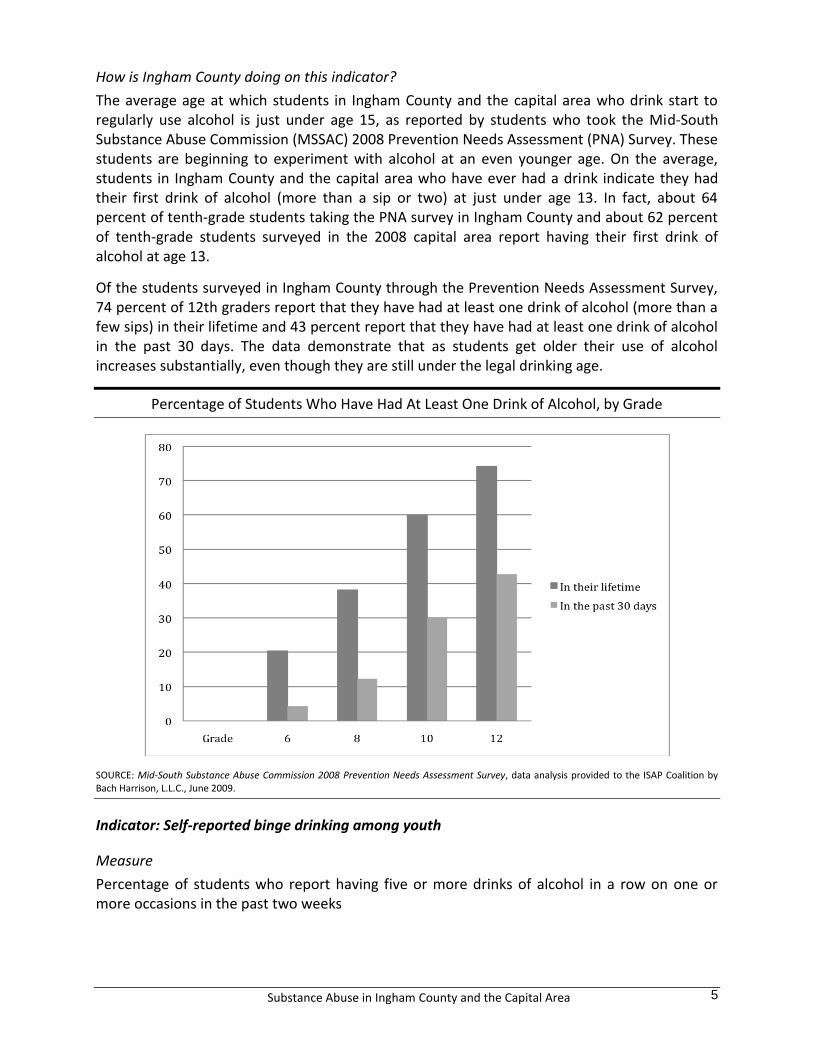
How is Ingham County doing on this indicator?
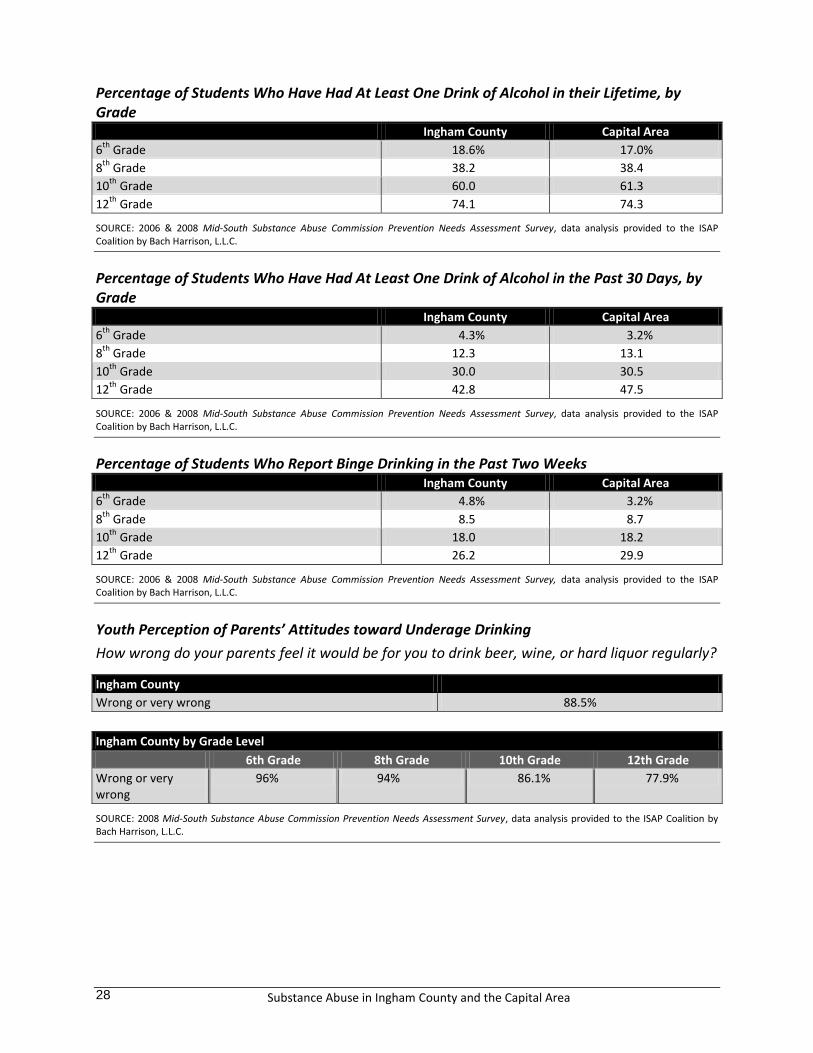
The average age at which students in Ingham County and the capital area who drink start to regularly use alcohol is just under age 15, as reported by students who took the Mid-South Substance Abuse Commission (MSSAC) 2008 Prevention Needs Assessment (PNA) Survey. These students are beginning to experiment with alcohol at an even younger age. On the average, students in Ingham County and the capital area who have ever had a drink indicate they had their first drink of alcohol (more than a sip or two) at just under age 13. In fact, about 64 percent of tenth-grade students taking the PNA survey in Ingham County and about 62 percent of tenth-grade students surveyed in the 2008 capital area report having their first drink of alcohol at age 13.
Of the students surveyed in Ingham County through the Prevention Needs Assessment Survey, 74 percent of 12th graders report that they have had at least one drink of alcohol (more than a few sips) in their lifetime and 43 percent report that they have had at least one drink of alcohol in the past 30 days. The data demonstrate that as students get older their use of alcohol increases substantially, even though they are still under the legal drinking age.
Percentage of Students Who Have Had At Least One Drink of Alcohol, by Grade
SOURCE: Mid-South Substance Abuse Commission 2008 Prevention Needs Assessment Survey, data analysis provided to the ISAP Coalition by Bach Harrison, L.L.C., June 2009.
Indicator: Self-reported binge drinking among youth
Measure
Percentage of students who report having five or more drinks of alcohol in a row on one or more occasions in the past two weeks
Substance Abuse in Ingham County and the Capital Area 6
Why is this indicator important?
While underage drinkers tend to drink less often than adults, when they do drink they are more likely to drink heavily. Data from the 2008 National Household Survey on Drug Use and Health show that while 42.7 percent of 12- to 17-year-olds do not drink, of those who do, ** percent binge drink, compared to 36.4 percent of adults aged 26 to 34. Older teens that drinks are even more likely to binge drink. Of those who drink, 17.2 percent of 16- to 17-year-olds and 33.7 percent of 18- to 20-year-olds binge drink. Binge drinking increases the likelihood of risky behaviors, such as unsafe sex, driving under the influence, and the use of illicit drugs. The high blood alcohol levels caused by binge drinking can result in blackouts and even death.
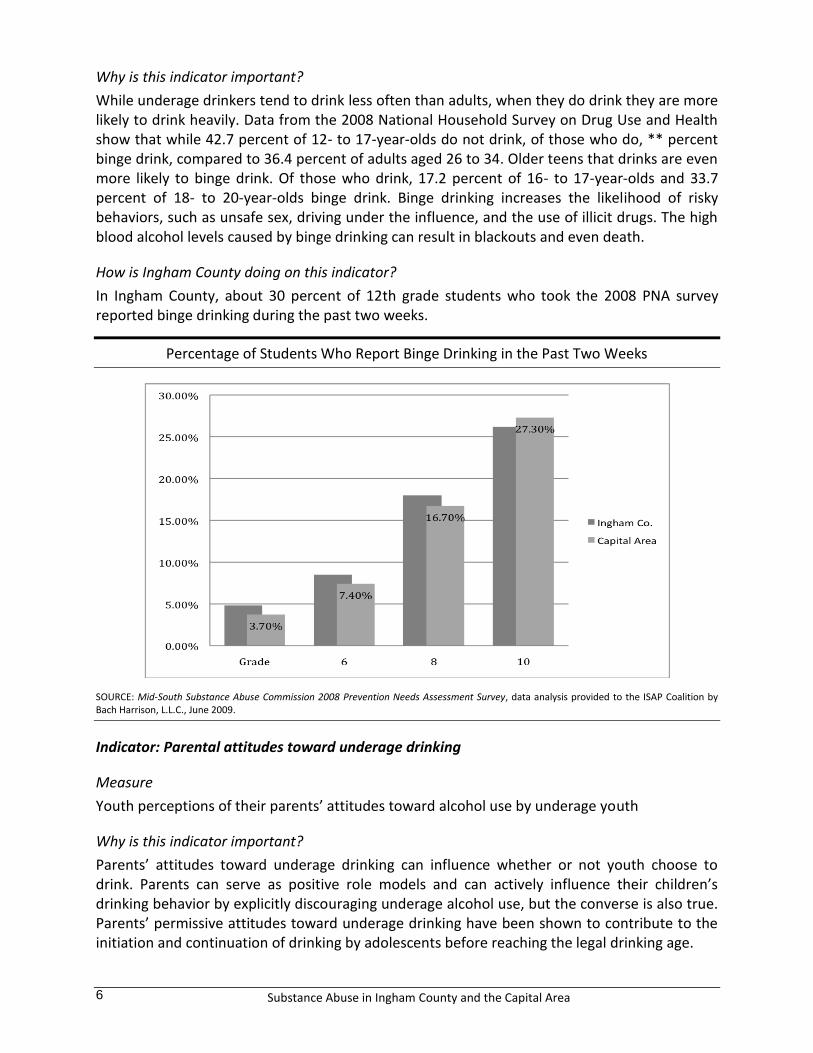
How is Ingham County doing on this indicator?
In Ingham County, about 30 percent of 12th grade students who took the 2008 PNA survey reported binge drinking during the past two weeks.
Percentage of Students Who Report Binge Drinking in the Past Two Weeks
SOURCE: Mid-South Substance Abuse Commission 2008 Prevention Needs Assessment Survey, data analysis provided to the ISAP Coalition by Bach Harrison, L.L.C., June 2009.
Youth perceptions of their parents’ attitudes toward alcohol use by underage youth
Why is this indicator important?
Parents’ attitudes toward underage drinking can influence whether or not youth choose to drink. Parents can serve as positive role models and can actively influence their children’s drinking behavior by explicitly discouraging underage alcohol use, but the converse is also true. Parents’ permissive attitudes toward underage drinking have been shown to contribute to the initiation and continuation of drinking by adolescents before reaching the legal drinking age.
Substance Abuse in Ingham County and the Capital Area 7
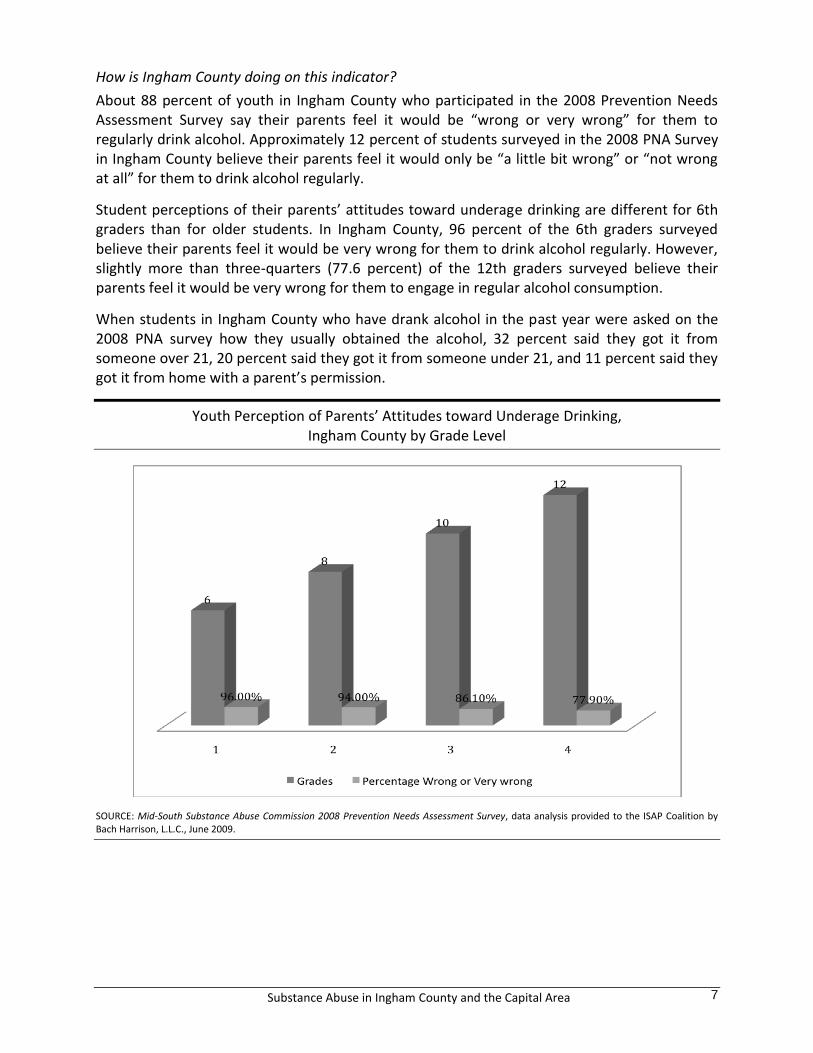
How is Ingham County doing on this indicator?
About 88 percent of youth in Ingham County who participated in the 2008 Prevention Needs Assessment Survey say their parents feel it would be “wrong or very wrong” for them to regularly drink alcohol. Approximately 12 percent of students surveyed in the 2008 PNA Survey in Ingham County believe their parents feel it would only be “a little bit wrong” or “not wrong at all” for them to drink alcohol regularly.
Student perceptions of their parents’ attitudes toward underage drinking are different for 6th graders than for older students. In Ingham County, 96 percent of the 6th graders surveyed believe their parents feel it would be very wrong for them to drink alcohol regularly. However, slightly more than three-quarters (77.6 percent) of the 12th graders surveyed believe their parents feel it would be very wrong for them to engage in regular alcohol consumption.
When students in Ingham County who have drank alcohol in the past year were asked on the 2008 PNA survey how they usually obtained the alcohol, 32 percent said they got it from someone over 21, 20 percent said they got it from someone under 21, and 11 percent said they got it from home with a parent’s permission.
Youth Perception of Parents’ Attitudes toward Underage Drinking, Ingham County by Grade Level
SOURCE: Mid-South Substance Abuse Commission 2008 Prevention Needs Assessment Survey, data analysis provided to the ISAP Coalition by Bach Harrison, L.L.C., June 2009.
Substance Abuse in Ingham County and the Capital Area 8
Indicator: Alcohol-related arrests
Measure:
Juvenile and adult arrest rates for liquor law violations
Why is this indicator important?
The number and rate of alcohol-related arrests for both the juvenile and adult population reflect not only the number of violations that occur but also the level of law enforcement aimed at alcohol abuse and the type of state and local statutes that exist. Liquor law offenses include the unlawful acquiring, manufacturing, transporting, selling, or possession of intoxicating alcoholic liquor. They do not include driving under the influence or public drunkenness.
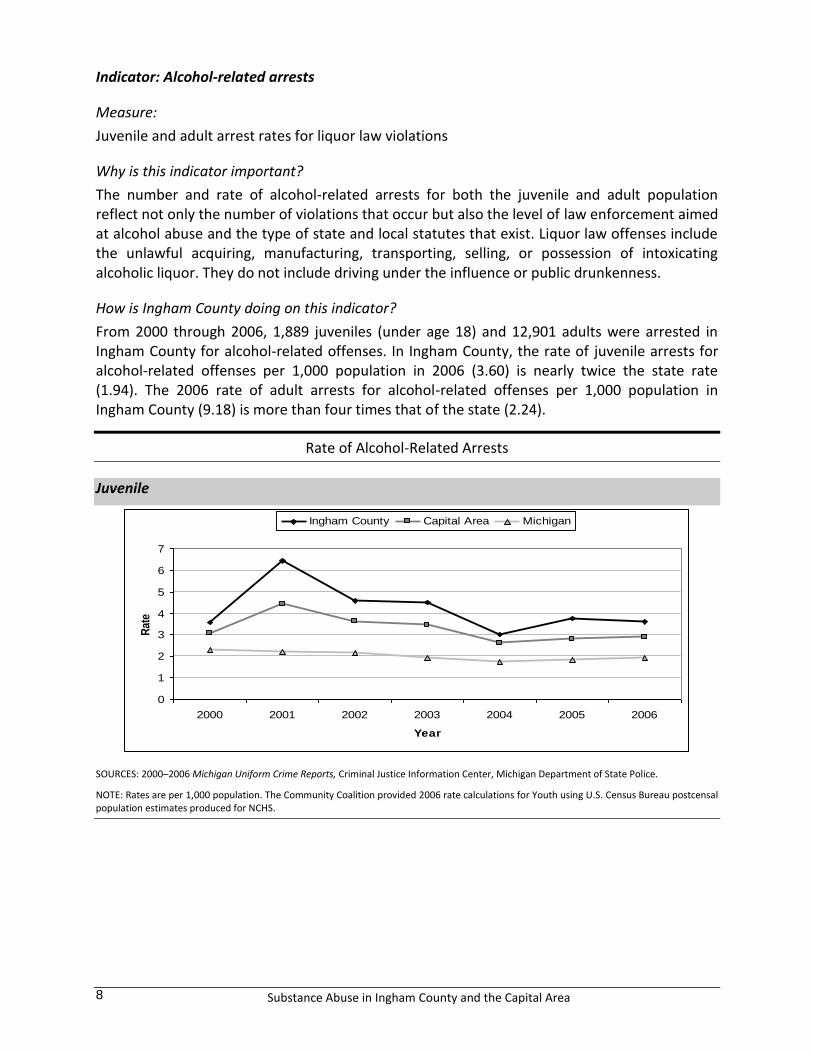
How is Ingham County doing on this indicator?
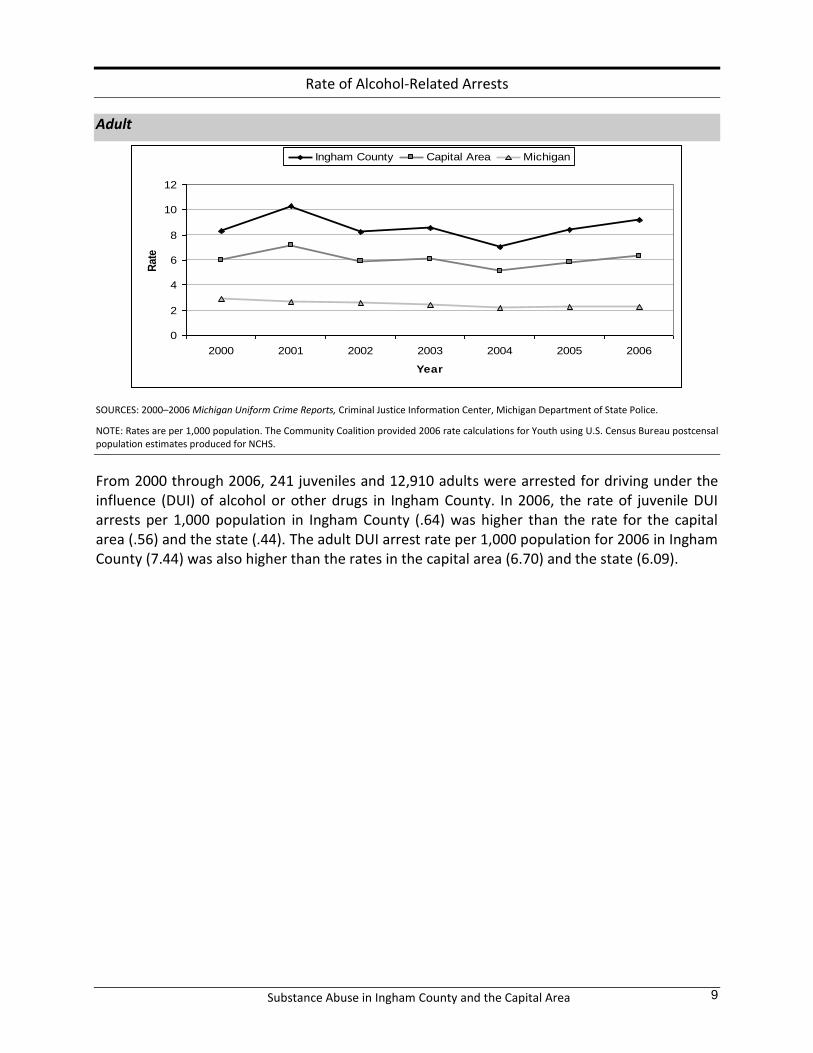
From 2000 through 2006, 1,889 juveniles (under age 18) and 12,901 adults were arrested in Ingham County for alcohol-related offenses. In Ingham County, the rate of juvenile arrests for alcohol-related offenses per 1,000 population in 2006 (3.60) is nearly twice the state rate (1.94). The 2006 rate of adult arrests for alcohol-related offenses per 1,000 population in Ingham County (9.18) is more than four times that of the state (2.24).
Rate of Alcohol-Related Arrests
Juvenile
0
1
2
3
4
5
6
7
2000 2001 2002 2003 2004 2005 2006
Year
Rat
e
Ingham County Capital Area Michigan
SOURCES: 2000–2006 Michigan Uniform Crime Reports, Criminal Justice Information Center, Michigan Department of State Police.
NOTE: Rates are per 1,000 population. The Community Coalition provided 2006 rate calculations for Youth using U.S. Census Bureau postcensal population estimates produced for NCHS.
Substance Abuse in Ingham County and the Capital Area 9
Rate of Alcohol-Related Arrests
Adult
0
2
4
6
8
10
12
2000 2001 2002 2003 2004 2005 2006
Year
Rate
Ingham County Capital Area Michigan
SOURCES: 2000–2006 Michigan Uniform Crime Reports, Criminal Justice Information Center, Michigan Department of State Police.
NOTE: Rates are per 1,000 population. The Community Coalition provided 2006 rate calculations for Youth using U.S. Census Bureau postcensal population estimates produced for NCHS.
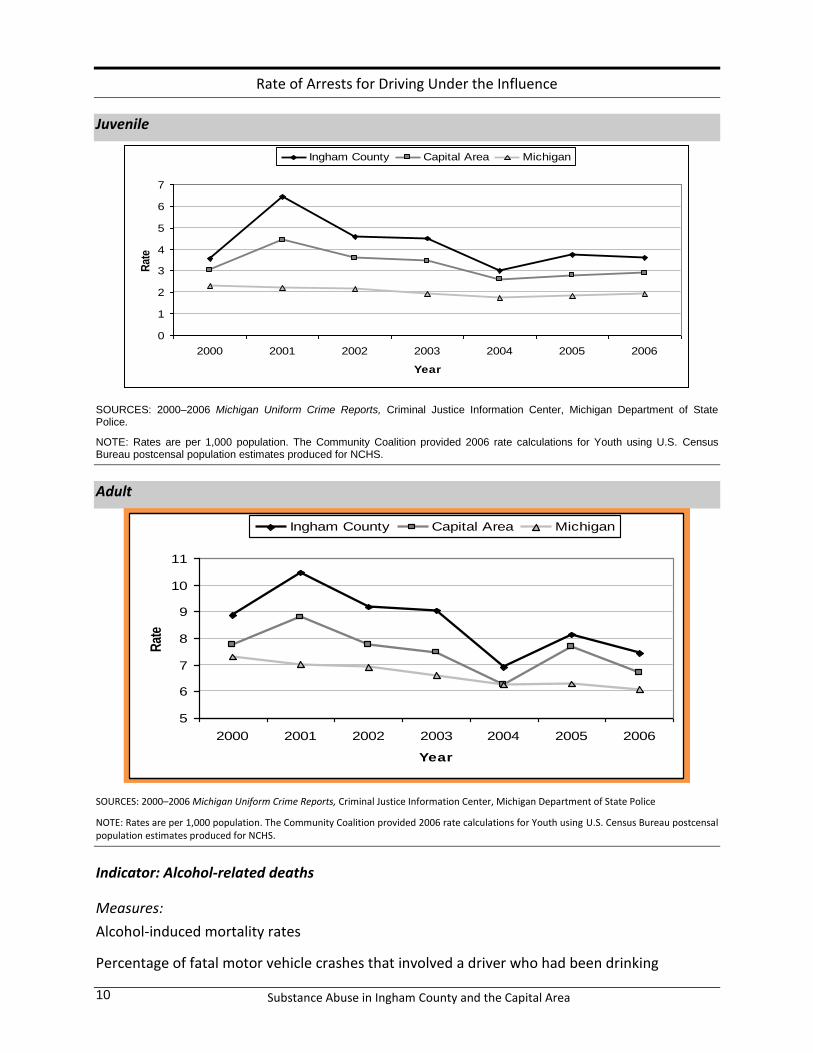
From 2000 through 2006, 241 juveniles and 12,910 adults were arrested for driving under the influence (DUI) of alcohol or other drugs in Ingham County. In 2006, the rate of juvenile DUI arrests per 1,000 population in Ingham County (.64) was higher than the rate for the capital area (.56) and the state (.44). The adult DUI arrest rate per 1,000 population for 2006 in Ingham County (7.44) was also higher than the rates in the capital area (6.70) and the state (6.09).
Substance Abuse in Ingham County and the Capital Area 10
Rate of Arrests for Driving Under the Influence
Juvenile
0
1
2
3
4
5
6
7
2000 2001 2002 2003 2004 2005 2006
Year
Rat
eIngham County Capital Area Michigan
SOURCES: 2000–2006 Michigan Uniform Crime Reports, Criminal Justice Information Center, Michigan Department of State Police.
NOTE: Rates are per 1,000 population. The Community Coalition provided 2006 rate calculations for Youth using U.S. Census Bureau postcensal population estimates produced for NCHS.
Adult
5
6
7
8
9
10
11
2000 2001 2002 2003 2004 2005 2006
Year
Rat
e
Ingham County Capital Area Michigan
SOURCES: 2000–2006 Michigan Uniform Crime Reports, Criminal Justice Information Center, Michigan Department of State Police
NOTE: Rates are per 1,000 population. The Community Coalition provided 2006 rate calculations for Youth using U.S. Census Bureau postcensal population estimates produced for NCHS.
Indicator: Alcohol-related deaths
Measures:
Alcohol-induced mortality rates
Percentage of fatal motor vehicle crashes that involved a driver who had been drinking
Substance Abuse in Ingham County and the Capital Area 11
Why is this indicator important?
Alcohol abuse is the third leading cause of preventable death behind smoking and obesity. Death related specifically to alcohol can result from long-term heavy drinking (e.g., chronic liver disease) or from one single drinking episode (e.g., traffic fatalities).
Alcohol-induced mortality includes deaths due to alcohol psychoses, alcohol dependence syndrome, non-dependent abuse of alcohol, alcohol-induced chronic liver disease and cirrhosis, and alcohol poisoning.
How is Ingham County doing on this indicator?
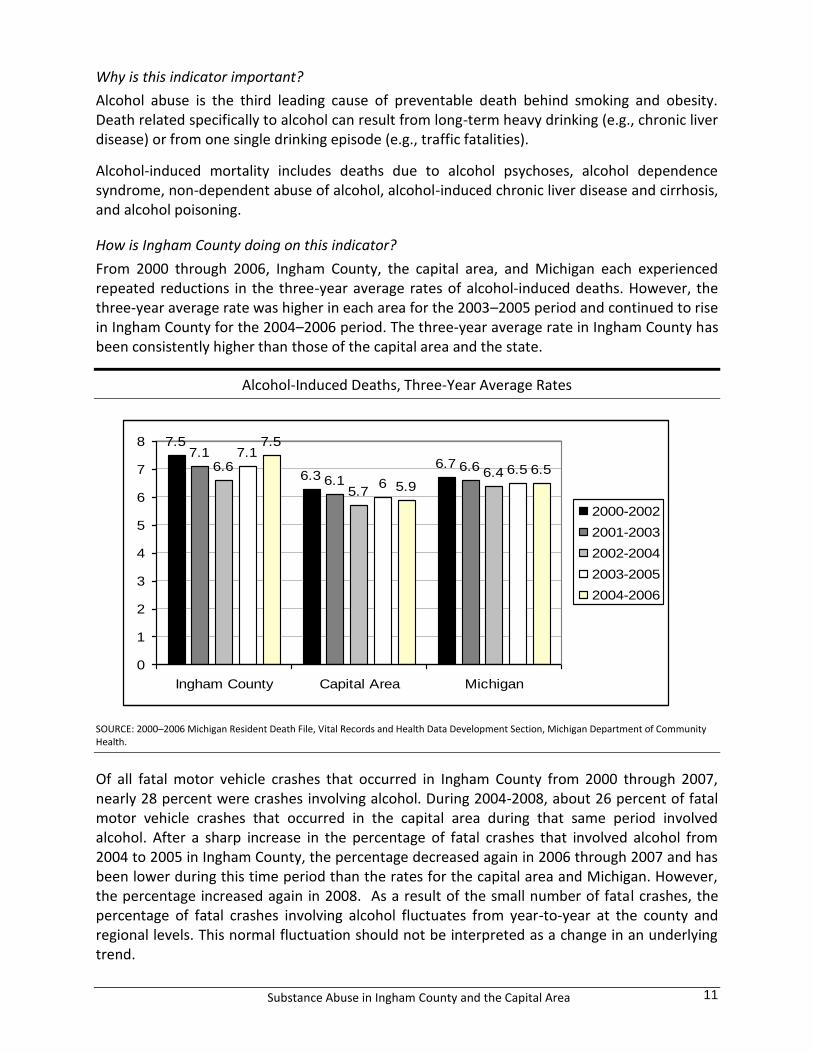
From 2000 through 2006, Ingham County, the capital area, and Michigan each experienced repeated reductions in the three-year average rates of alcohol-induced deaths. However, the three-year average rate was higher in each area for the 2003–2005 period and continued to rise in Ingham County for the 2004–2006 period. The three-year average rate in Ingham County has been consistently higher than those of the capital area and the state.
Alcohol-Induced Deaths, Three-Year Average Rates
7.5
6.36.7
7.1
6.16.66.6
5.7
6.4
7.1
66.5
7.5
5.9
6.5
0
1
2
3
4
5
6
7
8
Ingham County Capital Area Michigan
2000-2002
2001-2003
2002-2004
2003-2005
2004-2006
SOURCE: 2000–2006 Michigan Resident Death File, Vital Records and Health Data Development Section, Michigan Department of Community Health.
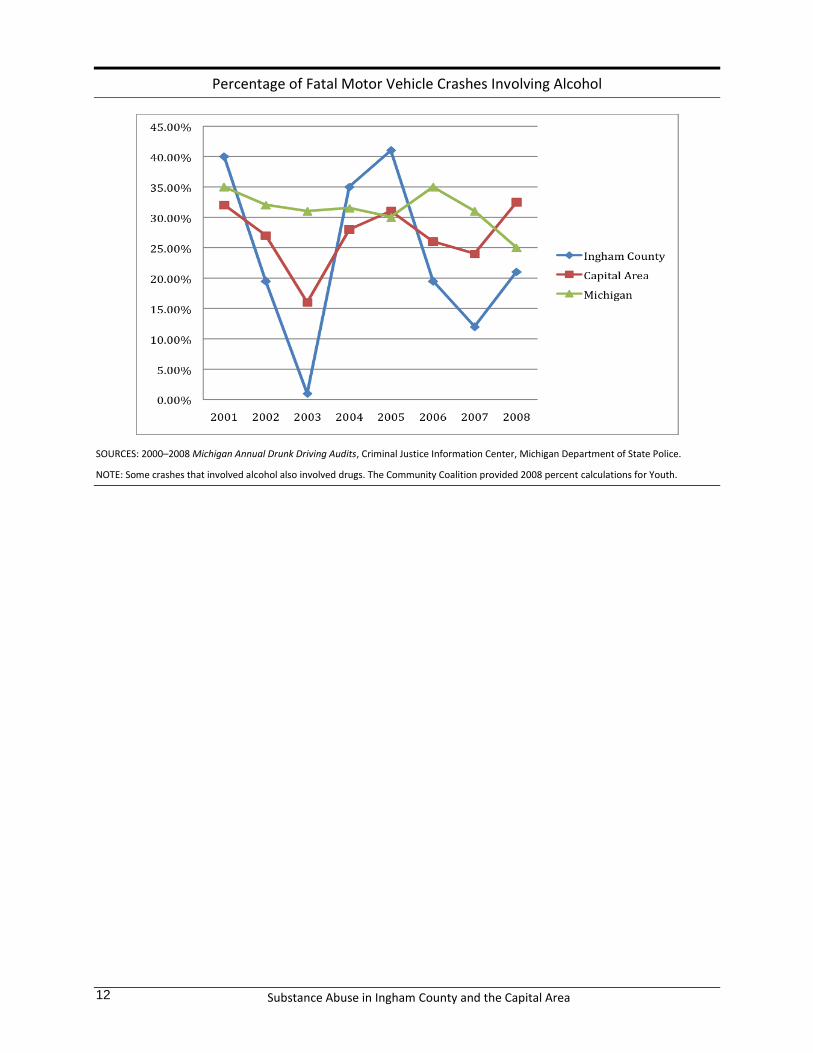
Of all fatal motor vehicle crashes that occurred in Ingham County from 2000 through 2007, nearly 28 percent were crashes involving alcohol. During 2004-2008, about 26 percent of fatal motor vehicle crashes that occurred in the capital area during that same period involved alcohol. After a sharp increase in the percentage of fatal crashes that involved alcohol from 2004 to 2005 in Ingham County, the percentage decreased again in 2006 through 2007 and has been lower during this time period than the rates for the capital area and Michigan. However, the percentage increased again in 2008. As a result of the small number of fatal crashes, the percentage of fatal crashes involving alcohol fluctuates from year-to-year at the county and regional levels. This normal fluctuation should not be interpreted as a change in an underlying trend.
Substance Abuse in Ingham County and the Capital Area 12
Percentage of Fatal Motor Vehicle Crashes Involving Alcohol
SOURCES: 2000–2008 Michigan Annual Drunk Driving Audits, Criminal Justice Information Center, Michigan Department of State Police.
NOTE: Some crashes that involved alcohol also involved drugs. The Community Coalition provided 2008 percent calculations for Youth.
Substance Abuse in Ingham County and the Capital Area 13
Tobacco
The harmful effects of smoking have been well documented, yet tobacco use remains the leading preventable cause of disease and death in the United States. While smoking rates have declined in recent decades in the United States, every day nearly 5,000 people under 18 years of age try their first cigarette.5
Indicator: Cigarette smoking by youth
Measure
Age of initiation: Average age at which students first smoked a cigarette, even just a puff
Lifetime use: Percentage of students who report ever smoking cigarettes
Current use: Percentage of students who report having smoked cigarettes on one or more of the past 30 days
Heavy use: Percentage of students who report smoking about a half-pack or more of cigarettes per day
Why is this indicator important? Smoking affects reproduction and the heart and lungs of adolescents and young adults, causes death from cancer and cardiovascular diseases as early as middle age, and shortens the life expectancy of smokers.
How is Ingham County doing on this indicator?
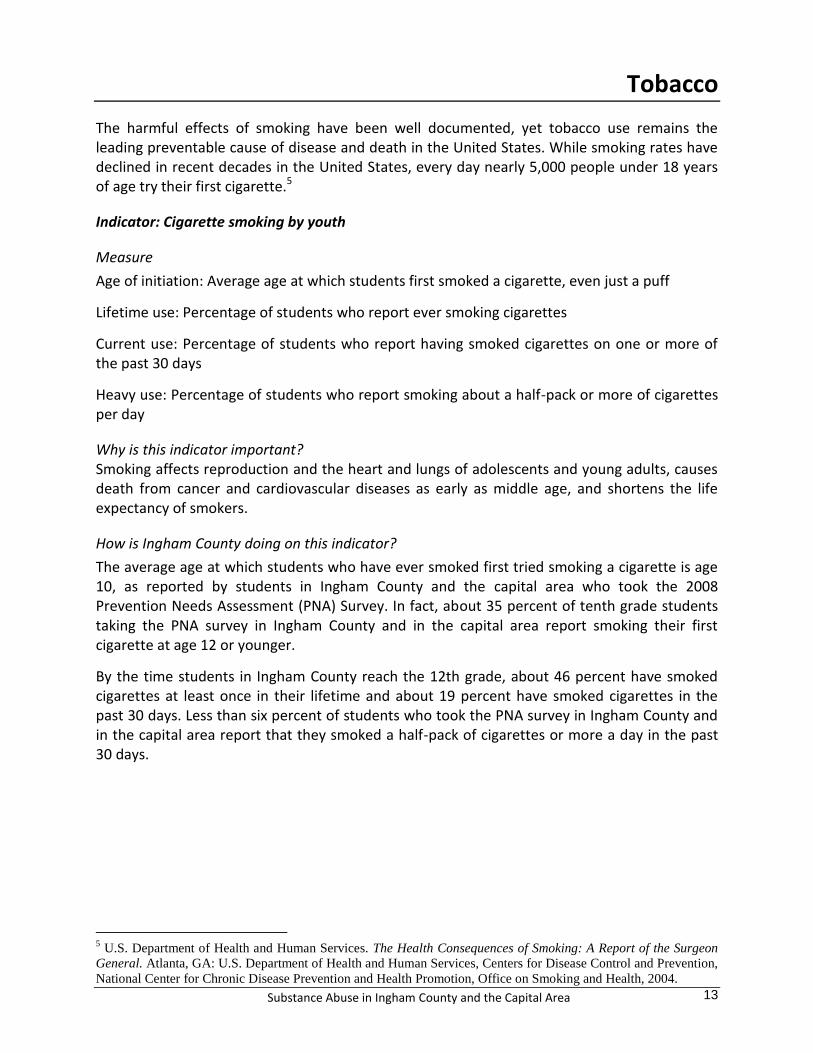
The average age at which students who have ever smoked first tried smoking a cigarette is age 10, as reported by students in Ingham County and the capital area who took the 2008 Prevention Needs Assessment (PNA) Survey. In fact, about 35 percent of tenth grade students taking the PNA survey in Ingham County and in the capital area report smoking their first cigarette at age 12 or younger.
By the time students in Ingham County reach the 12th grade, about 46 percent have smoked cigarettes at least once in their lifetime and about 19 percent have smoked cigarettes in the past 30 days. Less than six percent of students who took the PNA survey in Ingham County and in the capital area report that they smoked a half-pack of cigarettes or more a day in the past 30 days.
5 U.S. Department of Health and Human Services. The Health Consequences of Smoking: A Report of the Surgeon
General. Atlanta, GA: U.S. Department of Health and Human Services, Centers for Disease Control and Prevention,
National Center for Chronic Disease Prevention and Health Promotion, Office on Smoking and Health, 2004.
Substance Abuse in Ingham County and the Capital Area 14
Percentage of Students Who Report Smoking Cigarettes
SOURCE: Mid-South Substance Abuse Commission 2008 Prevention Needs Assessment Survey, data analysis provided to the ISAP Coalition by Bach Harrison, L.L.C., June 2007.
Indicator: Parental attitudes toward smoking by underage youth
Measure
Youth perception of parental attitudes toward smoking by underage youth
Why is this indicator important?
Parents’ attitudes toward substance use, such as smoking, can influence whether or not youth begin smoking.
How is Ingham County doing on this indicator?
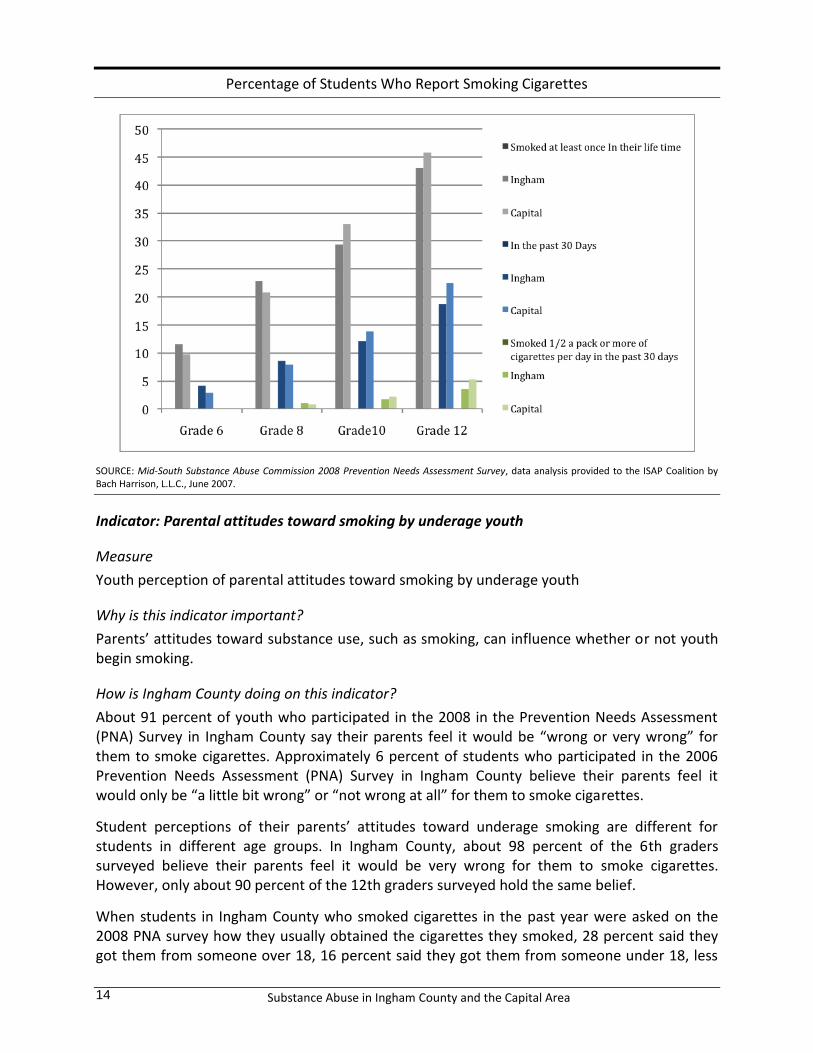
About 91 percent of youth who participated in the 2008 in the Prevention Needs Assessment (PNA) Survey in Ingham County say their parents feel it would be “wrong or very wrong” for them to smoke cigarettes. Approximately 6 percent of students who participated in the 2006 Prevention Needs Assessment (PNA) Survey in Ingham County believe their parents feel it would only be “a little bit wrong” or “not wrong at all” for them to smoke cigarettes.
Student perceptions of their parents’ attitudes toward underage smoking are different for students in different age groups. In Ingham County, about 98 percent of the 6th graders surveyed believe their parents feel it would be very wrong for them to smoke cigarettes. However, only about 90 percent of the 12th graders surveyed hold the same belief.
When students in Ingham County who smoked cigarettes in the past year were asked on the 2008 PNA survey how they usually obtained the cigarettes they smoked, 28 percent said they got them from someone over 18, 16 percent said they got them from someone under 18, less
Substance Abuse in Ingham County and the Capital Area 15
than 3 percent said they got them from home with a parent’s permission, and less than 2 percent bought them with a fake ID.
Youth Perception of Parents’ Attitudes toward Smoking by Youth by Grade Level, Ingham County
SOURCE: Mid-South Substance Abuse Commission 2008 Prevention Needs Assessment Survey, data analysis provided to the ISAP Coalition by Bach Harrison, L.L.C., June 2009.
Indicator: Cigarette smoking by adults
Measure
Percentage of adults who report smoking cigarettes currently, every day or on some days
Why is this indicator important?
During the last four decades, the scientific evidence on smoking and disease has linked active smoking with an ever-growing list of diseases.6
How is Ingham County doing on this indicator?
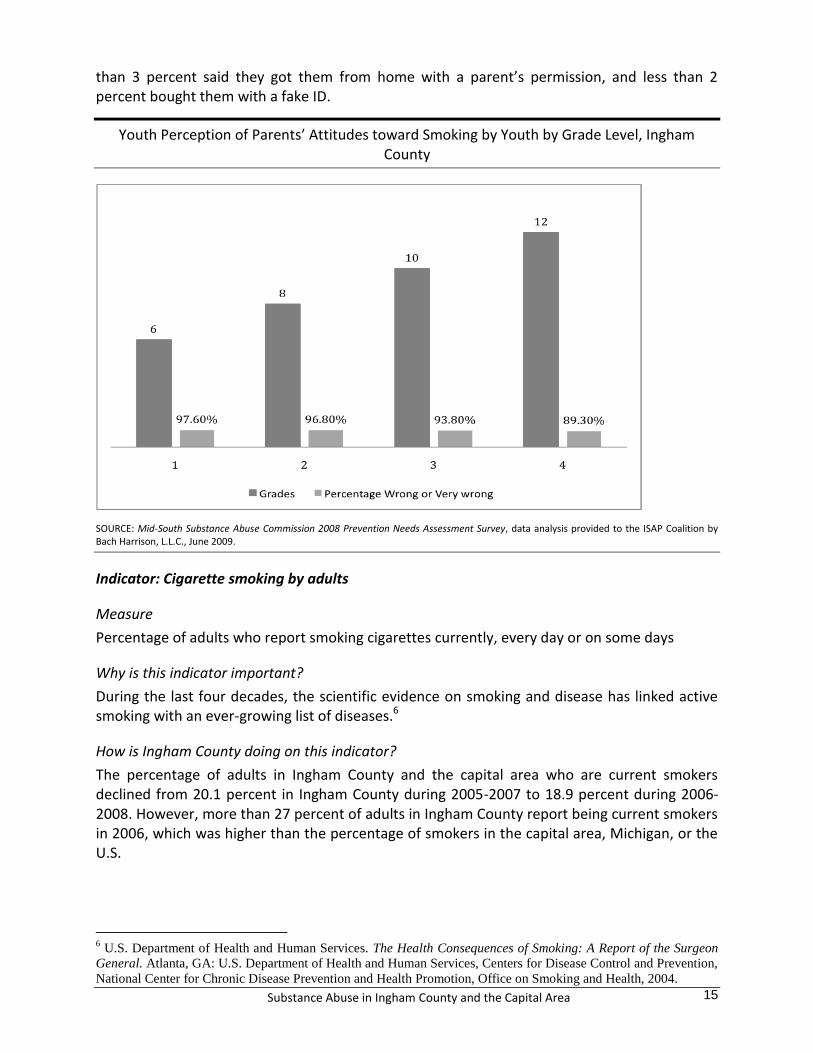
The percentage of adults in Ingham County and the capital area who are current smokers declined from 20.1 percent in Ingham County during 2005-2007 to 18.9 percent during 2006-2008. However, more than 27 percent of adults in Ingham County report being current smokers in 2006, which was higher than the percentage of smokers in the capital area, Michigan, or the U.S.
6 U.S. Department of Health and Human Services. The Health Consequences of Smoking: A Report of the Surgeon
General. Atlanta, GA: U.S. Department of Health and Human Services, Centers for Disease Control and Prevention,
National Center for Chronic Disease Prevention and Health Promotion, Office on Smoking and Health, 2004.
Substance Abuse in Ingham County and the Capital Area 16
Percentage of Adults Who Are Current Smokers
SOURCES: Mid-Michigan Behavioral Risk Factor Survey (1997, 2000, 2003, 2006, 2007), Ingham County Health Department; Capital Area Behavioral Risk Factor and Social Capital Survey 2008, Ingham County Health Department; Michigan Behavioral Risk Factor Survey, Michigan Department of Community Health; Behavioral Risk Factor Surveillance System, Centers for Disease Control and Prevention.
Indicator: Cigarette smoking during pregnancy
Measure
Percentage of infants whose mother smoked during pregnancy
Why is this indicator important?
Smoking during pregnancy has negative effects on infant birth weight and increases the chances of premature rupture of the membranes, placenta previa, and preterm delivery. The risk for infant mortality, particularly sudden infant death syndrome (SIDS), also increases for infants whose mothers smoked during pregnancy.
How is Ingham County doing on this indicator?
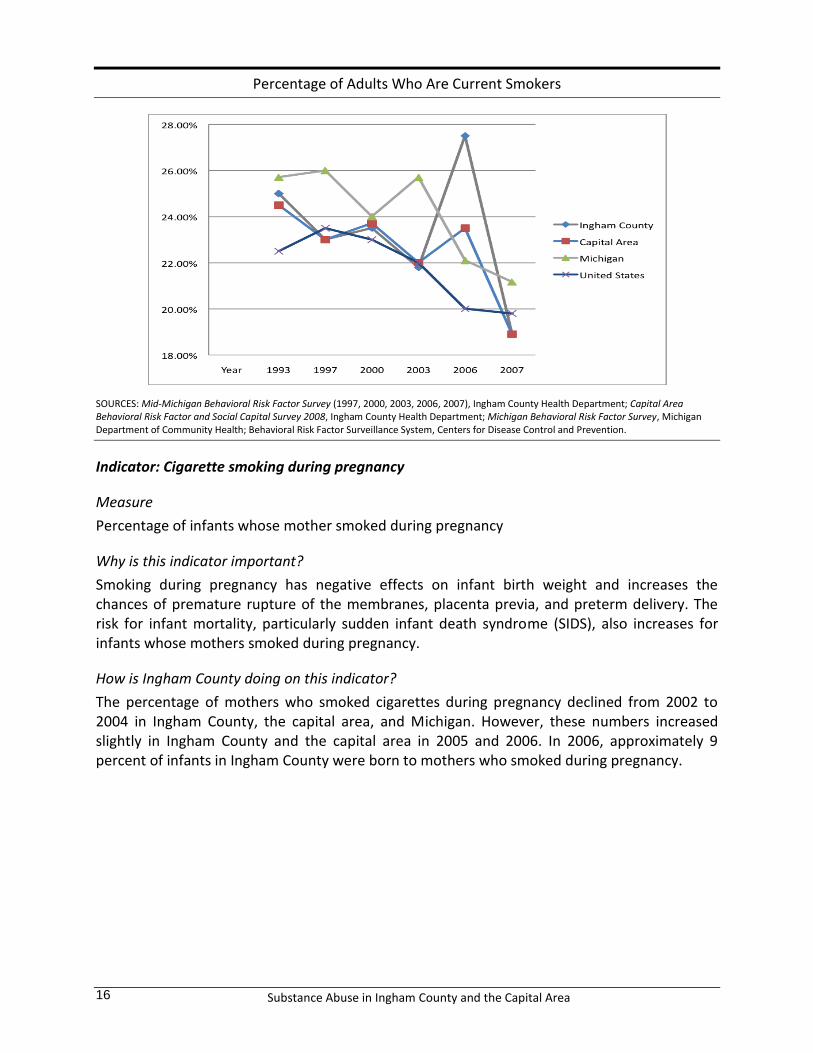
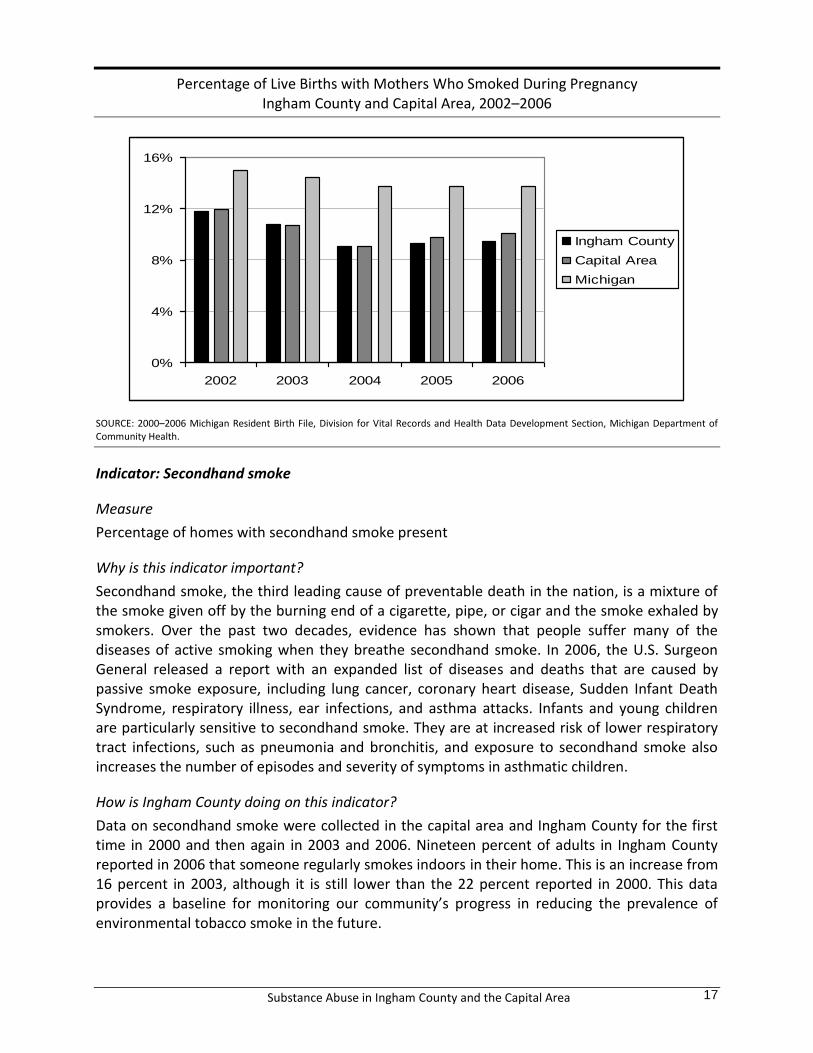
The percentage of mothers who smoked cigarettes during pregnancy declined from 2002 to 2004 in Ingham County, the capital area, and Michigan. However, these numbers increased slightly in Ingham County and the capital area in 2005 and 2006. In 2006, approximately 9 percent of infants in Ingham County were born to mothers who smoked during pregnancy.
Substance Abuse in Ingham County and the Capital Area 17
Percentage of Live Births with Mothers Who Smoked During Pregnancy Ingham County and Capital Area, 2002–2006
0%
4%
8%
12%
16%
2002 2003 2004 2005 2006
Ingham County
Capital Area
Michigan
SOURCE: 2000–2006 Michigan Resident Birth File, Division for Vital Records and Health Data Development Section, Michigan Department of Community Health.
Indicator: Secondhand smoke
Measure
Percentage of homes with secondhand smoke present
Why is this indicator important?
Secondhand smoke, the third leading cause of preventable death in the nation, is a mixture of the smoke given off by the burning end of a cigarette, pipe, or cigar and the smoke exhaled by smokers. Over the past two decades, evidence has shown that people suffer many of the diseases of active smoking when they breathe secondhand smoke. In 2006, the U.S. Surgeon General released a report with an expanded list of diseases and deaths that are caused by passive smoke exposure, including lung cancer, coronary heart disease, Sudden Infant Death Syndrome, respiratory illness, ear infections, and asthma attacks. Infants and young children are particularly sensitive to secondhand smoke. They are at increased risk of lower respiratory tract infections, such as pneumonia and bronchitis, and exposure to secondhand smoke also increases the number of episodes and severity of symptoms in asthmatic children.
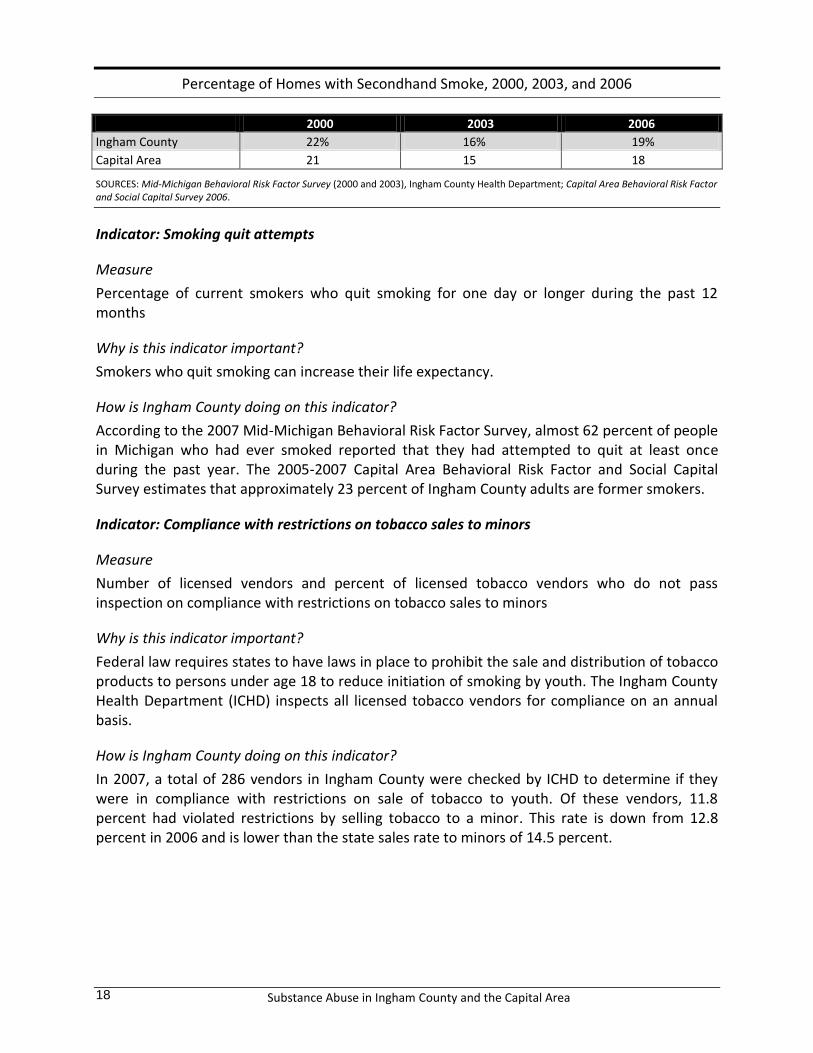
How is Ingham County doing on this indicator?
Data on secondhand smoke were collected in the capital area and Ingham County for the first time in 2000 and then again in 2003 and 2006. Nineteen percent of adults in Ingham County reported in 2006 that someone regularly smokes indoors in their home. This is an increase from 16 percent in 2003, although it is still lower than the 22 percent reported in 2000. This data provides a baseline for monitoring our community’s progress in reducing the prevalence of environmental tobacco smoke in the future.
Substance Abuse in Ingham County and the Capital Area 18
Percentage of Homes with Secondhand Smoke, 2000, 2003, and 2006
2000 2003 2006
Ingham County 22% 16% 19%
Capital Area 21 15 18
SOURCES: Mid-Michigan Behavioral Risk Factor Survey (2000 and 2003), Ingham County Health Department; Capital Area Behavioral Risk Factor and Social Capital Survey 2006.
Indicator: Smoking quit attempts
Measure
Percentage of current smokers who quit smoking for one day or longer during the past 12 months
Why is this indicator important?
Smokers who quit smoking can increase their life expectancy.
How is Ingham County doing on this indicator?
According to the 2007 Mid-Michigan Behavioral Risk Factor Survey, almost 62 percent of people in Michigan who had ever smoked reported that they had attempted to quit at least once during the past year. The 2005-2007 Capital Area Behavioral Risk Factor and Social Capital Survey estimates that approximately 23 percent of Ingham County adults are former smokers.
Indicator: Compliance with restrictions on tobacco sales to minors
Measure
Number of licensed vendors and percent of licensed tobacco vendors who do not pass inspection on compliance with restrictions on tobacco sales to minors
Why is this indicator important?
Federal law requires states to have laws in place to prohibit the sale and distribution of tobacco products to persons under age 18 to reduce initiation of smoking by youth. The Ingham County Health Department (ICHD) inspects all licensed tobacco vendors for compliance on an annual basis.
How is Ingham County doing on this indicator?
In 2007, a total of 286 vendors in Ingham County were checked by ICHD to determine if they were in compliance with restrictions on sale of tobacco to youth. Of these vendors, 11.8 percent had violated restrictions by selling tobacco to a minor. This rate is down from 12.8 percent in 2006 and is lower than the state sales rate to minors of 14.5 percent.
Substance Abuse in Ingham County and the Capital Area 19
Illicit Drugs
While alcohol is the most commonly abused drug, use and abuse of illicit drugs is also prevalent in Ingham County and the capital area. The most commonly used illicit drugs are marijuana, cocaine, and heroin. This report provides an overview of the use and abuse of these drugs as well as methamphetamine, a powerful, addictive central nervous system stimulant with great potential for abuse and dependence.
Indicator: Self-reported illicit drug use by youth
Measure
Lifetime use: Percentage of students who report using marijuana, cocaine, opiates, or methamphetamines on one or more days during their life
Thirty-day use: Percentage of students who report using marijuana, cocaine, opiates, or methamphetamines on one or more of the past 30 days
Why is this indicator important?
While adolescents use alcohol and cigarettes more than any other drug, they also experiment with and use other illegal drugs. Adolescents are influenced by several factors in their decisions about drug use, including the social acceptability of drug use, the perceived risk associated with drug use, their parents’ attitudes toward drug use, and the availability of drugs. Use of illegal drugs by adolescents is linked to poor academic performance, violence, and depression.
How is Ingham County doing on this indicator?
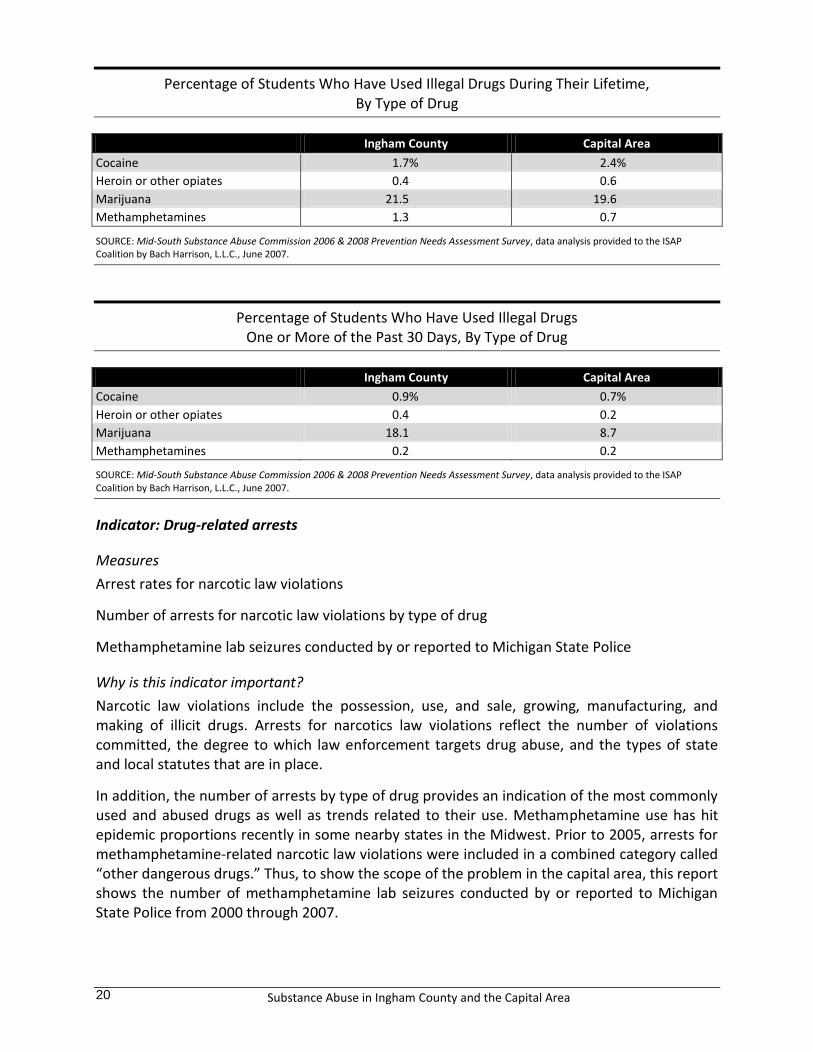
Approximately 19 percent of students in Ingham County who participated in the 2008 Prevention Needs Assessment (PNA) Survey report having used marijuana in their lifetime and almost 8 percent of those students have used it in the past 30 days. For the capital area, the percentages are about 18 percent and 8 percent, respectively. Far fewer students in Ingham County and in the capital area report having used cocaine, heroin, or methamphetamines in either their lifetime or the past 30 days. Slightly more than 3 percent of students in Ingham County and the capital area who participated in the PNA survey report having ever tried cocaine. About one sixth of those students have used cocaine in the past 30 days. Less than 1 percent of students in Ingham County and in the capital area have ever used heroin (0.6 percent in each) and about one eighth of those students report using heroin in the past 30 days. Slightly more than 1 percent of students in Ingham County and in the capital area report having tried methamphetamines in their lifetime, with about a third to a half of those having used meth in the past 30 days.
Substance Abuse in Ingham County and the Capital Area 20
Percentage of Students Who Have Used Illegal Drugs During Their Lifetime, By Type of Drug
Ingham County Capital Area
Cocaine 1.7% 2.4%
Heroin or other opiates 0.4 0.6
Marijuana 21.5 19.6
Methamphetamines 1.3 0.7
SOURCE: Mid-South Substance Abuse Commission 2006 & 2008 Prevention Needs Assessment Survey, data analysis provided to the ISAP Coalition by Bach Harrison, L.L.C., June 2007.
Percentage of Students Who Have Used Illegal Drugs One or More of the Past 30 Days, By Type of Drug
Ingham County Capital Area
Cocaine 0.9% 0.7%
Heroin or other opiates 0.4 0.2
Marijuana 18.1 8.7
Methamphetamines 0.2 0.2
SOURCE: Mid-South Substance Abuse Commission 2006 & 2008 Prevention Needs Assessment Survey, data analysis provided to the ISAP Coalition by Bach Harrison, L.L.C., June 2007.
Indicator: Drug-related arrests
Measures
Arrest rates for narcotic law violations
Number of arrests for narcotic law violations by type of drug
Methamphetamine lab seizures conducted by or reported to Michigan State Police
Why is this indicator important?
Narcotic law violations include the possession, use, and sale, growing, manufacturing, and making of illicit drugs. Arrests for narcotics law violations reflect the number of violations committed, the degree to which law enforcement targets drug abuse, and the types of state and local statutes that are in place.
In addition, the number of arrests by type of drug provides an indication of the most commonly used and abused drugs as well as trends related to their use. Methamphetamine use has hit epidemic proportions recently in some nearby states in the Midwest. Prior to 2005, arrests for methamphetamine-related narcotic law violations were included in a combined category called “other dangerous drugs.” Thus, to show the scope of the problem in the capital area, this report shows the number of methamphetamine lab seizures conducted by or reported to Michigan State Police from 2000 through 2007.
Substance Abuse in Ingham County and the Capital Area 21
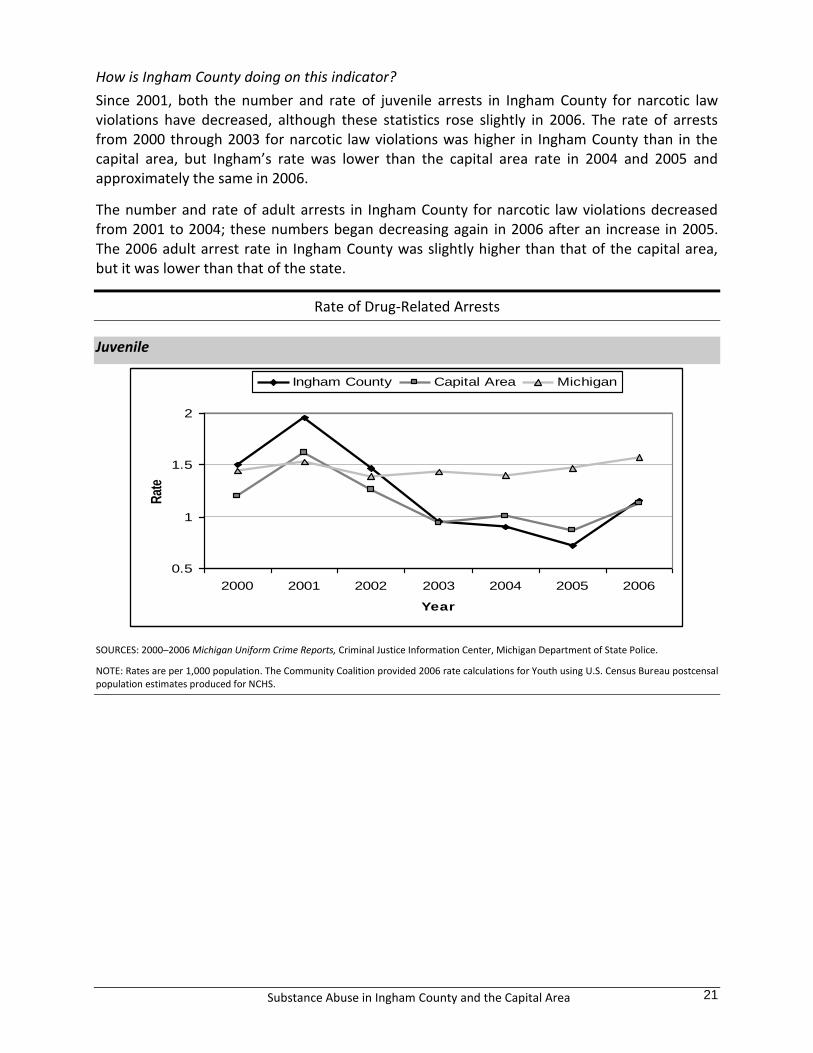
How is Ingham County doing on this indicator?
Since 2001, both the number and rate of juvenile arrests in Ingham County for narcotic law violations have decreased, although these statistics rose slightly in 2006. The rate of arrests from 2000 through 2003 for narcotic law violations was higher in Ingham County than in the capital area, but Ingham’s rate was lower than the capital area rate in 2004 and 2005 and approximately the same in 2006.
The number and rate of adult arrests in Ingham County for narcotic law violations decreased from 2001 to 2004; these numbers began decreasing again in 2006 after an increase in 2005. The 2006 adult arrest rate in Ingham County was slightly higher than that of the capital area, but it was lower than that of the state.
Rate of Drug-Related Arrests
Juvenile
0.5
1
1.5
2
2000 2001 2002 2003 2004 2005 2006
Year
Rat
e
Ingham County Capital Area Michigan
SOURCES: 2000–2006 Michigan Uniform Crime Reports, Criminal Justice Information Center, Michigan Department of State Police.
NOTE: Rates are per 1,000 population. The Community Coalition provided 2006 rate calculations for Youth using U.S. Census Bureau postcensal population estimates produced for NCHS.
Substance Abuse in Ingham County and the Capital Area 22
Rate of Drug-Related Arrests
Adult
2
3
4
5
6
2000 2001 2002 2003 2004 2005 2006
Year
Rat
e
Ingham County Capital Area Michigan
SOURCES: 2000–2006 Michigan Uniform Crime Reports, Criminal Justice Information Center, Michigan Department of State Police.
NOTE: Rates are per 1,000 population. The Community Coalition provided 2006 rate calculations for Youth using U.S. Census Bureau postcensal population estimates produced for NCHS.
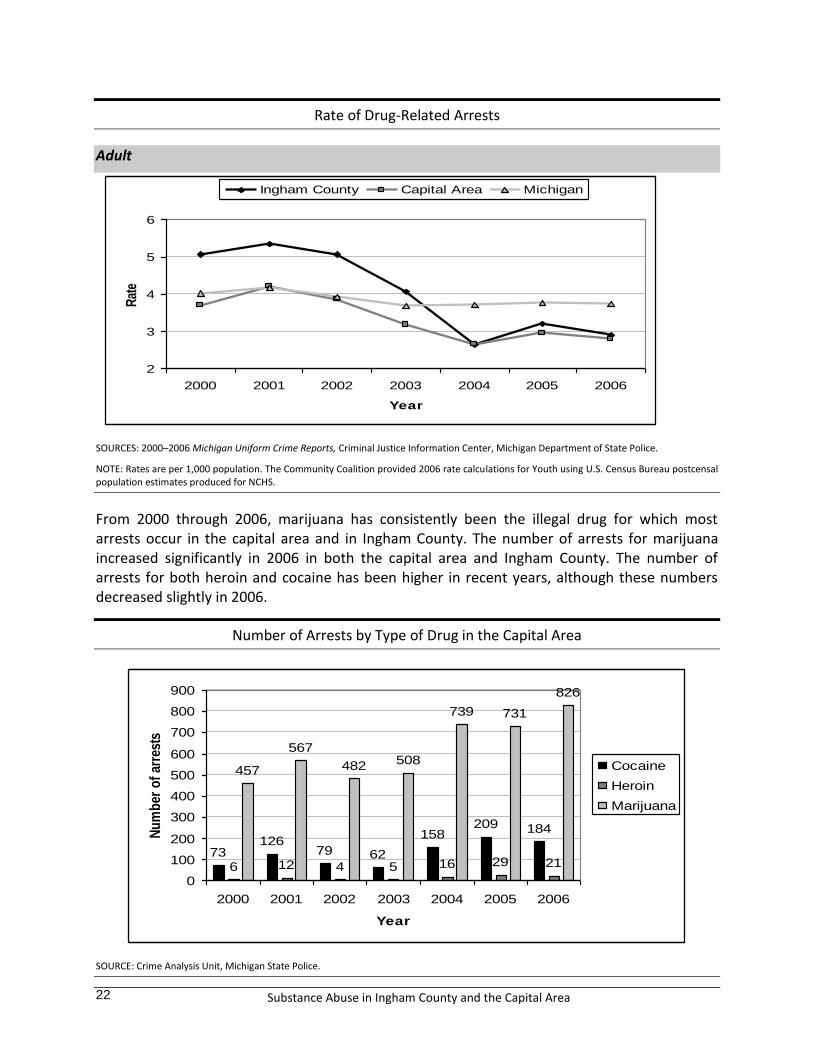
From 2000 through 2006, marijuana has consistently been the illegal drug for which most arrests occur in the capital area and in Ingham County. The number of arrests for marijuana increased significantly in 2006 in both the capital area and Ingham County. The number of arrests for both heroin and cocaine has been higher in recent years, although these numbers decreased slightly in 2006.
Number of Arrests by Type of Drug in the Capital Area
73126
79 62
158209 184
6 12 4 5 16 29 21
457
567
482 508
739 731
826
0
100
200
300
400
500
600
700
800
900
2000 2001 2002 2003 2004 2005 2006
Year
Nu
mb
er o
f ar
rest
s
Cocaine
Heroin
Marijuana
SOURCE: Crime Analysis Unit, Michigan State Police.
Substance Abuse in Ingham County and the Capital Area 23
Number of Arrests by Type of Drug in Ingham County
6086
50 43
116
168 149
6 10 4 1 16 27 16
261282
251 268
395437
497
0
100
200
300
400
500
600
2000 2001 2002 2003 2004 2005 2006
Year
Nu
mb
er
of
arre
sts
Cocaine
Heroin
Marijuana
SOURCE: Crime Analysis Unit, Michigan State Police.
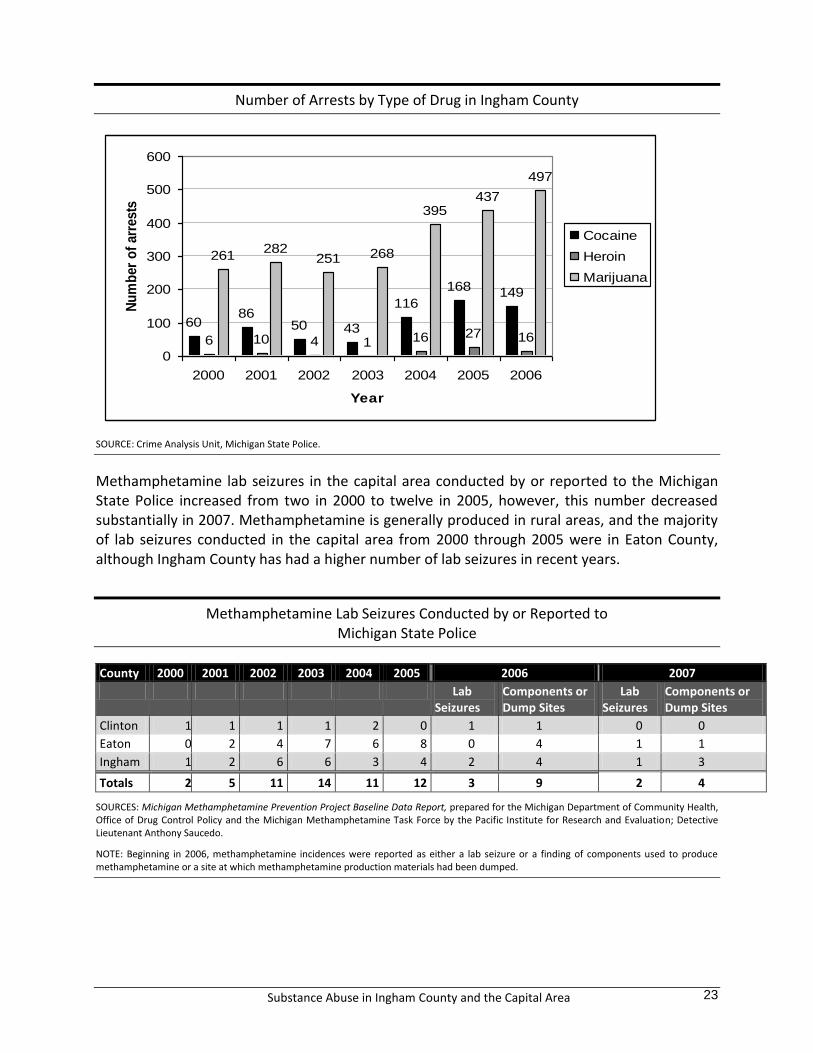
Methamphetamine lab seizures in the capital area conducted by or reported to the Michigan State Police increased from two in 2000 to twelve in 2005, however, this number decreased substantially in 2007. Methamphetamine is generally produced in rural areas, and the majority of lab seizures conducted in the capital area from 2000 through 2005 were in Eaton County, although Ingham County has had a higher number of lab seizures in recent years.
Methamphetamine Lab Seizures Conducted by or Reported to Michigan State Police
County 2000 2001 2002 2003 2004 2005 2006 2007
Lab Seizures
Components or Dump Sites
Lab Seizures
Components or Dump Sites
Clinton 1 1 1 1 2 0 1 1 0 0
Eaton 0 2 4 7 6 8 0 4 1 1
Ingham 1 2 6 6 3 4 2 4 1 3
Totals 2 5 11 14 11 12 3 9 2 4
SOURCES: Michigan Methamphetamine Prevention Project Baseline Data Report, prepared for the Michigan Department of Community Health, Office of Drug Control Policy and the Michigan Methamphetamine Task Force by the Pacific Institute for Research and Evaluation; Detective Lieutenant Anthony Saucedo.
NOTE: Beginning in 2006, methamphetamine incidences were reported as either a lab seizure or a finding of components used to produce methamphetamine or a site at which methamphetamine production materials had been dumped.
Substance Abuse in Ingham County and the Capital Area 24
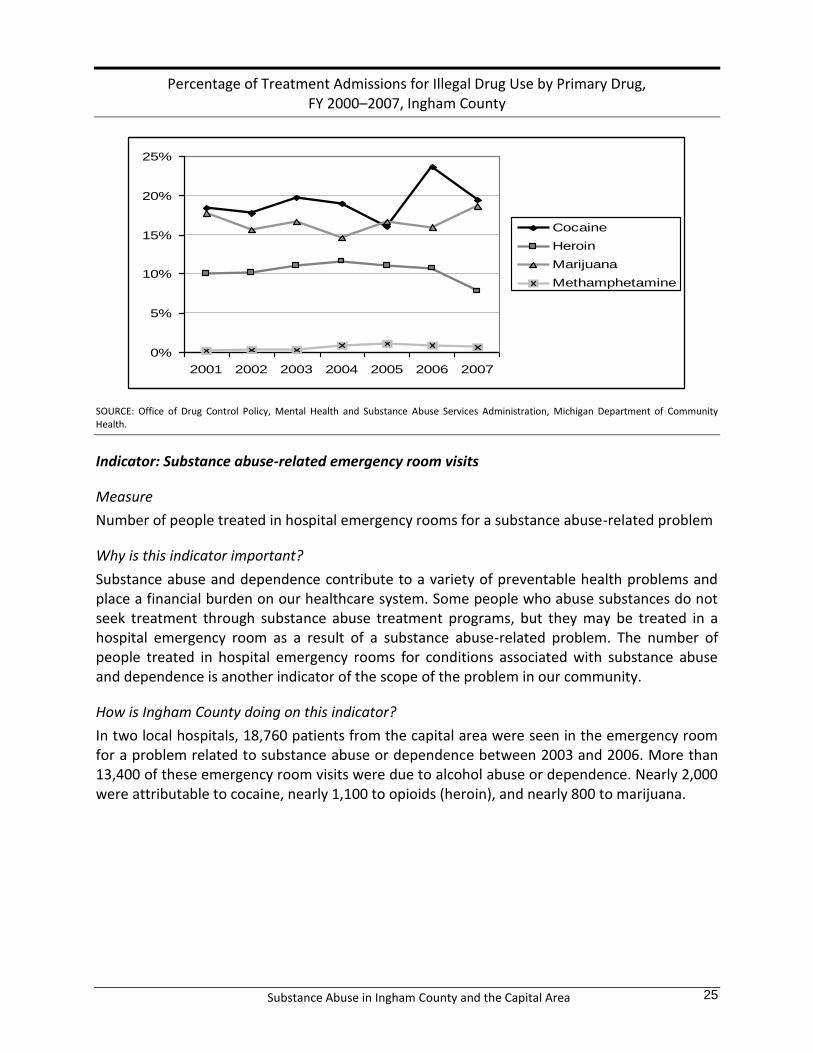
Indicator: Treatment admissions for drug addiction and dependence
Measure
Admissions to publicly funded treatment programs for illegal drug abuse and dependence by primary drug of abuse
Why is this indicator important?
These data suggest which drugs are most widely used and abused, which is essential information for targeting prevention efforts.
How is Ingham County doing on this indicator?
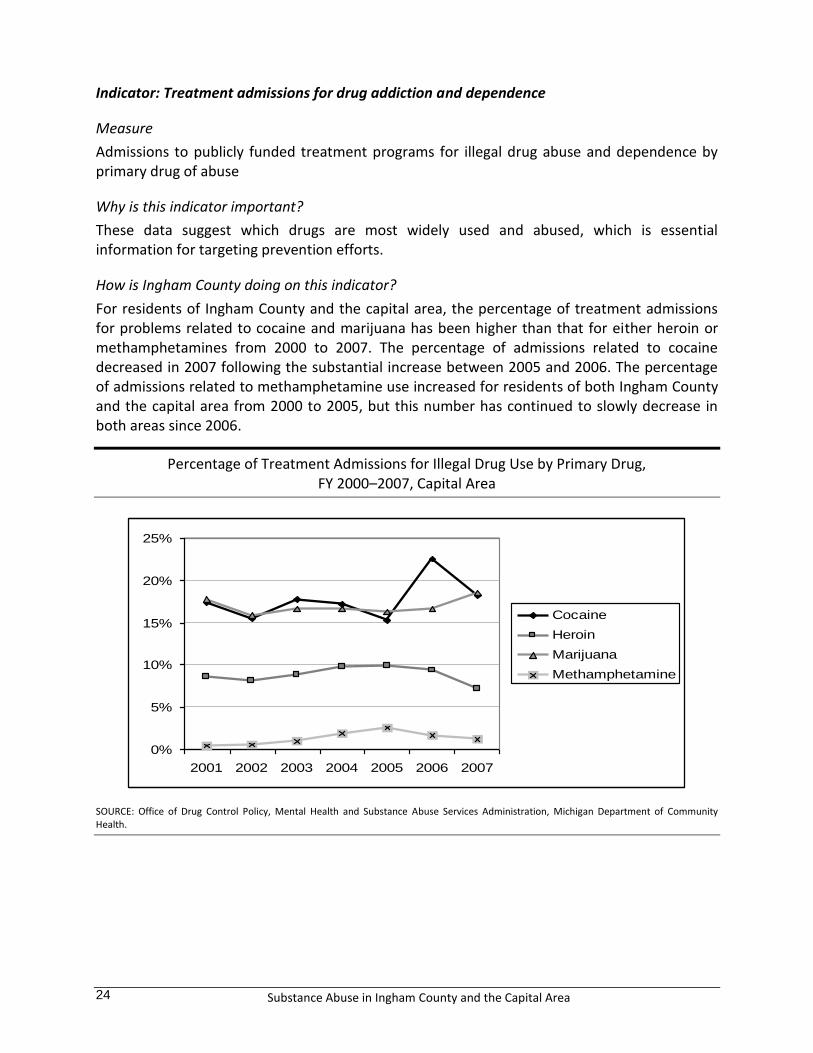
For residents of Ingham County and the capital area, the percentage of treatment admissions for problems related to cocaine and marijuana has been higher than that for either heroin or methamphetamines from 2000 to 2007. The percentage of admissions related to cocaine decreased in 2007 following the substantial increase between 2005 and 2006. The percentage of admissions related to methamphetamine use increased for residents of both Ingham County and the capital area from 2000 to 2005, but this number has continued to slowly decrease in both areas since 2006.
Percentage of Treatment Admissions for Illegal Drug Use by Primary Drug, FY 2000–2007, Capital Area
0%
5%
10%
15%
20%
25%
2001 2002 2003 2004 2005 2006 2007
Cocaine
Heroin
Marijuana
Methamphetamine
SOURCE: Office of Drug Control Policy, Mental Health and Substance Abuse Services Administration, Michigan Department of Community Health.
Substance Abuse in Ingham County and the Capital Area 25
Percentage of Treatment Admissions for Illegal Drug Use by Primary Drug, FY 2000–2007, Ingham County
0%
5%
10%
15%
20%
25%
2001 2002 2003 2004 2005 2006 2007
Cocaine
Heroin
Marijuana
Methamphetamine
SOURCE: Office of Drug Control Policy, Mental Health and Substance Abuse Services Administration, Michigan Department of Community Health.
Number of people treated in hospital emergency rooms for a substance abuse-related problem
Why is this indicator important?
Substance abuse and dependence contribute to a variety of preventable health problems and place a financial burden on our healthcare system. Some people who abuse substances do not seek treatment through substance abuse treatment programs, but they may be treated in a hospital emergency room as a result of a substance abuse-related problem. The number of people treated in hospital emergency rooms for conditions associated with substance abuse and dependence is another indicator of the scope of the problem in our community.
How is Ingham County doing on this indicator?
In two local hospitals, 18,760 patients from the capital area were seen in the emergency room for a problem related to substance abuse or dependence between 2003 and 2006. More than 13,400 of these emergency room visits were due to alcohol abuse or dependence. Nearly 2,000 were attributable to cocaine, nearly 1,100 to opioids (heroin), and nearly 800 to marijuana.
Substance Abuse in Ingham County and the Capital Area 26
Youth Risk and Protective Factors
Risk and protective factors are a set of personal characteristics and environmental conditions that have been identified as either increasing the likelihood (risk factors) or decreasing the likelihood (protective factors) that adolescents will engage in problem behaviors such as substance abuse.
While certain risk factors, such as attitudes favorable to drug use and peer drug use, have been associated with adolescent substance abuse, the sheer number of risk and protective factors appears to be more important than which individual factors are involved. The more risk factors a young person has, the more likely he or she will be to use alcohol, tobacco, or other drugs; the more protective factors, the less likely. For example, as referenced in the Arizona Prevention Resource Center’s Risk and Protective Factor Summary, Rutter et al. found that one familial risk factor has been shown to have no impact on a child’s likelihood of developing problems, while four familial risk factors increase the likelihood of unhealthy behaviors tenfold.
In a study of drug use among high-risk youth, the buffering effect of protective factors was evident. More than 56 percent of study participants with six or more protective factors were drug-free three years after the protective factors were first identified. Only a little over 20 percent of the youth with three or fewer protective factors were drug-free after three years.7
The Search Institute has developed a list of 40 developmental assets that act as protective factors against negative or problem behaviors among youth. Studies of these assets have similarly concluded that the number of assets an individual possesses is more important than what they are. For example, more than half of young people with 0–10 assets report using alcohol three or more times in the past month or getting drunk at least once in the past two weeks. By comparison, only three percent of students with 31–40 assets report the same levels of alcohol use.8
The 2008 Mid-South Substance Abuse Commission Prevention Needs Assessment (PNA) survey asked questions to determine students’ risk and protective factors using a set of 27 risk factors and 14 protective factors. Of students in the capital area responding to the 2006 survey, that had 26 risk factors and 13 protective factors, about 43 percent have nine or more risk factors and about 26 percent have four or fewer. About 64 percent of the students in the capital area who responded to the survey have five or more protective factors and 18 percent have three or fewer protective factors.
By working to both increase protective factors and reduce risk factors, our community can provide a safe, healthy environment where students are encouraged to reach their highest potential. Parents, community members, and schools can work together to adopt proactive approaches that focus on building protective factors and target preventive interventions toward risk factors.
7 National Institute on Drug Abuse. Protective Factors Can Buffer High-Risk Youths from Drug Use, NIDA Notes,
Volume 11, Number 3, May/June 1996. 8 P.L. Benson, P. Scales, N. Leffert, and E. Roehlkepartain. The fragile foundation: The state of developmental
assets among American youth. Minneapolis, MN: Search Institute, 1999.
Substance Abuse in Ingham County and the Capital Area 27
Appendix
Percentage of Adults Who Report Binge Drinking in the Past 30 Days
Ingham County Capital Area Michigan United States
1997 18.2% 17.3% 18.8% 14.5%
1998 27.5 22.9
1999 19.1 14.9
2000 23.4 21.1
2001 18.2 14.7
2002 16.8 16.1
2003 17.1 16.5 19.1 16.5
2004 16.2 15.1
2005 16.7 14.4
2006 21.2 17.0 17.5 15.4
2007 18.5 15.8
SOURCES: Mid-Michigan Behavioral Risk Factor Survey (1997, 2000, 2003), Ingham County Health Department; Capital Area Behavioral Risk Factor and Social Capital Survey 2006, Ingham County Health Department; Michigan Behavioral Risk Factor Survey, Michigan Department of Community Health; and Behavioral Risk Factor Surveillance System, Centers for Disease Control and Prevention.
NOTE: Prior to 2006, the Michigan BRFS and CDC BRFSS measured binge drinking as five or more drinks on a single occasion for either men or women. The current definition used by the CDC and the Michigan BRFS matches that used by the previous Mid-Michigan Behavioral Risk Factor Surveys and the Capital Area Behavioral Risk Factor and Social Capital Area Survey 2006, i.e., women who report having four or more drinks of alcohol and men who report having five or more drinks of alcohol on a single occasion on one or more of the past 30 days.
Percentage of Adults Who Report Heavy Drinking, 2003 and 2006
Ingham County Capital Area Michigan United States
2003 5.9% 5.3% 6.2% 5.8%
2006 10.4 7.5 4.9 4.9
SOURCES: Mid-Michigan Behavioral Risk Factor Survey 2003, Ingham County Health Department; Capital Area Behavioral Risk Factor and Social Capital Survey 2006, Ingham County Health Department; Michigan Behavioral Risk Factor Survey, Michigan Department of Community Health; and Behavioral Risk Factor Surveillance System, Centers for Disease Control and Prevention.
Percentage of Students Who Had Their First Drink of Alcohol before Age 13
Ingham County Capital Area
10th Grade 20.5% 21.4%
12th Grade 14.3 15.3
SOURCE: 2006 Mid-South Substance Abuse Commission Prevention Needs Assessment Survey, data analysis provided to the ISAP Coalition by Bach Harrison, L.L.C.
NOTE: Older students may not remember how young they were when they began drinking as clearly as younger students might, and therefore may report beginning to drink at an older age.
Substance Abuse in Ingham County and the Capital Area 28
Percentage of Students Who Have Had At Least One Drink of Alcohol in their Lifetime, by Grade
Ingham County Capital Area
6th
Grade 18.6% 17.0%
8th
Grade 38.2 38.4
10th
Grade 60.0 61.3
12th
Grade 74.1 74.3
SOURCE: 2006 & 2008 Mid-South Substance Abuse Commission Prevention Needs Assessment Survey, data analysis provided to the ISAP Coalition by Bach Harrison, L.L.C.
Percentage of Students Who Have Had At Least One Drink of Alcohol in the Past 30 Days, by Grade
Ingham County Capital Area
6th
Grade 4.3% 3.2%
8th
Grade 12.3 13.1
10th
Grade 30.0 30.5
12th
Grade 42.8 47.5
SOURCE: 2006 & 2008 Mid-South Substance Abuse Commission Prevention Needs Assessment Survey, data analysis provided to the ISAP Coalition by Bach Harrison, L.L.C.
Percentage of Students Who Report Binge Drinking in the Past Two Weeks Ingham County Capital Area
6th
Grade 4.8% 3.2%
8th
Grade 8.5 8.7
10th
Grade 18.0 18.2
12th
Grade 26.2 29.9
SOURCE: 2006 & 2008 Mid-South Substance Abuse Commission Prevention Needs Assessment Survey, data analysis provided to the ISAP Coalition by Bach Harrison, L.L.C.
Youth Perception of Parents’ Attitudes toward Underage Drinking
How wrong do your parents feel it would be for you to drink beer, wine, or hard liquor regularly?
Ingham County
Wrong or very wrong 88.5%
Ingham County by Grade Level
6th Grade 8th Grade 10th Grade 12th Grade
Wrong or very wrong
96% 94% 86.1% 77.9%
SOURCE: 2008 Mid-South Substance Abuse Commission Prevention Needs Assessment Survey, data analysis provided to the ISAP Coalition by Bach Harrison, L.L.C.
Substance Abuse in Ingham County and the Capital Area 29
SOURCES: 2000–2006 Michigan Uniform Crime Reports, Criminal Justice Information Center, Michigan Department of State Police.
NOTE: Rates are per 1,000 population. The Community Coalition provided 2006 rate calculations for Youth using U.S. Census Bureau postcensal population estimates produced for NCHS.
Alcohol-Induced Deaths, Three-Year Average Rates
Ingham County Capital Area Michigan
2000–2002 7.5 6.3 6.7
2001–2003 7.1 6.1 6.6
2002–2004 6.6 5.7 6.4
2003–2005 7.1 6.0 6.5
2004–2006 7.5 5.9 6.5
SOURCE: 2000–2006 Michigan Resident Death Files, Vital Records and Health Data Development Section, Michigan Department of Community Health.
Substance Abuse in Ingham County and the Capital Area 30
SOURCES: 2001–2007 Michigan Annual Drunk Driving Audits, Michigan Department of State Police, and Criminal Justice Information Center.
NOTE: Some crashes that involved alcohol also involved drugs. 2007 percentage calculations provided by the Community Coalition for Youth.
Percentage of Students Who Smoked Their First Cigarette before Age 13
Ingham County Capital Area
10th Grade 16.5% 17.0%
12th Grade 15.5 12.8
SOURCE: 2006 Mid-South Substance Abuse Commission Prevention Needs Assessment Survey, data analysis provided to the ISAP Coalition by Bach Harrison, L.L.C. & CDC
NOTE: Students were asked, “How old were you when you first smoked a cigarette, even just a puff?”
Percentage of Students Who Report Smoking Cigarettes at Least Once in their Lifetime Ingham County Capital Area
6th
Grade 11.3% 9.1%
8th
Grade 19.4 20.3
10th
Grade 29.8 31.4
12th
Grade 41.3 42.4
SOURCE: 2006 Mid-South Substance Abuse Commission Prevention Needs Assessment Surveys, data analysis provided to the ISAP Coalition by Bach Harrison, L.L.C.
Percentage of Students Who Report Smoking Cigarettes at Least Once in the Past 30 Days Ingham County Capital Area
6th
Grade 4.4% 3.2%
8th
Grade 6.7 7.7
10th
Grade 11.7 12.6
12th
Grade 20.3 20.4
SOURCE: 2006 Mid-South Substance Abuse Commission Prevention Needs Assessment Surveys, data analysis provided to the ISAP Coalition by Bach Harrison, L.L.C.
Substance Abuse in Ingham County and the Capital Area 31
Percentage of Students Who Report Smoking Half a Pack or More of Cigarettes per Day in the Past 30 Days
Ingham County Capital Area
6th
Grade 0.2% 0.0%
8th
Grade 0.7 0.8
10th
Grade 1.9 1.8
12th
Grade 3.7 4.4
SOURCE: 2006 & 2008 Mid-South Substance Abuse Commission Prevention Needs Assessment Surveys, data analysis provided to the ISAP Coalition by Bach Harrison, L.L.C.
Youth Perception of Parents’ Attitudes toward Smoking by Youth, Ingham County
How wrong do your parents feel it would be for you to smoke cigarettes?
Ingham County
Wrong or very wrong 91%
Youth Perception of Parents’ Attitudes toward Smoking by Youth, Ingham County
How wrong do your parents feel it would be for you to smoke cigarettes?
Ingham County by Grade Level
6th Grade 8th Grade 10th Grade 12th Grade
Wrong or very wrong
93.8% 89.3% 97.6% 96.8%
SOURCE: 2008 Mid-South Substance Abuse Commission Prevention Needs Assessment Survey, data analysis provided to the ISAP Coalition by Bach Harrison, L.L.C.
Percentage of Adults Who Are Current Smokers
1993 1997 2000 2003 2006
Ingham County 24.7% 23.0% 23.6% 21.2% 27.3%
Capital Area 24.4 23.0 23.9 22.0 23.4
Michigan 25.1 26.2 24.0 25.8 22.1
United States 22.6 23.2 23.2 22.0 20.1
SOURCES: Mid-Michigan Behavioral Risk Factor Survey (1993, 1997, 2000, 2003), Ingham County Health Department; Capital Area Behavioral Risk Factor and Social Capital Survey 2006, Ingham County Health Department; Michigan Behavioral Risk Factor Survey, Michigan Department of Community Health; Behavioral Risk Factor Surveillance System, Centers for Disease Control and Prevention.
Substance Abuse in Ingham County and the Capital Area 32
Live Births with Mothers Who Smoked During Pregnancy Ingham County and Capital Area, 2002–2006
2002 2003 2004 2005 2006
Number Percent Number Percent Number Percent Number Percent Number Percent
Ingham County
421 11.8% 406 10.8% 333 9.1% 336 9.3% 342 9.4%
Capital Area 676 11.9 617 10.7 546 9.1 548 9.8 566 10.1
SOURCES: 2000–2006 Michigan Resident Birth File, Division for Vital Records and Health Data Development Section, Michigan Department of Community Health.
Percentage of Homes with Secondhand Smoke, 2000, 2003, and 2006
2000 2003 2006
Ingham County 22% 16% 19%
Capital Area 21 15 18
SOURCE: Mid-Michigan Behavioral Risk Factor Survey (2000 and 2003), Ingham County Health Department; Capital Area Behavioral Risk Factor and Social Capital Survey 2006, Ingham County Health Department.
Percentage of Students Who Have Used Illegal Drugs During Their Lifetime, By Type of Drug
Ingham County Capital Area
Cocaine 1.7% 2.4%
Heroin or other opiates 0.4 0.6
Marijuana 21.5 19.6
Methamphetamines 1.3 0.7
SOURCE: 2006 & 2008 Mid-South Substance Abuse Commission Prevention Needs Assessment Survey, data analysis provided to the ISAP Coalition by Bach Harrison, L.L.C.
Percentage of Students Who Have Used Illegal Drugs One or More of the Past 30 Days, By Type of Drug
Ingham County Capital Area
Cocaine 0.9% 0.7%
Heroin or other opiates 0.4 0.2
Marijuana 18.1 8.7
Methamphetamines 0.2 0.2
SOURCE: 2006 & 2008 Mid-South Substance Abuse Commission Prevention Needs Assessment Survey, data analysis provided to the ISAP Coalition by Bach Harrison, L.L.C.
Substance Abuse in Ingham County and the Capital Area 33
SOURCES: 2000–2006 Michigan Uniform Crime Reports, Criminal Justice Information Center, Michigan Department of State Police.
NOTE: Rates are per 1,000 population. The Community Coalition provided 2006 rate calculations for Youth using U.S. Census Bureau postcensal population estimates produced for NCHS.
Number of Arrests by Type of Drug 2000 2001 2002 2003 2004 2005 2006
Capital Area
Cocaine 73 126 79 62 158 209 184
Heroin 6 12 4 5 16 29 21
Marijuana 457 567 482 508 739 731 826
Ingham County
Cocaine 60 86 50 43 116 168 149
Heroin 6 10 4 1 16 27 16
Marijuana 261 282 251 268 395 437 497
SOURCE: Crime Analysis Unit, Michigan State Police.
Percentage of Treatment Admissions by Primary Drug, FY 2001-2007
2001 2002 2003 2004 2005 2006 2007
Capital Area
Alcohol 50.1% 54.2% 50.7% 49.2% 46.4% 44.6% 49.5%
Cocaine 17.4 15.5 17.7 17.2 15.3 22.6 18.2
Heroin 8.6 8.2 8.8 9.8 9.9 9.4 7.1
Marijuana 17.8 15.8 16.6 16.6 16.3 16.6 18.5
Methamphetamine 0.4 0.6 1.0 1.9 2.6 1.7 1.2
Ingham County
Alcohol 47.9% 50.6% 46.8% 48.8% 45.6% 43.6% 48.6%
Cocaine 18.4 17.7 19.8 19.0 16.1 23.7 19.4
Heroin 10.0 10.2 11.1 11.6 11.1 10.7 7.8
Marijuana 17.7 15.6 16.6 14.6 16.6 16.0 18.6
Methamphetamine 0.2 0.3 0.3 0.9 1.1 0.9 0.7
SOURCE: Office of Drug Control Policy, Mental Health and Substance Abuse Services Administration, Michigan Department of Community Health.
Substance Abuse in Ingham County and the Capital Area 34
Admissions to Treatment vs. Estimated Need for Treatment, FY06
Ingham County Capital Area Michigan
Treatment Admissions 1,885 2,664 71,729
Treatment Need 48,745 78,134 1,610,516
SOURCES: Composite Prevalence Estimates of the Need for Substance Abuse Treatment Services in Michigan, Version 3, January 2003, Office of Drug Control Policy, Michigan Department of Community Health