38
Substance Abuse Questionnaire (SAQ): An Inventory of Scientific Findings

Substance
Abuse
Questionnaire (SAQ):
An Inventory of
Scientific Findings

i
TABLE OF CONTENTS
Preface .................................................................................................................................................................... ii
Introduction ............................................................................................................................................................ 1
Unique Features ..................................................................................................................................................... 2
Description of Scales ............................................................................................................................................. 3
Truthfulness ..................................................................................................................................................... 3
Alcohol Scale .................................................................................................................................................. 3
Drug Scale ....................................................................................................................................................... 4
Aggressivity Scale ........................................................................................................................................... 4
Resistance Scale .............................................................................................................................................. 4
Stress Coping Abilities Scale .......................................................................................................................... 5
Research Studies .................................................................................................................................................... 6
Stress Quotient Research ....................................................................................................................................... 7
SAQ Validation Research ...................................................................................................................................... 10
Validation of the SAQ Truthfulness Scale ..................................................................................................... 10
Validation of the Six SAQ Scale Using Criterion Measures ......................................................................... 11
Relationships Between Selected SAQ Scales and Polygraph Examination .................................................. 13
Validation of the SAQ in a Sample of Substance Abuse Inpatients .............................................................. 14
Validation of the SAQ Using the DRI as the Criterion Measure................................................................... 16
Validation of the SAQ in a Sample of Vocational Rehabilitation Clients .................................................... 17
SAQ Reliability Research ...................................................................................................................................... 20
Summary ................................................................................................................................................................ 34

ii
PREFACE
Substance Abuse Questionnaire (SAQ) research and development began in 1980 and has
continued to the present. The copyrighted SAQ database ensures continued research and
development. The SAQ is a brief, easily administered and automated (computer scored) test that
is designed for adult substance (alcohol and other drugs) abuse assessment. It includes true/false
and multiple choice items and can be completed in 30 minutes. The SAQ contains six empirically
based scales: Truthfulness Alcohol, Drug, Aggressivity, Resistance and Stress Coping Abilities.
The SAQ has been researched on college students, outpatients, inpatients, job applicants,
chemical dependency clients, probationers and others.
The SAQ report explains client's attained scores and makes specific intervention and treatment
recommendations. It also presents Truth-Corrected scores, significant items, a concise "structured
interview" and much more. The SAQ has demonstrated reliability, validity and accuracy. It
correlates impressively with both experienced staff judgment and other recognized tests. This
document summarizes the majority of the SAQ research.
SAQ tests can be given directly on the computer screen or in paper-pencil test booklet format.
All tests are computer scored on-site. SAQ reports are available within three minutes of test
completion. Diskettes contain all of the software needed to score tests, build a database and print
reports. The SAQ Windows version also has an optional human voice audio presentation that
presents the test on the computer screen with accompanying auditory presentation of the text seen
on the computer screen.
SAQ users are typically not clinicians or diagnosticians. Their role is usually to identify client
risk, substance (alcohol and other drugs) abuse and client need prior to recommending
intervention, supervision levels and/or treatment. The SAQ is to be used in conjunction with a
review of available records and respondent interview. No decision or diagnosis should be based
solely on SAQ results. Client assessment is not to be taken lightly as the decisions made can be
vitally important as they effect peoples lives. SAQ research is ongoing in nature, so that
evaluators can be provided with the most accurate information possible.
1
INTRODUCTION
SUBSTANCE ABUSE QUESTIONNAIRE (SAQ)
Increased public awareness of substance (alcohol and other drugs) abuse as a nationwide health problem
has clarified the need for identification and treatment of these disorders. Rising health care costs have
placed increasing responsibilities on all persons working with substance abusers. Workers in the field
must now document and substantiate their intervention and treatment. Patients, clients, their families,
probation departments, the courts, diversion programs, corrections programs and funding agencies are
now requiring substantiation and documentation of staff decision making. Substance (alcohol and other
drugs) abuse and dependency problems must now be measured in terms of degree of severity, with
quantitative statements substantiating intervention and treatment.
The Substance Abuse Questionnaire (SAQ) was developed to help meet these needs. The SAQ is
designed for adult chemical dependency and substance (alcohol and other drugs) abuse assessment. The
SAQ is particularly useful in intake-referral settings, inpatient and outpatient treatment programs, court-
related assessments, diversion programs and probation departments. In these reports quantitative
information is obtained by empirically based measures (scales) which independently generate risk
(percentile) scores. Scale development is based upon nearly 20 years of research. In addition,
explanatory paragraphs describe attained scores and contain specific score-related recommendations.
Each scale is presented graphically in the SAQ profile.
SUBSTANCE ABUSE QUESTIONNAIRE
MEASURES OR SCALES
1. Truthfulness Scale
2. Alcohol Scale
3. Drug Scale
4. Aggressivity Scale
5. Resistance Scale
6. Stress Coping Abilities Scale
The SAQ is a brief, easily administered and interpreted substance abuse screening or assessment
instrument. It is particularly useful in hospitals, chemical dependency treatment programs, referral
agencies, outpatient counseling programs, community clinics, community corrections, probation
departments and criminal justice programs. The SAQ represents the latest developments in psychometric
techniques and computerized technology. The SAQ can be administered on a computer (IBM-PC
compatibles) screen or by using paper-pencil test booklets. Regardless of how the SAQ is administered,
all tests are scored and interpreted with a computer which generates SAQ reports.
The SAQ requires approximately 30 minutes for completion and is appropriate for high school ages
through adulthood. The SAQ is composed of True-False and multiple-choice items. It can be
administered individually or in groups. The language is direct, non-offensive and uncomplicated.
Automated scoring and interpretive procedures help insure objectivity and accuracy. The SAQ is to be
used in conjunction with a review of available records, a focused interview and experienced staff
judgment.

2
The SAQ was designed to provide carefully developed measures (called scales) of several behavioral
patterns and traits of interest to those working with substance abusers. The measures (scales) chosen for
inclusion in the SAQ further the understanding of the substance (alcohol and other drugs) abuser. In
addition, they provide important information on the clients test taking attitude, emotional/behavioral
adjustment, and much more.
UNIQUE FEATURES
Truth Correction: A sophisticated psychometric technique permitted by computerized technology
involves "truth-corrected" scores which are calculated individually for SAQ scales. Since it would be
naive to assume everybody responds truthfully while completing any self-report test, the Truthfulness
Scale was developed. The Truthfulness Scale establishes how honest or truthful a person is while
completing the SAQ. Correlations between the Truthfulness Scale and all other scales permit
identification of error variance associated with untruthfulness. This error variance can then be added
back into scale scores, resulting in more accurate "Truth-Corrected" scores. Unidentified denial or
untruthfulness produces inaccurate and distorted results. Raw scores may only reflect what the client
wants you to know. Truth-Corrected scores reveal what the client is trying to hide. Truth-Corrected
scores are more accurate than raw scores.
Risk Range Percentile Scores: Each SAQ scale is scored independently of the other scales. SAQ scale
scoring equations combine client pattern of responding to scale items, Truthfulness Scale and prior
history that is contained on the SAQ answer sheet. The Truthfulness Scale applies a truth-correction
factor so that each scale score is referred to as a Truth-Corrected scale score. These Truth-Corrected
scale scores are converted to the percentile scores that are reported in the client SAQ report.
SAQ scale percentile scores represent “degree of severity.” Degree of severity is defined as follows:
Low Risk (zero to 39th percentile), Medium Risk (40th to 69th percentile), Problem Risk (70th to 89th
percentile), and Severe Problem or Maximum Risk (90th to 100th percentile). Severe problems include
dependency.
Standardization data is statistically analyzed where percentile scale scores are derived from obtained
scale scores from offender populations. The cumulative distributions of truth-corrected scale scores
determine the cut-off scores for each of the four risk range categories. Individual scale score calculations
are automatically performed and results are presented in the SAQ report numerically (percentile), by
attained risk category (narrative) and graphically (SAQ profile).
SAQ Database: Every time an SAQ is scored the test data is automatically stored on the diskette for
inclusion in the SAQ database. This applies to SAQ diskettes used anywhere in the United States and
Canada. When the preset number of tests are administered (or used up) on an SAQ diskette, the diskette
is returned for replacement and the test data contained on these used diskettes is input, in a confidential
(no names) manner, into the SAQ database for later analysis. This database is statistically analyzed
annually, at which time future SAQ diskettes are adjusted to reflect demographic changes or trends that
might have occurred. This unique and proprietary database also enables the formulation of annual
summary reports that are descriptive of the populations tested. Summary reports provide important
testing information, for budgeting, planning, management and program description.
Confidentiality (Delete Client Names): Many agencies and programs are rightfully concerned about
protecting their client’s confidentiality. The proprietary Delete Client Names option is provided to allow

3
deletion of client names from test diskettes prior to their being returned to Risk & Needs Assessment.
This is optional and once the names have been deleted they are gone and cannot be retrieved. Deleting
client names does not delete demographic information or test data. It only deletes the client names when
the option is used. The option is available at any time and can be used whether the diskette is full or not.
Once the client names are deleted there can no further editing of the client names. This ensures client
confidentiality.
DESCRIPTION OF EMPIRICALLY BASED MEASURES OR SCALES
SAQ scales were developed from large item pools. Initial item selection was a rational process based
upon clearly understood definitions of each scale. Subsequently, items and scales were analyzed for final
test selection. The original pool of potential test items was analyzed and the items with the best
statistical properties were retained. Final test and item selection was based on each item's statistical
properties. It is important that users of the SAQ familiarize themselves with the definition of each
scale. For that purpose a description of each SAQ scale follows.
Truthfulness Scale: This scale is a measure of the truthfulness of the client while completing the SAQ.
Obtained scores are categorized in terms of percentiles and risk levels, i.e., Low Risk, Medium Risk,
Problem Risk, and Severe Problem (Maximum) Risk.
All interview and self-report information is subject to the dangers of untrue answers due to
defensiveness, guardedness or deliberate falsification. The straightforward nature of any self-report
questionnaire may appear to some people as intrusive -- giving rise to denial, faking and even distortion.
The Truthfulness Scale identifies these self-protective, recalcitrant and guarded people who minimize or
even conceal information. It is equally important to establish that the client understood the test items he
or she was responding to, and the Truthfulness Scale also helps identify the reading impaired.
The Truthfulness Scale goes beyond establishing the truthfulness of the client. The correlation between
the Truthfulness Scale and each other scale has been established, error variance associated with
untruthfulness has been identified, and this error variance measure is added back into "truth-corrected"
scale scores. Truth-corrected scale scores are more accurate than raw scores. A high Truthfulness
Scale score (at or above the 90th percentile) invalidates all scale scores.
Alcohol Scale: This empirically based scale is a measure of a person having alcohol related problems.
Obtained scores are categorized in terms of percentiles and risk levels (i.e., Low Risk, Medium Risk,
Problem Risk and Severe Problem (Maximum) Risk). An elevated score at or above the 90th percentile
identifies dependency and severe problems.
Alcoholism is a significant problem in our society. Woolfolk and Richardson note in their book, "Stress,
Sanity and Survival" that alcoholism costs industry over $15.6 billion annually due to absenteeism and
medical expenses. And over two decades later these costs have increased substantially. The harm
associated with alcohol abuse -- mental, emotional, and physical -- is well documented. The costs
associated with alcohol-related problems are staggering.
Alcoholism has been empirically related to arrest records, hospitalizations, illicit substance (drugs)
abuse, emotional problems, driving records and stress. Experienced staff are aware of alcoholics' job
performance problems, impaired interpersonal relationships and poor stress coping abilities.
4
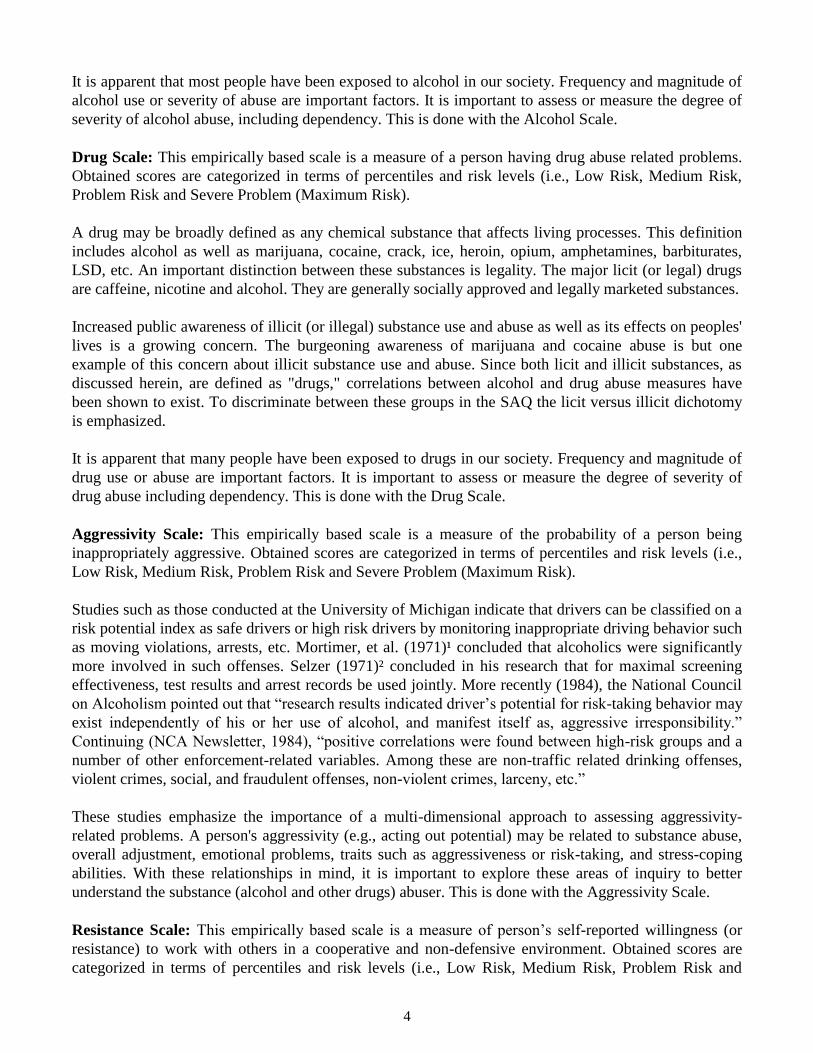
It is apparent that most people have been exposed to alcohol in our society. Frequency and magnitude of
alcohol use or severity of abuse are important factors. It is important to assess or measure the degree of
severity of alcohol abuse, including dependency. This is done with the Alcohol Scale.
Drug Scale: This empirically based scale is a measure of a person having drug abuse related problems.
Obtained scores are categorized in terms of percentiles and risk levels (i.e., Low Risk, Medium Risk,
Problem Risk and Severe Problem (Maximum Risk).
A drug may be broadly defined as any chemical substance that affects living processes. This definition
includes alcohol as well as marijuana, cocaine, crack, ice, heroin, opium, amphetamines, barbiturates,
LSD, etc. An important distinction between these substances is legality. The major licit (or legal) drugs
are caffeine, nicotine and alcohol. They are generally socially approved and legally marketed substances.
Increased public awareness of illicit (or illegal) substance use and abuse as well as its effects on peoples'
lives is a growing concern. The burgeoning awareness of marijuana and cocaine abuse is but one
example of this concern about illicit substance use and abuse. Since both licit and illicit substances, as
discussed herein, are defined as "drugs," correlations between alcohol and drug abuse measures have
been shown to exist. To discriminate between these groups in the SAQ the licit versus illicit dichotomy
is emphasized.
It is apparent that many people have been exposed to drugs in our society. Frequency and magnitude of
drug use or abuse are important factors. It is important to assess or measure the degree of severity of
drug abuse including dependency. This is done with the Drug Scale.
Aggressivity Scale: This empirically based scale is a measure of the probability of a person being
inappropriately aggressive. Obtained scores are categorized in terms of percentiles and risk levels (i.e.,
Low Risk, Medium Risk, Problem Risk and Severe Problem (Maximum Risk).
Studies such as those conducted at the University of Michigan indicate that drivers can be classified on a
risk potential index as safe drivers or high risk drivers by monitoring inappropriate driving behavior such
as moving violations, arrests, etc. Mortimer, et al. (1971)¹ concluded that alcoholics were significantly
more involved in such offenses. Selzer (1971)² concluded in his research that for maximal screening
effectiveness, test results and arrest records be used jointly. More recently (1984), the National Council
on Alcoholism pointed out that “research results indicated driver’s potential for risk-taking behavior may
exist independently of his or her use of alcohol, and manifest itself as, aggressive irresponsibility.”
Continuing (NCA Newsletter, 1984), “positive correlations were found between high-risk groups and a
number of other enforcement-related variables. Among these are non-traffic related drinking offenses,
violent crimes, social, and fraudulent offenses, non-violent crimes, larceny, etc.”
These studies emphasize the importance of a multi-dimensional approach to assessing aggressivity-
related problems. A person's aggressivity (e.g., acting out potential) may be related to substance abuse,
overall adjustment, emotional problems, traits such as aggressiveness or risk-taking, and stress-coping
abilities. With these relationships in mind, it is important to explore these areas of inquiry to better
understand the substance (alcohol and other drugs) abuser. This is done with the Aggressivity Scale.
Resistance Scale: This empirically based scale is a measure of person’s self-reported willingness (or
resistance) to work with others in a cooperative and non-defensive environment. Obtained scores are
categorized in terms of percentiles and risk levels (i.e., Low Risk, Medium Risk, Problem Risk and

5
Severe Problem (Maximum) Risk). Resistance is defined in terms of a person's willingness (or
resistance) to positively work with or relate to others. It incorporates communication, attitude toward
others, acceptance, mutual assistance and affiliation activation. The Resistance Scale identifies negative
interpersonal relationships, negative attitudes toward authority figures and a high propensity toward
“people problems.”
It is important to measure the degree of severity of resistance because of its broad applicability in our
lives. Our attitude toward others influences relationships at home, work, in our families and social lives.
Resistance also is an important construct to be addressed in diversion programs, probation departments
as well as chemical dependency treatment programs. For example, staff-client relationships, peer
relationships, group participation, compliance, cooperation, etc., are important areas of inquiry. These
relationships are very important in both probation and treatment settings.
Stress Coping Abilities Scale: This empirically based scale is a measure of a person’s experienced
stress level in comparison to that person’s ability to cope with stress. Obtained scores are categorized in
terms of percentiles and risk levels (i.e., Low Risk, Medium Risk, Problem Risk and Severe Problem
(Maximum) Risk).
Stress is an increasingly significant concept in our society. The National Institute for Occupational
Safety and Health (NIOSH) recently evaluated the health records of 22,000 workers in 130
organizations. Their conclusion: stress affects workers in all types of job levels; unskilled laborers
are equally susceptible, as are top-line executives.
How effectively individuals cope with stress determines whether or not stress is a significant factor in
their lives. Two concepts, stress and coping abilities dominate the literature on stress. The Stress Coping
Abilities Scale includes measures of both of these concepts in its Stress Quotient (SQ) equation. The
better an individual’s coping skills, compared to their amount of experienced stress, the higher the SQ
score. In contrast, if an individual is experiencing more stress than he or she can cope with, the lower the
SQ score. In the SAQ profile, Stress Quotient (SQ) scores were inverted to conform to the
established risk levels ranging from low to high risk categories.
Stress exacerbates other symptoms of emotional, attitudinal, interpersonal and substance abuse related
problems. Frequency and magnitude of impaired stress coping abilities are important factors in
understanding the substance abuser. A Stress Coping Abilities Scale score at or above the 90th
percentile is typically indicative of a diagnosable mental health problem. It is important to assess or
measure the degree of severity of stress coping ability problems. This is done with the Stress Coping
Abilities Scale.
SAQ items are personal. The straightforward nature of any self-report questionnaire may appear to some
people as intrusive. Although perhaps discomforting to some, such criticism is directly related to the
SAQ’s strength in assessing substance abuse and related problems objectively. Information deemed
personal by some is necessary in an empirical (as opposed to rational) approach to assessment. A similar
type of criticism (intrusiveness) has been leveled at the MMPI in the past.
6
RESEARCH STUDIES
SAQ validation studies were conducted with established Minnesota Multiphasic Personality Inventory
(MMPI) scales as well as Polygraph examinations and other reports. Reliability and validity studies
have been conducted on substance abuse inpatients, outpatients, college students, job applicants,
defendants, diversion program attendees, probationers, inmates and counseling patients.
Empirically based SAQ scales (or measures) were developed by statistically relating scale item
configurations to known substance (alcohol and other drugs) abuse groups. The SAQ was then normed
against an identified substance abuse population. A summary of much of this SAQ research follows.
This document first presents the earlier studies that investigated the Stress Coping Abilities Scale.
Validation studies are presented next followed by reliability studies. Within the validity and reliability
sections, the research represented in this document is reported chronologically -- as it occurred.
Chronological presentation enables the reader to follow the evolution of the SAQ into a state-of-the-art
assessment instrument. More recent studies (toward the end of this document) are most representative of
current SAQ statistics.
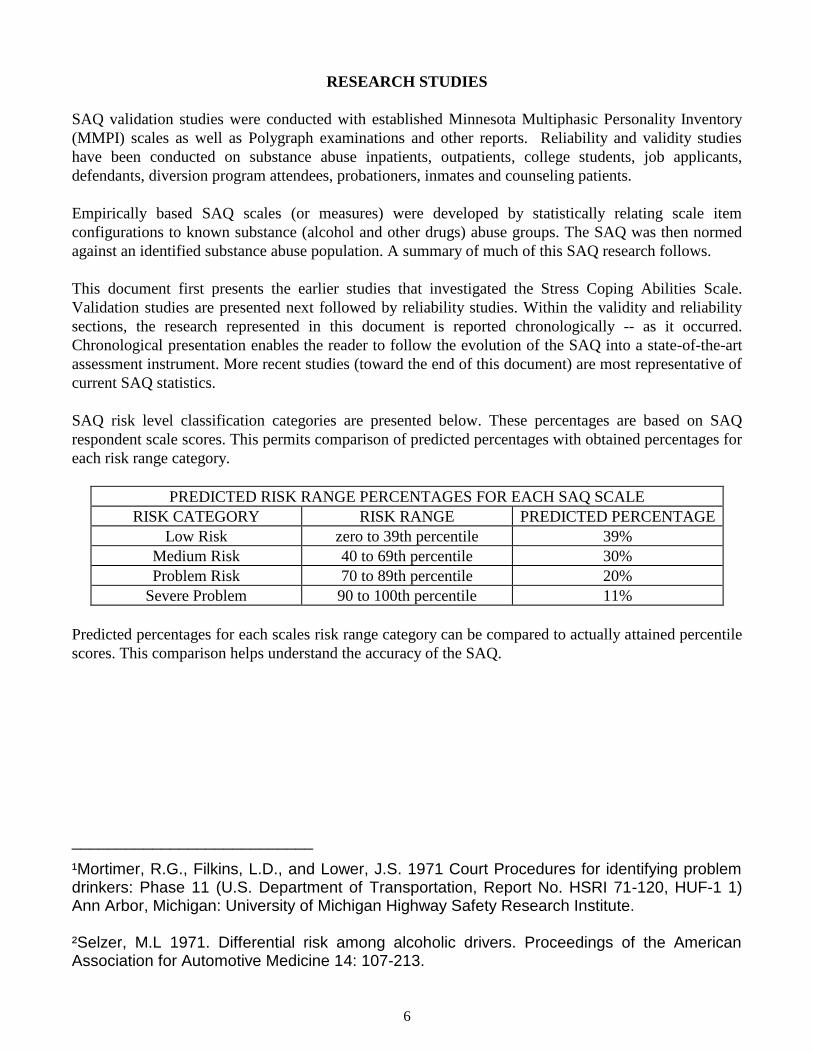
SAQ risk level classification categories are presented below. These percentages are based on SAQ
respondent scale scores. This permits comparison of predicted percentages with obtained percentages for
each risk range category.
PREDICTED RISK RANGE PERCENTAGES FOR EACH SAQ SCALE
RISK CATEGORY RISK RANGE PREDICTED PERCENTAGE
Low Risk zero to 39th percentile 39%
Medium Risk 40 to 69th percentile 30%
Problem Risk 70 to 89th percentile 20%
Severe Problem 90 to 100th percentile 11%
Predicted percentages for each scales risk range category can be compared to actually attained percentile
scores. This comparison helps understand the accuracy of the SAQ.
___________________________
¹Mortimer, R.G., Filkins, L.D., and Lower, J.S. 1971 Court Procedures for identifying problem drinkers: Phase 11 (U.S. Department of Transportation, Report No. HSRI 71-120, HUF-1 1) Ann Arbor, Michigan: University of Michigan Highway Safety Research Institute. ²Selzer, M.L 1971. Differential risk among alcoholic drivers. Proceedings of the American Association for Automotive Medicine 14: 107-213.

7
STRESS QUOTIENT
The Stress Quotient (SQ) or Stress Coping Abilities Scale is based upon the following mathematical
equation:
SQ = CS/S x k
The Stress Quotient (SQ) scale is a numerical value representing a person's ability to handle or cope with
stress relative to their amount of experienced stress. CS (Coping Skill) refers to a person's ability to cope
with stress. S (Stress) refers to experienced stress. k (Constant) represents a constant value in the SQ
equation to establish SQ score ranges. The SQ includes measures of both stress and coping skills in the
derivation of the Stress Quotient (SQ) score. The better an individual's coping skills, compared to the
amount of experienced stress, the higher the SQ score.
The Stress Quotient (SQ) scale equation represents empirically verifiable relationships. The SQ scale
(and its individual components) lends itself to research. Nine studies were conducted to investigate the
validity and reliability of the Stress Quotient or Stress Coping Abilities Scale.
Validation Study 1: This study was conducted (1980) to compare SQ between High Stress and Low
Stress groups. The High Stress group (N=10) was comprised of 5 males and 5 females. Their average
age was 39. Subjects for the High Stress group were randomly selected from outpatients seeking
treatment for stress. The Low Stress group (N=10) was comprised of 5 males and 5 females (average age
38.7) randomly selected from persons not involved in treatment for stress. High Stress group SQ scores
ranged from 32 to 97, with a mean of 64.2. Low Stress group SQ scores ranged from 82 to 156, with a
mean of 115.7. The t-test statistical analysis of the difference between the means of the two groups
indicated that the High Stress group had significantly higher SQ scores than the Low Stress group (t =
4.9, p < .001). This study shows that the SQ or Stress Coping Abilities Scale is a valid measure of stress
coping. The Stress Coping Abilities Scale significantly discriminates between high stress individuals and
low stress individuals.
Validation Study 2: This study (1980) evaluated the relationship between the SQ scale and two
criterion measures: Taylor Manifest Anxiety Scale and Cornell Index. These two measures have been
shown to be valid measures of anxiety and neuroticism, respectively. If the SQ or Stress Coping Abilities
Scale is correlated with these measures it would indicate that the SQ or Stress Coping Abilities Scale is a
valid measure. In the Taylor Manifest Anxiety Scale, high scores indicate a high level of anxiety.
Similarly, in the Cornell Index high scores indicate neuroticism. Negative correlation coefficients
between the two measures and the SQ were expected because high SQ scores indicate good stress coping
abilities. The three tests were administered to forty-three (43) subjects selected from the general
population. There were 21 males and 22 females ranging in age from 15 to 64 years. Utilizing a product-
moment correlation, SQ scores correlated -.70 with the Taylor Manifest Anxiety Scale and -.75 with the
Cornell Index. Both correlations were significant, in the predicted direction, at the p < .01 level. These
results support the finding that the Stress Coping Abilities Scale is a valid measure of stress coping
abilities. The reliability of the SQ was investigated in ten subjects (5 male and 5 female) randomly
chosen from this study. A split-half correlation analysis was conducted on the SQ items. The product-
moment correlation coefficient (r) was .85, significant at the p < .01 level. This correlation indicates that
the SQ or Stress Coping Abilities Scale is a reliable measure. These results support the Stress Coping
Abilities Scale as a reliable and valid measure.

8
Validation Study 3: In this study (1981) the relationship between the SQ Scale and the Holmes Rahe
Social Readjustment Rating Scale (SRRS) was investigated. The SRRS, which is comprised of a self-
rating of stressful life events, has been shown to be a valid measure of stress. Three correlation analyses
were done. SRRS scores were correlated with SQ scores and separately with two components of the SQ
scale: Coping Skill (CS) scores and Stress (S) scores. It was hypothesized that the SQ and SRRS
correlation would be negative, since subjects with lower SQ scores would be more likely to either
encounter less stressful life events or experience less stress in their lives. It was also predicted that
subjects with a higher CS would be less likely to encounter stressful life events, hence a negative
correlation was hypothesized. A positive correlation was predicted between S and SRRS, since subjects
experiencing more frequent stressful life events would reflect more experienced stress. The participants
in this study consisted of 30 outpatient psychotherapy patients. There were 14 males and 16 females. The
average age was 35. The SQ and the SRRS were administered in counterbalanced order. The results
showed there was a significant positive correlation (product-moment correlation coefficient) between SQ
and SRRS (r = .4006, p<.01). The correlation results between CS and SRRS was not significant
(r = .1355, n.s.). There was a significant positive correlation between S and SRRS (r = .6183, p<.001).
The correlations were in predicted directions. The significant correlations between SQ and SRRS as well
as S and SRRS support the construct validity of the SQ or Stress Coping Abilities Scale.
Validation Study 4: This validation study (1982) evaluated the relationship between factor C (Ego
Strength) in the 16 PF Test as a criterion measure and the SQ in a sample of juveniles. High scores on
factor C indicate high ego strength and emotional stability, whereas high SQ scores reflect good coping
skills. A positive correlation was predicted because emotional stability and coping skills reflect similar
attributes. The participants were 34 adjudicated delinquent adolescents. They ranged in age from 15 to
18 years with an average age of 16.2. There were 30 males and 4 females. The Cattell 16 PF Test and the
SQ scale were administered in counterbalanced order. All subjects had at least a 6.0 grade equivalent
reading level. The correlation (product-moment correlation coefficient) results indicated that Factor C
scores were significantly correlated with SQ scores (r = .695, p<.01). Results were significant and in the
predicted direction. These results support the SQ or Stress Coping Abilities Scale as a valid measure of
stress coping abilities in juvenile offenders.
In a subsequent study the relationship between factor Q4 (Free Floating Anxiety) on the 16 PF Test and
S (Stress) on the SQ scale was investigated. High Q4 scores reflect free floating anxiety and tension,
whereas high S scores measure experienced stress. A high positive correlation between Q4 and S was
predicted. There were 22 of the original 34 subjects included in this analysis since the remainder of the
original files were unavailable. All 22 subjects were male. The results indicated that Factor Q4 scores
were significantly correlated (product-moment correlation coefficient) with S scores (r = .584, p<.05).
Results were significant and in predicted directions. The significant correlations between factor C and
SQ scores as well as factor Q4 and S scores support the construct validity of the SQ scale.
Validation Study 5: Psychotherapy outpatient clients were used in this validation study (1982) that
evaluated the relationship between selected Wiggin's MMPI (Minnesota Multiphasic Personality
Inventory) supplementary content scales (ES & MAS) as criterion measures and the SQ scale. ES
measures ego strength and MAS measures manifest anxiety. It was predicted that the ES and SC
correlation would be positive, since people with high ego strength would be more likely to possess good
coping skills. Similarly, it was predicted that MAS and S correlations would be positive, since people
experiencing high levels of manifest anxiety would also likely experience high levels of stress. The
subjects were 51 psychotherapy outpatients ranging in age from 22 to 56 years with an average age of
34. There were 23 males and 28 females. The MMPI and the SQ were administered in counterbalanced

9
order. The correlation (product-moment correlation coefficient) results indicated that ES and CS were
positively significantly correlated (r = .29, p<.001). MAS and S comparisons resulted in an r of .54,
significant at the p < .001 level. All results were significant and in predicted directions.
In a related study (1982) utilizing the same population data (N=51) the relationship between the
Psychasthenia (Pt) scale in the MMPI and the S component of the SQ scale was evaluated. The Pt scale
in the MMPI reflects neurotic anxiety, whereas the S component of the SQ scale measures stress.
Positive Pt and S correlations were predicted. The correlation (product-moment correlation coefficient)
results indicated that the Pt scale and the S component of the SQ scale were significantly correlated
(r = .58, p<.001). Results were significant and in the predicted direction. The significant correlations
between MMPI scales (ES, MAS, Pt) and the SQ scale components (CS, S) support the construct
validity of the SQ or Stress Coping Abilities Scale.
Reliability Study 6: The reliability of the Stress Quotient (SQ) or Stress Coping Abilities Scale was
investigated (1984) in a population of outpatient psychotherapy patients. There were 100 participants, 41
males and 59 females. The average age was 37. The SQ was administered soon after intake. The most
common procedure for reporting inter-item (within test) reliability is with Coefficient Alpha. The
reliability analysis indicated that the Coefficient Alpha of 0.81 was highly significant (F = 46.74,
p<.001). Highly significant inter-item scale consistency was demonstrated.
Reliability Study 7: (1985) The reliability of the Stress Quotient (SQ) or Stress Coping Abilities Scale
was investigated in a sample of 189 job applicants. There were 120 males and 69 females with an
average age of 31. The SQ was administered at the time of pre-employment screening. The reliability
analysis indicated that the Coefficient Alpha of 0.73 was highly significant (F = 195.86, p<.001). Highly
significant Cronbach Coefficient Alpha reveals that all SQ scale items are significantly (p<.001) related
and measure one factor or trait.
Validation Study 8: Chemical dependency inpatients were used in a validation study (1985) to
determine the relation between MMPI scales as criterion measures and the Stress Quotient (SQ) Scale or
Stress Coping Abilities Scale. The SQ is inversely related to other MMPI scales, consequently, negative
correlations were predicted. The participants were 100 chemical dependency inpatients. There were 62
males and 38 females with an average age of 41. The SQ and the MMPI were administered in
counterbalanced order. The reliability analysis results indicated that the Coefficient Alpha of 0.84 was
highly significant (F = 16.20, p<001). Highly significant inter-item scale consistency was demonstrated.
The correlation (product-moment correlation coefficient) results between the Stress Quotient (SQ) and
selected MMPI scales were significant at the p < .001 level and in predicted directions. The SQ
correlation results were as follows: Psychopathic Deviate (-0.59), Psychasthenia (-.068), Social
Maladjustment (-0.54), Authority Conflict (-0.46), Taylor Manifest Anxiety Scale (-0.78), Authority
Problems (-0.22), and Social Alienation (-0.67). The most significant SQ correlation was with the Taylor
Manifest Anxiety Scale. As discussed earlier, stress exacerbates symptoms of impaired adjustment as
well as emotional and attitudinal problems. These results support the Stress Quotient or Stress Coping
Abilities Scale as a valid measure of stress coping abilities.
Validation Study 9: In a replication of earlier research, a study (1986) was conducted to further evaluate
the reliability and validity of the Stress Quotient (SQ). The participants were 212 inpatients in chemical
dependency programs. There were 122 males and 90 females with an average age of 44. The SQ and
MMPI were administered in counterbalanced order. Reliability analysis of the SQ scale resulted in a

10
Coefficient Alpha of 0.986 (F = 27.77, p<.001). Highly significant inter-item scale consistency was
again demonstrated. Rounded off, the Coefficient Alpha for the SQ was 0.99.
In the same study (1986, inpatients), product-moment correlations were calculated between the Stress
Quotient (SQ) and selected MMPI scales. The SQ correlated significantly (.001 level) with the following
MMPI scales: Psychopathic Deviate (Pd), Psychasthenia (Pt), Anxiety (A), Manifest Anxiety (MAS),
Ego Strength (ES), Social Responsibility (RE), Social Alienation (PD4A), Social Alienation (SC1A),
Social Maladjustment (SOC), Authority Conflict (AUT), Manifest Hostility (HOS),
Suspiciousness/Mistrust (TSC-II), Resentment/Aggression (TSC-V) and Tension/Worry (TSC-VII). All
SQ correlations with selected MMPI scales were significant (at the .001 level of significance) and
in predicted directions. These results support the SQ scale or Stress Coping Abilities Scale as a valid
measure of stress coping abilities.
The studies cited above demonstrate empirical relationships between the SQ scale (Stress Coping
Abilities Scale) and other established measures of stress, anxiety and coping skills. This research
demonstrates that the Stress Quotient (SQ) or Stress Coping Abilities Scale is a reliable and valid
measure of stress coping abilities. The SQ has high inter-item scale reliability. The SQ also has high
concurrent (criterion-related) validity with other recognized and accepted tests. The SQ scale permits
objective (rather than subjective) analysis of the interaction of these important variables. In the research
that follows, the Stress Quotient or SQ is also referred to as the Stress Coping Abilities Scale.
SAQ VALIDATION RESEARCH
SAQ research is reported in a chronological format, reporting studies as they occurred. This gives the
reader the opportunity to see how the SAQ evolved into a state-of-the-art risk and needs assessment
instrument. For current information refer to the more recent studies near the end of this research section.
Initially, a large item pool was rationally developed for SAQ scale consideration. Consensual agreement
among three Ph.D. level psychologists and other experienced chemical dependency counselors familiar
with SAQ scale definitions reduced the initial item pool markedly. Final item selection was empirical -
comparing statistically related item configurations to known substance abuse groups. Items chosen had
acceptable inter-item reliability coefficients and correlated highest with their respective scales. Final
item selection was based on each item's statistical properties. The SAQ was then objectively
standardized and normed on substance abuse populations.
10. Validation of the SAQ Truthfulness Scale
The Truthfulness Scale in the SAQ is an important psychometric scale as these scores establish how
truthful the respondent was while completing the SAQ. Truthfulness Scale scores determine whether or
not SAQ profiles are accurate and are integral to the calculation of Truth-Corrected SAQ scale scores.
The Truthfulness Scale identifies respondents who were self-protective, recalcitrant and guarded, as well
as those who minimized or even concealed information while completing the test. Truthfulness Scale
items are designed to detect respondents who try to fake good or put themselves into a favorable light.
These scale items are statements about oneself that most people would agree to. The following statement
is an example of a Truthfulness Scale item, “Sometimes I worry about what others think or say about
me.”

11
There are 21 Truthfulness Scale items in the SAQ. This preliminary study was done to determine if these
Truthfulness Scale items could differentiate between respondents who were honest from those trying to
fake good. It was hypothesized that the group trying to fake good would score higher on the Truthfulness
Scale than the group instructed to be honest.
Method
Seventy-eight Arizona State University college students (1985) enrolled in an introductory psychology
class were randomly assigned to one of two groups. Group 1 comprised the “Honest” group and Group 2
comprised the “Fakers” group. Group 1 was instructed to be honest and truthful while completing the
SAQ. Group 2 was instructed to "fake good" while completing the SAQ, but to respond "in such a
manner that their faking good would not be detected." The SAQ, which included the six SAQ scales,
was administered to the subjects and the Truthfulness Scale was embedded in the SAQ as one of the six
scales. Truthfulness Scale scores were made up of the number of deviant answers given to the 21
Truthfulness Scale items.
Results
The mean Truthfulness Scale score for the Honest group was 2.71 and the mean Truthfulness Scale score
for Fakers was 15.77. The results of the correlation (product-moment correlation coefficient) between
the Honest group and the Fakers showed that the Fakers scored significantly higher on the Truthfulness
Scale than the Honest group (r = 0.27, p < .05).
The Truthfulness Scale successfully measured how truthful the respondents were while completing the
SAQ. The results of this study reveals that the Truthfulness Scale accurately detects "Fakers" from those
students that took the SAQ honestly.
11. Validation of the Six SAQ Scales Using Criterion Measures
In general terms, a test is valid if it measures what it is supposed to measure. The process of confirming
this statement is called validating a test. A common practice when validating a test is to compute a
correlation between it and another (criterion) test that purports to measure the same thing and that has
been previously validated. For the purpose of this study, the six SAQ scales (Truthfulness, Alcohol,
Drug, Aggressivity, Resistance, Stress Coping Abilities) were validated with comparable scales on the
Minnesota Multiphasic Personality Inventory (MMPI). The MMPI was selected for this validity study
because it is the most researched, validated and widely used objective personality test in the United
States. The SAQ scales were validated with MMPI scales as follows. The Truthfulness Scale was
validated with the L Scale. The Alcohol Scale was validated with the MacAndrew Scale and
Psychopathic Deviant. The Drug Scale was validated with the MacAndrew and Psychopathic Deviant.
The Aggressivity Scale was validated with the Taylor Manifest Anxiety and MacAndrew. The
Resistance Scale was validated with the Manifest Hostility and Authority Conflict. The Stress Coping
Abilities Scale was validated with the Taylor Manifest Anxiety, Psychasthenia, Social Maladjustment
and Social Alienation.
Method
One hundred (100) chemical dependency inpatients (1985) were administered both the SAQ and the
MMPI. Tests were counterbalanced for order effects -- half were given the SAQ first and half the MMPI
first.

12
Results and Discussion
Product-moment correlation coefficients were calculated between SAQ scales and MMPI scales. These
results are summarized in Table 1. The correlation results presented in Table 1 show that all SAQ scales
significantly correlated (.001 level of significance) with all represented MMPI scales. In addition, all
correlations were in predicted directions.
Table 1. (1985) Product-moment correlations
between MMPI scales and SAQ scales
MMPI SCALES SAQ SCALES (MEASURES)
(MEASURES) Truthful-
ness
Alcohol Drug Aggressivity Resistance Stress
Coping
L (Lie) Scale 0.72 -0.38 -0.41 -0.28 -0.29 0.53
Psychopathic Deviant -0.37 0.52 0.54 0.35 0.27 -0.59
Psychasthenia -0.34 0.38 0.41 0.28 0.37 -0.68
Social Maladjustment -0.25 0.34 0.26 0.18 0.35 -0.54
Authority Conflict -0.43 0.31 0.47 0.37 0.55 -0.46
Manifest Hostility -0.45 0.34 0.47 0.37 0.57 -0.58
Taylor Manifest Anxiety -0.58 0.47 0.46 0.48 0.50 -0.78
MacAndrew -0.40 0.58 0.62 0.44 0.26 -0.33
Social Alienation -0.47 0.35 0.45 0.28 0.48 -0.67
NOTE: All correlations were significant at p < .001.
The Truthfulness Scale correlates significantly with all of the represented MMPI scales in Table 1. Of
particular interest is this scale's highly significant positive correlation with the MMPI Lie (L) Scale. A
high L Scale score on the MMPI invalidates other MMPI scale scores due to untruthfulness. This helps
in understanding why the Truthfulness Scale is significantly, but negatively, correlated with the other
represented MMPI scales. Similarly, the MMPI L Scale correlates significantly, but negatively, with the
other SAQ scales.
The Alcohol Scale correlates significantly with all represented MMPI scales. This is consistent with the
conceptual definition of the Alcohol Scale and previous research that has found that alcohol abuse is
associated with mental, emotional and physical problems. Of particular interest are the highly significant
correlations with the MacAndrew (r = 0.58) Scale and the Psychopathic Deviant (r = 0.52) Scale. High
MacAndrew and Psychopathic Deviant scorers on the MMPI are often found to be associated with
substance abuse. Similarly, the Drug Scale correlates significantly with the MacAndrew (r = 0.62) Scale
and the Psychopathic Deviant (r = 0.54) Scale.
The Aggressivity Scale is most (highly) significantly correlated with the Taylor Manifest Anxiety
(MAS, r = 0.48) and the MacAndrew Alcoholism (r = 0.44) scales. Mortimer, et al. (1971) concluded
that alcoholics were significantly more involved in driving violations and aggressiveness.
The Resistance Scale is most significantly correlated with the Manifest Hostility (r = 0.57) and the
Authority Conflict (r = 0.55) scales. These findings are consistent with the conceptual definition of the
Resistance Scale as measurement of willingness to work and cooperate with others.

13
The Stress Coping Ability Scale is inversely related to MMPI scales which accounts for the negative
correlations shown in Table 1. The positive correlation with the L scale on the MMPI was discussed
earlier, i.e., Truthfulness Scale. It should be noted that stress exacerbates symptoms of impaired
adjustment and even psychopathology. The Stress coping Ability Scale correlates most significantly with
the Taylor Manifest Anxiety (r = -0.78) Scale, the Psychasthenia (r=-0.68) Scale and the Social
Alienation (r=-0.67) Scale.
These findings strongly support the validity of SAQ scales. All of the SAQ scales were highly correlated
with the MMPI criterion scale they were tested against. The large correlation coefficients support the
validity of the SAQ. All product-moment correlation coefficients testing the relation between SAQ and
MMPI scales were significant at the p < .001 level.
12. Relationships Between Selected SAQ Scales and Polygraph Examination
A measure that has often been used in business or industry for employee selection is the Polygraph
examination. The polygraph exam is most often used to determine the truthfulness or honesty of an
individual while being tested. The Polygraph examination is more accurate as the area of inquiry is more
"situation" specific. Conversely, the less specific the area of inquiry, the less reliable the Polygraph
examination becomes.
Three SAQ scales were chosen for this study; Truthfulness Scale, Alcohol Scale and Drug Scale. The
Truthfulness Scale was chosen because it is used in the SAQ to measure the truthfulness or honesty of
the respondent while completing the SAQ. The Alcohol and Drug scales are well suited for comparison
with the polygraph exam because of the situation specific nature of the scales. Alcohol and Drug scale
items are direct and relate specifically to alcohol and drug use. The comparison with Truthfulness Scale
is less direct because of the subtle nature of the Truthfulness Scale items as used in the SAQ. The
Truthfulness Scale is affected by the respondent’s attitude, emotional stability and tendencies to fake
good. It was expected that the Alcohol and Drug scales would be highly correlated with the polygraph
results and the Truthfulness Scale would show a somewhat less but nonetheless significant correlation.
Method
One hundred and eighty-nine (189) job applicants (1985) were administered both the SAQ and the
Polygraph examination. Tests were given in a counterbalanced order, half of the applicants were given
the SAQ first and the other half of the applicants were administered the polygraph first. The subjects
were administered the SAQ and polygraph exam in the same room in the same session with the examiner
present for both tests.
Results
The product-moment correlation results between the Polygraph exam and SAQ scales indicated there
was a significant positive correlation between the Truthfulness Scale and Polygraph exam (r = 0.23,
p<.001). Similarly, significant positive relationships were observed between the Polygraph exam and the
Alcohol Scale (r = 0.54, p<.001) and the Drug Scale (r = 0.56, p<.001).
In summary, this study supports the validity of the SAQ. There were strong positive relationships
between the selected SAQ scales and the Polygraph examination. The highly significant product-moment
correlations between SAQ scales and Polygraph examinations demonstrates the validity of the SAQ
Truthfulness, Alcohol and Drug Abuse measures.

14
These results are important because the Polygraph exam is a direct measure obtained from the individual
being tested rather than a rating by someone else. This is similar to self-report such as utilized in the
SAQ. The fact that there was a very strong relationship between Polygraph results and SAQ scales
shows that this type of information can be obtained accurately in self-report instruments.
These results indicate that the SAQ Truthfulness Scale is an accurate measure of the respondent’s
truthfulness or honesty while completing the SAQ. The Truthfulness Scale is an essential measure in
self-report instruments. There must be a means to determine the honesty or “correctness” of the
respondents answers and there must be a means to adjust scores when the respondent is less than honest.
The SAQ Truthfulness Scale addresses both of these issues. The Truthfulness Scale measures
truthfulness and then applies a correction to other scales based on the Truthfulness Scale score. The
Truthfulness Scale ensures accurate assessment. The results of this study shows that the SAQ is a valid
assessment instrument.
13. Validation of the SAQ in a Sample of Substance Abuse Inpatients
The SAQ is an adult chemical dependency and substance (alcohol and other drugs) abuse assessment
instrument. It is designed for use in intake-referral settings, inpatient and outpatient treatment programs,
court-related assessments, diversion programs and probation departments. The SAQ is a specific test
designed for a specific population. The present study (1987) was conducted to validate the SAQ in a
sample of substance abuse inpatients in a chemical dependency facility.
Selected scales in the Minnesota Multiphasic Personality Inventory (MMPI) were used as criterion
measures for the different SAQ scales. The Truthfulness Scale was validated with MMPI L Scale, F
Scale and K Scale. The Alcohol Scale was validated with MMPI MacAndrew Scale (MAC) and
Psychopathic Deviate-Obvious (PD-O). The Drug Scale was validated with MMPI MacAndrew Scale
and Psychopathic Deviate-Obvious. The Aggressivity Scale was validated with MMPI Authority
Problems (PD2), Psychopathic Deviate (PD), Manifest Hostility (HOS) and Resentment/Aggression
(TSC-V). The Resistance Scale was validated with MMPI Ego Strength (ES), Social Responsibility
(RE), Social Maladjustment (SOC), Social Alienation (PD4), Social Alienation (SCIA), Authority
Conflict (AUT) and Suspiciousness (TSC-III). The Stress Coping Abilities Scale was validated with
MMPI Psychasthenia (PT), Anxiety (A), Taylor Manifest Anxiety (MAS) and Tension/Worry (TSC-
VII). The MMPI scales were chosen to compare to the SAQ scales because they measure similar
attributes.
Method
The subjects used in the study were 212 substance (alcohol and other drugs) abuse inpatients in chemical
dependency facilities. The SAQ and MMPI were administered in counterbalanced order.
Results and Discussion
The product-moment correlation results are summarized in Table 2. Since this study is important in
understanding SAQ validity, each SAQ scale is briefly summarized below. (N=212):
The Truthfulness Scale correlates significantly in predicted directions with selected MMPI criterion
scales, L Scale (lie, p<.001), F Scale (validity, p<.001) and K Scale (validity correction, p<.001). Other
significant correlations with traditional MMPI scales include: PD (Psychopathic deviate, p<.001), ES
(Ego Strength, p<.001), and RE (Social responsibility, p< .001); Harris MMPI subscales: PD2 (Authority
Problems, p<.001), PD4 (Social Alienation, p<.001), SCIA (Social Alienation, p<.001); Wiggins MMPI

15
content scales: SOC (Social Maladjustment, p<.001), HOS (Manifest Hostility, p<.001); Wiener-
Harmon MMPI subscales: PDO (Psychopathic Deviant-Obvious, p<.001); Tryon, Stein & Chu MMPI
cluster scales: TSC-V (Resentment/Aggressive, p<.001).
The Alcohol Scale correlates significantly in predicted directions with selected MMPI criterion scales:
MAC (MacAndrew scale, p<.001), and PD-O (Psychopathic Deviate Obvious, p<.021). The Drug Scale
correlates significantly in predicted directions with selected MMPI criterion scales: MAC (MacAndrew
scale, p<.001), and PD-O (Psychopathic Deviate Obvious, p<.001).
The Aggressivity Scale correlates significantly in predicted directions with selected MMPI criterion
scales: PD2 (Authority problems, p<.003), PD (Psychopathic Deviate, p<.009), HOS (Manifest Hostility,
p<.001) and TSC-V (Resentment/Aggression, p<.001).
Table 2. SAQ-MMPI Product-moment Correlations (1987)
Inpatients, Chemical Dependency Facilities
MMPI SCALES
(MEASURES) SAQ SCALES (MEASURES)
Truthfulness Alcohol Drug Aggressivity Resistance Stress Coping
L 0.60 -0.24 -0.15 -0.13 -0.23 -0.30
F -0.34 0.32 0.32 0.31 0.56 0.49
K 0.39 -0.28 -0.29 -0.25 -0.61 -0.51
MAC -0.30 0.35 0.37 0.34 0.19 0.28
PD-O -0.35 0.22 0.33 0.21 0.52 0.53
PD2 -0.26 0.18 0.17 0.20 0.07 0.07
PD -0.33 0.21 0.33 0.18 0.19 0.39
HOS -0.45 0.25 0.33 0.33 0.55 0.46
TSC-V -0.46 0.34 0.28 0.28 0.59 0.58
ES 0.25 -0.27 -0.25 -0.21 -0.48 -0.51
RE 0.41 -0.27 -0.34 -0.38 -0.88 -0.45
SOC -0.19 0.17 0.08 -0.03 0.34 0.39
PD4 -0.41 0.20 0.28 0.22 0.63 0.55
SCIA -0.36 0.27 0.32 0.24 0.58 0.39
AUT -0.21 0.20 0.30 0.34 0.52 0.18
TSC-III -0.22 0.26 0.28 0.31 0.57 0.45
PT -0.39 0.27 0.24 0.16 0.27 0.58
A -0.41 0.31 0.31 0.26 0.53 0.68
MAS -0.44 0.25 0.18 0.15 0.39 0.65
TSC-VII -0.41 0.33 0.29 0.27 0.51 0.66
The Resistance Scale correlates significantly in predicted directions with selected MMPI criterion
scales: ES (Ego Strength, p<.001), RE (Social Responsibility, p<.001), PD4 (Social Alienation, p<.001),
SCIA (Social Alienation, p<.001), SOC (Social Maladjustment, p<.001), AUT (Authority Conflict,
p<.001), TSC-III (Suspiciousness, p<.001) and TSC-V (Resentment/Aggression, p<.001).
The Stress Coping Abilities Scale correlates significantly in predicted directions with selected MMPI
criterion scales: PT (Psychasthenia, p<.001), A (Anxiety, p<.001), MAS (Taylor Manifest Anxiety,
p<.001), PD4 (Social Alienation, p<.001) and TSC-VII (Tension/Worry, p<.001).

16
These findings strongly support the validity of the SAQ scales in this sample of chemical dependency
inpatients. All of the SAQ scales were highly correlated with the MMPI criterion scales they were tested
against. The large correlation coefficients support the SAQ as a valid instrument for assessment of
substance abuse. Inpatients in chemical dependency facilities are known to have substance abuse
problems and these correlation results confirm the validity of the instruments.
The SAQ Alcohol and Drug scales are direct measures of alcohol and drug use and abuse, respectively,
whereas the MacAndrew Scale was developed from discriminant analysis and does not include a
truthfulness scale. The MacAndrew Scale items do not relate specifically to alcohol and drugs. Hence,
the correlations between the MacAndrew Scale and the Alcohol and Drug scales could be affected by the
lack of a truthfulness measure which is a deficiency of the MacAndrew Scale. However, the correlation
coefficients were significant.
Where MMPI scales are closely related (by definition) to SAQ scales the correlation coefficients were
highly significant. For example, the SAQ Truthfulness Scale and the MMPI L Scale both measure
tendencies to fake good, and the correlation was very highly significant at r = .60. The correlation
between Resistance Scale and MMPI Social Responsibility Scale was r = -.88, and the correlation
between Stress Coping Abilities Scale and MMPI Tension/Worry Scale was r = -.66. This study supports
the validity of the SAQ.
14. Validation of the SAQ Using the DRI as the Criterion Measure
A study was conducted in 1988 that was designed to examine relationships (correlations) between the
Substance Abuse Questionnaire (SAQ) and the Driver Risk Inventory (DRI) on an inmate population of
incarcerated DWI offenders. The DRI has been demonstrated to be a valid, reliable and accurate
assessment instrument for evaluation of DWI offenders.
The SAQ is designed for adult chemical (alcohol and other drugs) dependency assessment. It contains
six measures or scales: Truthfulness, Alcohol, Drug, Aggressivity, Resistance and Stress Coping
Abilities. Five of these six SAQ scales are analogous (although independent) and directly comparable to
Driver Risk Inventory (DRI) measures or scales. The DRI is designed for DWI (Driving While
Intoxicated) and DUI (Driving Under the Influence) offender evaluation. The DRI contains five
measures or scales: Truthfulness, Alcohol, Drug, Driver Risk and Stress Coping Abilities.
Although the scales designated Truthfulness, Alcohol, Drug, and Aggressivity are independent and differ
in the SAQ and DRI, they were designed to measure similar behaviors or traits. Thus, although
essentially composed of different test questions in the SAQ and DRI test booklets, these comparable
measures or scales do have similarity. The Stress Coping Abilities Scale is the same in both SAQ and
DRI and each contains 40 test items. The Driver Risk Scale in the DRI was used as the criterion measure
for the Aggressivity Scale in the SAQ.
Method
The SAQ and DRI were administered in group settings to 154 DWI offender inmates, in counter
balanced order, at Arizona State Department of Corrections (ADOC) facilities. All of the subject in this
study were male inmates. The demographic composition was as follows. There were 98 Caucasians, 25
Hispanics, 13 American Indians, 12 Blacks and six other ethnicities. Five age categories were
represented: 16-25 years (N = 26), 26-35 years (N = 74), 36-55 years (N = 38), 46-55 years (N = 11) and
56 or older (N = 5). Six educational levels were represented: Eighth grade or less (N = 7), Partially

17
completed high school (N = 50), High school graduates (N = 70), Partially completed college (N = 16),
College graduates (N = 9), and Professional/graduate school (N = 2). Each inmate completed both the
SAQ and the DRI. Although all inmates volunteered to participate in this study, inmate motivation
varied.
Results and Discussion
The results of this study are presented in Table 3. The results demonstrate highly significant
relationships between the analogues SAQ and DRI scales. The DRI has been shown to be a valid
measure of substance abuse in DUI/DWI offenders, hence, these correlation results support the validity
of the SAQ as a valid measure of substance abuse.
Table 3. Product-moment correlations 1988 study of DWI inmates (N = 154).
All product-moment correlations are significant at p<.001.
DRI versus Agreement
SAQ Scales Coefficients
Truthfulness Scale .6405
Alcohol Scale .3483
Drug Scale .3383
Driver Risk (DRI) versus Aggressivity (SAQ) .4070 Stress Coping Abilities .7642
It was noted that inmate motivation varied widely. This is evident in the Stress Coping Abilities correlation
coefficient of .7642. Even though this is a highly significant correlation (p<.001), the Agreement
Coefficient could be expected to be even higher because these were identical scales consisting of the same
40 items. It is reasonable to conclude that low motivation on the part of many inmate volunteers
contributed to lower Agreement Coefficients. Inmate volunteers were serving DWI-related sentences and
these tests had no bearing on their incarcerated status or sentences. However, in spite of widely varied
inmate motivation, Agreement Coefficients for all five sets of scale comparisons were highly significant.
These results are important for another reason. This study extends the SAQ normative (standardization
sample) population to include inmates and incarcerated individuals who are serving their sentences in
maximum security facilities. The validity of the SAQ has been demonstrated on a sample of incarcerated
substance abuse offenders.
15. Validation of the SAQ in a Sample of Vocational Rehabilitation Clients
The Substance Abuse Questionnaire (SAQ) was investigated in a sample of individuals who are not
generally associated with substance abuse but who have other disadvantages. The participants in the present
study (1991) were Vocational Rehabilitation clients. These are individuals who have some form of
handicap and require assistance in obtaining and maintaining employment.
Selected scales in the Minnesota Multiphasic Personality Inventory (MMPI) were used as criterion
measures for the different Substance Abuse Questionnaire (SAQ) scales. Comparisons to previous
validating studies which used substance abuse subjects will be made to determine the applicability of the
SAQ to various adult samples.
Method
The subjects used in the present study consisted of 74 Vocational Rehabilitation clients. The SAQ and
MMPI were administered in counterbalanced order. Product-moment correlations were calculated between

18
SAQ scales and selected criterion MMPI scales. The Truthfulness Scale was validated with the MMPI L
Scale, F Scale and K Scale. The Alcohol Scale was validated with the MMPI MacAndrew Scale (MAC)
and Psychopathic Deviate (PD). The Drug Scale was validated the MMPI MacAndrew Scale, Psychopathic
Deviate. The Aggressivity Scale was validated with the MMPI Resentment (TSC-V), Dominance (DO) and
Manifest Hostility (HOS). The Resistance Scale was validated with the MMPI Social Maladjustment
(SOC), Authority Conflict (AUT), Authority Problems (PD2), Suspiciousness (TSC-III) and Social
Alienation (SCIA). The Stress Coping Abilities Scale was validated with the MMPI Psychasthenia (PT),
Taylor Manifest Anxiety (MAS) and Tension (TSC-VII).
Result and Discussion
There were 74 Vocational Rehabilitation clients used in the study. There were 49 males and 25 females.
Age was distributed (frequency given in parentheses) as follows: 18 to 21 years (11), 22 to 25 years (7), 26-
29 years (11), 30-33 years (14), 34-37 years (10), 42-45 years (9), 46-49 years (8), 50 or more years (4). Six
education categories were represented: 8th grade or less (11), Partially completed High School (18), GED
(14), High School Graduate (21), Some College (6), College Graduate (4). There were 47 Caucasians, 12
Blacks, 8 Hispanics, 6 American Indians and 1 other ethnicity. The correlation results are summarized in
Table 4. For clarity, SAQ scales are summarized individually and their MMPI scale correlations discussed.
Table 4. Product-moment correlations.
Vocational Rehabilitation Clients (1991, N=74)
SAQ SCALES
MMPI
SCALES
Truthfulness Alcohol Drug Aggressivity Resistance Stress
Coping
L .493** .001 -.141 -.012 .009 -.105
F -.344* .435** .334* .529** .226 .440**
K .344* -.257 -.079 -.410** -.066 -.308*
PD -.109 .454** .292* .387** .112 .568**
MAC -.177 .303* .145 .369** .051 .168
DO .193 -.438** -.205 -.549** -.071 -.511**
HOS -.497** .231 .136 .439** .308* .207
SOC -.379** .431** .199 .223 .123 .259
AUT -.360** .339** .174 .374** .149 .204
PD2 -.293* .381** .263 .259 .017 .209
SCIA -.397** .349* .159 .414** .258 .390**
TSC-III -.372** .319** .040 .421** .076 .254
TSC-V .387** .396** .207 .531** .196 .435**
TSC-VII .480** .295* .189 .413** .151 .441**
PT -.135 .273* .244 .216 .264 .501**
MAS -.245 .396** .240 .426 .085 .574**
NOTE: level of significance, * < .01, ** < .001
The Truthfulness Scale was significantly correlated with the MMPI scales that are associated with
truthfulness measures. The SAQ Truthfulness Scale was significantly correlated with the MMPI L Scale
(p<.001), F scale (p<.01) and K scale (p<.01). When a person attains elevated L, F or K scales on the
MMPI, other MMPI scale scores are invalidated. Similarly, an elevated Truthfulness Scale score on the
SAQ invalidates other SAQ scale scores.

19
The Alcohol Scale was significantly correlated with the MMPI MacAndrew Scale (p<.01) and the PD scale
(Psychopathic Deviate, p<.001). High MMPI PD and MAC scores are often associated with substance
abuse.
The Drug Scale was significantly correlated with the PD Scale (Psychopathic Deviate, p<.01). The SAQ
Drug scale did not correlate significantly with the MMPI MacAndrew Scale. Substance (alcohol and other
drugs) abusers have a close identity with their substance of choice. Without independent scales on the
MacAndrew Scale for alcohol and drugs, many substance abusers would remain undetected. The low
correlation between SAQ Drug Scale and MacAndrew Scale may have been due to lying or faking on the
MacAndrew Scale.
The Aggressivity Scale was significantly correlated with the MMPI DO Scale (Dominance, -.549), TSC-V
(Resentment, .531) and HOS (Manifest Hostility, .439). These correlations were significant at the p<.001
level of significance.
The Resistance Scale correlated significantly with the MMPI Social Alienation Scale (SCIA, p<.05). The
expected correlations with Social Maladjustment (SOC), Authority Problems (AUT), Suspiciousness
(TSC-III), TSC-V (Resentment) and Authority Problems (PD) was not demonstrated. It could be that
Vocational Rehabilitation clients are generally cooperative and willing to go along with authority because
they stand to benefit. Length of Vocational Rehabilitation involvement would be an interesting variable to
study in future research.
The Stress Coping Abilities Scale correlates most significantly with the MMPI MAS (Taylor Manifest
Anxiety, r = .574, p<.001), PT (Psychasthenia, r = .501, p<.001) and TSC-VII (Tension, r = .568, p<.001).
These findings are consistent with earlier research.
These results are consistent with earlier research involving the administration of both the SAQ and MMPI
in that SAQ scales are significantly correlated with criterion MMPI scales. An exception in the present
study is that the Resistance Scale did not correlate significantly with all criterion scales. The lack of a
significant correlations with the Resistance Scale is likely due to the lack of a resistant attitude in the
participants of this study. Vocational Rehabilitation may be unlike many other assessment milieus where
resistance is expected. This is suggested by a somewhat lower correlation between the Truthfulness Scale
and L Scale (.493 present study and .60 previous study) due to a lower degree of faking good in the present
study. These findings support the validity of the SAQ.
Comparisons between the present study and previous research that tested substance abusers (inpatient
clients at chemical dependency facilities) shows some interesting results. As stated above, there was a
somewhat lower correlation between the Truthfulness Scale and L Scale. There was a higher correlation
between the Drug Scale and MacAndrew Scale in the substance abuser study and a lower correlation
between the Alcohol Scale and Psychopathic Deviate Scale.
Of particular interest in this study are the correlation results of the Resistance Scale. The present studies
lower correlations between the Resistance Scale scores and criterion scale scores are of interest when
compared to correlations of the substance abusers. It may be that the present subjects do not exhibit
resistant attitudes because they are accustomed to cooperating with authority. This finding provides further
validation of the SAQ.

20
SAQ RELIABILITY RESEARCH
Any approach to detection, assessment, or measurement must meet the criteria of reliability and validity.
The research summarized above supports the validity of the SAQ. Reliability research is summarized
below.
Reliability refers to an instrument’s consistency of results regardless of who uses it. This means that the
outcome must be objective, verifiable, and reproducible. Ideally, the instrument or test must also be
practical, economical, and accessible. Psychometric principles and computer technology insures
accuracy, objectivity, practicality, cost-effectiveness and accessibility.
16. A Study of SAQ Test-Retest Reliability
Reliability is a measure of the consistency of a test in obtaining similar results upon re-administration of
the test. One measure of test reliability, over time, is the test-retest correlation coefficient. In this type of
study, the test, is administered to a group and then the same test is re-administered to the same group at a
later date.
Method
College students at two different colleges enrolled in introductory psychology classes participated in this
study (1984). A total of 115 students participated and received class credit for their participation. The
students were administered the SAQ in a paper-pencil test format. One week later they were retested
with the SAQ again.
Results
The results of this study revealed a significant test-retest product-moment correlation coefficient of
r = 0.71, p<.01. These results support the reliability of the SAQ. Test-retest consistency was very high
and indicates that the SAQ scores are reproducible and reliable over a one week interval.
17. Inter-item Reliability of the SAQ
Within-test reliability measures to what extent a test with multiple scales measuring different factors,
measures each factor independent of the other factors (scales) in the test. It also measures to what extent
items in each scale consistently measures the particular trait (or factor) that scale was designed to
measure. Within-test reliability measures are referred to as inter-item reliability. The most common
method of reporting within-test (scale) inter-item reliability is with Coefficient Alpha.
Method
This study (1985) included three separate groups of subjects: 100 outpatients in private practice, 100
substance abuse inpatients, and 189 job applicants -- totaling 389 subjects. Separate inter-item reliability
analyses were conducted to compare results across the three groups.
Results and Discussion
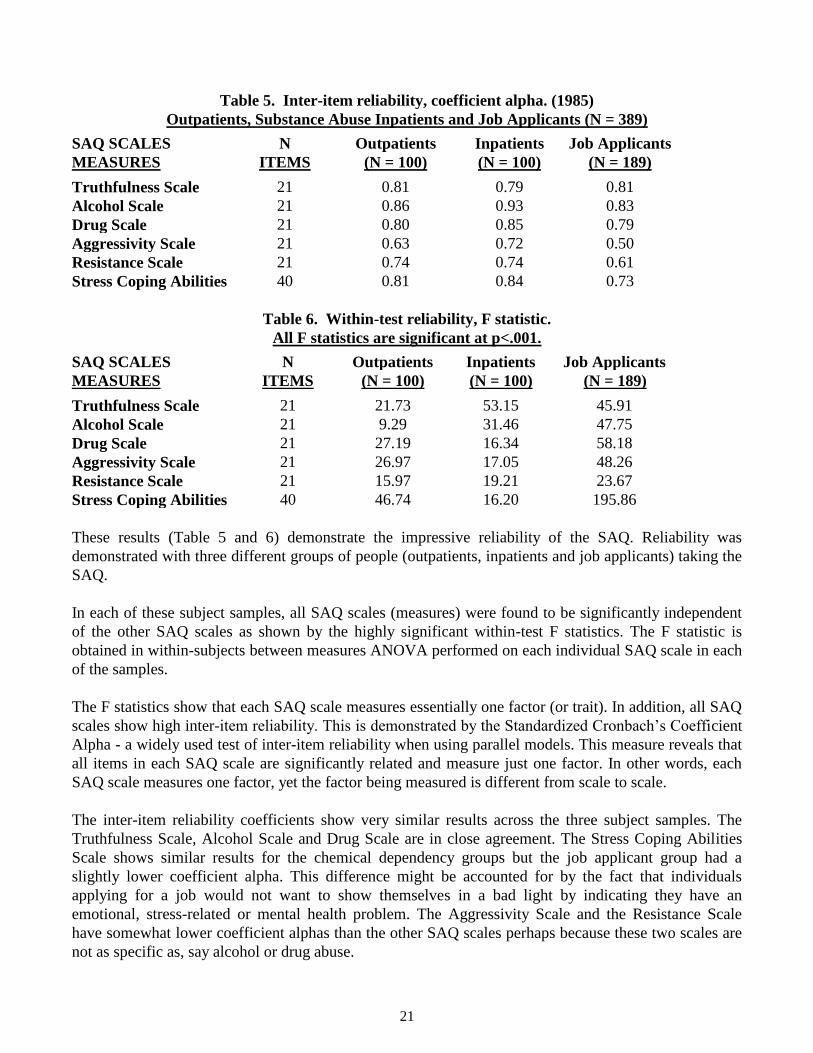
The inter-item reliability coefficient alpha and within-test reliability statistics are presented in Tables 7
and 8, respectively. All inter-item reliability coefficient alphas and within-test reliability F-values are
significant at p<.001. These results supports the reliability of the SAQ. The SAQ is a highly reliable
instrument.
21
Table 5. Inter-item reliability, coefficient alpha. (1985)
Outpatients, Substance Abuse Inpatients and Job Applicants (N = 389)
SAQ SCALES N Outpatients Inpatients Job Applicants
MEASURES ITEMS (N = 100) (N = 100) (N = 189)
Truthfulness Scale 21 0.81 0.79 0.81
Alcohol Scale 21 0.86 0.93 0.83
Drug Scale 21 0.80 0.85 0.79
Aggressivity Scale 21 0.63 0.72 0.50
Resistance Scale 21 0.74 0.74 0.61
Stress Coping Abilities 40 0.81 0.84 0.73
Table 6. Within-test reliability, F statistic.
All F statistics are significant at p<.001.
SAQ SCALES N Outpatients Inpatients Job Applicants
MEASURES ITEMS (N = 100) (N = 100) (N = 189)
Truthfulness Scale 21 21.73 53.15 45.91
Alcohol Scale 21 9.29 31.46 47.75
Drug Scale 21 27.19 16.34 58.18
Aggressivity Scale 21 26.97 17.05 48.26
Resistance Scale 21 15.97 19.21 23.67
Stress Coping Abilities 40 46.74 16.20 195.86
These results (Table 5 and 6) demonstrate the impressive reliability of the SAQ. Reliability was
demonstrated with three different groups of people (outpatients, inpatients and job applicants) taking the
SAQ.
In each of these subject samples, all SAQ scales (measures) were found to be significantly independent
of the other SAQ scales as shown by the highly significant within-test F statistics. The F statistic is
obtained in within-subjects between measures ANOVA performed on each individual SAQ scale in each
of the samples.
The F statistics show that each SAQ scale measures essentially one factor (or trait). In addition, all SAQ
scales show high inter-item reliability. This is demonstrated by the Standardized Cronbach’s Coefficient
Alpha - a widely used test of inter-item reliability when using parallel models. This measure reveals that
all items in each SAQ scale are significantly related and measure just one factor. In other words, each
SAQ scale measures one factor, yet the factor being measured is different from scale to scale.
The inter-item reliability coefficients show very similar results across the three subject samples. The
Truthfulness Scale, Alcohol Scale and Drug Scale are in close agreement. The Stress Coping Abilities
Scale shows similar results for the chemical dependency groups but the job applicant group had a
slightly lower coefficient alpha. This difference might be accounted for by the fact that individuals
applying for a job would not want to show themselves in a bad light by indicating they have an
emotional, stress-related or mental health problem. The Aggressivity Scale and the Resistance Scale
have somewhat lower coefficient alphas than the other SAQ scales perhaps because these two scales are
not as specific as, say alcohol or drug abuse.

22
Because each sample may have scored differently from the other two samples, the data for all subjects
were combined. For example, job applicants may score low on the Alcohol Scale and inpatient clients
may score high. By combining the data, scale scores would likely be distributed from low to high and
result in even better coefficient alphas than each sample separately. Table 7 presents the inter-item
reliability analysis of all of these independent studies (N = 1 00, N = 100, N = 189) combined (N = 389).
The combined data shows that all but one coefficient alpha increased in the combined data compared to
coefficient alphas of each subject sample alone. Only the Aggressivity Scale had a higher coefficient
alpha in the inpatient chemical dependency clients than this scale coefficient alpha for the combined
data. These coefficient alphas in the combined data are very high and provide strong support for the
reliability of the SAQ.
Table 7. Inter-item reliability, coefficient alpha. All data combined (N = 389).
All F statistics are significant at p<.001.
SAQ SCALES N COEFFICIENT F
MEASURES ITEMS ALPHA VALUE
Truthfulness Scale 21 0.82 96.93
Alcohol Scale 21 0.94 26.68
Drugs Scale 21 0.88 79.71
Aggressivity Scale 21 0.70 82.00
Resistance Scale 21 0.77 53.03
Stress Coping Abilities 40 0.85 150.78
18. Replication of SAQ Reliability in a Sample of Inpatient Clients
In a replication of earlier SAQ research, chemical dependency inpatients (1987) were used to evaluate
the reliability of the SAQ scales.
Method and Results
The SAQ was administered to 192 inpatients in a chemical dependency facility. The inter-item
coefficient alpha statistics are presented in Table 8. These results are in close agreement to reliability
results obtained in an earlier study using chemical dependency inpatient clients. In some cases the
coefficient alphas are higher in the present study as in the previous study. The results of the present study
support the reliability of the SAQ.
Table 8. Inter-item reliability, coefficient alpha.
Chemical dependency inpatients (N = 192).
SAQ SCALES N COEFFICIENT F P VALUE
MEASURES ITEMS ALPHA VALUE P<
Truthfulness Scale 21 0.79 13.28 0.001
Alcohol Scale 21 0.92 24.39 0.001
Drugs Scale 21 0.87 22.23 0.001
Aggressivity Scale 21 0.81 10.32 0.001
Resistance Scale 21 0.81 10.92 0.001
Stress Coping Abilities 40 0.99 27.77 0.001

23
In all f the subject samples studied, the SAQ scales were demonstrated to be independent measures. This
mutual exclusivity (significant at p<.001) was demonstrated by a within-subjects measures ANOVA
performed on each SAQ scale. These analyses demonstrate that each SAQ scale measures one factor or
trait. All SAQ scales demonstrate high inter-item congruency, as reflected in the standardized Cronbach
Coefficient Alpha. The items on each SAQ scale are significantly related to the factor or trait each scale
was designed to measure. In other words, each SAQ scale measures one factor, and the factor (or trait)
being measured differs from scale to scale.
SAQ scales (measures) have been shown to be both mutually exclusive and have high inter-item
scale consistency. The SAQ has acceptable and empirically demonstrated reliability. In addition,
inter-item reliability studies have shown that each SAQ scale is an independent measure of the
trait (factor) it was designed to measure.
19. SAQ Sex Differences in a Sample of Municipal Court Clients
A study (Arizona, 1990) involving substance abuse-related offenders processed through the Phoenix
Municipal Court was conducted to evaluate possible sex differences in Substance Abuse Questionnaire
(SAQ) scale scores. SAQ scale reliabilities were also reviewed.
Methods and Results
The SAQ was administered as part of the routine substance abuse evaluation program in Phoenix
Municipal Court to 794 individuals. There were 727 (92%) males and 67 (8%) females included in this
study. Age was distributed as follows: Under 16 years of age (1 male); 16-25 years of age (229 males, 28
females); 26-45 years (450 males, 29 females); 46-55 years (33 males, 6 females); and over 55 years (14
males, 4 females). Ethnic composition is summarized as follows: Caucasian (400 males, 71 females); Black
(62 males, 14 females); Hispanic (151 males, 9 females); American Indian (59 males, 21 females); Asian (1
female); and other (5 males, 1 female). Education is summarized as follows: 8th grade or less (8 males, 1
female); Some High School (182 males, 36 females); GED (69 Males, 6 females); High School Graduates
(216 males, 34 females); Some College (165 males, 34 females); Business/Technical School (8 males);
College Graduates (27 males, 5 females); and Graduate/Professional Degree (2 males, 1 female).
The t-test comparisons of SAQ scales between males and females indicated that there was a significant sex
(male and female) difference on the Resistance Scale (t = 2.29, p<.023). Significant sex differences were
not demonstrated on the Truthfulness Scale, Alcohol Scale, Drug Scale, Aggressivity Scale or the Stress
Coping Abilities Scale. The seeming lack of a consistent pattern of sex differences on a state-by-state
comparison emphasizes the importance of ongoing database research.
Table 9. SAQ reliability, coefficient alpha. Municipal court clients (N=794).
All coefficient alphas are significant at p<.001.
SAQ Coefficient
SCALES Alpha
Truthfulness Scale .80
Alcohol Scale .90
Drug Scale .89
Aggressivity Scale .81
Resistance Scale .85
Stress Coping Abilities .94

24
This study supports the reliability (internal consistency) of the Substance Abuse Questionnaire (SAQ). The
coefficient alphas for all SAQ scales were significant at p<.001. Similar reliability results have been
demonstrated on other client populations.
20. Study of SAQ on a Sample of 100 Low Risk Probationers
A pilot study (Arizona, 2008) involving one hundred low-risk probationers examined the accuracy,
reliability, and validity of the SAQ test.
Methods and Results
Participants in this study consisted of 100 probationers. There were 70 (70.0%) males and 30 (30.0%)
females. Age was distributed as follows: Age: 20 & under (6.0%); 21-30 (35.0%); 31-40 (25.0%); 41-50
(22.0%); 51-60 (9.0%) and 61 & Over (3.0%). Ethnicity: Caucasian (54.0%); African American (8.0%),
Hispanic (25.0%), Asian (1.0%), Native American (12.0%) and Other (0.0%). Education: Eighth grade or
less (3.0%); Some H.S. (20.0%); H.S. graduate/G.E.D. (50.0%); Technical/Business school (1.0%); Some
college (19.0%); College graduate (5.0%); and Advanced Degree (1.0%).
SAQ Reliability
Test reliability refers to a scale’s consistency of measurement. A scale is reliable if a person gets the
same score when re-tested as he/she did when originally tested. Table 10 shows the reliability scores for
each SAQ scale. Perfect reliability is 1.00.
Table 10. SAQ Reliability (N=100, 2008)
Scale Alpha
Truthfulness Scale .88
Alcohol Scale .94
Drugs Scale .93
Aggressivity Scale .89
Resistance Scale .92
Stress Coping Abilities Scale .96
As Table 10 illustrates, all SAQ scales have a reliability of .88 or higher. The professionally accepted
reliability standard is .75. All SAQ scales exceed this standard and demonstrate very impressive
reliability.
SAQ Accuracy
Test accuracy is demonstrated by how close attained scale scores are to predicted scores. Four categories of
risk are assigned: Low Risk (zero to 39th percentile), Medium Risk (40 to 69th percentile), Problem Risk
(70 to 89th percentile), and Severe Problem (90 to 100th percentile). The top row of Table 11 shows the

25
percentages of probationers that were predicted to score within each risk range. (These predicted
percentages for each SAQ scale risk category were obtained from SAQ standardization data.) The body of
Table 11 presents actual attained risk category percentages. Differences between attained and predicted
percentages are shown in bold in parentheses. For example, in terms of the Low Risk range for the
Truthfulness Scale: 39% of offenders were predicted to score within this range; the attained percentage of
offenders who scored in this range was 40%, which is a difference of one percentage point from what was
predicted.
Table 11. SAQ Accuracy (153 Items, N=100)
Scale Low Risk
(39%)
Medium Risk
(30%)
Problem Risk
(20%)
Severe
Problem
(11%)
Truthfulness 40.0 (1.0) 29.0 (1.0) 20.0 (0.0) 11.0 (0.0)
Alcohol 41.0 (2.0) 28.0 (2.0) 20.0 (0.0) 11.0 (0.0)
Drugs 40.0 (1.0) 34.0 (4.0) 17.0 (3.0) 9.0 (2.0)
Aggressivity 41.0 (2.0) 29.0 (1.0) 22.0 (2.0) 8.0 (3.0)
Resistance 42.0 (3.0) 27.0 (3.0) 21.0 (1.0) 10.0 (1.0)
Stress Coping 39.0 (0.0) 30.0 (0.0) 20.0 (0.0) 11.0 (0.0)
Twenty-four out of 25 attained risk range percentiles were within 3.0 points of the predicted percentages.
(The one exception, the Drugs Scale- Medium Risk percentile, was within just 4.0 points of the
predicted percentage.) The average difference between attained percentages and predicted percentages
was only 1.3 points. These results strongly support the accuracy of the SAQ as a probationer-assessment
instrument.
SAQ Validity
Validity refers to a test’s ability to measure what it is purported to measure. The quality of a test is
largely determined by its validity.
Predictive validity refers to a test’s ability to predict observable “criterion” behaviors. In this analysis, our
prediction criterion was whether or not probationers had been treated for alcohol and/or drug problems. It
was expected that “treated” probationers would be identified by higher (70th percentile and above) scores
on the Alcohol and/or Drugs scales. This analysis involved comparing scale scores of the treatment group
with scale scores of the non-treatment group for each scale. It was predicted that the treatment group’s
0%
5%10%
15%20%
25%30%
35%40%
45%
Truthfulness Alcohol Drugs Aggressivity Resistance Stress
Coping
Low Medium Problem Severe Problem

26
scores would be significantly higher than the non-treatment group’s scores. For the Alcohol Scale, scores
for probationers that had been treated for alcohol problems were compared with scores for probationers
who had not been treated for alcohol problems (average scores: 94.5 and 63.5, respectively). T-test results
indicated that the difference in scores was statistically significant (t(98) = 8.13, p<.001, d = 1.24). For the
Drugs Scale, a second analysis compared scores of probationers who had been treated for drug problems
with probationers who had not been treated for dug problems (average scores: 66.3 and 45.1, respectively).
Again, a t-test detected a statistically significant difference in scores (t(98) = 4.23, p = .004, d = 0.87)
between the “treatment” and “non-treatment” group.
The highly significant scale score differences indicate that Alcohol and Drugs Scale scores differentiate
between probationers that have been treated for alcohol and/or drugs problems and probationers that have
not been treated. Scale scores effectively predict the criterion behavior “treatment”. A reasonable inference
is that the SAQ Alcohol and Drugs Scales accurately differentiate between probationers with substance
abuse problems and those without substance abuse problems. These results support the predictive validity
of the SAQ.
Another analysis was performed for the Aggressivity Scale. Two comparative groups- “aggressive” and
“non-aggressive”- were established using “direct admissions”. The aggressive group made the self-
admission that “they were very aggressive”, whereas the non-aggressive group did not. It was predicted that
aggressive probationers would be identified by their notably high scores on the Aggressivity Scale. Scale
scores for the aggressive and non-aggressive groups were compared (average scores: 94.8 and 74.2,
respectively). T-test results revealed that score differences were statistically significant (t(98) = 6.36,
p<.001, d = 1.03).
These results indicate that Agressivity Scale scores differentiate between probationers that admit to
aggressiveness and those that do not. Scale scores effectively predict “aggressiveness”. This finding
provides further support for the validity of the SAQ.
21. SAQ Reliability, Accuracy and Validity (2012)
For this study data from three agencies were combined to evaluate the reliability, accuracy, and validity
of the SAQ.
Methods and Results
Participants in this study consisted of 1, 264 probationers. There were 789 (62.4%) males and 475 (37.6%)
females. Average age was 33.9 for all offenders, 34.1 for male offenders, 33.6 for female offenders.
Ethnicity: Caucasian (71.0%); African American (3.4%), Hispanic (1.0%), Asian (<1.0%), Native
American (23.4%) and Other (1.1%). Education: Eighth grade or less (3.4%); Some H.S. (27.1%); H.S.
graduate/G.E.D. (51.5%); Technical/Business school (13.4%); Some college (<1%); College graduate
(3.8%); and Advanced Degree (<1.0%).
Reliability coefficients exceed professionally accepted standards and scale comparisons confirm the
accuracy of the SAQ in assessing substance abuse client behavior. The statistically significant findings
indicate that Alcohol and Drugs Scale scores differentiate between offenders who that have been treated
for alcohol and/or drugs problems and those who have not been treated. Thus it can be said that the SAQ
Alcohol and Drug Scales accurately differentiate between test takers with substance abuse problems and
those without substance abuse problems. These results support the validity of the SAQ.

27
Reliability
Accuracy
Test accuracy can be calculated by comparing the differences between “predicted” and “attained” risk
range percentages; small differences represent high test accuracy. Accuracy results for the SAQ are
presented in Table 13.
For each scale, respondents are classified into four risk ranges: Low Risk (zero to 39th percentile),
Medium Risk (40th to 69th percentile), Problem Risk (70th to 89th percentile) and Severe Problem (90th to
100th percentile). These four risk ranges were established and subsequently reaffirmed in SAQ research.
Differences between predicted and attained percentages are shown in parentheses and results (in bold)
are used to denote the difference between the predicted and attained scores.
The top row of Table 13 shows the percentage of clients who were predicted to score within each risk
range category. For example, 39% of clients were predicted to score within the Low Risk range for the
Alcohol Scale. The actual percentage of individuals who scored in this range was 40.7%, which is (-1.7)
percentage points below the predicted low risk range. The largest predicted-attained score difference is
in the medium risk range, on the Truthfulness Scale. The large differences on the Truthfulness Scale are
unique results and likely the result of sampling characteristics. All other scale comparisons are even
more accurate. These findings confirm the accuracy of the SAQ in assessing substance abuse client
behavior.
Table 12. SAQ Reliability (N = 1,264, 2012)
Scales Cronbach’s Alpha
Truthfulness .85
Alcohol .95
Drug .87
Aggressivity .87
Resistance .83
Stress Coping Abilities .93

28
Validity
In testing, the term validity refers to the extent that a test measures what it was designed to measure.
When individuals known to have more severe problems attain higher (more severe) scale scores than
individuals known to have fewer or no problems, this supports test validity. In the following validity
analysis, mean scale scores from individuals who reported receiving treatment (treatment group, N=769)
were compared to mean scale scores from individuals who denied participation in treatment (non-
treatment group, N=495). It was predicted that the treatment group’s scores would be significantly
higher than the non-treatment group’s scores for the Alcohol and Drug Scales.
Mean scores on the Alcohol Scale revealed that individuals treated for alcohol problems had more severe
problems (23.4, 16.9) than individuals who had not received treatment. T-test results t(1262) = -8.76,
p<.001, [CI 95% LL -7.92, UL -5.02], identified a statistically significant difference between the
groups.
For the Drugs Scale, mean scale score findings (26.8, 21.5) revealed that the treatment group had more
severe problems than the non treatment group. Again, a t-test results t(1001.0) = -8.82, p <.001, [CI 95%
LL -6.5, UL -4.13] revealed a statistically significant difference between the treatment and non-
treatment group.
22. SAQ Reliability, Accuracy and Validity (2013)
For this study data from a large county trial court program was evaluated to assess reliability, accuracy,
and validity of the SAQ.
Methods and Results
Participants in this study consisted of 1, 179 probationers. There were 884 (75.6%) males and 294 (24.4%)
females. Ethnicity: Caucasian (70.0%); African American (12.8%), Hispanic (11.3%), Asian (<1.0%),
Native American (3.8%) and Other (1.4%). Education: Eighth grade or less (<1%); Some H.S. (27.1%);
H.S. graduate/G.E.D. (56.5%); and College graduate (<1%).
Reliability
Test reliability refers to a scale’s consistency of measurement. Cronbach’s Alpha, a measure of
reliability, was used to measure the internal consistency of the items in each of the SAI scales. Perfect
Table 13. SAQ Accuracy Findings (N = 1,264; 2012)
Scales Low Risk (39%) Medium Risk (30%) Problem Risk (20%) Severe Risk (11%)
Truthfulness 49.1 (10.01) 16.5 (-13.5) 18.9 (-2.1) 15.5 (4.5)
Alcohol 40.7 (1.7) 28.7 (-1.3) 20.3 (.3) 10.3 (-.7)
Drug 40.1 (1.1) 29.7 (-.3) 20.3 (.3) 10.0 (-1.0)
Aggressivity 38.1 (-.9) 32.4 (2.4) 19.9 (-.1) 9.7 (-1.3)
Resistance 37.7 (-1.3) 30.9 (.9) 21.7 (1.7) 9.7 (-1.3)
Stress Coping 40.3 (1.3) 29.7 (-.3) 19.9 (-.1) 10.0 (-1.0)

29
reliability is 1.00 and researchers suggested that reliability coefficients between .70-.90 are appropriate
depending on the nature of the instrument and the construct being measured (Murphy & Davidshofer,
2001).
Coefficients were lower than expected and were inconsistent with previous research. These finding are
considered unique to this sample population.
Accuracy
Test accuracy can be calculated by comparing the differences between “predicted” and “attained” risk
range percentages; small differences represent high test accuracy. Accuracy results for the SAQ are
presented in Table 15.
For each scale, respondents are classified into four risk ranges: Low Risk (zero to 39th percentile),
Medium Risk (40th to 69th percentile), Problem Risk (70th to 89th percentile) and Severe Problem (90th to
100th percentile). These four risk ranges were established and subsequently reaffirmed in SAQ research.
Differences between predicted and attained percentages are shown in parentheses and results (in bold)
are used to denote the difference between the predicted and attained scores.
Offenders’ scores were within expected ranges for each of the SAQ scales, as noted in Table 14. Most
ranges contained percentages that were slightly less than expected indicating that more offenders
than expected scored in the low risk range with the exception of the Alcohol Scale. There were
considerably more low risk drug offenders in this group than expected. The Aggression Scale, problem
risk range exceeded the expected count by 5.4% indicating this group of offenders may have more
problems with aggressive behaviors, thoughts or attitudes.
Table 14. SAQ Reliability (N = 1,179 2013)
Scales Cronbach’s Alpha
Truthfulness .87
Alcohol .89
Drug .83
Aggressivity .67
Resistance .76
Stress Coping Abilities .92

30
Validity
In testing, the term validity refers to the extent that a test measures what it was designed to measure.
When individuals known to have more severe problems attain higher (more severe) scale scores than
individuals known to have fewer or no problems, this supports test validity. In the following validity
analysis, mean scale scores from individuals who reported receiving treatment were compared to mean
scale scores from individuals who denied participation in treatment. It was predicted that the treatment
group’s scores would be significantly higher than the non-treatment group’s scores for the Alcohol and
Drug Scales.
Mean scores on the Alcohol Scale revealed that individuals treated for alcohol problems had more severe
problems (5.48, 5.81) than individuals who had not received treatment. T-test results were not statistically
significant.
For the Drugs Scale, mean scale score findings (6.55, 6.59) revealed that the treatment group had more
severe problems than the non treatment group; however, t-test results revealed that differences were not
statistically significant.
These findings are inconsistent with previous research and are likely the result of group variance and the
small difference between the treatment and non-treatment groups on the Alcohol and Drug Scale.
23. SAQ Reliability (2013)
For this study data from a county supported assessment program was evaluated to assess reliability of the
SAQ. Data were retrieved from the Behavior Data Systems online database for analysis.
Methods and Results
Participants in this study consisted of 245 probationers. There were 166 (67.8%) males and 79 (32.2%)
females. Ethnicity: Caucasian (86.6%); African American (9.0%), Hispanic (<1%), Other (<1%).
Education: Eighth grade or less (1.3%); Some H.S. (27.0%); H.S. graduate/G.E.D. (57.0%); and College
graduate (4.2%).
Table 15. SAQ Accuracy Findings (N = 1, 179, 2013)
Scales Low Risk (39%) Medium Risk (30%) Problem Risk (20%) Severe Risk (11%)
Truthfulness 42.0 (3.0) 26.7 (3.3) 22.1 (2.2) 9.2 (-1.8)
Alcohol 36.7 (-2.3) 33.4 (3.4) 20.0 (0) 9.9 (-1.1)
Drug 48.4 (9.4) 21.9 (-8.1) 18.2 (-1.8) 11.5 (.5)
Aggressivity 40.5 (1.5) 27.1 (-2.9) 25.4 (5.4) 7.0 (-4.0)
Resistance 37.9 (1.1) 32.7 (2.7) 20.4 (.4) 9.0 (-2.0)
Stress Coping 40.2 (1.2) 29.2 (-.8) 20.4 (.4) 10.2 (-.8)

31
When asked about participation in treatment services: 52.2% (128) reported they had been in treatment
for drug related problems, 31.8% (78) reported they had been in treatment for alcohol related problems,
and 56.4% (138) had attended treatment one or more times.
When asked about arrests or involvement with law enforcement: 21.2% (52) reported a conviction for
assault, domestic violence, or a violent crime, 10.6% (26) reported causing one or more traffic accidents
within the past 5 years, and 80.1% (194) were on probation or parole at the time they completed the
SAQ.
Reliability
Test reliability refers to a scale’s consistency of measurement. Cronbach’s Alpha, a measure of
reliability, was used to measure the internal consistency of the items in each of the SAQ scales. Perfect
reliability is 1.00 and researchers suggested that reliability coefficients between .70-.80 are appropriate
depending on the nature of the instrument and the construct being measured (Murphy & Davidshofer,
2001).
Coefficients exceeded the professional accepted standard and confirm the reliability of the SAQ for use
across diverse clinical and court related settings.
24. SAQ Reliability Validity (2014)
For this study data from a community service provider in Southeastern region of the United States were
evaluated to assess reliability, accuracy, and validity of the SAQ. All online data submitted through
November 30, 2014 were used in these analyses.
Methods and Results
Participants in this study consisted of 520 probationers. There were 363 (69.8%) males and 157 (30.2%)
females. Ethnicity: Caucasian (48.8%); African American (44.2%), Hispanic (4.0%), Asian (1.3%), and
Other (1.5%). Education: Eighth grade or less (<1%); Some H.S. (12.9%); H.S. graduate/G.E.D. (37.2%);
Some college (36.9%) and College graduate (10.0%).
Reliability
Test reliability refers to a scale’s consistency of measurement. Cronbach’s Alpha, a measure of
reliability, was used to measure the internal consistency of the items in each of the SAI scales. Perfect
Table 16. SAQ Reliability (N = 245, 2013)
Scales Cronbach’s Alpha
Truthfulness .87
Alcohol .92
Drug .90
Aggressivity .81
Resistance .82
Stress Management .94

32
reliability is 1.00 and researchers suggested that reliability coefficients between .70-.90 are appropriate
depending on the nature of the instrument and the construct being measured (Murphy & Davidshofer,
2001).
Coefficients were lower than expected and were inconsistent with previous research. These finding are
considered unique to this sample population.
Validity
In testing, the term validity refers to the extent that a test measures what it was designed to measure. A
test cannot be accurate without being valid. When individuals known to have more severe problems
attain higher (more severe) scale scores than individuals known to have fewer or no problems, the
validity of the test is supported.
In the following validity analysis, mean scale scores from individuals who reported receiving treatment
(treatment group) were compared to mean scale scores from individuals who denied participation in
treatment (non-treatment group). It was predicted that the treatment group’s scores would be significantly
higher than the non-treatment group’s scores. This process was conducted on the Alcohol and Drug Scales.
4% (20) reported treatment for alcohol misuse/abuse
5% (28) reported treatment for drug misuse/abuse
Mean scores on the Alcohol Scale revealed that individuals treated for alcohol problems had more severe
problems (16.20, 5.35) than individuals who had not received treatment. Adjustments were made to t and
df to account for differences in variance. T-test results t (19.66) = 5.47 p <.001, [CI 95% LL 6.71, UL 14.99
identified a statistically significant difference between the groups.
For the Drug Scale, mean scale score findings (21.89, 10.10) revealed that the treatment group had more
severe problems than the non-treatment group. Adjustments were made to t and df to account for
differences in variance. Again, a t-test results t (29.77) = 7.57 p = <.001, [CI 95% LL 8.60, UL 14.95]
revealed a statistically significant difference between the treatment and non-treatment group.
Table 17. SAQ Reliability (N = 520, 2014)
Scales Cronbach’s Alpha
Truthfulness .88
Alcohol .77
Drug .87
Aggressivity .77
Resistance .76
Stress Coping Abilities .93

33
The statistically significant findings indicate that Alcohol and Drugs Scale scores differentiate between
offenders who that have been treated for alcohol and/or drugs problems and offenders who have not been
treated. Thus it can be said that the SAQ Alcohol and Drug Scales accurately differentiate offenders with
substance abuse problems and those without substance abuse problems. These results support the validity
scores of the SAQ.
25. Confirmation study of SAQ Reliability and Validity (2014)
For this study data from a community service provider in Southeastern region of the United States were
evaluated to assess reliability, accuracy, and validity of the SAQ. All online data submitted through
November 30, 2014 were used in these analyses.
Methods and Results
Participants in this study consisted of 232 probationers. Gender: 206 (69.8%) males and 70 (30.2%)
females. Race/Ethnicity: Caucasian (88.8%); African American (8.2%), Native American (1.3%), and
Other (1.7%). Education: Eighth grade or less (1.7%); Some H.S. (22.8%); H.S. graduate/G.E.D. (57.2%);
some college (12.1%) and college graduate (2.7%).
Reliability
Test reliability refers to a scale’s consistency of measurement. Cronbach’s Alpha, a measure of
reliability, measured the internal consistency of the items in each scale of the SAQ. Perfect reliability is
1.00. The professionally accepted reliability standard for this type of instrument is .70- 80 (Murphy &
Davidshofer, 2001).
As noted in Table 16, all scales exceed the professionally accepted standard and support the SAQ as a
reliable instrument for substance abuse client screening.
Validity
In testing, the term validity refers to the extent that a test measures what it was designed to measure. A
test cannot be accurate without being valid. When individuals known to have more severe problems
attain higher (more severe) scale scores than individuals known to have fewer or no problems, this
supports test validity. In the following validity analysis, mean scale scores from individuals who
reported receiving treatment (treatment group) were compared to mean scale scores from individuals
Table 18. SAQ Reliability (N = 232)
Scales Cronbach’s Alpha
Truthfulness .86
Alcohol .92
Drug .89
Aggressivity .84
Resistance .80
Stress Coping Abilities .93

34
who denied participation in treatment (non-treatment group). It was predicted that the treatment group’s
scores would be significantly higher than the non-treatment group’s scores for the Alcohol and Drug
Scales.
Mean scores on the Alcohol Scale revealed that individuals treated for alcohol problems had more severe
problems (19.72, 7.58) than individuals who had not received treatment. T-test results t(98.41) = 8.37,
p<.001, [CI 95% LL 9.26, UL 15.02], identified a statistically significant difference between the
groups.
For the Drug Scale, mean scale score findings (26.49, 17.31) revealed that the treatment group had more
severe problems than the non treatment group. Again, a t-test results t(229.04) = 8.90, p <.001, [CI 95% LL
7.15, UL 11.22] revealed a statistically significant difference between the treatment and non-
treatment group.
The statistically significant findings indicate that Alcohol and Drugs Scale scores differentiate between
offenders who that have been treated for alcohol and/or drugs problems and those who have not been
treated. Thus it can be said that the SAQ Alcohol and Drug Scales accurately differentiate between test
takers with substance abuse problems and those without substance abuse problems. These results support
the validity of the SAQ.
SUMMARY
In conclusion, this document is not intended as an exhaustive compilation of SAQ research. Yet, it does
summarize many studies and statistics that support the reliability and validity of the SAQ. Based on this
research, the SAQ presents an increasingly accurate picture of substance (alcohol and other drugs) abusers
and the risk they represent. The SAQ provides a sound empirical foundation for responsible decision
making.
Summarized research demonstrates that the SAQ is a reliable, valid and accurate instrument for client
assessment. It is reasonable to conclude that the SAQ does what it purports to do. The SAQ acquires a vast
amount of relevant information for staff review prior to decision making. Empirically based scales are
objective and accurate. Assessment has shifted from subjective opinions to objective accountability.
The SAQ is not a personality test, nor is it a clinical diagnostic instrument. Yet, it is much more than just
another alcohol or drug test. The SAQ is an adult risk and needs assessment instrument.
As observed at the beginning of this research summary, SAQ studies are presented chronologically, as they
were completed. The Stress Quotient research was presented first, then SAQ validation research, and SAQ
reliability research. The research studies are presented chronologically within each section. This gives the
reader the opportunity to observe the evolution of the SAQ into a state-of-the-art risk and needs assessment
instrument. Recent studies demonstrate the impressive reliability and accuracy of the SAQ.
Areas for future research are many and complex. SAQ research continues to evaluate age, gender, ethnicity,
education, and urban vs. rural. Consistent with the foregoing, we encourage more research on demographic,
cultural and environmental factors impacting on client adjustment, risk and need.

35
People interested in conducting SAQ - related research should contact Risk & Needs Assessment, Inc.
Please include a research outline containing design methodology, contemplated statistical analysis and the
anticipated completion date. Students must include their faculty advisors name, address and telephone
number. Faculty advisors and/or research principles will be contacted prior to Risk & Needs Assessment,
Inc. decision regarding proceeding.


