Page 1
Substantial compositional turnover of fungalcommunities in an alpine ridge-to-snowbed gradient
FANG YAO,*1 UNNI VIK,*1 ANNE K. BRYSTING,† TOR CARLSEN,* RUNE HALVORSEN‡
and HAVARD KAUSERUD*
*Microbial Evolution Research Group, Department of Biosciences, University of Oslo, P.O. Box 1066, 0316 Oslo, Norway,
†Centre for Ecological and Evolutionary Synthesis, Department of Biosciences, University of Oslo, P.O. Box 1066, 0316 Oslo,
Norway, ‡Department of Research and Collections, Natural History Museum, University of Oslo, P.O. Box 1172 Blindern, 0318
Oslo, Norway
Abstract
The main gradient in vascular plant, bryophyte and lichen species composition in
alpine areas, structured by the topographic gradient from wind-exposed ridges to
snowbeds, has been extensively studied. Tolerance to environmental stress, resulting
from wind abrasion and desiccation towards windswept ridges or reduced growing
season due to prolonged snow cover towards snowbeds, is an important ecological
mechanism in this gradient. The extent to which belowground fungal communities are
structured by the same topographic gradient and the eventual mechanisms involved
are less well known. In this study, we analysed variation in fungal diversity and com-
munity composition associated with roots of the ectomycorrhizal plant Bistorta vivi-para along the ridge-to-snowbed gradient. We collected root samples from fifty
B. vivipara plants in ten plots in an alpine area in central Norway. The fungal commu-
nities were analysed using 454 pyrosequencing analyses of tag-encoded ITS1 ampli-
cons. A distinct gradient in the fungal community composition was found that
coincided with variation from ridge to snowbeds. This gradient was paralleled by
change in soil content of carbon, nitrogen and phosphorus. A large proportion (66%)
of the detected 801 nonsingleton operational taxonomic units (OTUs) were ascomyce-
tes, while basidiomycetes dominated quantitatively (i.e. with respect to number of
reads). Numerous fungal OTUs, many with taxonomic affinity to Sebacinales, Cortina-rius and Meliniomyces, showed distinct affinities either to ridge or to snowbed plots,
indicating habitat specialization. The compositional turnover of fungal communities
along the gradient was not paralleled by a gradient in species richness.
Keywords: Bistorta vivipara, ectomycorrhizae, high-throughput sequencing, microbial ecology,
ridge-to-snowbed gradient, root-associated fungi
Received 3 May 2013; revision received 28 June 2013; accepted 1 July 2013
Introduction
There is a strong relationship between the local topo-
graphic gradient from ridge-to-snowbed and the species
composition of vascular plants, bryophytes and lichens
in alpine areas (Gjærevoll 1956; Dahl 1957; Økland &
Bendiksen 1985; Odland & Munkejord 2008). The
vegetation gradient is shaped by uneven distribution of
snow cover in winter over years, brought about by
strong winds (Vestergren 1902; Dahl 1957). Species are
distributed along the ridge-to-snowbed gradient by
their tolerance to environmental stress. The risk of frost,
wind abrasion and desiccation increases towards the
windswept ridges, where as the snow cover in the
snowbeds provides more stable conditions during win-
ters. Biological activity, such as growth of fungal
hyphae has been detected under snow-covered sites in
alpine areas (Kuhnert et al. 2012). Between these
Correspondence: Unni Vik, Fax: +47 22 85 47 26; E-mail: unni.
[email protected] authors have contributed equally to this work.
© 2013 John Wiley & Sons Ltd
Molecular Ecology (2013) doi: 10.1111/mec.12437
Page 2
extreme habitats, the lee sides provide optimal habitats
for many species with snow protection in winter, which
melts out early in the summer (Wijk 1986). Important
environmental complex gradients such as soil moisture
supply, soil organic content, soil reaction, soil stability
and concentrations of important elements may covary
with parts of the ridge-to-snowbed gradient, depending
on local conditions (Gjærevoll 1956; Dahl 1957; Baadsvik
1974; Økland & Bendiksen 1985; Odland & Munkejord
2008).
The mycorrhizal symbiosis between fungi and plant
roots is among the most ancient and prevalent eukary-
otic symbioses on Earth, crucial for the composition
and functioning of terrestrial ecosystems. Ectomycorrh-
izae (ECM) is most common in woody plants and is
highly important for plant productivity in boreal and
temperate forests. Nutrient availability in these ecosys-
tems is usually low, and most of the nutrients are pres-
ent in organic form in litter and humus (Vestergren
1902; Dahl 1957; Smith & Read 2008). Several recent
studies have demonstrated high diversity of ECM fungi
in alpine and arctic ecosystems (Bjorbækmo et al. 2010;
Geml et al. 2011; Blaalid et al. 2012). Most ECM-forming
plants are trees and shrubs, and due to the size of their
root systems, it is difficult to explore their entire root-
associated fungal assemblages. However, a few herbs,
including the circumpolar perennial plant Bistorta vivi-
para (L.) Delarbre (syn. Polygonum viviparum L.) in fam-
ily Polygonaceae, form ECM (e.g. Resvoll 1917;
Nordhagen 1943; Dahl 1957; Read & Haselwandter
1981). The small and condensed root system of B. vivi-
para allows the entire fungal community associated with
each plant to be sampled and analysed (Blaalid et al.
2012; Kauserud et al. 2012). B. vivipara produces an
underground rhizome that grows with age (Diggle
1997), from where the finer root threads are attached.
B. vivipara has a wide ecological amplitude and often
occurs as a pioneer species in arctic and alpine environ-
ments (Dormann et al. 2002).
The structure and composition of fungal communities
are influenced by numerous factors and complex inter-
actions. Toljander et al. (2006) found that pronounced
changes in ECM fungal communities along an environ-
mental gradient in a boreal forest in Sweden were
strongly correlated with various soil properties. For
example, extractable NH4 was a strong determinant of
the ECM community, the composition of which was
also related to moisture availability (Toljander et al.
2006). Similarly, variation in composition of soil fungal
communities in an alpine habitat was structured
according to vegetation types and degree of soil organic
matter (Zinger et al. 2009, 2010). Several studies (e.g.
(Zinger et al. 2010; Newbound et al. 2012) have reported
a strong structuring effect of pH on fungal community
composition. How the below ground fungal communities
are influenced and possibly structured by processes that
give rise to the strong ridge-to-snowbed vegetation gradi-
ent for plants and lichens is not yet known.
Studying ecological factors that underlie the dynam-
ics of natural microbial communities remain a challenge
because of the high taxonomic diversity in such com-
munities (Hawksworth 2001). The availability of high-
throughput sequencing (HTS) technologies has initiated
a new era of research on fungal ecology and enabled
extensive studies of complex fungal communities
(Wallander et al. 2010; Kauserud et al. 2012; Clemmen-
sen et al. 2013). HTS analyses of the nuclear ribosomal
internal transcribed spacer (ITS) region, which has been
adopted as a validated DNA barcode marker for fungal
species identification (Seifert 2009; Schoch et al. 2012),
provide a powerful tool for studying fungal diversity in
environmental samples.
Our aim was to explore fungal communities of ectomy-
corrhizal root systems of B. vivipara in a ridge-to-snow-
bed gradient using 454 high-throughput sequencing of
the ITS 1 region. We wanted to test (i) if there are differ-
ences in the composition and diversity of fungi associ-
ated with B. vivipara between ridge and snowbed, (ii) if
the fungal communities are spatially structured across
sampling sites, independent of vegetation type and (iii) if
soil nutrient concentrations affect the diversity and com-
position of fungi associated with B. vivipara roots.
Materials and methods
Sampling
The study area (60°35′N, 007°30′E, 1229 -1244 m above
sea level) was located in the mid-alpine region at Finse,
Hordaland, Norway. All samples were collected during
a two-day period in July 2011. Five 1.5 m 9 1.5 m plots
were placed within each of ridge and snowbed. A grid
with mesh width of 15 cm was superimposed on each
plot. The 81 (9 9 9) grid-line intercepts were used as a
point frame for cover estimation by the point intercept
method (Br�athen & Hagberg 2009): at each grid-line
intercept, the species (or, alternatively, stone or bare
soil) first touched by a pin passed vertically through
the vegetation were given a score of one. Species pres-
ent in the plot, but not registered by the point intercept
method were assigned a score of 0.5. Within each plot,
the B. vivipara plant situated closest to each of five pre-
defined positions was sampled: one at the intersection
between the two diagonals and four halfway between
the intersection of the diagonals and each corner. Soil
samples were collected under each plant. A total of 50
plants and 50 soil samples were collected. The soil
samples were stored at –18 °C within three hours after
© 2013 John Wiley & Sons Ltd
2 F . YAO ET AL.
Page 3
collection. The root system of each plant was carefully
washed to remove all soil and plant debris and placed
in 50-mL BD FalconTM tubes (BD Bioscience, San Jose)
before fresh weight of the root system was recorded. To
each tube, 1200 lL CTAB-lysis buffer (AppliChem
GmbH, Ottoweg, Germany) was added before storage
at –18 °C. Lengths, widths and heights of the plant
rhizomes were measured.
DNA extraction and 454 sequencing
After addition of 10 6.2 mm Ceramic beads (M.P.
Biomedicals, CA, USA) and additional 5 mL 2% CTAB
buffer with 2-mercaptoethanol (Sigma Chemical Co,
Steinheim, Germany), all 50 root systems were crushed
for 60 s at 4.0 m/s on a Fast Prep-24 beadbeater (M.P.
Biomedicals) and centrifuged at 1300 rpm for 30 s. Two
samples (R1-73 and R2-63) were crushed for additional
60 s (to be properly crushed) and centrifuged again.
From each tube, 2 mL of the aquatic phase was frozen
at –18 °C. The samples were randomized before DNA
extraction to reduce methodological biases. Five ran-
domly selected samples were run in parallel as repli-
cates to test for methodological biases (see Kauserud
et al. 2012). DNA extraction using 600 lL of the crushed
material was performed with the Soil DNA isolation Kit
(OMEGA Bio-tek, Norcross, GA, USA) according to the
manufacturer’s directions.
The ITS1 region was amplified by subjecting 2 lLDNA of each sample to a nested PCR approach, as out-
lined in Blaalid et al. (2012). A nested approach was
chosen in order to generate highly replicable results
(see Kauserud et al. 2012) and to avoid biases known to
occur in barcode ligation approaches (Gillevet et al.
2010). However, both rounds of PCR might exclude cer-
tain fungal groups, such as Tulasnellaceae due to pri-
mer biases (Taylor & McCormick 2008; Bellemain et al.
2010). In the first PCR, the fungal-specific primers ITS1F
and ITS4 were used to amplify the entire ITS region
(White et al. 1990; Gardes & Bruns 1993) using the fol-
lowing PCR protocol: denaturation for 30 s at 98 °C, fol-lowed by 30 cycles of denaturation for 10 s at 98 °C,annealing for 20 s at 50 °C and extension for 20 s at
70 °C, and then followed by a step of final extension for
7 min at 70 °C and cool-down at 10 °C. Subsequently,the ITS1 region was amplified using the primers ITS2
and ITS5 (White et al. 1990) with 4 lL 209 diluted tem-
plate from the first PCR. In the second PCR, samples
were tagged in both ends by different pyrotags with a
length of 10 bp. The same PCR protocol was used. We
ran all PCR reactions in triplicates and pooled them to
level out tentative stochastic PCR biases. The resulting
PCR products were cleaned up by using the Wizard�
SV Gel and PCR Clean-Up System kit (Promega,
Madison, WI, USA) and normalized using the Sequal-
PrepTM Normalization Plate (96) kit (Invitrogen Inc., CA,
USA). The PCR products were pyrosequenced in four
lanes on a half 454 plate (Roche GS FLX Titanium
Series) at the Norwegian Sequencing Center (University
of Oslo, Norway).
Soil sample analyses
We thawed the soil samples before sieving them using
sterile milliQ water to remove plant roots and debris. The
remaining soil was then dried at 60 °C. The concentrationof phosphorus (P) was measured by the potassium
persulfate (K2S2O8) extraction method. Samples were
placed in 10 ml 1% K2S2O8 at 121 °C for 30 min, and the
extract then analysed using a Bran Luebbe autoanalyzer
(Bran Luebbe, Norderstedt Germany) with the Multitest
MT method (no. G-297-03). The concentration of soil
carbon (C) and nitrogen (N) was measured by a Thermo
Finnigan EA 1112 Series Flash Elemental Analyzer
(Thermo Scientific, Italy).
Bioinformatics analyses
We analysed the read data using QIIME v. 1.5.0
(Caporaso et al. 2010). Reads with length <250 bp or
>500 bp, an average phred quality score <50 and/or
any mismatch against the tags or ITS1 primers, were
removed. Denoiser v. 1.5.0 (Reeder & Knight 2010), as
implemented in QIIME v. 1.5.0, was used to denoise the
remaining 151,642 reads. The denoised reads were clus-
tered into operational taxonomic units (OTUs) using a
97% similarity threshold and the uclust algorithm as
implemented in QIIME v. 1.5. The most abundant read
in each cluster will be referred to as the representative
sequence. Putative chimeras were identified and
removed based on: (i) being identified as chimeric by
the perseus algorithm as implemented in mothur
v. 1.26.0 (Schloss et al. 2009), (ii) having a top BLAST
match with <90% coverage and <90% identity to a
known fungal sequence and (iii) not occurring indepen-
dently in more than one sample. OTUs represented by
a single read (singletons) and OTUs detected in the
negative control were also removed from the data set.
The representative sequence from each of the remaining
OTUs were submitted to BLASTn (Altschul et al. 1997)
for comparison against the GenBank nonredundant
(NCBI-nr) database. OTUs with best matches to nonfun-
gal accessions were removed. Moreover, only one
randomly chosen sample from each of the replicated
pairs (S2.78.2, R1.55, R3.68, R4.45 and R5.32.2) was
included in the further analyses. The raw data have
been accessioned in Dryad, accession doi:10.5061/
dryad.216tp.
© 2013 John Wiley & Sons Ltd
ALPINE FUNGAL COMMUNITIES 3
Page 4
Statistical analyses
All statistical analyses were made after transformation
to binary (presence/absence) data. EstimateS v. 7.5.2
(Colwell 2009) was used to calculate the shared number
of OTUs in each pair of samples. We tested whether the
OTUs were significantly associated with either ridge or
snowbed using the G-test as implemented in QIIME
v. 1.5.0, with the null hypothesis that each OTU was
evenly distributed among groups. Patterns of OTU rich-
ness and community composition were analysed using
the R software v. 2.15.2 (R Core Team 2012). Accumula-
tion curves for OTU richness versus sampling effort
and estimates of total OTU richness were calculated
according to (Ugland et al. 2003), as implemented in the
R package vegan (Oksanen et al. 2012). GLM was used
to relate OTU richness to environmental variables and
rhizome characteristics. In order to test if larger
rhizomes and root systems inhabit more fungal OTUs
and number of fungal reads, correlation tests were per-
formed in R. Tests were run using the cor.test() function
with Pearson method between rhizome size (rhizome
length 9 rhizome height 9 rhizome width), rhizome
length, rhizome height, rhizome width as well as root
system weight against number of OTUs and reads.
Two-dimensional global nonmetric multidimensional
scaling (GNMDS; (Kruskal 1964; Minchin 1987) and
detrended correspondence analysis (DCA; (Hill 1979;
Hill & Gauch 1980) ordinations were performed in R,
using the R packages vegan and MASS (Venables &
Ripley 2002). The GNMDS was run with the following
options and settings: number of axes = 2, number of
random starts = 100; Bray–Curtis dissimilarities [(Bray
& Curtis 1957), which for qualitative data reduces to
Sørensen’s index (Sørensen 1948)], maximum number of
iterations = 1000, stress convergence criterion = 10–7.
The minimum stress solution, found from more than
one random start, was used after postprocessing by
which axes were rotated to principal components and
rescaled to half-change (H.C.) units of compositional
turnover. DCA was run with default settings. Corre-
spondence between DCA and GNMDS axes was
assessed using Kendall’s rank correlation coefficients,
calculated between axis pairs. Environmental variables
and size and weight of plant rhizomes were fit into the
GNMDS ordination diagram by use of the envfit() com-
mand of vegan. An ANOVA was run to test if the
GNMDS scores obtained for each vegetation type along
both GNMDS axes showed any sign of spatial structure
within the ordination.
An OTU/sample matrix containing only known ECM
fungi (Tedersoo et al. 2010) was extracted from the full
data matrix and analysed separately. A GNMDS analy-
sis was run, using the above settings, along with a t-test
where the number of ECM OTUs per root system was
compared across ridge and snowbeds.
The original vegetation scores obtained from the pin
intercept method, measured on a scale of 0.5–56, were
transformed to a new scale of 1–8 by use the following
formula y = 1.33(x0.411), as recommended by Eilertsen
et al. (1990) and successfully implemented by Birkeland
(2012). y gives the new weighted value, 1.33 is the
abundance scale and 0.411 the weighting parameter.
The weighted vegetation scores were used to run a
GNMDS with three axes, using the same conditions as
for the GNMDS of fungal OTUs, as well as a DCA with
default settings. Correspondence of the GNMDS and
DCA axes was assessed using Kendall’s rank correla-
tion coefficients, calculated between axis pairs. The cor-
respondence of GNMDS axes of vegetation data and
fungal communities was tested using a Procrustes test
in R with the package vegan. To test whether the con-
centrations of N, C and P in soil were significantly dif-
ferent between the sample types, a split-plot GLM
(Crawley 2007) was run.
Results
Vegetation and soil characteristics of ridges andsnowbeds
Altogether, 47 plant species were recorded in the ten
plots, of which six were bryophytes, 32 vascular plants
and nine lichen species. Thirty-two species were
recorded in the ridge plots and 38 species in the snow-
bed plots. The weighted data of the vegetation cover
showed a clear dominance of lichens in the ridge plots
(28.4%), compared to the snowbeds (6.6%). Salix herbacea
dominated the vegetation in the snowbeds (16.0%),
whereas it was less numerous in the ridge plots (5.4%;
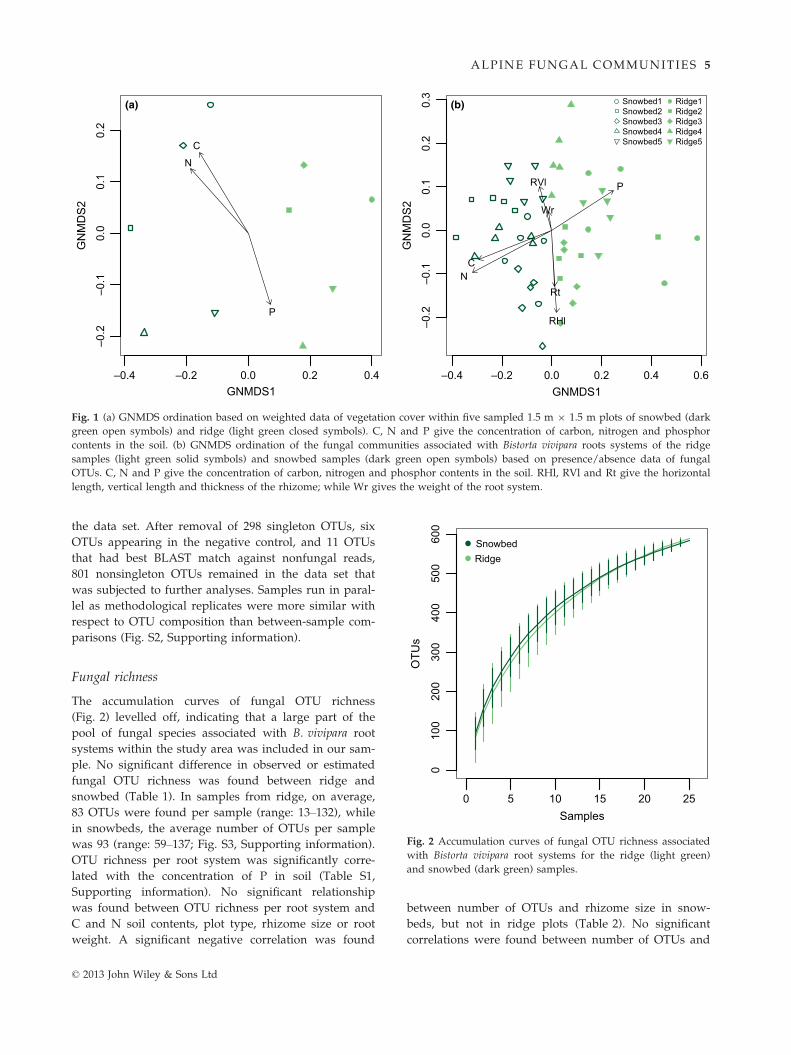
Fig. S1, Supporting information). The GNMDS analysis
of the vegetation data separated the snowbed and ridge
plots along axis one (Fig. 1a). The average concentration
of C in soil was 9.9% (by weight) in the ridge plots,
whereas it was 32.6% in the snowbed plots. Corre-
spondingly, the average concentration of N was 0.6% in
ridge plots and 2.2% in snowbed plots. The average
concentration of P was 1.4% in ridge plots and 1.1% in
snowbed plots. The concentrations of C and N were sig-
nificantly different in the ridge and the snowbed plots
(P < 0.05).
Data set properties
We obtained 191,099 reads of which 151,642 were
retained after filtering. Using a 97% read similarity cut-
off, the reads clustered into 1,172 OTUs. Fifty-six of the
OTUs were identified as chimeras and removed from
© 2013 John Wiley & Sons Ltd
4 F . YAO ET AL.
Page 5
the data set. After removal of 298 singleton OTUs, six
OTUs appearing in the negative control, and 11 OTUs
that had best BLAST match against nonfungal reads,
801 nonsingleton OTUs remained in the data set that
was subjected to further analyses. Samples run in paral-
lel as methodological replicates were more similar with
respect to OTU composition than between-sample com-
parisons (Fig. S2, Supporting information).
Fungal richness
The accumulation curves of fungal OTU richness
(Fig. 2) levelled off, indicating that a large part of the
pool of fungal species associated with B. vivipara root
systems within the study area was included in our sam-
ple. No significant difference in observed or estimated
fungal OTU richness was found between ridge and
snowbed (Table 1). In samples from ridge, on average,
83 OTUs were found per sample (range: 13–132), while
in snowbeds, the average number of OTUs per sample
was 93 (range: 59–137; Fig. S3, Supporting information).
OTU richness per root system was significantly corre-
lated with the concentration of P in soil (Table S1,
Supporting information). No significant relationship
was found between OTU richness per root system and
C and N soil contents, plot type, rhizome size or root
weight. A significant negative correlation was found
between number of OTUs and rhizome size in snow-
beds, but not in ridge plots (Table 2). No significant
correlations were found between number of OTUs and
–0.4 –0.2 0.0 0.2 0.4
–0.2
–0.1
0.0
0.1
0.2
GNMDS1
GNMDS2
(a) (b)
C
N
P
–0.4 –0.2 0.0 0.2 0.4 0.6
–0.2
–0.1
0.0
0.1
0.2
0.3
GNMDS1GNMDS2
Ridge1Ridge2Ridge3Ridge4Ridge5
Snowbed1Snowbed2Snowbed3Snowbed4Snowbed5
P
NC
Wr
RVl
RHl
Rt
Fig. 1 (a) GNMDS ordination based on weighted data of vegetation cover within five sampled 1.5 m 9 1.5 m plots of snowbed (dark
green open symbols) and ridge (light green closed symbols). C, N and P give the concentration of carbon, nitrogen and phosphor
contents in the soil. (b) GNMDS ordination of the fungal communities associated with Bistorta vivipara roots systems of the ridge
samples (light green solid symbols) and snowbed samples (dark green open symbols) based on presence/absence data of fungal
OTUs. C, N and P give the concentration of carbon, nitrogen and phosphor contents in the soil. RHl, RVl and Rt give the horizontal
length, vertical length and thickness of the rhizome; while Wr gives the weight of the root system.
0 5 10 15 20 25
0100
200
300
400
500
600
Samples
OTUs
SnowbedRidge
Fig. 2 Accumulation curves of fungal OTU richness associated
with Bistorta vivipara root systems for the ridge (light green)
and snowbed (dark green) samples.
© 2013 John Wiley & Sons Ltd
ALPINE FUNGAL COMMUNITIES 5
Page 6
root weight or between number of reads and rhizome
size and root weight in any of the habitat types, except
for a significant positive correlation between rhizome
width and number of reads in the ridge plots. The
number of ECM OTUs was significantly higher in
snowbeds (26.3 in average) than in the ridges (14.8 in
average, t-test P-value < 0.001) (Fig. S4, Supporting
information).
Taxonomic composition
The taxonomic distribution of detected fungal OTUs is
summarized in Table 3, and the 15 most common OTUs
are listed in Table 4. Most OTUs (66.5%) belonged to
Ascomycota and the order Helotiales (52.7%). Only
25.4% of the OTUs belonged to Basidiomycetes, of
which most (23.2%) belonged to Agaricomycetes. Other
fungal groups, including Glomeromycota, Zygomycota
and Chytridiomycota, only comprised 1.9% of the
OTUs. Summarizing the total number of reads across
taxonomy (Table 3) showed that Basidomycota (65.7%),
class Agaricomycetes (64.7%), was quantitatively most
abundant. While Russulales only accounted for 2.6% of
the OTUs, as many as 26.9% of the obtained reads were
affiliated with this order. Conversely, the ascomycetous
groups were far less abundant when recorded as num-
ber of reads. Although not significantly different (chi-
square tests, P > 0.05), the Basidiomycetes and Agarico-
mycetes were relatively more abundant in snowbed
than in ridge plots (Table 3). The G-test revealed that
some OTUs were affiliated with either ridge or snow-
bed (Table S2).
Fungal community composition
The most commonly encountered OTU (OTU ID 1089
with the best match to Articulospora sp.; GenBank
Accession no JN995644) appeared in all root systems,
while a high proportion of the OTUs (20.6%) was
detected in only one single root system (Fig. S3c). The
fungal community composition differed highly between
root systems: on average, only 22 of the 801 (2.7%)
OTUs were shared in pairwise comparisons across all
samples. However, both the GNMDS and DCA ordina-
tion analyses based on presence/absence data revealed
clear differences in fungal community composition
between ridge and snowbeds, both for the data set
containing all fungal OTUs (Fig. 1b; DCA not shown)
as well as for the data set containing only known
ECM-forming fungi (data not shown). The GNMDS
ordination axes 1 and 2 were strongly correlated with
the corresponding DCA axes 1 and 2 (Kendall’s s = 0.88
and 0.54, respectively). This is a strong argument for
the existence of strong compositional structure in the
Table 1 Observed and estimated fungal species (OTU) richness associated with Bistorta vivipara root systems in snowbed and ridge.
Richness estimates are given in (1) order jackknife (and corresponding confidence intervals), (2) order jackkinfe, as well as bootstrap
(with corresponding confidence intervals)
Observed Chao (1) Order jackknife (2) Order jackknife Bootstrap
Snowbed 584 722.1 � 27.0 755.84 � 41.7 818.25 666.90 � 23.4
Ridge 589 718.4 � 24.5 722.40 � 43.5 823.77 679.43 � 26.4
Table 2 Correlation tests (with corresponding P-values) between number of OTUs or number of reads of the fungal communities
and rhizome measurements and root weight of the associated Bistorta vivipara plant. Rhizome size is calculated as: rhizome
length 9 rhizome height 9 rhizome width. The variability gives the minimum and maximum sizes as well as the average (in
brackets)
Snowbed Ridge
Variability No. of OTUs No. of reads Variability No. of OTUs No. of reads
Rhizome
size (cm3)
0.25–4.31 (1.61) �0.432 (P = 0.035) 0.128 (P = 0.551) 0.49–4.17 (1.40) 0.017 (P = 0.938) 0.238 (P = 0.252)
Rhizome
length (cm)
0.47–2.13 (1.06) �0.029 (P = 0.893) 0.229 (P = 0.281) 0.50–2.59 (1.25) 0.264 (P = 0.203) 0.303 (P = 0.141)
Rhizome
width (cm)
0.46–0.86 (0.65) �0.251 (P = 0.237) 0.207 (P = 0.331) 0.49–1.62 (0.70) 0.011 (P = 0.958) 0.668 (P < 0.001)
Rhizome
height (cm)
0.73–6.81 (2.35) �0.372 (P = 0.074) 0.053 (P = 0.806) 0.49–2.66 (1.62) �0.193 (P = 0.355) �0.050 (P = 0.811)
Root weight (g) 0.01–0.17 (0.07) �0.297 (P = 0.159) 0.124 (P = 0.564) 0.01–0.15 (0.06) 0.098 (P = 0.648) 0.130 (P = 0.544)
Bold numbers indicate significant P < 0.05.
© 2013 John Wiley & Sons Ltd
6 F . YAO ET AL.
Page 7
data set. Even though the amount of compositional
turnover along the axes was small (gradient lengths of
1.0 and 0.6 H.C. units were obtained for GNMDS axes 1
and 2, respectively), plots from ridge and snowbed
were fully separated along the first GNMDS axis
(Fig. 1a). Moreover, samples originating from the same
Table 4 The 15 most common OTUs found in the 50 root samples of Bistorta vivipara. Top hit in GenBank gives the best match of
the representative sequences to NCBI GenBank, with accession number in bracket. Cov (Query coverage) gives the percentage of
sequence match against the top hit in GenBank. Iden (Identity) gives the sequence similarity to the top hit. NA, NR and NS give the
number of samples in which the OTU was observed across all samples, ridge samples and snowbed samples, respectively. RA (%),
RR (%) and RS (%) give the percentage of reads that clustered as the OTU across all samples, ridge samples and snowbed samples,
respectively. Only one OTU was found in all 50 samples, with the best match to Articulospora. Russula sp. was the most abundant
OUT found, constituting 24.6% of all reads
OTU ID Top hit in GenBank (Accession nos) Cov Iden NA NR NS RA (%) RR (%) RS (%)
1089 Articulospora sp.(JN995644) 95 99 50 25 25 5.77 3.2 2.6
444 Helotiales sp. (AB598104)* 96 98 43 25 18 2.09 1.6 0.49
858 Meliniomyces sp. (HQ157926) 95 99 41 20 21 1.02 0.18 0.84
547 Articulospora sp. (EU998923) 95 99 38 15 23 1.16 0.38 0.78
383 Articulospora sp. (EU998928) 96 98 37 17 20 1.84 0.65 1.19
452 Articulospora tetracladia (EU998923) 95 93 37 16 21 0.21 0.1 0.11
918 Helotiales sp. (EU998923)† 95 96 37 19 18 0.98 0.5 0.48
1059 Gyoerffyella sp. (EU998923) 95 100 37 13 24 0.34 0.14 0.2
494 Phialocephala sp. (JQ272456) 96 92 36 18 18 0.18 0.09 0.09
75 Russula sp. (AY061696) 96 99 35 16 19 24.64 11.36 13.28
334 Cortin. diasemospermus (AY061696) 96 100 33 11 22 12.4 2.6 9.8
181 Phialocephala fortinii (EU882733) 96 99 32 14 18 0.12 0.05 0.07
376 Meliniomyces bicolor (HQ157926) 95 96 29 9 20 0.08 0.01 0.07
1057 Helotiales sp. (HQ157926)‡ 95 98 29 17 12 0.4 0.21 0.18
1062 Helotiales sp. (AB598104)§ 96 90 29 17 12 0.38 0.22 0.16
Best match at species level: *Leptodontium elatius (acc.no. JF340290, Cov = 95%, Iden = 96%), †Phialea strobilina (acc.no. EF596821,
Cov = 96%, Iden = 88%), ‡Leptodontium elatius (acc.no. JF340290, Cov = 95%, Iden = 96%), §Leptodontium elatius (acc.no. JF340290,
Cov = 95%, Iden = 90%.
Table 3 Summary of the distribution of OTUs and reads of fungal lineages found in the root systems of Bistorta vivipara. The first
two columns show the distribution (%) of OTUs and reads over all samples, while the last four show the distribution in the ridge
and snowbed plots, respectively
Taxonomic group
Total Snowbed Ridge
% OTUs % reads % OTUs % reads % OTUs % reads
Ascomycota 66.47 32.47 33.66 16.24 32.8 16.23
Leotiomycetes 54.54 27.75 26.93 12.82 27.61 14.94
Helotiales 52.75 26.63 26.18 12.46 26.57 14.17
Rhytismatales 1.02 0.97 0.52 0.33 0.5 0.64
Eurotiomycetes 1.27 0.13 0.61 0.05 0.66 0.08
Chaetothyriales 1.16 0.11 0.59 0.05 0.57 0.06
Dothideomycetes 1.18 1.97 0.79 1.68 0.39 0.29
Sordariomycetes 1.13 0.37 0.5 0.29 0.64 0.08
Basidiomycota 25.43 65.72 14.95 37.72 10.48 28
Agaricomycetes 23.21 64.67 13.61 36.74 9.6 27.93
Agaricales 9.46 19.61 5.94 12.99 3.52 6.62
Thelephorales 5.13 12.74 3.99 7.06 1.13 5.68
Sebacinales 2.99 3.76 0.79 1.2 2.2 2.56
Russulales 2.59 26.91 1.52 14.85 1.07 12.06
Tremellomycetes 1.13 0.77 0.64 0.71 0.5 0.05
Other fungal divisions 2.75 0.59 1.43 0.3 1.31 0.29
Glomeromycota 0.98 0.35 0.48 0.14 0.5 0.22
Fungi spp. 5.35 1.22 2.54 0.54 2.81 0.68
© 2013 John Wiley & Sons Ltd
ALPINE FUNGAL COMMUNITIES 7
Page 8
plot were to some extent clustered in the ordination
diagram. The ANOVA of spatial structure within the
ordination showed that snowbed plots were not spa-
tially structured along GNMDS axis 1, but were spa-
tially structured along axis 2. The ridge plots were
spatially structured along both GNMDS axes (P < 0.05).
Procrustes analyses showed high correspondence
between fungal OTU composition and vegetation in the
sampled plots (Fig. S5), r = 0.9125, P = 0.001. The
GNMDS axes 1 and 2 for the vegetation data were
highly correlated with the GNMDS axes 1 and 2 for the
fungal data (Kendall’s s = 0.78 and 0.65, respectively).
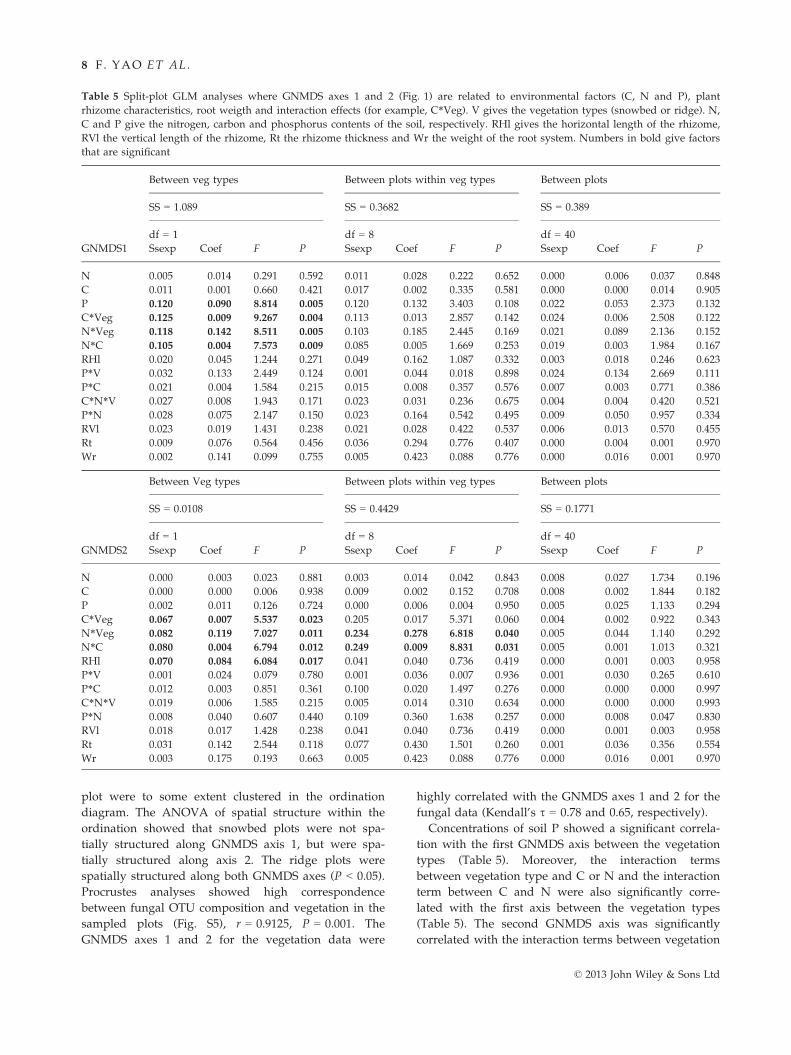
Concentrations of soil P showed a significant correla-
tion with the first GNMDS axis between the vegetation
types (Table 5). Moreover, the interaction terms
between vegetation type and C or N and the interaction
term between C and N were also significantly corre-
lated with the first axis between the vegetation types
(Table 5). The second GNMDS axis was significantly
correlated with the interaction terms between vegetation
Table 5 Split-plot GLM analyses where GNMDS axes 1 and 2 (Fig. 1) are related to environmental factors (C, N and P), plant
rhizome characteristics, root weigth and interaction effects (for example, C*Veg). V gives the vegetation types (snowbed or ridge). N,
C and P give the nitrogen, carbon and phosphorus contents of the soil, respectively. RHl gives the horizontal length of the rhizome,
RVl the vertical length of the rhizome, Rt the rhizome thickness and Wr the weight of the root system. Numbers in bold give factors
that are significant
GNMDS1
Between veg types Between plots within veg types Between plots
SS = 1.089 SS = 0.3682 SS = 0.389
df = 1
Coef F P
df = 8
Coef F P
df = 40
Coef F PSsexp Ssexp Ssexp
N 0.005 0.014 0.291 0.592 0.011 0.028 0.222 0.652 0.000 �0.006 0.037 0.848
C 0.011 0.001 0.660 0.421 0.017 0.002 0.335 0.581 0.000 0.000 0.014 0.905
P 0.120 0.090 8.814 0.005 0.120 0.132 3.403 0.108 0.022 0.053 2.373 0.132
C*Veg 0.125 0.009 9.267 0.004 0.113 0.013 2.857 0.142 0.024 0.006 2.508 0.122
N*Veg 0.118 0.142 8.511 0.005 0.103 0.185 2.445 0.169 0.021 0.089 2.136 0.152
N*C 0.105 0.004 7.573 0.009 0.085 0.005 1.669 0.253 0.019 0.003 1.984 0.167
RHl 0.020 �0.045 1.244 0.271 0.049 �0.162 1.087 0.332 0.003 �0.018 0.246 0.623
P*V 0.032 �0.133 2.449 0.124 0.001 �0.044 0.018 0.898 0.024 �0.134 2.669 0.111
P*C 0.021 �0.004 1.584 0.215 0.015 �0.008 0.357 0.576 0.007 �0.003 0.771 0.386
C*N*V 0.027 0.008 1.943 0.171 0.023 0.031 0.236 0.675 0.004 0.004 0.420 0.521
P*N 0.028 �0.075 2.147 0.150 0.023 �0.164 0.542 0.495 0.009 �0.050 0.957 0.334
RVl 0.023 0.019 1.431 0.238 0.021 0.028 0.422 0.537 0.006 0.013 0.570 0.455
Rt 0.009 �0.076 0.564 0.456 0.036 �0.294 0.776 0.407 0.000 0.004 0.001 0.970
Wr 0.002 �0.141 0.099 0.755 0.005 �0.423 0.088 0.776 0.000 �0.016 0.001 0.970
GNMDS2
Between Veg types Between plots within veg types Between plots
SS = 0.0108 SS = 0.4429 SS = 0.1771
df = 1
Coef F P
df = 8
Coef F P
df = 40
Coef F PSsexp Ssexp Ssexp
N 0.000 �0.003 0.023 0.881 0.003 0.014 0.042 0.843 0.008 �0.027 1.734 0.196
C 0.000 0.000 0.006 0.938 0.009 0.002 0.152 0.708 0.008 �0.002 1.844 0.182
P 0.002 0.011 0.126 0.724 0.000 �0.006 0.004 0.950 0.005 0.025 1.133 0.294
C*Veg 0.067 �0.007 5.537 0.023 0.205 �0.017 5.371 0.060 0.004 0.002 0.922 0.343
N*Veg 0.082 �0.119 7.027 0.011 0.234 �0.278 6.818 0.040 0.005 0.044 1.140 0.292
N*C 0.080 �0.004 6.794 0.012 0.249 �0.009 8.831 0.031 0.005 0.001 1.013 0.321
RHl 0.070 �0.084 6.084 0.017 0.041 0.040 0.736 0.419 0.000 0.001 0.003 0.958
P*V 0.001 0.024 0.079 0.780 0.001 �0.036 0.007 0.936 0.001 0.030 0.265 0.610
P*C 0.012 �0.003 0.851 0.361 0.100 �0.020 1.497 0.276 0.000 0.000 0.000 0.997
C*N*V 0.019 �0.006 1.585 0.215 0.005 �0.014 0.310 0.634 0.000 0.000 0.000 0.993
P*N 0.008 �0.040 0.607 0.440 0.109 �0.360 1.638 0.257 0.000 0.008 0.047 0.830
RVl 0.018 0.017 1.428 0.238 0.041 0.040 0.736 0.419 0.000 0.001 0.003 0.958
Rt 0.031 �0.142 2.544 0.118 0.077 �0.430 1.501 0.260 0.001 �0.036 0.356 0.554
Wr 0.003 0.175 0.193 0.663 0.005 �0.423 0.088 0.776 0.000 �0.016 0.001 0.970
© 2013 John Wiley & Sons Ltd
8 F . YAO ET AL.
Page 9
type and C or N, together with the interaction between C
and N between the two vegetation types. The horizontal
length of rhizome (RHl) was also significantly correlated
with the second axis between the two vegetation types
(Table 5). The interaction terms between N and vegetation
type and interaction between C and N were significant
correlated between plots within vegetation types along
GNMDS axis 2.
Discussion
Fungal community composition
We found substantial turnover in fungal communities
associated with the root system of Bistorta vivipara in the
ridge-to-snowbed gradient with a higher richness of
ECM OTUs in snowbeds. However, several intercorre-
lated environmental variables vary systematically along
the ridge-snowbed gradient, making it difficult to sepa-
rate their effects and infer causal relationships. These
include duration of snow cover, soil moisture, concen-
trations of C, N and P, and other soil chemical variables.
Existence of a gradient in ECM fungal community com-
position that mirrors variation in soil characteristics and
vegetation is reported in several studies. ECM fungal co-
enoclines gradients in species composition, (Whittaker
1967) have previously been found to relate to soil nutri-
ents in forest ecosystems (Toljander et al. 2006; Twieg
et al. 2009; Reverchon et al. 2012). Blaalid et al. (2012)
reported that the root-associated fungal communities of
B. vivipara changed along a primary successional gradi-
ent at Finse, Norway, and that compositional differences
were correlated with changes in pH of the soil.
Several ecto- and ericoid mycorrhizal plant species
were present in the ridge and snowbed plots. B. vivipara
was found in more or less equal amounts in both habi-
tat types. Salix herbacea and Vaccinium uliginosum were
predominantly found in snowbeds, whereas Empetrum
nigrum and Vaccinium vitis-idea were predominantly
found at ridges. The presence of ecto- and ericoid
mycorrhizal plant species might influence root-associated
fungal communities of other species through common
mycelial networks, CMNs. CMNs have been suggested
to play an important role in facilitating growth of seed-
lings, as the mycelium of fungi growing in symbiosis
with larger plants might serve as an inoculum for the
seedlings (Nara 2006). Nara (2006) also observed that
pioneering Salix plants provided adjacent late colonizers
with compatible ECM fungal symbionts during primary
succession in a volcanic desert landscape. Moreover, the
results indicate that ECM fungal community composition
is spatially structured at the fine scales: on average, root
systems from the same plot are more similar with respect
to community composition than root systems from differ-
ent plots. Fine-scale spatial structure may arise because
neighbouring plants share fungal partners due to below-
ground vegetative growth between adjacent root systems
producing CMNs (Selosse & Duplessis 2006; Bingham &
Simard 2012). Such networks can affect the physiology
and ecology of plants by facilitating interplant nutrient
exchange (Teste et al. 2009).
Several OTUs from taxonomically different groups
were significantly affiliated with either ridge or snowbed
plots. Adaptations to different environmental conditions
(Reverchon et al. 2012) as well as biotropic interactions
(Pickles et al. 2012) can influence distribution of species.
Several OTUs with affinity to Sebacinales were found to
be associated with ridges. This early diverging lineage
within Agaricomycotina has been shown to have benefi-
cial influence on plant growth of host plants, as it forms
diverse symbiotic associations by ecto-, ericoid- or orchid
mycorrhizae as well as endophytic associations (Weiss
et al. 2004, 2011; Selosse et al. 2009; Reverchon et al. 2012).
In contrast, numerous OTUs with taxonomic affinity to
the ECM-forming genera Tomentella and Cortinarius were
strongly associated with the snowbeds. Tomentella species
have earlier been found to be the dominant ECM partners
of alpine plants such as Kobresia myosuroides (M€uhlmann
& Peintner 2008b), Salix herbacea (M€uhlmann & Peintner
2008a) and B. vivipara (M€uhlmann et al. 2008). Cortinarius
species are typically associated with well-decomposed
organic matter and humus (Lindahl et al. 2007), and there-
fore may thrive better in the snowbeds where the
amounts of organic material is higher. Likewise, several
OTUs with taxonomic affinity to dark septate root endo-
phytes (DSE), like the Cadophora finlandica/Meliniomyces
spp. complex and the Phialocephala fortinii complex, show
distinct preferences for snowbeds. Summerbell (2005)
observed that the root endophyte Meliniomyces variabilis
prefers peat bog sites with more decomposed peat. Two
OTUs with taxonomic affinities to the Rhizoscyphus ericae
complex show contrasting preferences for ridge or snow-
bed. Further studies are needed to understand the associ-
ation of fungal OTUs with ridges and snowbeds.
The ordination analyses indicate that not only chemi-
cal soil properties of the ridge-to snowbed gradient play
important roles in the structuring of the root-associated
fungal communities. The significant relationship
between the horizontal length of B. vivipara rhizomes
and the second GNMDS axis indicates that age of the
host plant is important for ECM community composi-
tion. The size of the rhizome of B. vivipara is likely posi-
tively correlated with the age of the plant (Diggle 1997).
We may speculate that the perennial life history of
B. vivipara, which allows continuous accumulation of
fungal species over several years, is an important
reason for the high taxon richness observed. However,
the negative correlation between number of OTUs and
© 2013 John Wiley & Sons Ltd
ALPINE FUNGAL COMMUNITIES 9
Page 10
rhizome size in snowbeds could be an indication of
competition among fungal species within the root sys-
tems of larger plants at relatively stable environmental
conditions. Perhaps somewhat surprisingly, we do not
observe significant differences in fungal species richness
between the ridge and snowbed plots, while the species
composition changes along the gradient, species rich-
ness does not. A similar pattern with no change in spe-
cies richness but change in community composition
was observed in fungal communities in alpine open
meadows and willow understory habitat (Becklin et al.
2012). It has also been reported for fungal communities
along a salinity gradient from fresh- to saltwater
marshes (Mohamed & Martiny 2011).
Most of the OTUs observed in our study belong to
Dikarya. Ascomycota is most diverse when it comes to
OTU richness while basidiomycetes dominate when it
comes to proportion of reads. These contrasting patterns
probably reflect the different life strategies of the two
groups. Many of the observed basidiomycetes are high-
biomass ECM fungi that are expected to yield many
reads in high-throughput sequencing analyses of bulk
samples. Notably, the ECM-forming Russulales have a
high proportion of reads (26.9%) but relatively few OTUs
(2.6%), which indicates high biomass. In contrast, a
higher proportion of the ascomycetes probably represent
root endophytes or pathogens of lower biomass. Several
OTUs with high sequence similarity to Articulospora spp.
were among the most common OTUs in our sample.
Articulospora is mainly known as aquatic hyphomycetes
forming characteristic spores that spread through water
(Quilliam & Jones 2010; Seena et al. 2012). Recent studies
indicate that many such ‘Ingoldian fungi’ (Ingold 1942),
including Articulospora, spend parts of their life cycle as
plant root associates (Carlsen 2002; Selosse et al. 2008;
Bjorbækmo et al. 2010; Blaalid et al. 2012).
Although a systematic shift in fungal community com-
position is observed from ridge to snowbed, we found
high heterogeneity and low overlap in the number of
shared OTUs across the 50 root systems. This accords
with results of several other studies (Izzo et al. 2005;
Lekberg et al. 2011; Blaalid et al. 2012; Pickles et al. 2012),
which report a high degree of stochasticity in the assem-
bly of fungal communities. Stochastic spore dispersal
processes may be partly responsible for this pattern.
Other explanations for high heterogeneity may be niche
partitioning in response to fine-scale environmental gra-
dients (Tedersoo et al. 2003), for example, brought about
by different enzymatic capabilities (Abuzinadah & Read
1986; Bruns 1995), as well as competitive interactions
between different fungal species. Even though the
species accumulation curve for the ridge and snowbed
plots do level off, the accumulation curves are still not
saturated. This indicates that a part of the heterogeneity
in the detected fungal communities might be due to the
sampling intensity of this study.
Conclusion
This study demonstrates that the fungal communities
associated with roots of the ECM-forming plant B. vivi-
para change systematically along the ridge-to-snowbed
gradient. Different fungal groups are associated with
different environmental conditions. OTUs with taxo-
nomic affinity to Sebacinales are significantly affiliated
with the exposed ridges, where the vegetation is domi-
nated by lichens, and the amount of phosphorus is
higher than in the snowbeds. In the snowbeds, numer-
ous OTUs with taxonomic affinity to Tomentella and
Cortinarius are over-represented.
Acknowledgements
We acknowledge Anders Bjørnsgaard Aas for assistance during
the DNA laboratory work, Berit Kaasa for chemical analyses,
Rakel Blaalid for advices and discussions, and Marie Davey for
providing expertise on bioinformatics analyses. The Norwegian
Sequencing Centre conducted the 454-pyrosequencing. The bio-
informatics work was performed on the Titan Cluster, owned
by the University of Oslo and the Norwegian metacenter for
High Performance Computing (NOTUR), and operated by the
Research Computing Services group at USIT, the University of
Oslo IT-department. http://www.hoc.uio.no/. The University
of Oslo is acknowledged for financial support.
References
Abuzinadah RA, Read DJ (1986) The role of proteins in the
nitrogen nutrition of ectomycorrhizal plants. I. Utilization of
peptides and proteins by ectomycorrhizal fungi. New Phytolo-
gist, 103, 481–493.Altschul SF, Madden TL, Sch€affer AA et al. (1997) Gapped
BLAST and PSI-BLAST: a new generation of protein data-
base search programs. Nucleic Acids Research, 25, 3389–3402.
Baadsvik K (1974) Phytosociological and ecological investigations
in an alpine area at Lake Kamtjern, Trollheimen Mts, Central
Norway. Kongelige norske Videnskabers Selskab Skrifter, 5, 1–61.Becklin KM, Hertweck KL, Jumpponen A (2012) Host identity
impacts rhizosphere fungal communities associated with
three alpine plant species. Microbial Ecology, 63, 682–693.
Bellemain E, Carlsen T, Brochmann C et al. (2010) ITS as an
environmental DNA barcode for fungi: an in silico approach
reveals potential PCR biases. BMC Microbiology, 10, 189.
Bingham MA, Simard SW (2012) Mycorrhizal networks affect
ectomycorrhizal fungal community similarity between con-
specific trees and seedlings. Mycorrhiza, 22, 317–326.
Birkeland S (2012) Rare to be warm in Svalbard: an ecological and
genetic snapshot of four red listed plant species, M.Sc Thesis,
University of Oslo, Oslo.
Bjorbækmo M, Carlsen T, Brysting A et al. (2010) High diver-
sity of root associated fungi in both alpine and arctic Dryas
octopetala. BMC Plant Biology, 10, 244.
© 2013 John Wiley & Sons Ltd
10 F . YAO ET AL.
Page 11
Blaalid R, Carlsen T, Kumar S et al. (2012) Changes in the root-
associated fungal communities along a primary succession
gradient analysed by 454 pyrosequencing. Molecular Ecology,
21, 1897–1908.Br�athen KA, Hagberg O (2009) More efficient estimation of
plant biomass. Journal of Vegetation Science, 15, 653–660.Bray JR, Curtis JT (1957) An ordination of the upland forest
communities of southern Wisconsin. Ecological Monographs,
27, 325–349.
Bruns TD (1995) Thoughts on the processes that maintain local
species diversity of ectomycorrhizal fungi. In: The Significance
and Regulation of Soil Biodiversity, pp. 63–73. Springer Nether-
lands, Dordrecht.
Caporaso JG, Kuczynski J, Stombaugh J et al. (2010) QIIME
allows analysis of high-throughput community sequencing
data. Nature Publishing Group, 7, 335–336.Carlsen TA (2002) Molecular diversity of root endophytes in an
alpine Bistorta vivipara-Kobresia myosuroides plant community
Cand Scient Thesis. University of Oslo, Oslo.
Clemmensen KE, Bahr A, Ovaskainen O et al. (2013) Roots and
associated fungi drive long-term carbon sequestration in
boreal forest. Science (New York, NY), 339, 1615–1618.Colwell RK (2009) EstimateS, statistical estimation of species rich-
ness and shared species from samples. (Version 8.2). User’s
Guide and Application Published. Available from http://
purl.oclc.org/estimates.
Crawley MJ (2007) The R Book. Wiley, West Sussex.
Dahl E (1957) Rondane: mountain vegetation in South Norway
and its relation to the environment. Skrifter norske Videnskaps-
Akademi Oslo matematisk-naturvidenskaplig Klasse, 1956, 1–374.
Diggle P (1997) Extreme preformation in alpine Polygonum
viviparum: an architectural and developmental analysis.
American Journal of Botany, 84, 154–169.Dormann CF, Albon SD, Woodin SJ (2002) No evidence for adap-
tation of two Polygonum viviparum morphotypes of different
bulbil characteristics to length of growing season: abundance,
biomass and germination. Polar Biology, 25, 884–890.Eilertsen O, Økland RH, Økland T, Pedersen O (1990) Data
manipulation and gradient length estimation in DCA ordina-
tion. Journal of Vegetation Science, 1, 261–270.
Gardes M, Bruns TD (1993) ITS primers with enhanced speci-
ficity for basidiomycetes–application to the identification of
mycorrhizae and rusts. Molecular Ecology, 2, 113–118.Geml J, Timling I, Robinson CH et al. (2011) An arctic commu-
nity of symbiotic fungi assembled by long-distance dispersers:
phylogenetic diversity of ectomycorrhizal basidiomycetes in
Svalbard based on soil and sporocarp DNA. Journal of Biogeog-
raphy, 39, 74–88.
Gillevet P, Sikaroodi M, Keshavarzian A, Mutlu EA (2010)
Quantitative assessment of the human gut microbiome
using multitag pyrosequencing. Chemistry & Biodiversity, 7,
1065–1075.
Gjærevoll O (1956) The plant communities of the Scandinavian
alpine snow-beds. Kongelig norske Videnskap Selskap Skrifter,
1, 405.
Hawksworth D (2001) The magnitude of fungal diversity: the
1.5 million species estimate revisited. Mycological Research,
105, 1422–1432.
Hill MO (1979) Decorana - A Fortran Program For Detrended
Correspondence Analysis and Reciprocal Averaging. Cornell
University, Ithaca, New York.
Hill MO, Gauch HG Jr (1980) Detrended correspondence analy-
sis: an improved ordination technique. Vegetatio, 42, 47–58.Ingold CT (1942) Aquatic hyphomycetes of decaying alder
leaves. Transactions of the British Mycological Society, 25,
339–417.
Izzo A, Agbowo J, Bruns TD (2005) Detection of plot-level
changes in ectomycorrhizal communities across years in an
old-growth mixed-conifer forest. New Phytologist, 166, 619–630.Kauserud H, Kumar S, Brysting AK, Nord�en J, Carlsen T
(2012) High consistency between replicate 454 pyrosequenc-
ing analyses of ectomycorrhizal plant root samples. Mycor-
rhiza, 22, 309–315.Kruskal JB (1964) Nonmetric multidimensional scaling: a
numerical method. Psychometrika, 29, 115–129.Kuhnert R, Oberkofler I, Peintner U (2012) Fungal growth and
biomass development is boosted by plants in snow-covered
soil. Microbial Ecology, 64, 79–90.
Lekberg Y, Schnoor T, Kjøller R et al. (2011) 454-sequencing
reveals stochastic local reassembly and high disturbance tol-
erance within arbuscular mycorrhizal fungal communities.
Journal of Ecology, 100, 151–160.
Lindahl BD, Ihrmark K, Boberg J et al. (2007) Spatial separation
of litter decomposition and mycorrhizal nitrogen uptake in a
boreal forest. New Phytologist, 173, 611–620.Minchin PR (1987) An evaluation of the relative robustness of
techniques for ecological ordination. Vegetatio, 69, 89–107.Mohamed DJ, Martiny JBH (2011) Patterns of fungal diversity
and composition along a salinity gradient. ISME Journal, 5,
379–388.M€uhlmann O, Peintner U (2008a) Mycobionts of Salix herbacea
on a glacier forefront in the Austrian Alps. Mycorrhiza, 18,
171–180.
M€uhlmann O, Peintner U (2008b) Ectomycorrhiza of Kobresia
myosuroides at a primary successional glacier forefront.
Mycorrhiza, 18, 355–362.M€uhlmann O, Bacher M, Peintner U (2008) Polygonum vivipa-
rum mycobionts on an alpine primary successional glacier
forefront. Mycorrhiza, 18, 87–95.
Nara K (2006) Ectomycorrhizal networks and seedling estab-
lishment during early primary succession. New Phytologist,
169, 169–178.Newbound M, Bennett LT, Tibbits J (2012) Soil chemical prop-
erties, rather than landscape context, influence woodland
fungal communities along an urban-rural gradient. Austral
Ecology, 37, 236–247.Nordhagen R (1943) Sikilsdalen og Norges fjellbeiter. Bergens
Museums Skrifter, 22, 1–224.Odland A, Munkejord HK (2008) The importance of date of
snowmelt for the separation of different oligotrophic and
mesotrophic mountain vegetation types in Southern Norway.
Phytocoenologia, 38, 3–21.Økland RH, Bendiksen E (1985) The vegetation of the forest-
alpine transition in the Grunningsdalen area, Telemark, SE
Norway. Sommerfeltia, 2, 1–224.
Oksanen J, Blanchet FG, Kindt R et al. (2012). vegan: community
ecology package. R package version 2.0-5. http://CRAN.R-
project.org/package=vegan.
Pickles BJ, Genney DR, Anderson IC, Alexander IJ (2012) Spa-
tial analysis of ectomycorrhizal fungi reveals that root tip
communities are structured by competitive interactions.
Molecular Ecology, 21, 5110–5123.
© 2013 John Wiley & Sons Ltd
ALPINE FUNGAL COMMUNITIES 11
Page 12
Quilliam RS, Jones DL (2010) Fungal root endophytes of the
carnivorous plant Drosera rotundifolia. Mycorrhiza, 20,
341–348.
R Core Team (2012). R: A Language and Environment for Statisti-
cal Computing. R Foundation for Statistical Computing,
Vienna, Austria. ISBN 3-900051-07-0, Available from http://
www.R-project.org/.
Read DJ, Haselwandter K (1981) Observations on the mycorrhi-
zal status of some alpine plant communities. New Phytologist,
88, 341–352.Reeder J, Knight R (2010) Rapidly denoising pyrosequencing
amplicon reads by exploiting rank-abundance distributions.
Nature methods, 7, 668–669.
Resvoll TR (1917) Om planter som passer til kort og kold som-
mer. Archiv for mathematik og naturvidenskab, 35(6), 1–224.
Reverchon F, Ortega-Larrocea MDP, P�erez-Moreno J (2012) Soil
factors influencing ectomycorrhizal sporome distribution in
neotropical forests dominated by Pinus montezumae, Mexico.
Mycoscience, 53, 203–210.
Schloss PD, Westcott SL, Ryabin T et al. (2009) Introducing
mothur: open-source, platform-independent, community-
supported software for describing and comparing microbial
communities. Applied and Environmental Microbiology, 75,
7537–7541.Schoch CL, Seifert KA, Huhndorf S et al. (2012) Nuclear ribo-
somal internal transcribed spacer (ITS) region as a universal
DNA barcode marker for Fungi. Proceedings of the National
Academy of Sciences of the United States of America, 109,
6241–6246.Seena S, Duarte S, Pascoal C, C�assio F (2012) Intraspecific vari-
ation of the aquatic fungus Articulospora tetracladia: an ubiq-
uitous perspective. PLoS One, 7, e35884.
Seifert KA (2009) Progress towards DNA barcoding of fungi.
Molecular Ecology Resources, 9(Suppl s1), 83–89.
Selosse MA, Duplessis S (2006) More Complexity in the Mycor-
rhizal World. New Phytologist, 172, 600–604.
Selosse M-A, Vohn�ık M, Chauvet E (2008) Out of the rivers:
are some aquatic hyphomycetes plant endophytes? New
Phytologist, 178, 3–7.Selosse M-A, Dubois M-P, Alvarez N (2009) Do Sebacinales
commonly associate with plant roots as endophytes? Myco-
logical Research, 113, 1062–1069.
Smith SE, Read D (2008) Mycorrhizal Symbiosis. Elsevier,
London.
Sørensen TJ (1948) A method of establishing groups of equal
amplitude in plant sociology based on similarity of species
content and its application to analyses of the vegetation
on Danish commons. Biologiske Skrifter Kongelig Danske
Videnskabers Selskab, 5, 1–34.Summerbell RC (2005) Root endophyte and mycorrhizosphere
fungi of black spruce, Picea mariana, in a boreal forest habi-
tat: influence of site factors on fungal distributions. Studies in
Mycology, 53, 121–145.Taylor DL, McCormick MK (2008) Internal transcribed spacer
primers and sequences for improved characterization of
basidiomycetous orchid mycorrhizas. New Phytologist, 177,
1020–1033.Tedersoo L, K~oljalg U, Hallenberg N, Larsson K-H (2003) Fine
scale distribution of ectomycorrhizal fungi and roots across
substrate layers including coarse woody debris in a mixed
forest. New Phytologist, 159, 153–165.
Tedersoo L, May TW, Smith ME (2010) Ectomycorrhizal life-
style in fungi: global diversity, distribution, and evolution of
phylogenetic lineages. Mycorrhiza, 20, 217–263.
Teste FP, Simard SW, Durall DM et al. (2009) Access to
mycorrhizal networks and roots of trees: importance for
seedling survival and resource transfer. Ecology, 90, 2808–2822.
Toljander YKY, Lindahl BDB, Holmer LL, H€ogberg NOSN
(2006) Environmental fluctuations facilitate species co-exis-
tence and increase decomposition in communities of wood
decay fungi. Oecologia, 148, 625–631.
Twieg BD, Durall DM, Simard SW, Jones MD (2009) Influence
of soil nutrients on ectomycorrhizal communities in a chro-
nosequence of mixed temperate forests. Mycorrhiza, 19, 305–316.
Ugland KI, Gray JS, Ellingsen KE (2003) The species-accumula-
tion curve and estimation of species richness. Journal of
Animal Ecology, 72, 888–897.Venables WN, Ripley BD (2002) Modern Applied Statistics with
S. Springer, New York.
Vestergren T (1902) Om den olikformiga sn€obet€ackningens inf-
lytande p�a vegetationen i Sarekfj€allen. Botaniske Notiser, 55,
241–268.
Wallander H, Johansson U, Sterkenburg E, Brandstrom Durling
M, Lindahl BD (2010) Production of ectomycorrhizal myce-
lium peaks during canopy closure in Norway spruce forests.
New Phytologist, 187, 1124–1134.
Weiss M, Selosse M-A, Rexer K-H, Urban A, Oberwinkler F
(2004) Sebacinales: a hitherto overlooked cosm of heterobas-
idiomycetes with a broad mycorrhizal potential. Mycological
Research, 108, 1003–1010.Weiss M, S�ykorov�a Z, Garnica S et al. (2011) Sebacinales every-
where: previously overlooked ubiquitous fungal endophytes.
PLoS One, 6, e16793.
White TJ, Bruns T, Lee S, Taylor J (1990) Amplification and
direct sequencing of fungal ribosomal RNA genes for
phylogenetics. In: PCR Protocols: A Guide to Methods and
Applications(eds Innis MA, Gelfand DH, Sninsky JJ & White
TJ), pp. 315–322. Academic Press Inc., New York.
Whittaker RH (1967) Gradient analysis of vegetation. Biological
reviews of the Cambridge Philosophical Society, 42, 207–264.Wijk S (1986) Performance of Salix herbacea in an alpine snow-
bed gradient. The Journal of Ecology, 74, 675–684.Zinger LL, Shahnavaz BB, Baptist FF, Geremia RAR, Choler PP
(2009) Microbial diversity in alpine tundra soils correlates
with snow cover dynamics. ISME Journal, 3, 850–859.
Zinger LL, Lejon DPHD, Baptist FF et al. (2010) Contrasting
diversity patterns of crenarchaeal, bacterial and fungal soil
communities in an alpine landscape. PLoS One, 6, e19950.
F.Y., U.V., A.K.B., T.C. and H.K. contributed in plan-
ning the project. F.Y., U.V., A.K.B. and H.K. conducted
the field work. F.Y. and T.C. conducted the lab work.
F.Y. and U.V. participated in the bioinformatic analyses.
F.Y., U.V. and R.H. participated in the statistical ana-
lyses. F.Y. and U.V. drafted the manuscript.
© 2013 John Wiley & Sons Ltd
12 F . YAO ET AL.
Page 13
Data accessibility
Raw .sff files from 454 sequencing with corresponding
mapping files have been uploaded to Dryad (doi:10.
5061/dryad.216tp) along with OTU tables, vegetation
cover estimates, environmental factors measured and
R-scripts used in this study.
Supporting information
Additional supporting information may be found in the online
version of this article.
Table S1 GLM analyses of environmental variables (C, N and
P) and plant root characteristics against number of fungal
OTUs in each Bistorta vivipara root sample.
Table S2 OTUs that were significantly over- or underrepre-
sented in either ridge or snowbed, according to the G-test.
Fig. S1 The weighted distribution (in percentage) of bryophyte,
vascular plant and lichen species found within the five sam-
pled 1.5 m 9 1.5 m plots of snowbed (dark green bars) and
ridge (light green bars).
Fig. S2 GNMDS ordination of the fungal communities associ-
ated with Bistorta vivipara root systems based on the replicated
samples.
Fig. S3 Histograms showing the distribution of a) number of
fungal OTUs and b) number of fungal reads found per Bistorta
vivipara root sample, as well as c) the number of root samples
in which an OTU occurred.
Fig. S4 Boxplot showing the difference in number of ectomy-
corrhizal fungal OTUs in the ridge and snowbed plots.
Fig. S5 Plot showing Procrustes errors between the two
GNMDS ordinations of fungal communities associated with
Bistorta vivipara root samples (light gray squares) and vegeta-
tion data (black squares) in ten sampled plots.
© 2013 John Wiley & Sons Ltd
ALPINE FUNGAL COMMUNITIES 13