31
Mike Bowman University of Manchester Deepwater Developments: Subsurface & Development Challenges Finding Petroleum Forum London, September 2013

Mike BowmanUniversity of Manchester
Deepwater Developments:Subsurface & Development Challenges
Finding Petroleum Forum London, September 2013

●Deepwater Developments since 1999 – an overview:
● track record, ●characteristics ●challenges
●Subsurface Context & Characteristics●Success Factors●Examples
●Summary & Conclusions
*

Deepwater Developments Track Record An astonishing track record of achievements that merit enormous respect
& celebrationMainly driven by Tertiary passive margins delta fed – deepwater systems but now stepping into tectonically influenced systems – Brazil, Angola …
●Western Margins (N Atlantic)●Palaeocene Plays (N Sea learnings)●Deepwater GoM & Subsalt●Middle Miocene Plays●Palaeogene●West Africa (Angola driven)●FPSO the next steps - standardisation●supra – salt controlled –> sub-salt●Step out to Ghana and others●Brazil Deepwater Basins●Early post rift carbonate plays●Sub Salt & Syn Rift
Trac
k R
ecor
d of
Lea
rnin
g &
Del
iver
y

Deepwater Developments ContextBut deep-water is littered with development wrecks
Industry track record of over promising & under deliveringInherently more complex technologically and often geologically
Why?●Challenges of stepping out – increasing uncertainty & risk●Implications of subsea – Recovery Factors, Costs, Flexibility●Technology Challenges – Imaging, Complex Geology, D&C, Engineering & Infrastructure●Strategic Imperatives of companies and industry – market driven and leadership inexperience●Drive for Pace vs. Costs, Profile and ?Safety●Poorly understood & communicated uncertainty and risks●Poor Integration & full Value Chain Awareness●Over optimism – faster, cheaper, better (despite the challenges)●If we can find it they will develop it!!

*
Development Wrecks
-15
15
30
45
60
-15
15
30
45
60
Cost Performance (% increase vs. FM)
Unrealistic Targets
Insufficient FEL
Technology Stretch
Within 15% Cost and Schedule
Sche
dule
Per
form
ance
(%
ext
ensi
on v
s. F
M)
Deepwater:●Strategic Projects●Under Delivery ●Over Promise●Destroy Value

Root Causes of Wrecks 2005 data
High
Degree of impact on wrecks
Low
People & leadership
Risk management
Quality(Operability &
Profile)
Costs & Econo
mics
Pace(Sche
dule)
Performance
Technical capabilty & competency
External relationships
Internal culture &
relationships
Technical definition
Contractor management
Targetsetting
Gov’t,Partner,
Commercial,geography

New Field Developments Portfolio 2000 - Present
Established Know How
Beyond Current
Capability
Recovery challenged(pilot / field trial options)
Do-
abili
ty: E
ngin
eerin
g G
aps
High recoveryconfidence
Productivity / Recovery Challenge
3Unconventional
Reservoirs(Heavy Oil, CBM, Tight, Gas, Shale
Gas)
1New fields in
established trends and basins
4Engineering, and reservoir
deliverability are both challenged and strongly linked
( GoM)
2Conventional reservoirs in an environment beyond current
engineering capability (Deepwater)
Deepwater - Working at the Boundary

*Sanction
INFL
UE
NC
E
EX
PE
ND
ITUR
ES
OPERATEDSP
Gate
DSP
EXECUTE Gate
High Influence
Rapidly Decreasing Influence
Low Influence
Front End Loading
DSP
SELECT GateAPPRAISEDSP
*DSP
DEFINE Gate
OptionsRisk (+/-)Uncertainty
GateACCESSDSP
Gate
World Class Execution
Creating a Distinctive Project
Wrecks - Poor Appraisal & Inadequate FEL

Deepwater Developments Track Record ●The average time from first oil to discovery is 7 years●Time to first oil from discovery has systematically decreased over
time from 12 to less than 7 years●The number of penetrations before sanction has also decreased
over time from an average of 10 in the late 80's to 3.75 in the late 90's●The uncertainty associated with ‘mid’-sized field (150-300 mmboe)
warrants additional Time (8.3 years avge) & Appraisal (6.2 penetrations) as compared with small and large-sized fields
●No systematic trend, on the number of penetrations and estimate of sanction volumes as compared with discovered volumes.
●Subsalt & Complex Geology Development significantly over/under estimate (by >40%) discovered volumes compared with sanction volumes. Extra-salt & Less Complex Developments discovered volumes are within +- 25% of sanction volumes

MP economics are sanction forward
Appraisal economics are 2004 forward
All data at $20/$3.500%
10%
20%
30%
40%
50%
0 100 200 300 400 500 600NPV $m
IRR
AngolaAngola
GoMGoM Tie-Backs
IRR Comparison
0%
5%
15%
20%
25%
30%
35%
40%
45%
Atla
ntis
Nor
thK
izom
ba A
- P
hase
2O
rqui
dea
& V
iole
taTu
lipa
Trin
i Life
of C
ompl
ex S
eism
icA
LNG
Deb
ottle
neck
ing
Bav
uca
Trin
idad
Tra
in 5
Kiz
omba
D
Mio
cene
Pol
eIn
Am
enas
4th
Tra
in
AC
G3
Lirio
Cra
voK
izom
ba C
- S
axi B
atuq
ue
Trin
idad
Gas
Ref
iner
yB
lock
18
Wes
tern
Are
aTu
bula
r Bel
lsS
hah
Den
iz S
tage
2S
henz
i
Tera
ng S
irasu
nA
ustra
lia T
rain
5 /
Ang
elB
lock
31
Nor
thV
ietn
am IG
B 2
Pum
aA
ngol
a LN
GM
ad D
og S
W R
idge
Gre
at W
hite
Sha
h D
eniz
Sta
ge 3
(GTL
)
Blin
d Fa
ithC
asca
de
Reserves Plot for All Discoveries
0
●Higher IRR driven by known geology & tie-back●Complex & Sub Salt - Higher Uncertainty & Lower
value
Deepwater Development Comparisons

Challenges of Deepwater
Fundamental Business Drivers
● Safety● Managing Risk● Value● Costs● Schedule - Pace
Enabled by Consistent and Standardised
● People (Capability & Capacity)● Process & Compliance●Technology (leadership in key areas & capability in fundamental areas)
Deliver Safe,Reliable & High Quality
Performancebalance: long term & short term
Risk ManagementSafety & IntegrityCompliance
Strategic FitMateriality
Understand & Embrace the Intent

Deepwater Development Examples
*

Deepwater Development SuccessUnderstand Key Levers
Safety
Profile (value)
Costs
Schedule – Pacea consistent key
pressure in deepwater
Effectively Managing Risk

*
Natural Pace – a pervasive challenge
Natural Pace is determined by a combination of both internal and external factors● Internal factors include the amount of work needed to inform investment decisions based on:
●reducing uncertainty and risk to an acceptable level●selecting a course of action from a suite of options that enables the
management of residual threats and capture of opportunities (value)● External factors include:
●Resource issues / availability (e.g. rig access). ●Partner and regulatory issues●Banks & Govt. loan pressures
Natural pace describes the optimum speed for a project to progress to create value and manage risk
appropriately.

*
IPA Mega-Project Study (Deepwater Dominated) Aggressive Schedules & Pace = Poor Performance
●Over half of the mega-projects were
wrecks.●100% of the fast-
tracked mega projects were
wrecks.
●Critical role of realistic execution planning.
●Aggressive projects, on average, tend to actually take longer, with more issues, than other projects.

Natural Pace – influences & controls
Natural Pace
Decisions
Standardization
Business Frame
Risk & Uncertainty
Relationships
Organization● Complexity● Value of Information● Technology Needs● Risk Tolerance
● Commercial / Partner● Market● Environmental /
Regulatory● PSCM
● Capability● Experience● Structure
● Timing● Sequence
● Concept● Component
● Greenfield / Brownfield● Resource Constraints
(e.g. capital and rig availability)
EfficiencyRigor

*
● “Fast Track Development” with inadequate time in Appraise and Select - concept was not fully selected and costs underestimated when entering Define.● Original planned 6 months Define duration totally unrealistic;
ultimately took 21 months, but the time was not effectively utilised to ready the project for sanction.● Contractor selected for fabrication withdrew shortly after sanction,
resulting in execution with different contractors from the sanction case.● The result was a forecast $1 billion (ca 30%) growth in the
sanction costs, although project schedule was held.● The sales and purchase agreement was concluded with X
before Select was completed when the project costs and schedule were poorly understood.
Pace Challenge Deepwater Example

Deepwater Success Factors

Deepwater Subsurface Success Factors ISD – recurring themes:●No silver bullet/corner cutting●Permeability Architecture Focus●Compartmentalisation
Understand, Characterise & Manage sources of Subsurface Uncertainty & Risk
Depletion Plan – LoF vs. investment decision
Benchmarking RF wet vs dry trees
Technology Challenges:●Surveillance●Imaging●HPHT●Front Load EOR●Automation●Working at the Boundary

Characterising Subsurface Uncertainty & Managing Risk
Sources of uncertainty
Impact & Risk to delivery
Integration
Resource
Rate
Profile
Subsurface Operations
Depletion Plan
Value Chain Decision Points
Access & Exploration to Development & Production

Example 1: Sanction assumptions
● Geology and performance similar to nearby producing fields
● Excellent connectivity, based on successful Extended Well Test
Total well count
12p/10i
Base Case
STOIIP (mmstb) 935Recovery Factor (%) 36
Reserves/well (mmstb) 28

Example 1: Reality
● EWT cited in atypical (sweet-spot) location – not representative – best in field well
● Subsequent wells accessed less oil than expected; additional wells required
● Reserves, reserves/well all down compared to expectations
● Higher STOOIP● Remaining downside related to adverse
water movement (poor sweep)
Expected Actual
STOIIP (mmstb) 935 1363Recovery Factor (%) 36 22Reserves/well (mmstb) 28 22
Total well count
12p/10i 14p/13i
At Sanction
Actual Performance

Example 1: Root Causes
● Pressures of Fast Track Development - Strategic● Downside interpretation of EWT ignored in
context of push for production● Geology assumed to be similar to nearby fields
but subtle differences meant greater compartmentalization
● Project leadership had little background in reservoir management; the reservoir management team had difficulty communicating the uncertainty and its possible impact

* discovery well first appraisal well
Example 2 –Seismic Silver Bullet
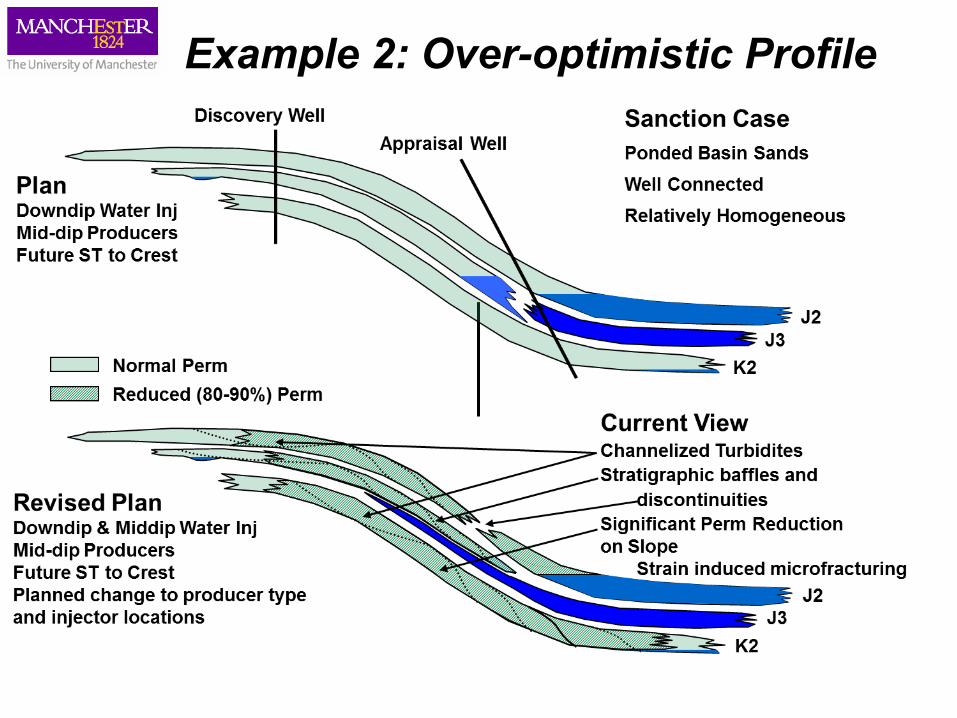
Example 2: Over-optimistic Profile

Example 2: Root Causes
● Pressures of Fast Track Development – Strategic● Competition to be first in the Area/Company● Underestimate of subsurface complexity –
seismic image seen as silver bullet cf. nearby fields in production
● Pace and inexperience of small subsurface team missed key indicators of complexity – structural & stratigraphic – impacts rate and profile

*
Acquiring Data - Characterising the Uncertainty – Managing RisksFocus: Select the Development – Life of Field Optimisation
Integration:
●Seismic●Wells●Analogs
●Stratigraphy●Sedimentolog
y●Fluids●Pressures
Discovery Post First Appraisal Pre Start Up
2 wells 5 wells 17 wells
Increasing well penetrations, seismic data coverage and quality
Increasing complexity
Example 3: Increasing Appraisal Complexity – impacts performance
Assumed no further compartmentalisation on production
Rates were signficantly lower per well – profile not delivered

Example 3: Root Causes
● Pressures of Fast Track Development – Strategic● Competition to be first in the Area/Company● Underestimate of subsurface complexity – great
appraisal not translated into rate post start up – sanctioned ie promised profile not delivered

Deepwater Subsurface Keys to Success
*
■Ruthlessly drive integrated solutions for continuous learning and improvement
■Continued static and dynamic data collection, integration and optimisation
■Subsea Reservoirs have reduced Recovery Factors vs dry trees
■Key focus areas:■Uncertainty and risk■Data ■Regional framework■Imaging■Integration
■Resource■Rate■Profile■Development scheme
Selection
Key Components:●Uncertainty & Risk Management Process●Integrated Subsurface Description●Depletion Plan●Proactively ensure Subsurface Knowledge Informs & Impacts Decisions

The Future: Keys to Success and Delivering our Promises – creating real value
● Clarity on Drivers & Priorities – business
(safety, costs, schedule, profile)● Integration● Learning and
Benchmarking● Value of Information● Risk and Uncertainty ● Technology● Organizational capability
Informed Decision MakingNatural PaceTransparencyNo Surprises
Wise InvestmentQuality thru Choice

Future Deepwater Vision● Enhanced Subsea Reliability - technology
● ‘Dry Tree’ Subsea Development - technology
● Low Cost, High Resolution well and reservoir surveillance
● Natural Pace is the norm – technology enabled
● No easy fix or silver bullet – integration, capability,
competency - behaviour
● An industry that delivers what it promises and promises
what it can deliver framed by a deeper understanding of
subsurface uncertainty and risks to delivery - leadership


