Achievement Gap Analysis Report 6 Success in Developmental English by Enrollment Status (Fall 2011 through Fall 2014 Cohorts) Research Report No. 13-16 Office of Institutional Effectiveness and Student Success Initiatives MARCH 2016
Transcript
Achievement Gap Analysis Report 6
Success in Developmental English by Enrollment Status
(Fall 2011 through Fall 2014 Cohorts)
Research Report No. 13-16
Office of Institutional Effectiveness and Student Success InitiativesMARCH 2016
NORTHERN VIRGINIA COMMUNITY COLLEGE
OFFICE OF INSTITUTIONAL EFFECTIVENESS AND STUDENT SUCCESS INITIATIVES The purpose of the Office of Institutional Effectiveness and Student Success Initiatives is to conduct analytical studies and provide information in support of institutional planning, policy formulation, and decision making. In addition, the office provides leadership and support in research related activities to members of the NOVA community engaged in planning and evaluating the institution’s success in accomplishing its mission.
4001 Wakefield Chapel Road Annandale, VA 22003-3796
(703) 323-3129 www.nvcc.edu/oir
When citing data from this report, the Northern Virginia Community College (NOVA) Office of Institutional Effectiveness
and Student Success Initiatives must be cited as the source.
i
Table of Contents Introduction ................................................................................................................................... 1
Success in Developmental English: Fall 2011 through Fall 2014 Cohorts ................................... 4
Success in Developmental English by Enrollment Status ......................................................... 5
Success in Developmental English by Gender .......................................................................... 6
Success in Developmental English by Age ............................................................................... 7
Success in Developmental English by Race/Ethnicity ............................................................... 8
Success in Developmental English by Program Placement ...................................................... 9
Appendix A: Information on Developmental English Redesign ................................................... 11
Appendix B: Data Tables ............................................................................................................ 12
List of Tables Table 1. Success in Developmental English by Enrollment Status: Fall 2011 through Fall 2014 Cohorts ......................................................................................................................................... 4
List of Figures Success Rates in Developmental English: Fall 2011 through Fall 2014 Cohorts .......... 5
Success in Developmental English by Enrollment Status: Fall 2011 through Fall 2014 Cohorts ......................................................................................................................................... 5
Success Rates in Developmental English for Full-Time Students by Gender: Fall 2011 through Fall 2014 Cohorts ............................................................................................................ 6
Success Rates in Developmental English for Part-Time Students by Gender: Fall 2011 through Fall 2014 Cohorts ............................................................................................................ 7
Success Rates in Developmental English of Full-Time Students by Age: Fall 2011 through Fall 2014 Cohorts ............................................................................................................ 7
Success Rates in Developmental English of Part-Time Students by Age: Fall 2011 through Fall 2014 Cohorts ............................................................................................................ 8
Success Rates in Developmental English of Full-Time Students by Ethnicity: Fall 2011 through Fall 2014 Cohorts ............................................................................................................ 9
Success Rates in Developmental English for Part-Time Students by Ethnicity: Fall 2011 through Fall 2014 Cohorts ................................................................................................... 9
Success Rates in Developmental English for Full-Time Students by Program Placement: Fall 2011 through Fall 2014 Cohorts ........................................................................ 10
Success Rates in Developmental English for Part-Time Students by Program Placement: Fall 2011 through Fall 2014 Cohorts ........................................................................ 10
ii
List of Appendix Tables Table B.1. Success in Developmental English by Enrollment Status and Gender: Fall 2011 through Fall 2014 Cohorts .......................................................................................................... 12
Table B.2. Success in Developmental English by Enrollment Status and Age: Fall 2011 through Fall 2014 Cohorts ........................................................................................................................ 12
Table B.3. Success in Developmental English by Enrollment Status and Race: Fall 2011 through Fall 2014 Cohorts .......................................................................................................... 13
Table B.4. Success in Developmental English by Enrollment Status, Gender and Race: Fall 2011 through Fall 2014 Cohorts ................................................................................................. 14
1
Developmental English Success Rates of First-Time to NOVA Students by Enrollment Status and Demographics: Fall 2011 through Fall 2014 Cohorts
Introduction
NOVA’s commitment to student success is supported by the College’s participation in the Achieving the Dream (ATD) National Reform Network. ATD is a comprehensive nationwide, non-governmental reform movement for student success in which NOVA has been a member since 2007 and a Leader College since 2010.1 NOVA’s participation in ATD encourages continuous monitoring of student outcomes in order to identify areas for improvement and pursue research-based methods of increasing student success and closing achievement gaps. To support this endeavor, this Report is part of a series examining recent trends among first-time to NOVA students across the following indicators of student success:
Four-Year Graduation Rates Fall-to-Fall and Fall-to-Spring Retention Success in Developmental Education Courses Developmental Student Success in College-Level Courses Success in Gatekeeper Courses Successful Course Completion (All Courses)
This report analyzes data on success in developmental English. The success rates are presented for first-time to NOVA students, in the Fall 2011 through Fall 2014 cohorts, who enrolled in a developmental English course during their first term. Success in developmental English is defined as the rate at which students who enrolled in a developmental English course in their first term succeeded in that course within one academic year, i.e., received a grade of “S’ (Satisfactory).2 Students who met this definition of success may not have necessarily completed their entire developmental English sequence, as students may be required to take more than one developmental English course. Students who enrolled in more than one developmental English course in their first semester were counted as successful if they succeeded in at least one of those courses. Various structural and curricula changes were made to developmental English and were implemented between Fall 2012 and Fall 2014. A new statewide placement test was also introduced during this time period. Please see Appendix A for more information.
1 Leader Colleges have demonstrated commitment to and progress on the five principles of Achieving the Dream and have shown at least three years of improvement on at least one of the Achieving the Dream measures of student success. For more information see http://achievingthedream.org 2 S (Satisfactory) is an assignation used to indicate satisfactory completion of developmental courses. These grades are not included in grade point average calculations.
2
In consideration of the College’s commitment to closing achievement gaps, the data in this Report are disaggregated and analyzed by student demographics as of the student’s first term: enrollment status (full-time or part-time), gender, age, race/ethnicity, and program placement. However, the analysis in this report excludes sub-groups of small size (e.g., among racial/ethnic groups, only the outcomes of White, Black, Asian, and Hispanic students are discussed). For data on all sub-groups, please see Appendix B.
3
Executive Summary This report analyzes data on success in developmental English. The success rates are presented for first-time to NOVA students, in the Fall 2011 through Fall 2014 cohorts, who enrolled in a developmental English course during their first term. The following points represent the main findings in this report.
The overall success rate was 82 percent in Fall 2011 but decreased by 7 percentage points to 75 percent for the Fall 2012 through Fall 2014 cohorts.
Enrollment Status
For full-time students, success rates decreased by 8 percentage points to 77 percent; while success rates decreased by 2 percentage points to 71 percent for part-time students.
Gender
Female full-time students had higher success rates (82 percent in Fall 2014) than male full-time students (72 percent in Fall 2014). This was also true for part-time students.
Age
Students ages 18-21 accounted for over 85 percent of the total cohort population and had success rates that were similar to the overall success rates.
Ethnicity
Across all cohorts, among full-time students, Asian students had the highest success rates (85 to 92 percent) while Black students had the lowest success rates (67 to 79 percent).
Although success rates decreased for full-time students of all ethnicities, the decrease from Fall 2011 to Fall 2014 was largest for Hispanic students and Black students (both -10 percentage points), followed by Asian students (-6 percentage points), and White students (-5 percentage points).
Among part-time students, success rates increased for Asian students (8 percentage points) and White students (5 percentage points) but decreased for Black students (-15 percentage points) and Hispanic students (-2 percentage points).
Program Placement
Full-time students in the A.S. and A.A. programs tended to have the highest success rates (79 and 77 percent in Fall 2014, respectively). Among the part-time population, students in the A.A. program tended to have the highest success rates (79 percent in Fall 2014).
4
Developmental English Success Rates of First-Time to NOVA Students by Enrollment Status and Demographics: Fall 2011 through Fall 2014 Cohorts
In Fall 2012, the Virginia Community College System (VCCS) introduced a redesigned developmental English curriculum. Two of the redesigned courses were piloted in Fall 2012 and the remaining redesigned courses were fully implemented during Spring 2013.3 In November 2012, VCCS colleges also began using a new statewide test for developmental English placement: the Virginia Placement Test English (VPT-English). Furthermore, in Fall 2014, NOVA implemented a policy change mandating placement testing and enrollment in developmental courses for all placed students. The policy required students to enroll in developmental courses in their first semester, if placed; however, the policy only applied to first-time in college (FTIC) students. These reforms are important considerations when analyzing the data and may explain the following trends:
Between Fall 2011 and Fall 2012, there was a 5 percent increase in the number of first-time to NOVA students enrolled in developmental English in their first semester; however, between Fall 2012 and Fall 2014 there was a 49 percent decrease in enrollment.
Between Fall 2012 and Fall 2014, the decrease in the number of students enrolled in a developmental English course was larger for full-time students (-55 percent) than for part-time students (-34 percent).
The overall success rate was 82 percent in Fall 2011 but decreased by 7 percentage points to 75 percent for the Fall 2012 cohort, where it remained for the Fall 2013 and Fall 2014 cohorts (see Figure 1, next page).
Table 1. Success in Developmental English by Enrollment Status: Fall 2011 through Fall 2014 Cohorts
Status Fall 2011 Cohort Fall 2012 Cohort Fall 2013 Cohort Fall 2014 Cohort
Success Rates in Developmental English: Fall 2011 through Fall 2014 Cohorts
*Although the VPT-English was introduced in November 2012, the timing of the introduction meant that the Fall 2013 cohort was the first fall cohort in which the majority of students were placed using the VPT-English
Success in Developmental English by Enrollment Status (Figure 2)
Between the Fall 2011 and Fall 2014 cohorts, success rates decreased by 8 percentage points to 77 percent for full-time students.
Although the success rate for part-time students decreased from 73 to 65 percent between Fall 2011 and Fall 2013, the success rate increased to 71 percent for the Fall 2014 cohort.
Success in Developmental English by Enrollment Status: Fall 2011 through Fall 2014 Cohorts
82%
75% 75% 75%
60%
70%
80%
90%
100%
Fall 2011 Fall 2012 Fall 2013 Fall 2014
Su
cces
s R
ate
Cohort
Redesign Pilot Year
Redesign Fully Implemented; New Placement Test*
Policy Change Implementation: Enrollment Mandate
85%
77%
73%71%
60%
70%
80%
90%
Fall 2011 Fall 2012 Fall 2013 Fall 2014
Su
cces
s R
ate
Cohort
Full-Time Part-Time Cohort Overall
6
Success in Developmental English by Gender (Figures 3 and 4) Between the Fall 2011 and Fall 2014 cohorts, success rates decreased from 88 to 82
percent for female full-time students and from 82 to 72 percent for male full-time students.
For female and male part-time students, the success rate decreased between Fall 2011 and Fall 2012 but increased in Fall 2014 to within 2 percentage points of the Fall 2011 cohort’s success rates.
The percentage point difference in success rates between female and male full-time students increased from 6 points in the Fall 2011 cohort to 10 points in Fall 2014 cohort.
The percentage point difference in success rates for part-time students was larger than that for full-time students and was 17 percentage points in the Fall 2014 cohort (79 percent for women and 63 percent for males).
Success Rates in Developmental English for Full-Time Students by Gender: Fall 2011 through Fall 2014 Cohorts
82%
72%
88%
82%
50%
60%
70%
80%
90%
100%
Fall 2011 Fall 2012 Fall 2013 Fall 2014
Su
cces
s R
ate
Cohort
FT Male FT Female FT Overall
7
Success Rates in Developmental English for Part-Time Students by Gender: Fall 2011 through Fall 2014 Cohorts
Success in Developmental English by Age (Figures 5 and 6)
The success rates of full-time students ages 18-21 mirrored the overall full-time success rates, decreasing from 85 percent in Fall 2011 to 78 percent in Fall 2014.
The success rates of part-time students ages 18-21 decreased from 70 percent in Fall 2011 to 67 percent in Fall 2014. In comparison, the overall part-time success rate decreased from 73 percent in Fall 2011 to 71 percent in Fall 2014.
Over 85 percent of each overall cohort fell into the 18 to 21 age group.
Success Rates in Developmental English of Full-Time Students by Age: Fall 2011 through Fall 2014 Cohorts
Note: The figure excludes sub-groups of small size. Data for all sub-groups can be found in Appendix B.
65%63%
80% 79%
50%
60%
70%
80%
90%
Fall 2011 Fall 2012 Fall 2013 Fall 2014
Su
cces
s R
ate
Cohort
PT Male PT Female PT Overall
85%
78%
50%
60%
70%
80%
90%
100%
Fall 2011 Fall 2012 Fall 2013 Fall 2014
Su
cces
s R
ate
Cohort
FT 18-21 FT Overall
8
Success Rates in Developmental English of Part-Time Students by Age: Fall 2011 through Fall 2014 Cohorts
Note: The figure excludes sub-groups of small size. Data for all sub-groups can be found in Appendix B.
Success in Developmental English by Race/Ethnicity (Figures 7 and 8)
Although success rates decreased for full-time students of all ethnicities, the decrease was largest for Hispanic students and Black students (both -10 percentage points), followed by Asian students (-6 percentage points), and White students (-5 percentage points).
Among part-time students, success rates increased for Asian students (8 percentage points) and White students (5 percentage points) but decreased for Black students (-15 percentage points) and Hispanic students (-2 percentage points).
Across all cohorts among full-time students, Asian students had the highest success rates (85 to 92 percent) while Black students had the lowest success rates (67 to 79 percent).
Part-time Black students had the highest success rate in Fall 2011 but the lowest rates in Fall 2014. Part-time Hispanic students had the second highest success rate in Fall 2011 but the lowest in Fall 2013.
70% 67%
50%
60%
70%
80%
90%
100%
Fall 2011 Fall 2012 Fall 2013 Fall 2014
Su
cces
s R
ate
Cohort
PT 18-21 PT Overall
9
Success Rates in Developmental English of Full-Time Students by Ethnicity: Fall 2011 through Fall 2014 Cohorts
Success Rates in Developmental English for Part-Time Students by Ethnicity: Fall 2011 through Fall 2014 Cohorts
Success in Developmental English by Program Placement (Figures 9 and 10)
The proportion of students who were enrolled in A.S. programs in their first term increased from 60 percent in Fall 2011 to 73 percent in Fall 2014 (See Appendix B).
Success rates for full-time students decreased across all program types. However, among part-time students, success rates increased for students placed in A.A. and A.A.S. programs but decreased for students placed in A.S. programs.
Full-time students who were enrolled in either an A.A. or an A.S. degree had the highest success rates (77 to 88 percent) and were never more than two percentage points apart.
Among part-time students, students enrolled in A.A. programs had the highest success rates from 2012 through 2014.
85%80%
79%
69%
92%
86%86%
76%
50%
60%
70%
80%
90%
100%
Fall 2011 Fall 2012 Fall 2013 Fall 2014
Su
cces
s R
ate
Cohort
FT White FT Black FT Asian FT Hispanic FT Overall
70%
74%
76%
61%
72%
80%
75%
72%
50%
60%
70%
80%
90%
Fall 2011 Fall 2012 Fall 2013 Fall 2014
Su
cces
s R
ate
Cohort
PT White PT Black PT Asian PT Hispanic PT Overall
10
Students enrolled in A.A.S. programs had the lowest success rates, regardless of enrollment status (in the Fall 2014 cohort, these full-time students were 5 to 8 percentage points below the overall full-time success rate; while part-time students were 4 percentage points below the overall part-time success rate).
Success Rates in Developmental English for Full-Time Students by Program Placement: Fall 2011 through Fall 2014 Cohorts
Note: The figure excludes sub-groups of small size. Data for all sub-groups can be found in Appendix B.
Success Rates in Developmental English for Part-Time Students by Program Placement: Fall 2011 through Fall 2014 Cohorts
Note: The figure excludes sub-groups of small size. Data for all sub-groups can be found in Appendix B.
88%
77%80%
69%
87% 79%
50%
60%
70%
80%
90%
100%
Fall 2011 Fall 2012 Fall 2013 Fall 2014
Su
cces
s R
ate
Cohort
FT A.A. FT A.A.S. FT A.S. FT Overall
73%
79%
60%
67%
79%
69%
50%
60%
70%
80%
90%
Fall 2011 Fall 2012 Fall 2013 Fall 2014
Su
cces
s R
ate
Cohort
PT A.A. PT A.A.S. PT A.S. PT Overall
11
Appendix A: Information on Developmental English Redesign Implementation of Developmental English Redesign In order to meet the needs of the students in developmental reading and writing and to move them more effectively into college-level English courses, the Virginia Community College System (VCCS) redesigned the structure of developmental English. Two of the redesigned courses were piloted in Fall 2012 and the remaining redesigned courses were fully implemented during Spring 2013. The developmental English redesign involved the integration of reading and writing into three fundamental courses. The redesign also involved the development of a new placement test for determining college readiness in English (VPT-English). The VPT-English is a diagnostic test for determining a student’s level of preparedness in English. The scores on the VPT-English determine whether a student is ready to enroll directly into a college-level, credit-level English course. VPT-English was available to all colleges in November 2012. COMPASS placement test results were used before the implementation of VPT.
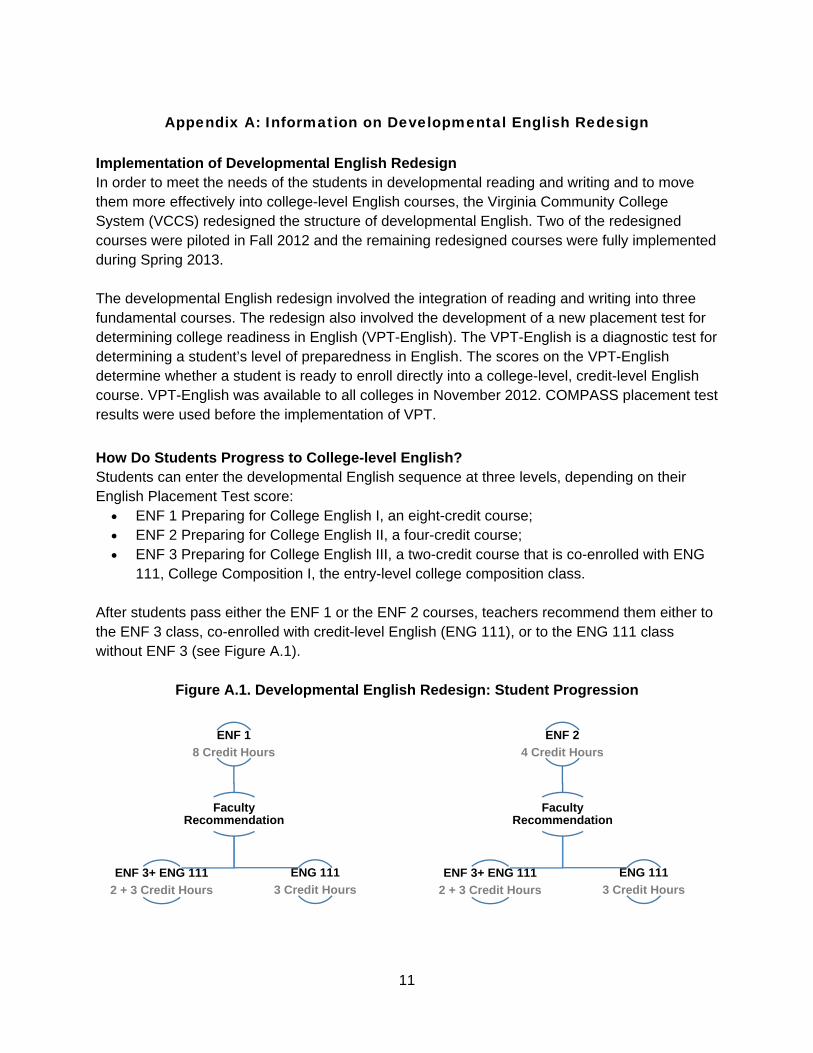
How Do Students Progress to College-level English? Students can enter the developmental English sequence at three levels, depending on their English Placement Test score:
ENF 1 Preparing for College English I, an eight-credit course; ENF 2 Preparing for College English II, a four-credit course; ENF 3 Preparing for College English III, a two-credit course that is co-enrolled with ENG
111, College Composition I, the entry-level college composition class. After students pass either the ENF 1 or the ENF 2 courses, teachers recommend them either to the ENF 3 class, co-enrolled with credit-level English (ENG 111), or to the ENG 111 class without ENF 3 (see Figure A.1).
Figure A.1. Developmental English Redesign: Student Progression
ENF 1
8 Credit Hours
Faculty Recommendation
ENG 111
3 Credit Hours
ENF 3+ ENG 111
2 + 3 Credit Hours
ENF 2
4 Credit Hours
Faculty Recommendation
ENG 111
3 Credit Hours
ENF 3+ ENG 111
2 + 3 Credit Hours
12
Appendix B: Data Tables Table B.1. Success in Developmental English by Enrollment Status and Gender:
Fall 2011 through Fall 2014 Cohorts
Status Gender Fall 2011 Cohort Fall 2012 Cohort Fall 2013 Cohort Fall 2014 Cohort
With commitment to the values of access, opportunity, student success, and excellence, the mission of Northern Virginia Community College is to deliver world-class in-person and online post-secondary teaching, learning, and workforce development to ensure our region and the Commonwealth of Virginia have an educated population and globally competitive workforce.
Strategic Goals
I. STUDENT SUCCESS – Northern Virginia Community College will move into the top tier
of community colleges with respect to the college readiness, developmental course completion, retention, graduation, transfer, and career placement of its students.
II. ACCESS – Northern Virginia Community College will increase the number and diversity
of students being served to mirror the population growth of the region.
III. TEACHING AND LEARNING – Northern Virginia Community College will focus on student success by creating an environment of world-class teaching and learning.
IV. EXCELLENCE – Northern Virginia Community College will develop ten focal points of
excellence in its educational programs and services that will be benchmarked to the best in the nation and strategic to building the College's overall reputation for quality.
V. LEADERSHIP – Northern Virginia Community College will serve as a catalyst and a
leader in developing educational and economic opportunities for all Northern Virginians and in maintaining the quality of life and economic competitiveness of the region.
VI. PARTNERSHIPS – Northern Virginia Community College will develop strategic partnerships to create gateways of opportunity and an integrated educational system for Northern Virginians who are pursuing the American Dream.
VII. RESOURCES – Northern Virginia Community College will increase its annual funding
by $100 million and expand its physical facilities by more than one million square feet in new and renovated space. This includes the establishment of two additional campuses at epicenters of the region’s population growth, as well as additional education and training facilities in or near established population centers.
VIII. EMERGENCY PREPAREDNESS AND CONTINUITY OF OPERATIONS – Northern
Virginia Community College will be recognized as a leader among institutions of higher education in Virginia for its development and testing of emergency response and continuity of operation plans.