Sudan 2013 floods, From satellite images perspective, Case study: Eastern Nile Locality, Khartoum State Amna A. Hamid, Eltayeb O. Adam and Yahya H. Altayeb Remote Sensing Authority - NCR Khartoum- Sudan 1
Transcript
Sudan 2013 floods, From satellite images perspective,
Case study: Eastern Nile Locality, Khartoum State
Amna A. Hamid, Eltayeb O. Adam and Yahya H. Altayeb
Remote Sensing Authority - NCR Khartoum- Sudan
1
Introduction Sudan area is 1.949 million square kilometers. Sudan population is about 32 millions. Annual rainfall amount exceeds 800 mm in the South
and below 100 mm in the extreme north.
The major environmental problems that cause disasters in Sudan are floods, droughts and desertification.
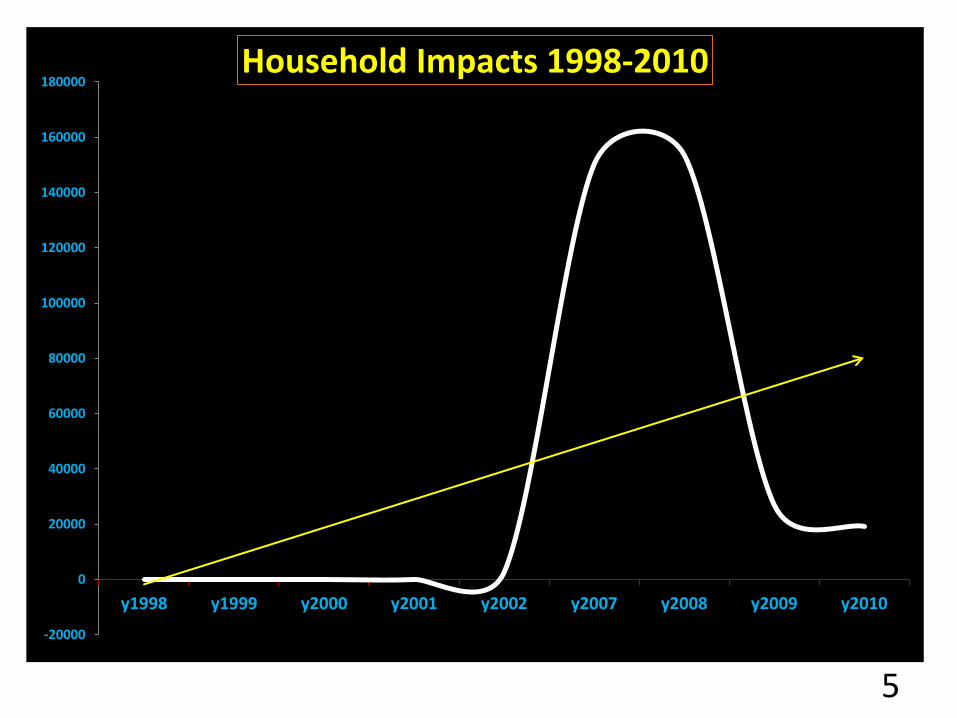
Floods:
Both river flood and flash floods, their impacts include loss of lives and properties. They cause damage to natural resources, especially to soils and vegetation along the Nile bank and its tributaries, deterioration of health situation with increasing incidences of malaria and water-borne diseases as well as disruption of social services.
Through UN- SPIDER and UNDP Khartoum – Sudan efforts and charter activation, different sets of information from satellite data interpretation were available to all actors of disaster management in Sudan within relatively short period (August first to August 13).
Satellite data and GIS information was used during the first stage of disaster (emergency response) effectively.
The provided information will be used also for flood damage assessment
10
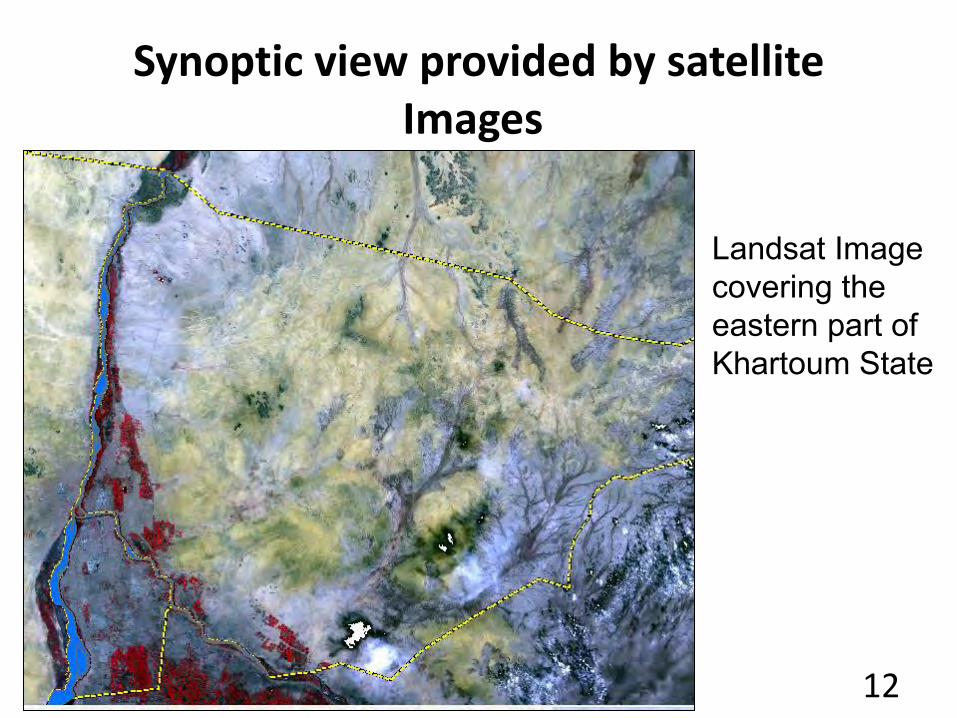
Why Satellite Images? Satellite images provide:
1. Wide area coverage to give a general overview
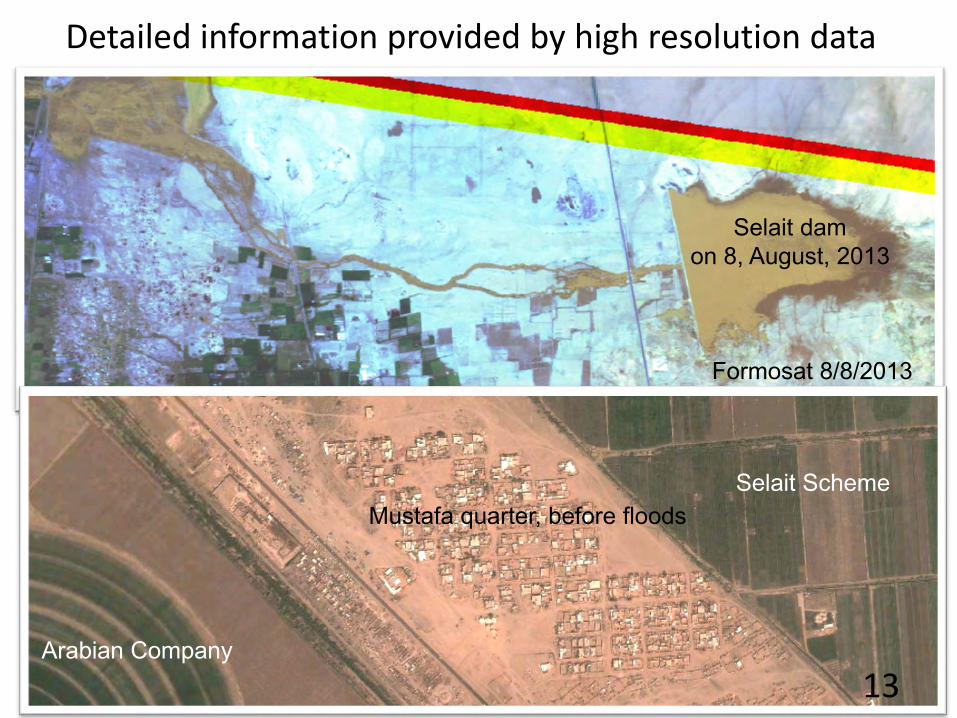
2. High resolution data to give details and helps in immediate interventions
3. Recent coverage to assess the current situation
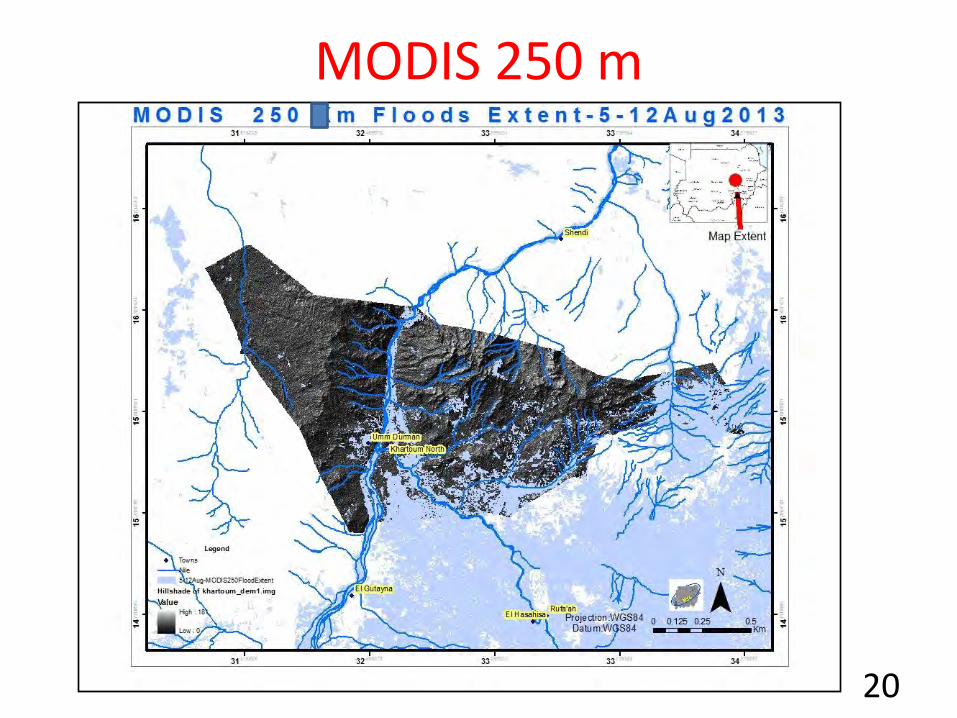
4. Temporal coverage to provide data regularly
5. Easy to draw information from satellite data
6. Archives and Live data (image) for future uses
11
Synoptic view provided by satellite Images
Landsat Image covering the eastern part of Khartoum State
12
Detailed information provided by high resolution data
Formosat 8/8/2013
Selait dam on 8, August, 2013
Mustafa quarter, before floods Selait Scheme
Arabian Company 13
Different satellites provided recent and up-to-date information on flood status
Formosat 8/8/2013 Formosat 9/8/2013
ASTER 13/8/2013 MODIS 4/8/2013
EO 13/8/2013
Radarsat2 4/8/2013
Green color is the Data produced from Radarsat2
14
Temporal coverage to provide data regularly Daily acquisition by MODIS
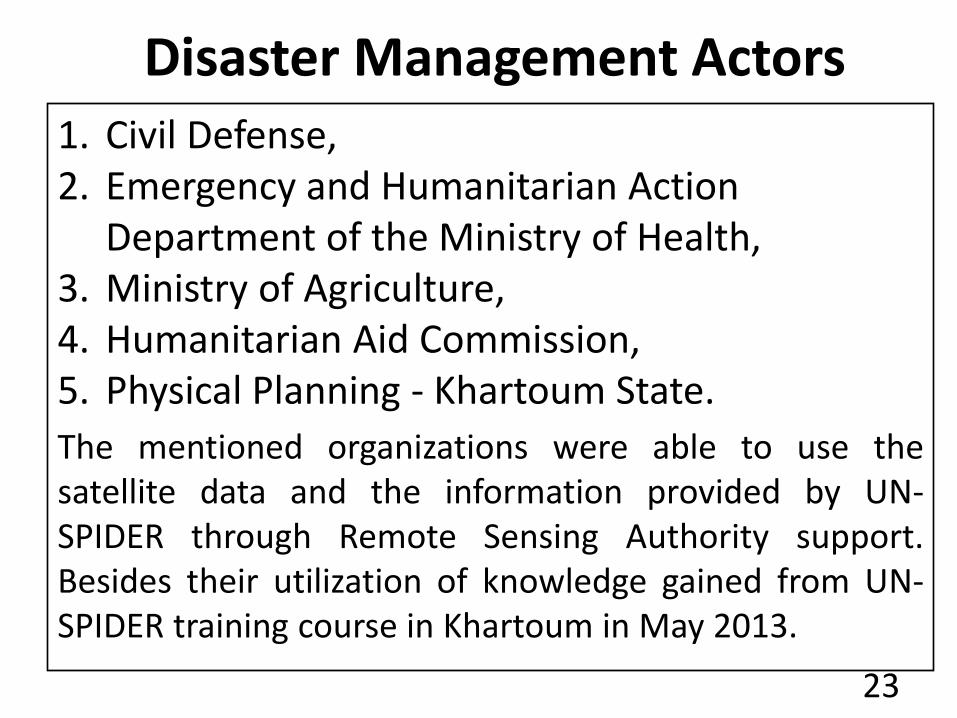
Department of the Ministry of Health, 3. Ministry of Agriculture, 4. Humanitarian Aid Commission, 5. Physical Planning - Khartoum State.
The mentioned organizations were able to use the satellite data and the information provided by UN- SPIDER through Remote Sensing Authority support. Besides their utilization of knowledge gained from UN-SPIDER training course in Khartoum in May 2013.
23
Flood risk assessment from satellite image perspective
RSA intended to identify factors that contribute to high risk of Khartoum floods based on image interpretation
Proposed measures for risk reduction based on RSA findings
Recommendations
24
Factors that contribute to high risk of Khartoum floods 1- Topography
2- Flood prone areas 3- Land use
25
1- Topography of the area and flood risk
The land form of the eastern side of Khartoum State is characterized by having Dendritic drainage pattern, which is a well- integrated pattern formed by a main stream with its tributaries branching and re-branching freely in all directions .
This type of drainage system results from the erosion of the land surface.
26
Drainage pattern of the eastern region
Fine- textured dendritic pattern, the system induces and accelerates floods
27
Areas and lengths of the Valleys
Lengths of some valleys exceed 70 km, therefore, such valleys are expected to carry huge amount of water in a destructive manner 28
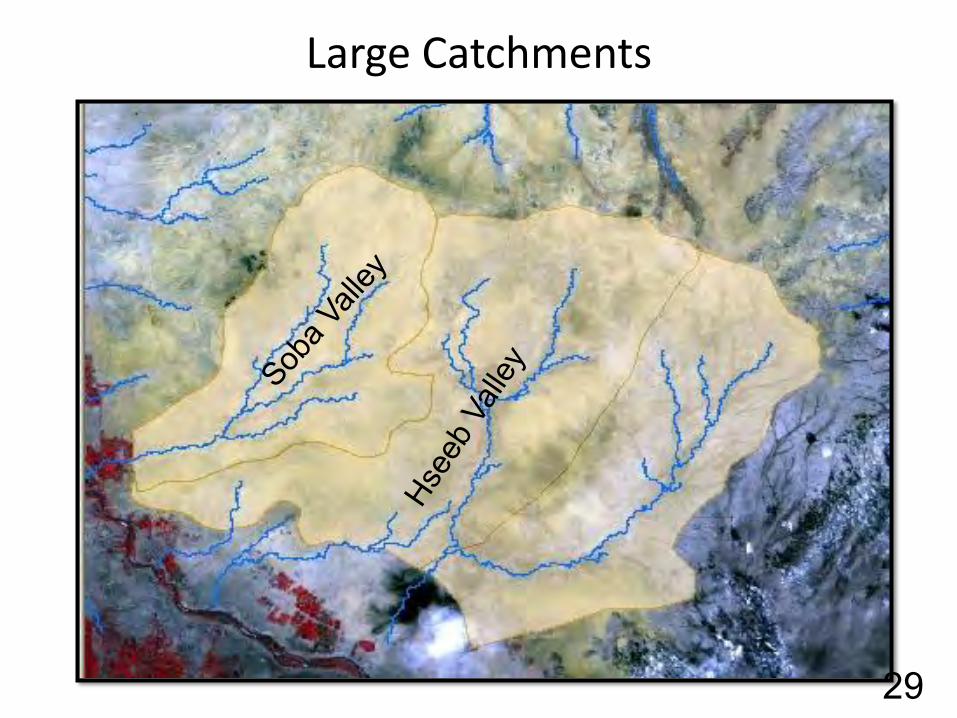
Large Catchments
29
1972 Landsat image of the region
Most of the Valleys end up in Deltas. No distinct water courses reach the Nile 30
Delta (Flood prone area)
31
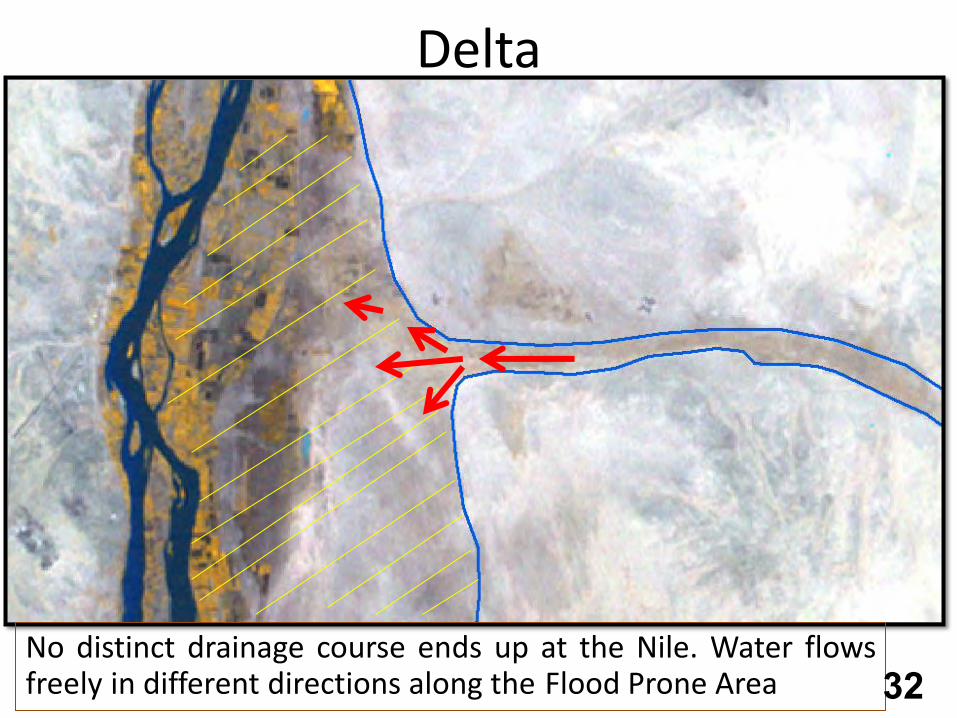
Delta
No distinct drainage course ends up at the Nile. Water flows freely in different directions along the Flood Prone Area 32
2- Flood – prone areas
33
Landsat Image in 1972
1
1
1
1
2
1 Flood prone area 2 Flood prone area
34
Contour lines and Flood prone zone
35
Flood zone levels and the related risk
1
1
1
2
2 3
3
3 2
1st level, high risk, mainly from the river Nile. 2nd level, high risk, mainly from the Valleys, 3rd level, rarely it is affected by the Valleys.
36
3- Land use A- Urban Planning B- Agricultural Schemes
37
Residential
Agricultural
Approximately 80% of the residential and agricultural parcels of the Eastern Nile locality are located within the flood zone
38
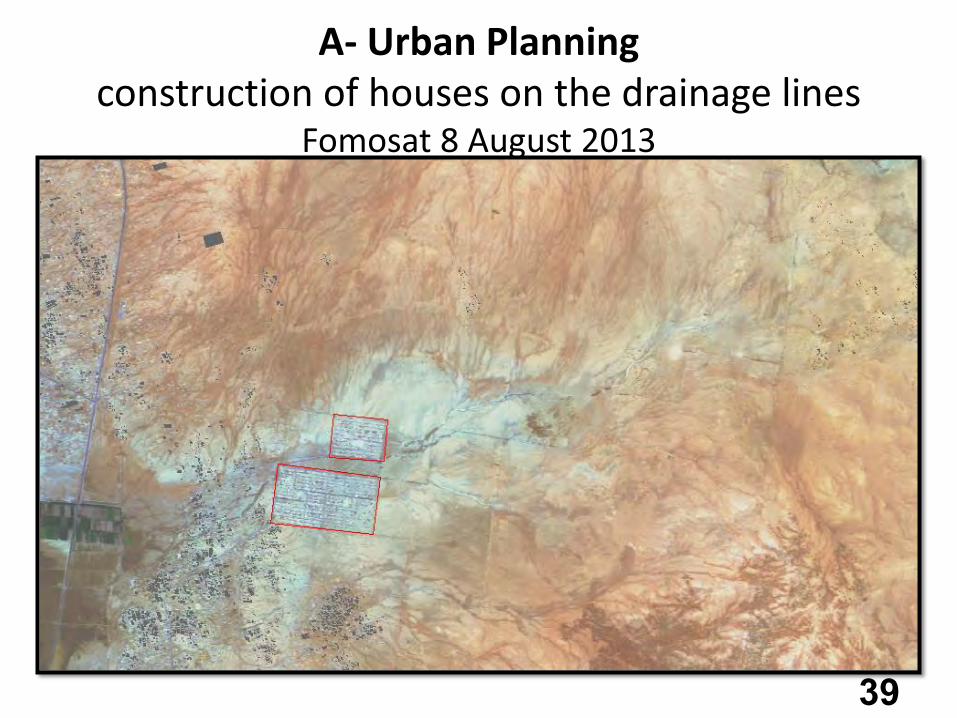
A- Urban Planning construction of houses on the drainage lines
Fomosat 8 August 2013
39
Part of the Journalists town was constructed in the middle of the water course
40
Road construction across Valleys
41
Roads across a valley
42
Circular road has retained part of the flood water
Journalists town
ASTER 13/8/2013
N
43
South eastern part of the Eastern Soba area ASTER 13/8/2013
44
B- Agricultural Schemes
45
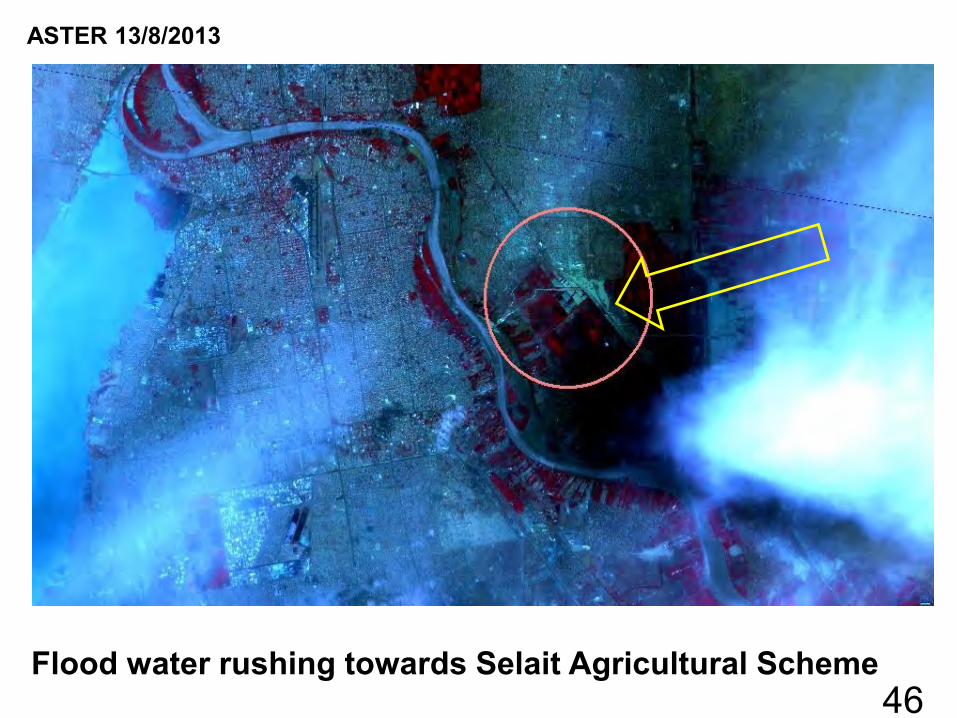
ASTER 13/8/2013
46 Flood water rushing towards Selait Agricultural Scheme
Soba Valley
Selait Scheme
Shareef blocks
Rush of Soba Valley floods towards Selait Agric. Scheme and three Residential areas
47
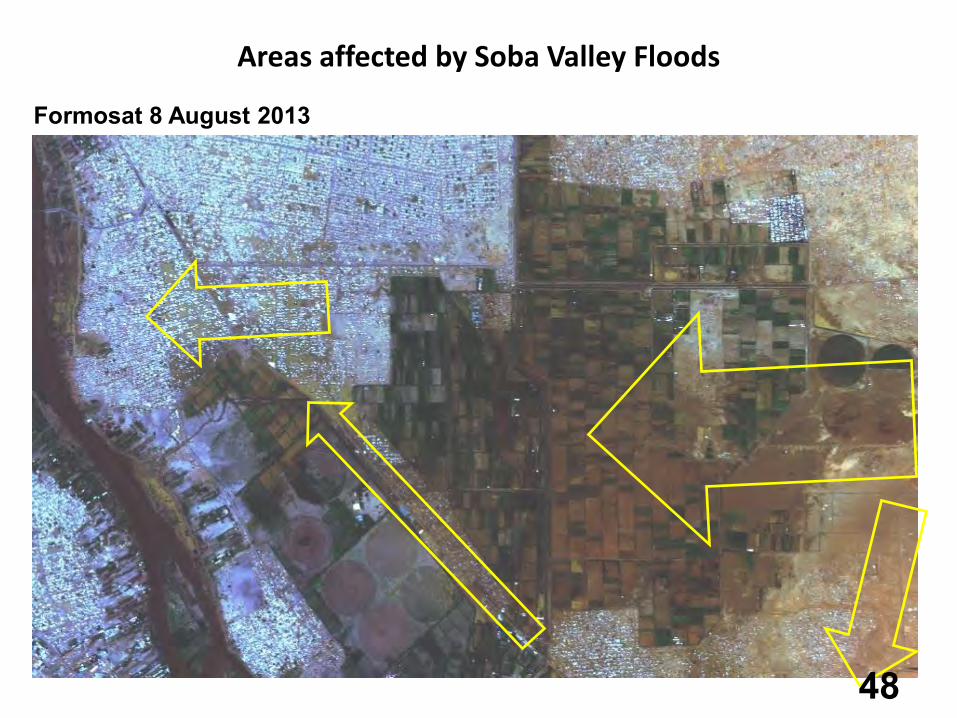
Areas affected by Soba Valley Floods
Formosat 8 August 2013
48
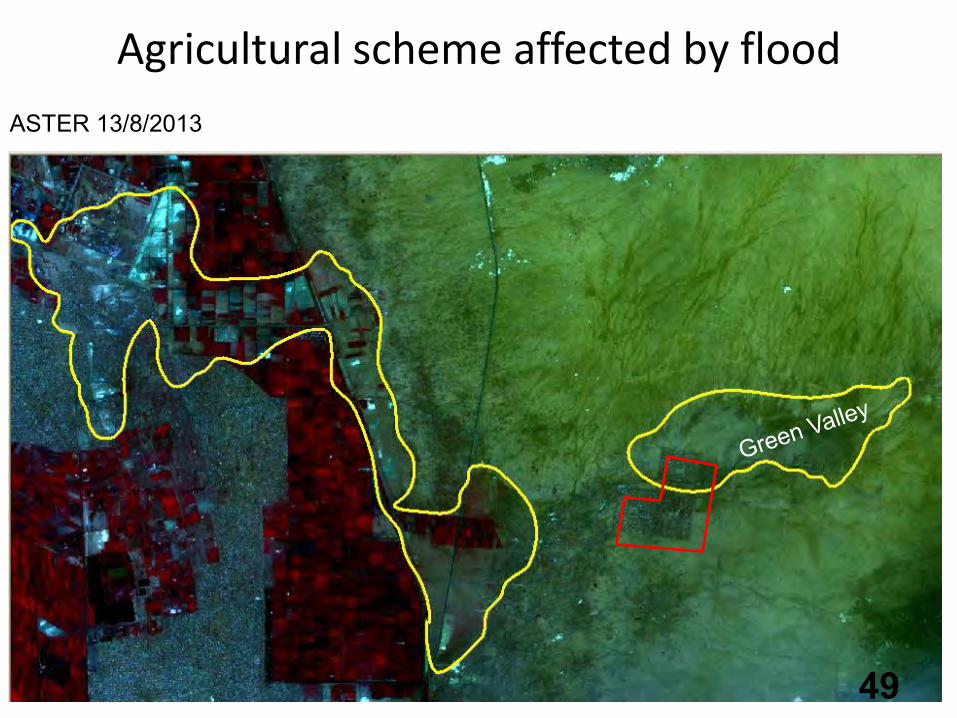
Agricultural scheme affected by flood
ASTER 13/8/2013
49
The influence of Dams on flood risk reduction
50
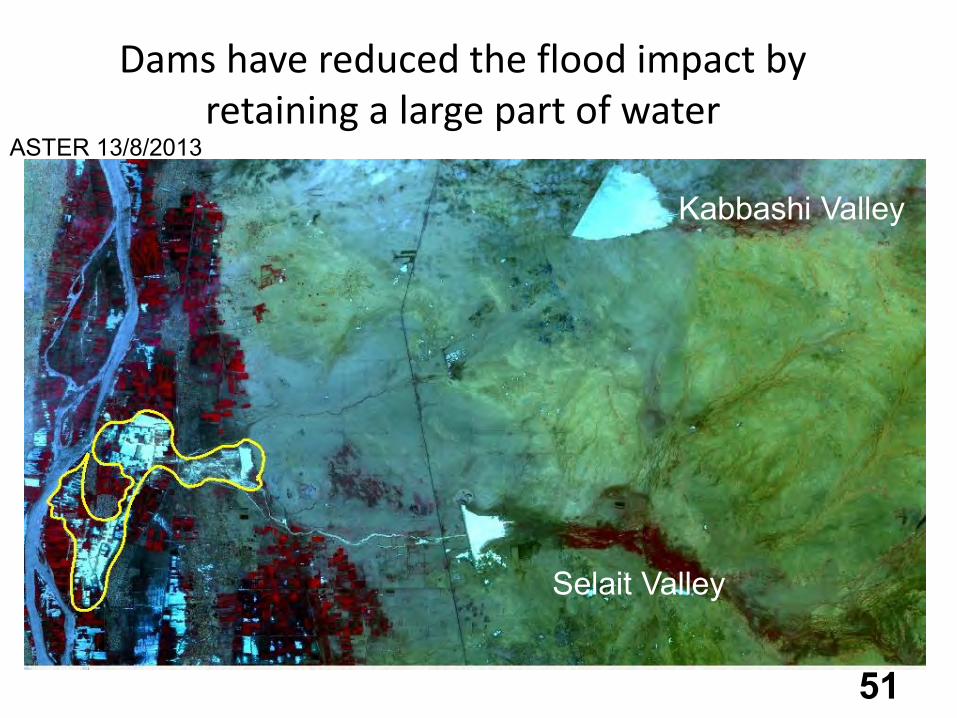
Dams have reduced the flood impact by retaining a large part of water
Kabbashi Valley
Selait Valley
ASTER 13/8/2013
51
Selait Valley dam – Flooded Agric. Areas
Due to the surplus flood water, the part of water in excess of the dam’s capacity has caused serious damages to the agric. schemes 52
Formosat 8 August 2013
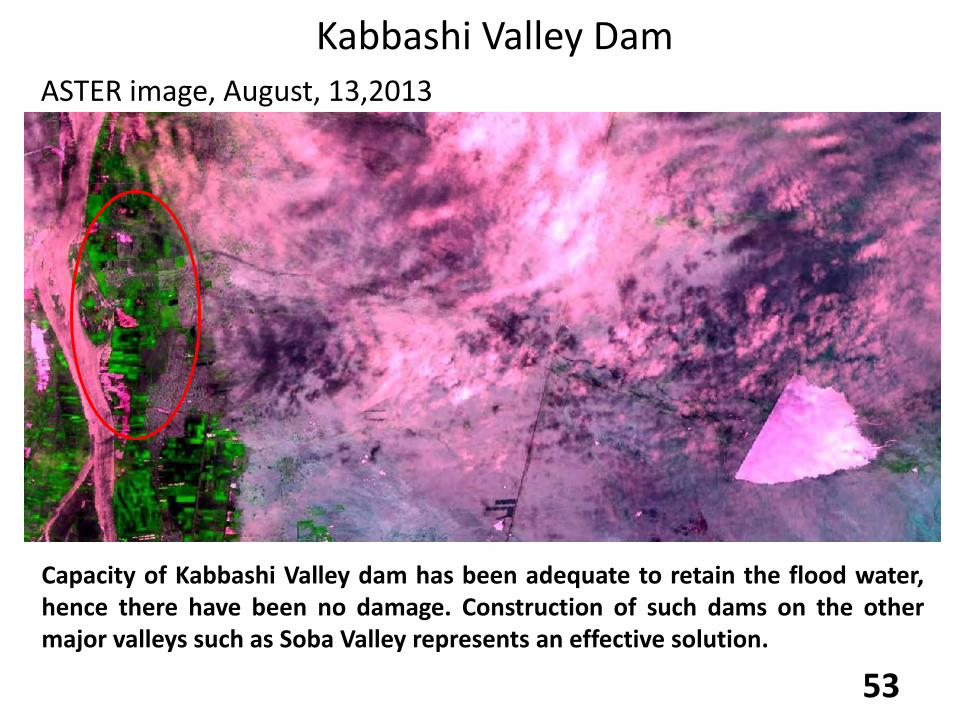
Capacity of Kabbashi Valley dam has been adequate to retain the flood water, hence there have been no damage. Construction of such dams on the other major valleys such as Soba Valley represents an effective solution.
Kabbashi Valley Dam
53
ASTER image, August, 13,2013
Causes of damages
54
Factors that contribute to high flood risk, from Satellite images perspective
1- Topography, Drainage patterns (dendritic) that induce and accelerate flood;
2- Drainage system that ends up in deltas forming large flood prone areas where water flows in different directions in such low or gently sloping areas;
3- Lack of proper land use planning; 80% of the urban and agricultural schemes are within the flood-prone zone; and
4- Road construction intersecting valleys without proper drainage system.
55
Proposed Solutions From satellite
Image perspective
56
Proposed solutions 1. Construction of Dams; 2. Construction of buildings and establishment
of projects away from water courses;
3. Construction of proper drainage systems;
4. Development of satellite based geo-information services;
5. Building geodatabase for strategic planning and decision support.
57
Construction of Dams
58
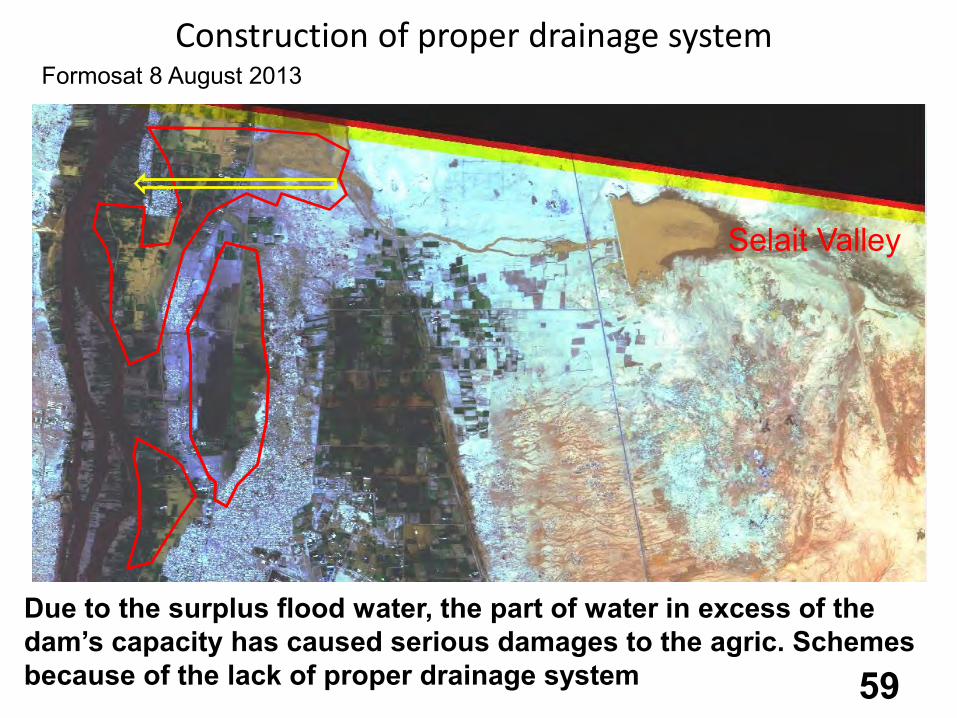
Construction of proper drainage system Formosat 8 August 2013
59
Due to the surplus flood water, the part of water in excess of the dam’s capacity has caused serious damages to the agric. Schemes because of the lack of proper drainage system
Selait Valley
Construction of adequate drainage systems
60
Soba Valley
Dated: August, 8, 2013
Construction of settlements away from the water courses The Green Valley
61
Formosat (China sat.) image
This part of the Journalists’ City has been established inside the valley
The Green Valley has caused major damages of each of the Journalists’, Idd Babiker Cities and some other agric. areas. As seen in the image, there is no dam across the valley, and some part of the Journalists’ City has been established inside the Valley.
موقع محصن –مصفاة الجيلي
Avoiding the valleys and at the same time using them for drainage
Landsat 2011
Example of Good Site Selection - avoiding building the structures inside the valleys
62
Jaily Refinery
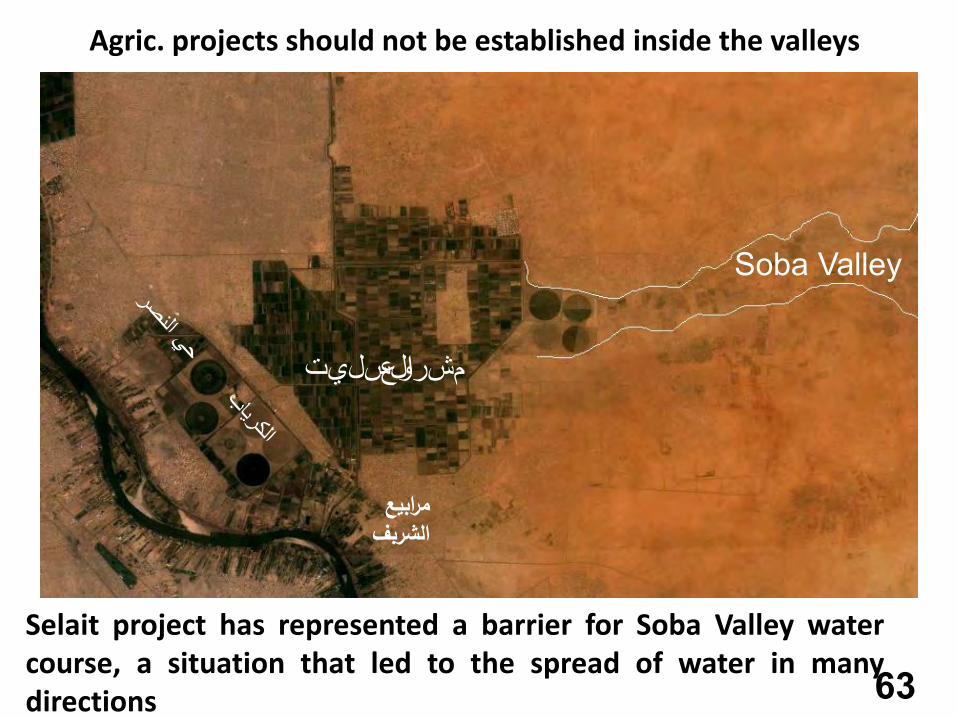
مشروع السليت
مرابيع الشربف
63
Soba Valley
Agric. projects should not be established inside the valleys
Selait project has represented a barrier for Soba Valley water course, a situation that led to the spread of water in many directions
Recommendations Enforce capacity building concerning the use of space based
information in DRM through UN- SPIDER and other international support agencies.
Ensure and support cooperation and information and data sharing.
Ensure the availability and accessibility of remote sensing data and DEMs that provide rapid methods of mapping and monitoring flooded areas and predicting possible extensions on the flood.
Delineate the flood plain or flood–prone areas in advance to flood event and consider them as risk areas.
Prepare flood inundation maps to delineate the actual flooded areas.