49
Sugar reduction: juice and milk based drinks A technical report outlining guidelines for industry, 2017 baseline levels for drinks in scope and next steps May 2018
| Date post: | 03-Dec-2018 |
| Category: |
Documents |
| Upload: | vuongkhanh |
| View: | 215 times |
| Download: | 0 times |
Sugar reduction: juice and milk based drinks A technical report outlining guidelines for industry, 2017 baseline levels for drinks in scope and next steps May 2018
Sugar reduction: juice and milk based drinks
About Public Health England
Public Health England exists to protect and improve the nation’s health and wellbeing, and reduce health inequalities. We do this through world-leading science, knowledge and intelligence, advocacy, partnerships and the delivery of specialist public health services. We are an executive agency of the Department of Health and Social Care, and a distinct delivery organisation with operational autonomy. We provide government, local government, the NHS, Parliament, industry and the public with evidence-based professional, scientific and delivery expertise and support. Public Health England Wellington House 133-155 Waterloo Road London SE1 8UG Tel: 020 7654 8000 www.gov.uk/phe Twitter: @PHE_uk Facebook: www.facebook.com/PublicHealthEngland Prepared by: Dr Alison Tedstone, Gabrielle Owtram, Samantha Montel, Eretia O’Kennedy, Vicki Coulton, Victoria Targett, Clare Perkins, Kate Sweeney, Leigh Dowd, Emma Clegg, Jo Nicholas, Bethany Knowles, Fiona McCallion and others at PHE For queries relating to this document, please contact: [email protected]
© Crown copyright 2018 You may re-use this information (excluding logos) free of charge in any format or medium, under the terms of the Open Government Licence v3.0. To view this licence, visit OGL. Where we have identified any third party copyright information you will need to obtain permission from the copyright holders concerned.
Published May 2018 PHE publications PHE supports the UN gateway number: 2018090 Sustainable Development Goals
2
Sugar reduction: juice and milk based drinks
Contents
About Public Health England 2
Executive summary 4
Approach to sugar reduction 7
Definition of added sugar 8
Data used to establish the 2017 baseline and guidelines 10
Technical guidance 12
Monitoring 22
Next steps 26
Acknowledgements 27
Appendices 28
Appendix 1: Baseline analysis of sugar levels and calories for juice and milk based drinks 29
Appendix 2: Summary of stakeholder engagement to inform the juice and milk-based drinks guidelines 42
Appendix 3: Summary of reporting timelines for juice and milk based drinks 48
References 49
3
Sugar reduction: juice and milk based drinks
Executive summary
All groups of the population, particularly children, are consuming on average far too much sugar(1). This increases the risk of excess calorie consumption and weight gain(2), which, over time is linked to obesity. The high prevalence of obesity in England, both in children and adults, leads to a range of social and health problems and consequent economic impacts, including major costs to the NHS(3). High levels of sugar intake also increase the risk of tooth decay, which is common in English children and is another significant cost to the NHS and families(4).
Sugar sweetened beverages are 1 of the major sources of sugar in children’s diets. The Soft Drinks Industry Levy (SDIL) is part of the Government’s plan to reduce childhood obesity and looks to encourage producers to reduce sugar content in soft drinks. The levy does not apply to unsweetened juices as these do not contain added sugar. Sweetened milk based drinks are currently exempt from the SDIL as they are a source of calcium and other nutrientsa. Although not in scope of the SDIL, unsweetened juice and sweetened milk based drinks can also contribute to children’s sugar and calorie intakes, particularly given some of the larger products available that are likely to be consumed in a single occasion. These drinks are now incorporated into Public Health England’s (PHE) sugar reduction programme. These guidelines have been developed through a programme of extensive discussion and consultation with industry and non-governmental organisations (NGOs). The process has been supported by other government departments and Scotland, Wales and Northern Ireland. The technical guidance, analysis of 2017 baseline sugar levels and guidelines for juice and milk based drinks likely to be consumed in a single occasion are presented in this report. The sugar reduction ambition for milk based drinks is a 20% sugar reduction by mid 2021 which will be reported on by PHE in 2022; the ambition will also apply to drinks in scope made with milk substitute drinks. The ambition includes an interim sugar reduction of 10% by mid 2019, based on data from the preceding year (August 2018 – September 2019). The interim ambition will be reported on by PHE by mid 2020a. The 20% ambition for milk based drinks is consistent with other categories in the sugar reduction programme. This ambition will account for naturally occurring lactose in dairy
a Progress on the interim sugar reduction ambition of 10% for milk based drinks will be taken into account when HM Treasury reviews the continuation of their exemption from the SDIL in 2020.
4
Sugar reduction: juice and milk based drinks
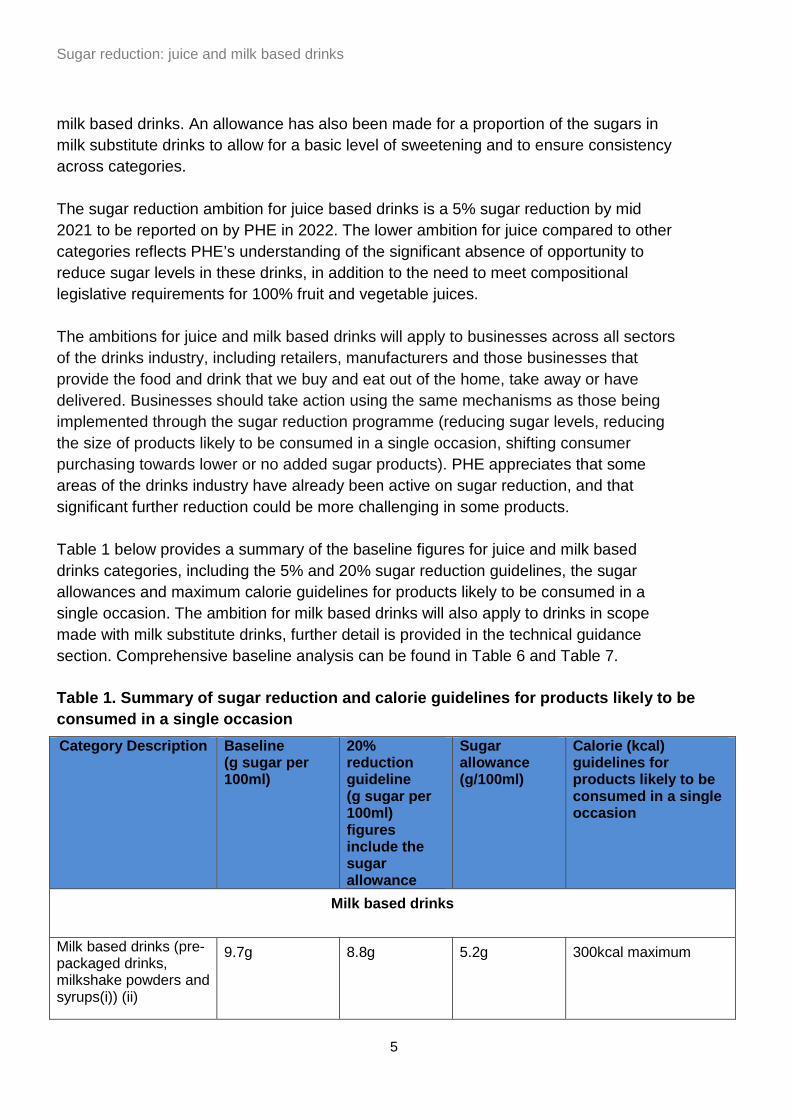
milk based drinks. An allowance has also been made for a proportion of the sugars in milk substitute drinks to allow for a basic level of sweetening and to ensure consistency across categories. The sugar reduction ambition for juice based drinks is a 5% sugar reduction by mid 2021 to be reported on by PHE in 2022. The lower ambition for juice compared to other categories reflects PHE’s understanding of the significant absence of opportunity to reduce sugar levels in these drinks, in addition to the need to meet compositional legislative requirements for 100% fruit and vegetable juices. The ambitions for juice and milk based drinks will apply to businesses across all sectors of the drinks industry, including retailers, manufacturers and those businesses that provide the food and drink that we buy and eat out of the home, take away or have delivered. Businesses should take action using the same mechanisms as those being implemented through the sugar reduction programme (reducing sugar levels, reducing the size of products likely to be consumed in a single occasion, shifting consumer purchasing towards lower or no added sugar products). PHE appreciates that some areas of the drinks industry have already been active on sugar reduction, and that significant further reduction could be more challenging in some products. Table 1 below provides a summary of the baseline figures for juice and milk based drinks categories, including the 5% and 20% sugar reduction guidelines, the sugar allowances and maximum calorie guidelines for products likely to be consumed in a single occasion. The ambition for milk based drinks will also apply to drinks in scope made with milk substitute drinks, further detail is provided in the technical guidance section. Comprehensive baseline analysis can be found in Table 6 and Table 7. Table 1. Summary of sugar reduction and calorie guidelines for products likely to be consumed in a single occasion Category Description Baseline
(g sugar per 100ml)
20% reduction guideline (g sugar per 100ml) figures include the sugar allowance
Sugar allowance (g/100ml)
Calorie (kcal) guidelines for products likely to be consumed in a single occasion
Milk based drinks
Milk based drinks (pre-packaged drinks, milkshake powders and syrups(i)) (ii)
9.7g 8.8g 5.2g 300kcal maximum
5
Sugar reduction: juice and milk based drinks
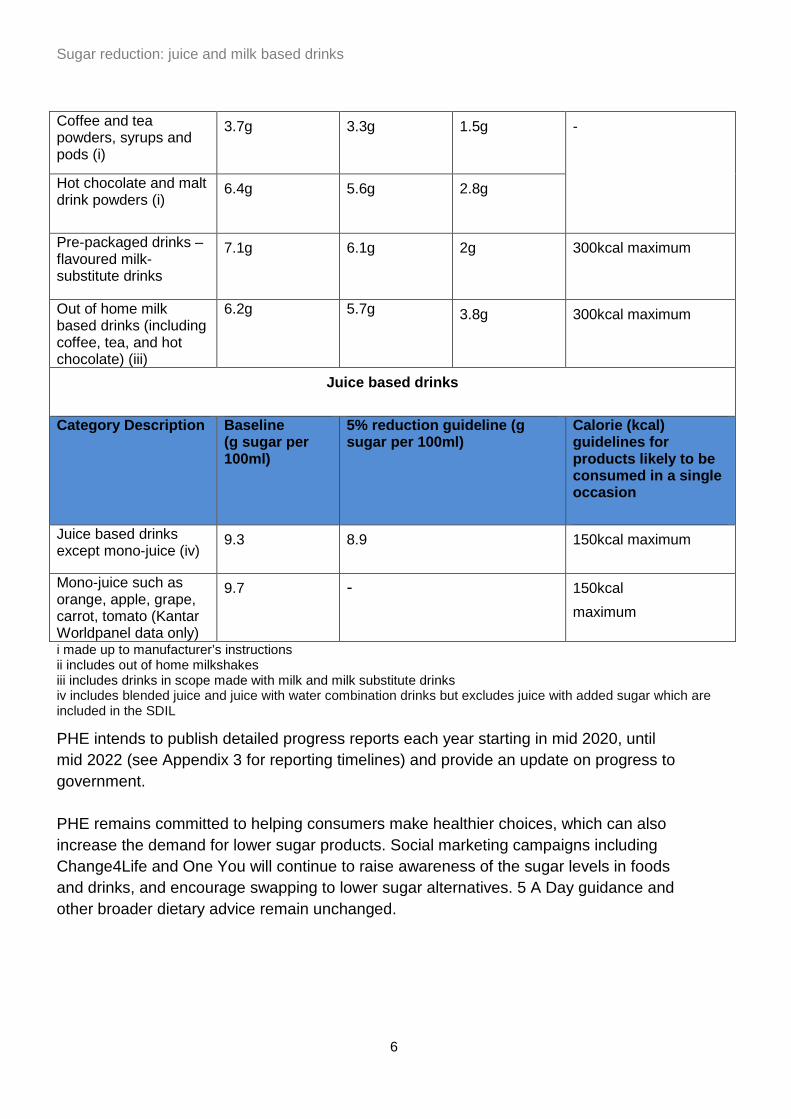
Coffee and tea powders, syrups and pods (i)
3.7g 3.3g 1.5g -
Hot chocolate and malt drink powders (i)
6.4g 5.6g 2.8g
Pre-packaged drinks – flavoured milk-substitute drinks
7.1g 6.1g 2g 300kcal maximum
Out of home milk based drinks (including coffee, tea, and hot chocolate) (iii)
6.2g 5.7g 3.8g 300kcal maximum
Juice based drinks
Category Description
Baseline (g sugar per 100ml)
5% reduction guideline (g sugar per 100ml)
Calorie (kcal) guidelines for products likely to be consumed in a single occasion
Juice based drinks except mono-juice (iv) 9.3 8.9 150kcal maximum
Mono-juice such as orange, apple, grape, carrot, tomato (Kantar Worldpanel data only)
9.7 - 150kcal maximum
i made up to manufacturer’s instructions ii includes out of home milkshakes iii includes drinks in scope made with milk and milk substitute drinks iv includes blended juice and juice with water combination drinks but excludes juice with added sugar which are included in the SDIL
PHE intends to publish detailed progress reports each year starting in mid 2020, until mid 2022 (see Appendix 3 for reporting timelines) and provide an update on progress to government. PHE remains committed to helping consumers make healthier choices, which can also increase the demand for lower sugar products. Social marketing campaigns including Change4Life and One You will continue to raise awareness of the sugar levels in foods and drinks, and encourage swapping to lower sugar alternatives. 5 A Day guidance and other broader dietary advice remain unchanged.
6

Sugar reduction: juice and milk based drinks
Approach to sugar reduction
Every sector of the drinks industry (retailers, manufacturers and out of home) is expected to reduce the overall sugar content of juice based drinks by 5% and milk based drinks by 20% by mid 2021, from a 2017 baseline.
These reductions can be achieved through the following mechanisms: • reducing the levels of sugar present in products • reducing the number of calories in, and/or portion size of products likely to be
consumed in a single occasion • shifting consumer purchasing towards lower/no added sugar products
Sugar reduction should be achieved without increasing the level of saturated fat within a product and, where possible, be accompanied by calorie reduction. The insight gained from PHE’s programme of category specific meetings, 1:1 discussions and written feedback showed that achieving the ambitions for sugar reduction in the drinks in scope by mid 2021 would be challenging but achievable; and that the mechanisms for action included in the programme provided sufficient flexibility for industry. Where sugar reduction per 100ml can be more difficult to achieve, businesses are expected to employ additional mechanisms such as reducing portion size to achieve the ambition. The 2017 baseline year for the programme reflects that the drinks market has changed substantially since 2015. Industry will be invited to submit data if sugar reduction has taken place in the 2 years preceding the 2017 baseline. This is current practice with the sugar reduction programme to minimise businesses not being recognised for sugar reduction activity already taken. PHE acknowledges that industry stakeholder’s preference was for a 2015 baseline for this programme. During stakeholder engagement, the rationale for a 2017 baseline has been set out. The data available for a 2015 baseline does not include data from the out of home sector and PHE considers this dataset not viable for conducting the analysis required for the juice and milk based drinks sugar reduction programme.
7
Sugar reduction: juice and milk based drinks
Definition of added sugar
In this report, the term ‘sugar’ is used as shorthand for the definition of ‘free sugars’(5). This includes all sugars added to foods and drinks plus those naturally present in fruit and vegetable juices, smoothies, purees and pastes, syrups, nectars, honey and milk substitute drinks. It does not include the sugars naturally present in intact and most types of processed fruit and vegetables or milk and dairy products. Total versus added sugar
It is important that the sugar reduction programme focuses on what is easily measurable in products to enable effective monitoring. While health concerns relate to the presence of ‘free sugars’, they are currently not easy to measure and are not declared on the nutrition panel of food labels. Therefore, the programme is focusing predominantly on reducing the levels of total sugars. Total sugars are declared on the nutrition panel and this is the data that will be used to track progress towards the 5% sugar reduction for juices and 20% sugar reduction for milk based drinks. For milk based drinks an allowance has been made for the naturally occurring sugars in milk (lactose). Lactose values for milk based drinks have been developed working in collaboration with industry. As the ambition also applies to drinks in scope made with milk substitutes an allowance has also been made for a proportion of the sugars in milk substitute drinks to allow for a basic level of sweetening in these products and to ensure consistency across categories. Sugar allowances for both product types are covered in more detail later in the guidelines. For the purposes of this programme, from here onwards ‘free’ sugars will be referred to as added sugars. Definition of added sugar
‘Added sugars’ includes all monosaccharides and disaccharides added to foods. For the purposes of this programme this includes:
• cane sugar, brown sugar, crystalline sucrose, invert sugar, dextrose, molasses • sugars in honey, treacle and syrups such as malt syrup, fruit syrup, rice malt syrup, corn
syrup, high fructose corn syrup, maple syrup, glucose syrup, glucose-fructose syrup • fructose, sucrose, glucose, lactose, hydrolysed lactose and galactose added as an
ingredient • sugars in nectars such as coconut blossom nectar, date nectar, agave nectar • sugars in unsweetened fruit and vegetable juices, concentrates and smoothies • sugars in fruit purees and jam
8
Sugar reduction: juice and milk based drinks
Sugars naturally present in milk products, cereals, grains, nuts, seeds and fresh, dried and other processed fruits (other than purees and juices) are not considered added sugar. Substances that are not included in the definition of sugar as it appears on the nutrition panel (ie not analytically sugar) are excluded, for example oligofructose and polyols.
9
Sugar reduction: juice and milk based drinks
Data used to establish the 2017 baseline and guidelines
A variety of data has been used to inform the decisions around the programme and provide the 2017 baseline levels of sugar per 100ml and calories in products likely to be consumed in a single occasion for each category. These same data will be used to monitor progress. This section sets this out in brief detail. The analysis of sugar and calorie levels in the drinks categories, and more detailed information on the data and methodologies used, can be found in Appendix 1. Data used to establish the baseline for juice and milk based drinks
Two commercial datasets have been used to establish baselines for juice and milk based drinks: Kantar Worldpanel for retailers/manufacturers and MCA for the out of home sector. Nutrition information for the out of home sector has also been obtained from individual businesses and websites. The Kantar Worldpanel dataset is based on a panel survey covering 30,000 households. It is a comprehensive dataset and provides data on both volume sales (in kilograms/litres) and nutrition information that is largely derived from the nutrition panel on food and drink labels. MCA run a monthly Eating Out Panel with 6,000 interviews undertaken each month. The panel is representative of the UK adult population. In addition, 2 further data collections have been undertaken to supplement the Eating Out Panel: a survey of 5,000 parents about children’s eating/drinking out and a survey of 2,000 adults designed to capture drinking only occasions.
Metrics produced
Estimates of baseline total sugar and calorie levels for juice and milk based drinks are set out in Appendix 1. The Kantar Worldpanel data covers sales of juice and milk based drinks purchased in Great Britain for in-home consumption in the year to 10 September 2017. The MCA data covers out of home purchases (based on the reported volume of product consumed) across the year to 31 August 2017. The analysis includes sales weighted averages (sugar content per 100ml weighted by volume of sales) where the necessary volume and nutrition data are available. For some categories of drinks, simple average sugar content per 100ml and calories for products likely to be consumed in a single occasion are presented. An explanation of these terms and the reason for using a simple average where relevant is included in Appendix 1.
10
Sugar reduction: juice and milk based drinks
PHE acknowledges that ‘in home’ beverages are consumed in ‘out of home’ settings. Categorisation is based on where the product is purchased.
11
Sugar reduction: juice and milk based drinks
Technical guidance
The overarching aim of the programme is to achieve the 5% reduction in the amount of sugar in juice based drinks and the 20% reduction in the amount of sugar in milk based drinks by mid 2021. A pragmatic approach has been taken in making the final decisions on the structure and details of the programme, taking into account relevant feedback received during the programmes engagement with stakeholders. The final guidelines on sales weighted average (SWA) sugar levels per 100ml, and calorie guidelines for products likely to be consumed in a single occasion are included in Tables 6 and 7. Category definitions
Juice based drinks
PHE aligns with definitions in the Soft Drinks Industry Levy (SDIL) Regulations 2018 and the existing EU/UK legislation for juice drinks (The Fruit Juices and Fruit Nectars (England) Regulations 2013)(6). All juice based drinks are included in one category for the purposes of the programme. Products in scope cover the retail, manufacturing and out of home sectors and are presented in Table 2.
Table 2. Details of products in scope for juice based drinks
Category Product details
Fruit and vegetable 100% juice
Includes
Mono-juice such as orange, apple, grape, carrot, tomato
Blended juice of fruit and/or vegetables such as orange juice blended with mango or apple juice blended with carrot juice or carrot, pineapple and orange juice
Juice smoothies Includes
Combination of 100% juice (fruit or vegetable) combined with whole crushed fruits or vegetables, such as 100% orange juice mixed with crushed pineapple and mango or 100% apple juice with whole crushed strawberry, blackberries and raspberries
Juice smoothies with dairy, where juice is the larger %
Includes
Combination of 100% juice combined with whole crushed fruit mixed with a dairy component. The blend needs to be at least 51% based on fruit or
12
Sugar reduction: juice and milk based drinks
vegetables which is mixed then with a dairy component, such as
100% juice and/or whole crushed fruit (at least 51%) mixed with yoghurt or milk
Fruit juice with water combination drinks
Includes
100% juice at a minimum of 20%* combined with water, such as 100% orange juice at a minimum of 20% of the make-up combined with water
Nut and plant sap water
Includes
Nut or plant sap water such as coconut water, maple water, aloe vera juice, birch sap, bamboo water, cactus water
* PHE considered stakeholder feedback and made a pragmatic decision of a minimum of 20% fruit juice in fruit juice with water combination drinks.
The following juice based drinks are out of scope of the PHE sugar reduction:
• juice based drinks sweetened with added sugar (not naturally occurring fruit or vegetable sugar) as these drinks are covered by the SDIL
• juice with low/non caloric sweeteners • juice drinks with artificial flavourings. This aligns with the EU/UK legislation for juice
drinks
Ambition for juice based drinks
PHE understands that the potential for reducing sugar levels in fruit and vegetable juices, particularly 100% mono-juice, is either impossible or extremely limited due to the nature of the product, associated technical issues with production and manufacture, and the need to meet compositional legislative requirements. The ambition for juices reflects these limitations. For fruit and vegetable based juices the ambition for sugar reduction as follows: • 5% sugar SWA reduction by mid 2021 • a simple average applied to 100% mono-fruit/vegetable juice. • all juice based drinks (including blended juices, smoothies and mono-juices) to meet
a 150kcal maximum guideline for products likely to be consumed in a single occasion by mid 2021.
• shifting purchasing towards lower sugar products Ambition for mono-juice
The ambition for mono-juices has been presented as a simple average. The sugar content of these products is influenced by the seasonality of the fruit/vegetables used and PHE has taken the limitations for reducing sugar in these juices into consideration.
13
Sugar reduction: juice and milk based drinks
PHE will monitor the simple average to ensure that it does not increase. Reducing the size of products likely to be consumed in a single occasion, and shifting consumer purchasing to lower sugar varieties remain options for industry action for these products. Milk based drinks
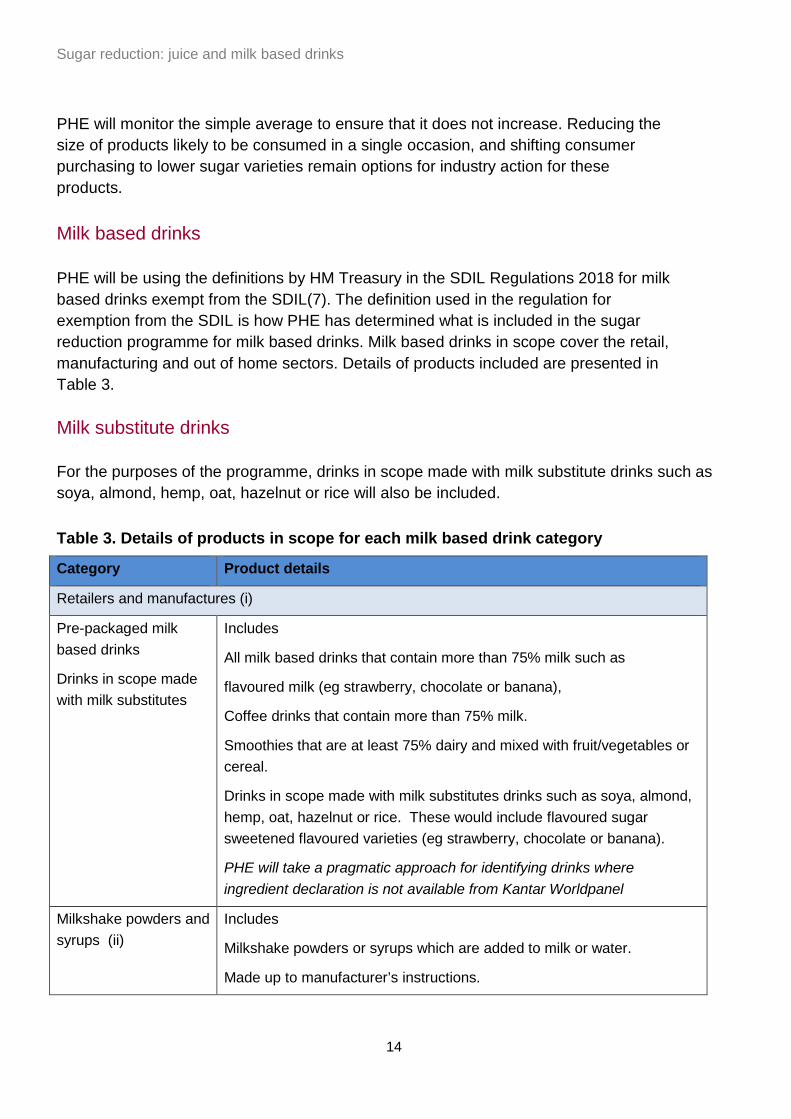
PHE will be using the definitions by HM Treasury in the SDIL Regulations 2018 for milk based drinks exempt from the SDIL(7). The definition used in the regulation for exemption from the SDIL is how PHE has determined what is included in the sugar reduction programme for milk based drinks. Milk based drinks in scope cover the retail, manufacturing and out of home sectors. Details of products included are presented in Table 3. Milk substitute drinks
For the purposes of the programme, drinks in scope made with milk substitute drinks such as soya, almond, hemp, oat, hazelnut or rice will also be included. Table 3. Details of products in scope for each milk based drink category
Category Product details
Retailers and manufactures (i)
Pre-packaged milk based drinks
Drinks in scope made with milk substitutes
Includes
All milk based drinks that contain more than 75% milk such as
flavoured milk (eg strawberry, chocolate or banana),
Coffee drinks that contain more than 75% milk.
Smoothies that are at least 75% dairy and mixed with fruit/vegetables or cereal.
Drinks in scope made with milk substitutes drinks such as soya, almond, hemp, oat, hazelnut or rice. These would include flavoured sugar sweetened flavoured varieties (eg strawberry, chocolate or banana).
PHE will take a pragmatic approach for identifying drinks where ingredient declaration is not available from Kantar Worldpanel
Milkshake powders and syrups (ii)
Includes
Milkshake powders or syrups which are added to milk or water.
Made up to manufacturer’s instructions.
14
Sugar reduction: juice and milk based drinks
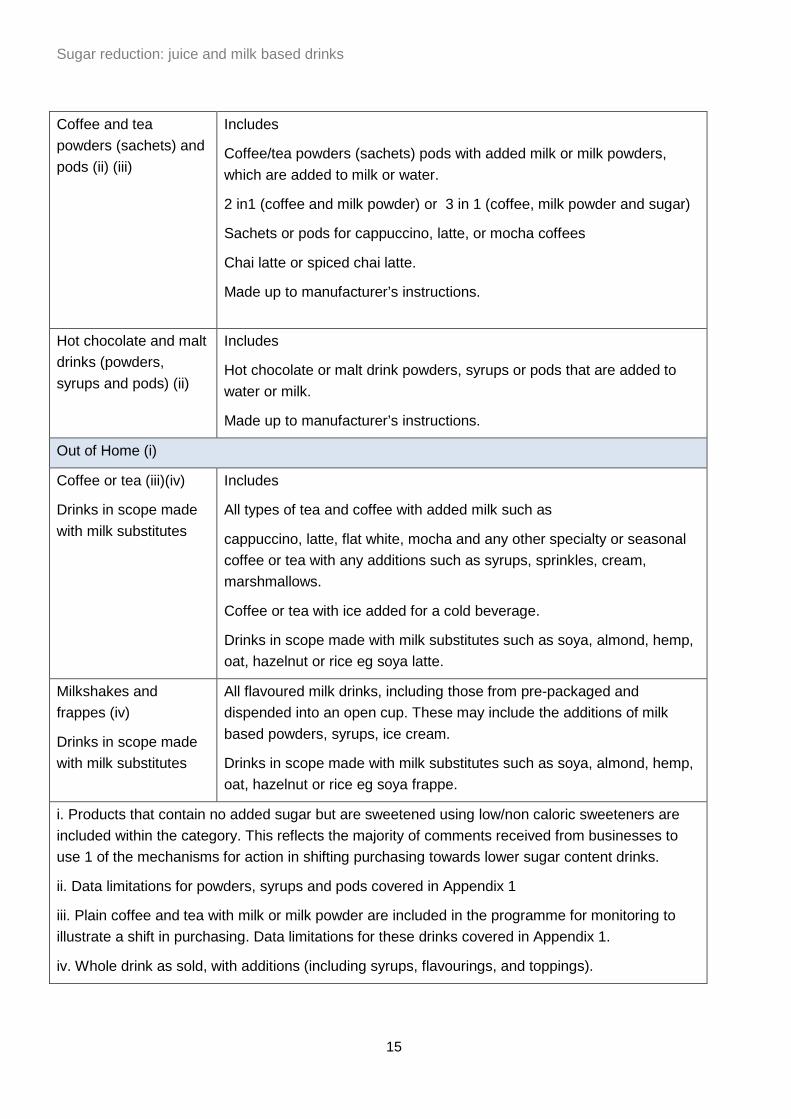
Coffee and tea powders (sachets) and pods (ii) (iii)
Includes
Coffee/tea powders (sachets) pods with added milk or milk powders, which are added to milk or water.
2 in1 (coffee and milk powder) or 3 in 1 (coffee, milk powder and sugar)
Sachets or pods for cappuccino, latte, or mocha coffees
Chai latte or spiced chai latte.
Made up to manufacturer’s instructions.
Hot chocolate and malt drinks (powders, syrups and pods) (ii)
Includes
Hot chocolate or malt drink powders, syrups or pods that are added to water or milk.
Made up to manufacturer’s instructions.
Out of Home (i)
Coffee or tea (iii)(iv)
Drinks in scope made with milk substitutes
Includes
All types of tea and coffee with added milk such as
cappuccino, latte, flat white, mocha and any other specialty or seasonal coffee or tea with any additions such as syrups, sprinkles, cream, marshmallows.
Coffee or tea with ice added for a cold beverage.
Drinks in scope made with milk substitutes such as soya, almond, hemp, oat, hazelnut or rice eg soya latte.
Milkshakes and frappes (iv)
Drinks in scope made with milk substitutes
All flavoured milk drinks, including those from pre-packaged and dispended into an open cup. These may include the additions of milk based powders, syrups, ice cream.
Drinks in scope made with milk substitutes such as soya, almond, hemp, oat, hazelnut or rice eg soya frappe.
i. Products that contain no added sugar but are sweetened using low/non caloric sweeteners are included within the category. This reflects the majority of comments received from businesses to use 1 of the mechanisms for action in shifting purchasing towards lower sugar content drinks.
ii. Data limitations for powders, syrups and pods covered in Appendix 1
iii. Plain coffee and tea with milk or milk powder are included in the programme for monitoring to illustrate a shift in purchasing. Data limitations for these drinks covered in Appendix 1.
iv. Whole drink as sold, with additions (including syrups, flavourings, and toppings).
15
Sugar reduction: juice and milk based drinks
The following milk based drinks and milk substitute drinks are out of scope of the PHE sugar reduction programme: • sugar sweetened pre-packaged milk based drinks with less than 75% milk covered
by the SDIL • plain milk • plain milk substitute drinks (sweetened and unsweetened) • fermented (yogurt) drinks, covered later in the guidelines
Ambition for milk based drinks
Following industry engagement, PHE’s understanding around the breadth of products included in this category has developed. There are a number of complexities that have arisen considering the ambition and baseline analysis for these drinks that has led to this not being a straight forward process. There are currently a range of sizes available for products which are likely to be consumed in a single occasion. Although PHE appreciates that some areas of the drinks industry have already been active on sugar reduction in milk based drinks, PHE considers that there is scope for further action. This includes reducing added sugar, reducing the size of products likely to be consumed in a single occasion, and increasing the number of lower/no added sugar products in this category. For milk based drinks (including a sugar allowance for lactose and a proportion of the sugars in milk substitute drinks) the ambition for sugar reduction is as follows:
• 20% sugar SWA reduction by mid 2021, with an interim 10% sugar SWA reduction
by mid 2019 (based on data from the preceding year, August 2018 – September 2019).
• a simple average applied for powders and syrups, as consumed • milk based drinks (including sweetened coffees, milkshakes, hot chocolates and
drinks in scope made with milk substitutes) to meet a 300 kcals maximum guideline for products likely to be consumed in a single occasion by mid 2021
• shifting purchasing towards lower or no added sugar products
Initially, PHE proposed an interim sugar SWA reduction of 15% for milk based drinks. After further review of the data collection timeframes, this interim ambition has been revised to 10%. Progress on the interim ambition of 10% will be reported on by PHE in mid 2020 and will be based on data from the preceding year (August 2018 – September 2019).
16
Sugar reduction: juice and milk based drinks
Fermented (yogurt) drinks
Given the composition and similarity to yogurts and fromage frais, fermented (yogurt) drinks will be included in the sugar reduction programme under the yogurt and fromage frais category and monitoring of progress will commence in the 2019 sugar reduction progress report. PHE initially considered excluding fermented (yogurt) drinks that were able to make a claim under Article 14 (1) (a) of the EC Regulation on nutrition and health claims (No 1924/2006), which refer to the reduction of disease risk ‘Risk Reduction Claims', from the sugar reduction programme. However, following the majority of stakeholder feedback that products should not be included or excluded based on claims, these products will also be included in the yogurts and fromage frais category. Although some of these products have a small portion size, PHE recognises that there is scope for sugar reduction and reformulation in standard products, in addition to the mechanism to move consumer purchasing to lower sugar varieties. The sugar sweetened fermented (yogurt) drinks that will be included in the sugar reduction yogurt and fromage frais category as follows: • drinking yogurts • yogurt drinks • kefirs • fermented (yogurt) drinks with disease risk reduction claims, including plant stanols • pre and probiotics drinks, including those with functional health claims
Plain, unsweetened fermented (yogurt) drinks are excluded. Details for the inclusion of fermented (yogurt) drinks will be clarified later in 2018 and this will include reporting timeframes, ambition and calorie guidelines for products likely to be consumed in a single occasion. Drinking yogurts are an exception to this, having been included in the 2015 baseline for yogurts and fromage frais and reported in the 2018 sugar progress report. Allowances for naturally occurring sugars
An allowance has been made for naturally present sugars in milk (lactose). The SWA total sugar guideline is based on a 20% and 10% reduction of the added sugar content, rather than a 20% and 10% reduction of the total sugar content. To establish the allowance values for naturally occurring sugars, PHE worked in collaboration with relevant trade bodies and industry representatives to consider appropriate values for different drinks available on the market. Pragmatically for ease of analysis and future monitoring, PHE had looked to develop an overarching lactose value. However, through stakeholder engagement and analysis of the market it was clear that milk based drinks
17
Sugar reduction: juice and milk based drinks
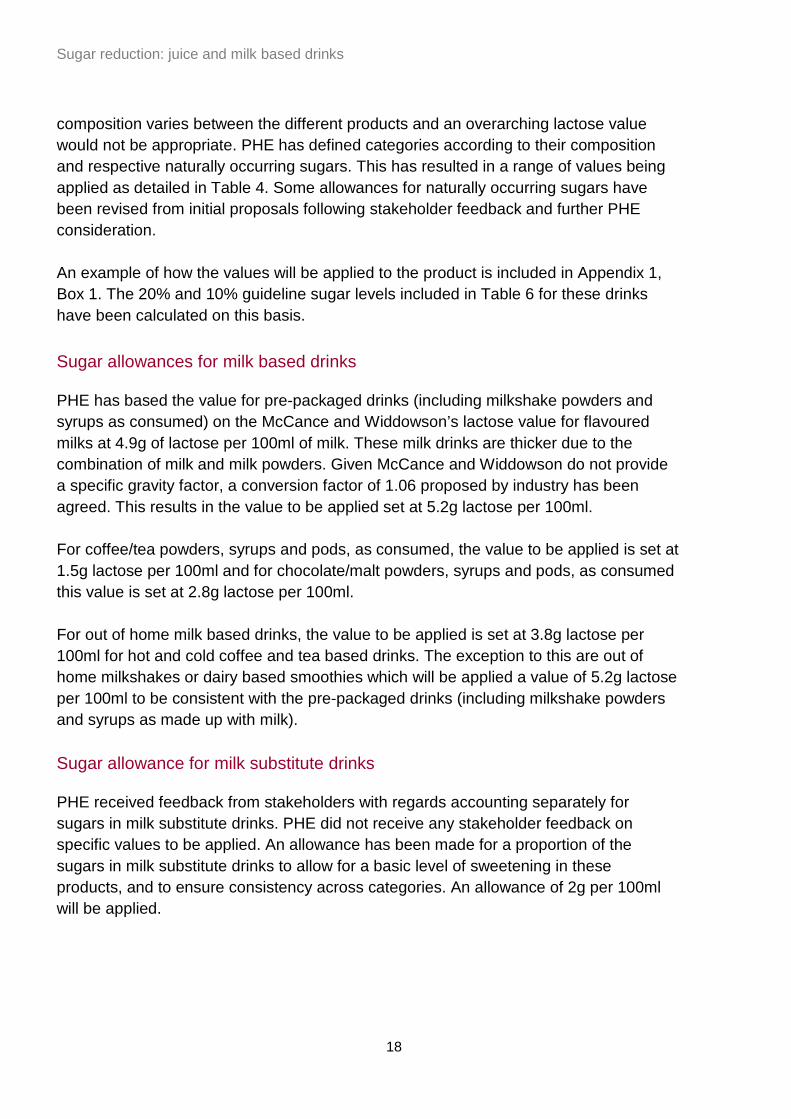
composition varies between the different products and an overarching lactose value would not be appropriate. PHE has defined categories according to their composition and respective naturally occurring sugars. This has resulted in a range of values being applied as detailed in Table 4. Some allowances for naturally occurring sugars have been revised from initial proposals following stakeholder feedback and further PHE consideration. An example of how the values will be applied to the product is included in Appendix 1, Box 1. The 20% and 10% guideline sugar levels included in Table 6 for these drinks have been calculated on this basis. Sugar allowances for milk based drinks
PHE has based the value for pre-packaged drinks (including milkshake powders and syrups as consumed) on the McCance and Widdowson’s lactose value for flavoured milks at 4.9g of lactose per 100ml of milk. These milk drinks are thicker due to the combination of milk and milk powders. Given McCance and Widdowson do not provide a specific gravity factor, a conversion factor of 1.06 proposed by industry has been agreed. This results in the value to be applied set at 5.2g lactose per 100ml. For coffee/tea powders, syrups and pods, as consumed, the value to be applied is set at 1.5g lactose per 100ml and for chocolate/malt powders, syrups and pods, as consumed this value is set at 2.8g lactose per 100ml. For out of home milk based drinks, the value to be applied is set at 3.8g lactose per 100ml for hot and cold coffee and tea based drinks. The exception to this are out of home milkshakes or dairy based smoothies which will be applied a value of 5.2g lactose per 100ml to be consistent with the pre-packaged drinks (including milkshake powders and syrups as made up with milk). Sugar allowance for milk substitute drinks
PHE received feedback from stakeholders with regards accounting separately for sugars in milk substitute drinks. PHE did not receive any stakeholder feedback on specific values to be applied. An allowance has been made for a proportion of the sugars in milk substitute drinks to allow for a basic level of sweetening in these products, and to ensure consistency across categories. An allowance of 2g per 100ml will be applied.
18
Sugar reduction: juice and milk based drinks
Table 4. Sugars allowances
Category Sugars allowances per 100ml
Pre-packaged drinks (including milkshake powders and syrups as consumed) (i)
5.2g
Coffee/tea powders, syrups, pods, as consumed 1.5g
Chocolate/malt powders, syrups, pods, as consumed 2.8g
Out of home milk based drinks 3.8g
Milk substitute drinks (pre-packaged and out of home) 2g
i Includes milkshakes in the out of home sector
Calorie guidelines for drinks likely to be consumed in a single occasion
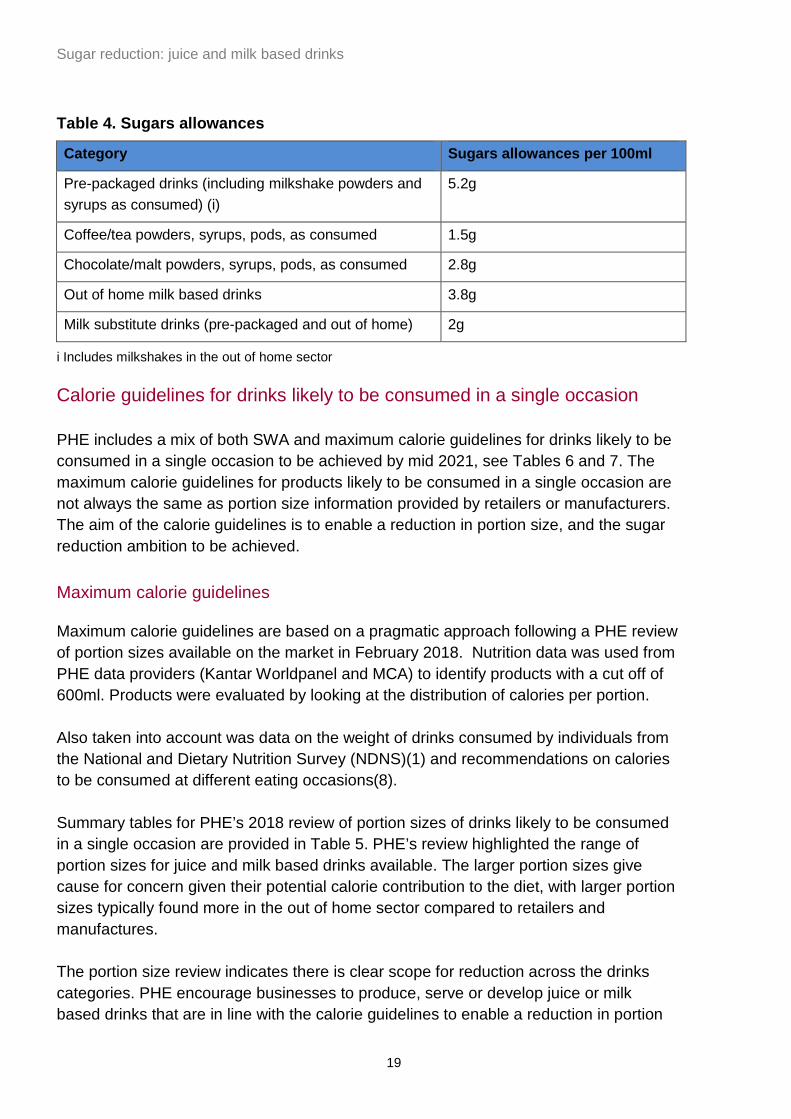
PHE includes a mix of both SWA and maximum calorie guidelines for drinks likely to be consumed in a single occasion to be achieved by mid 2021, see Tables 6 and 7. The maximum calorie guidelines for products likely to be consumed in a single occasion are not always the same as portion size information provided by retailers or manufacturers. The aim of the calorie guidelines is to enable a reduction in portion size, and the sugar reduction ambition to be achieved. Maximum calorie guidelines
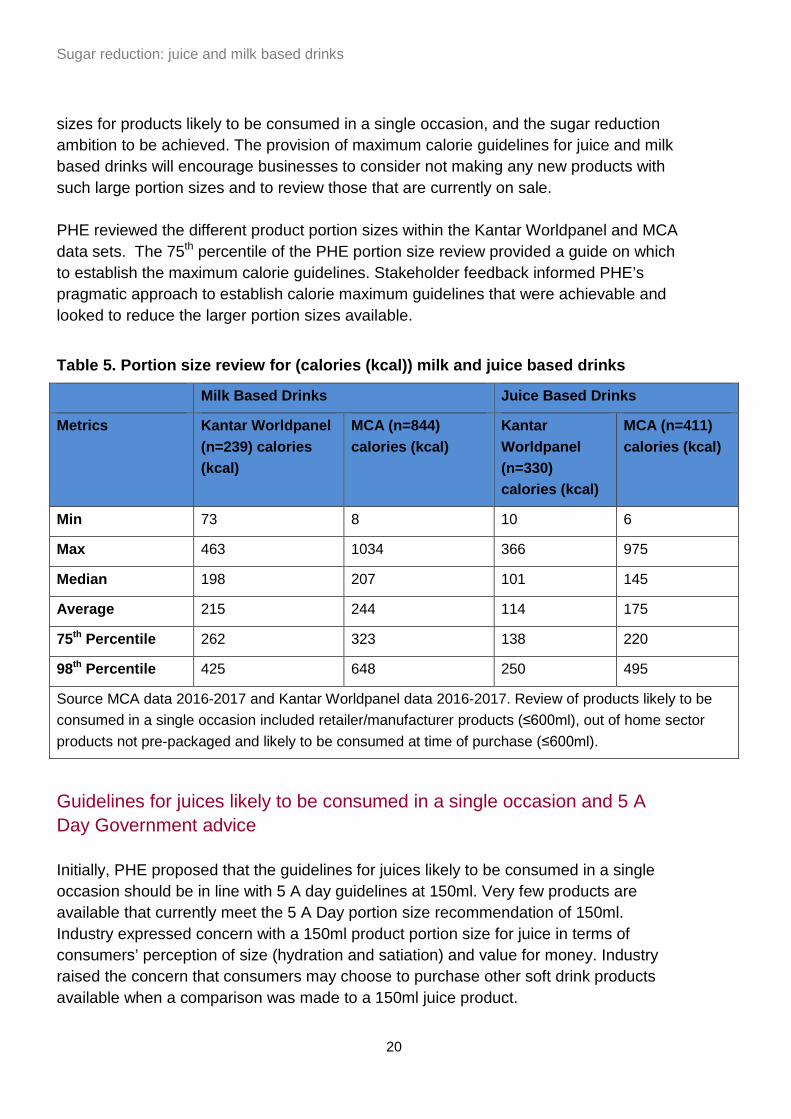
Maximum calorie guidelines are based on a pragmatic approach following a PHE review of portion sizes available on the market in February 2018. Nutrition data was used from PHE data providers (Kantar Worldpanel and MCA) to identify products with a cut off of 600ml. Products were evaluated by looking at the distribution of calories per portion. Also taken into account was data on the weight of drinks consumed by individuals from the National and Dietary Nutrition Survey (NDNS)(1) and recommendations on calories to be consumed at different eating occasions(8). Summary tables for PHE’s 2018 review of portion sizes of drinks likely to be consumed in a single occasion are provided in Table 5. PHE’s review highlighted the range of portion sizes for juice and milk based drinks available. The larger portion sizes give cause for concern given their potential calorie contribution to the diet, with larger portion sizes typically found more in the out of home sector compared to retailers and manufactures. The portion size review indicates there is clear scope for reduction across the drinks categories. PHE encourage businesses to produce, serve or develop juice or milk based drinks that are in line with the calorie guidelines to enable a reduction in portion
19
Sugar reduction: juice and milk based drinks
sizes for products likely to be consumed in a single occasion, and the sugar reduction ambition to be achieved. The provision of maximum calorie guidelines for juice and milk based drinks will encourage businesses to consider not making any new products with such large portion sizes and to review those that are currently on sale. PHE reviewed the different product portion sizes within the Kantar Worldpanel and MCA data sets. The 75th percentile of the PHE portion size review provided a guide on which to establish the maximum calorie guidelines. Stakeholder feedback informed PHE’s pragmatic approach to establish calorie maximum guidelines that were achievable and looked to reduce the larger portion sizes available.
Table 5. Portion size review for (calories (kcal)) milk and juice based drinks
Milk Based Drinks Juice Based Drinks
Metrics Kantar Worldpanel (n=239) calories (kcal)
MCA (n=844) calories (kcal)
Kantar Worldpanel (n=330) calories (kcal)
MCA (n=411) calories (kcal)
Min 73 8 10 6
Max 463 1034 366 975
Median 198 207 101 145
Average 215 244 114 175
75th Percentile 262 323 138 220
98th Percentile 425 648 250 495
Source MCA data 2016-2017 and Kantar Worldpanel data 2016-2017. Review of products likely to be consumed in a single occasion included retailer/manufacturer products (≤600ml), out of home sector products not pre-packaged and likely to be consumed at time of purchase (≤600ml).
Guidelines for juices likely to be consumed in a single occasion and 5 A Day Government advice
Initially, PHE proposed that the guidelines for juices likely to be consumed in a single occasion should be in line with 5 A day guidelines at 150ml. Very few products are available that currently meet the 5 A Day portion size recommendation of 150ml. Industry expressed concern with a 150ml product portion size for juice in terms of consumers’ perception of size (hydration and satiation) and value for money. Industry raised the concern that consumers may choose to purchase other soft drink products available when a comparison was made to a 150ml juice product.
20
Sugar reduction: juice and milk based drinks
PHE acknowledges industry consumer acceptance concerns but would encourage businesses to plan for a move towards a portion size of 150ml over time for products likely to be consumed in a single occasion, particularly for products aimed at children. Calorie guidelines presented in this technical report do not replace existing Government 5 A Day guidance for fruit or vegetable juice or smoothies. They are also not intended to be consumer facing healthy eating recommendations. Government advice that 150ml of unsweetened, 100% fruit or vegetable juice or smoothie counts as 1 of your 5 daily portions of fruit and vegetables remains unchanged, as is advice to limit the amount of juice or smoothie consumed to a combined total of 150ml a day (1 portion). Industry should continue using the recommended 150ml serving size as ‘1 of your 5 A Day’ to make a claim where they choose to do so.
Guidance on the use of intense and non-caloric sweeteners
PHE supports the European Food Safety Authority’s (EFSA) scientific opinion on low calorie/non-caloric sweeteners(9). Sweeteners that have been approved through EFSA’s processes are a safe and acceptable alternative to using sugar and it is up to businesses if and how they wish to use them. It is known that some of the food and drink industry use them as a means to lower the sugar content of their products while others do not, either due to legislative restrictions or issues relating to consumer acceptability. Businesses have stated that reformulation to reduce sugar sometimes leads to the need for sweeteners to help correct flavour profiles, but that not all consumers welcome their use. PHE appreciates the consumer acceptability issue from a consumer and a business perspective. There may be advantages in businesses gradually reducing the overall sweetness of their products by not matching the level of sweetness in products if replacing sugar with sweeteners as this allows for palates to gradually adjust.
21
Sugar reduction: juice and milk based drinks
Monitoring
Sugar reduction and calorie guidelines for products likely to be consumed in a single occasion
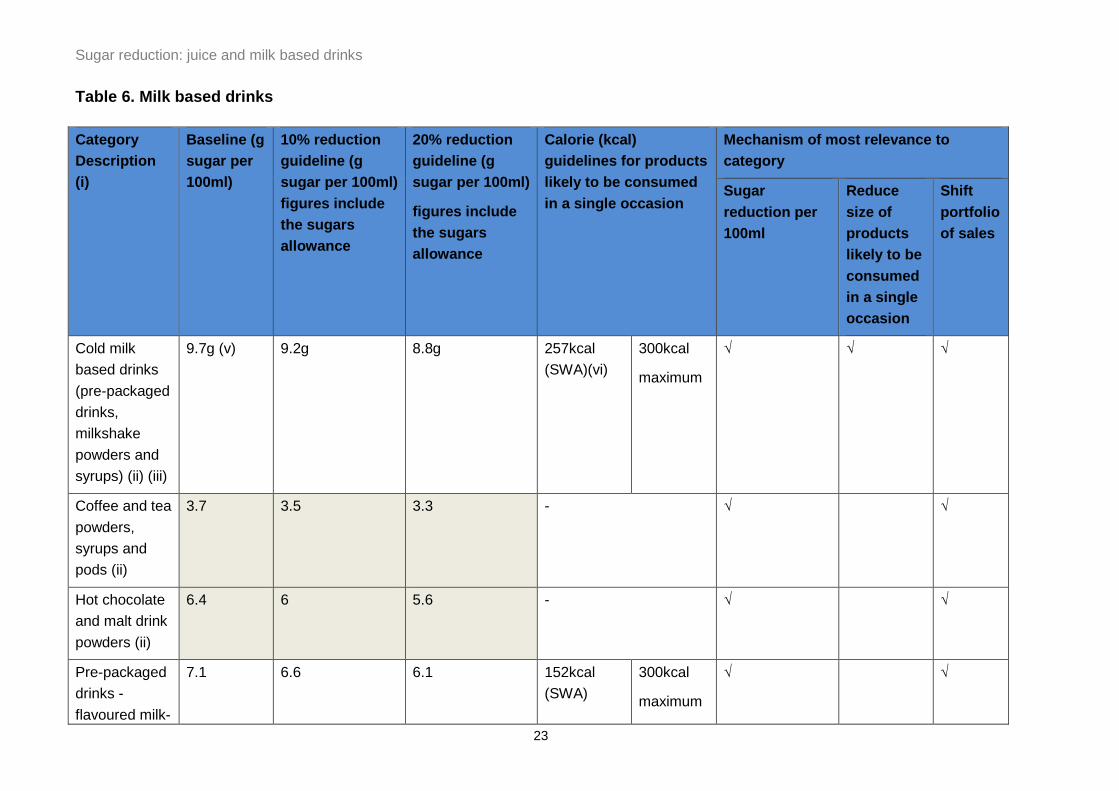
Tables 6 and 7 set out the sugar reduction guidelines and calorie guidelines for products likely to be consumed in a single occasion for each category. The tables include a brief category description and baseline SWA in grams of sugar per 100ml of product. Also presented is a SWA in grams of sugar per 100ml when the 5% for juice and the, 10% and 20% for milk based drink reductions have been achieved. Where volume data could not be calculated, simple average sugar content per 100ml and calorie guidelines are presented.
22
Sugar reduction: juice and milk based drinks
Table 6. Milk based drinks Category Description (i)
Baseline (g sugar per 100ml)
10% reduction guideline (g sugar per 100ml) figures include the sugars allowance
20% reduction guideline (g sugar per 100ml)
figures include the sugars allowance
Calorie (kcal) guidelines for products likely to be consumed in a single occasion
Mechanism of most relevance to category
Sugar reduction per 100ml
Reduce size of products likely to be consumed in a single occasion
Shift portfolio of sales
Cold milk based drinks (pre-packaged drinks, milkshake powders and syrups) (ii) (iii)
9.7g (v) 9.2g 8.8g 257kcal (SWA)(vi)
300kcal
maximum
√ √ √
Coffee and tea powders, syrups and pods (ii)
3.7 3.5 3.3 - √ √
Hot chocolate and malt drink powders (ii)
6.4 6 5.6 - √ √
Pre-packaged drinks - flavoured milk-
7.1 6.6 6.1 152kcal (SWA)
300kcal
maximum
√ √
23
Sugar reduction: juice and milk based drinks substitute drinks
Out of home hot milk based drinks (including coffee, tea, and hot chocolates) (iv) 6.2 6 5.7
268kcal (SWA)
300kcal
maximum
√ √ √
i. Table 3 provides clarity of products in scope
ii. Powders, syrups and pods made up to manufacturer’s instructions
iii. Includes out of home milkshake drinks
iv. Includes drinks in scope made with milk and milk substitute drinks
v. The baseline figure for cold milk based drinks (pre-packaged drinks, milkshake powders and syrups made up to manufacturer’s instructions) and out of home cold drinks is a weighted average between Kantar Woldpanel 9g/100ml and MCA 12.6g/100ml at 80:20. The weighting of the 2 figures combined provides a value of 9.7g/100ml.
vi. The figure excludes powders, syrups and pods
Figures highlighted in grey are based on Kantar Worldpanel data. Data highlighted in blue are based on MCA data. The Kantar Worldpanel data highlighted in grey are simple averages due to the limitations in the data.
24
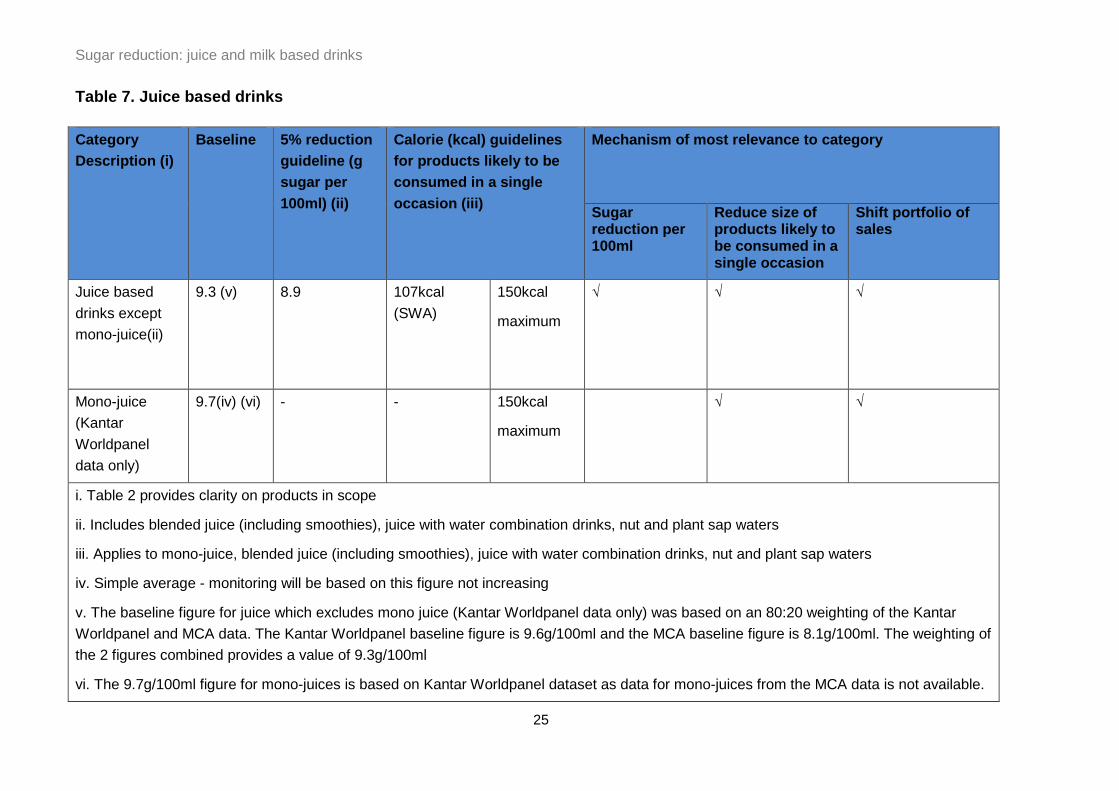
Sugar reduction: juice and milk based drinks Table 7. Juice based drinks Category Description (i)
Baseline 5% reduction guideline (g sugar per 100ml) (ii)
Calorie (kcal) guidelines for products likely to be consumed in a single occasion (iii)
Mechanism of most relevance to category
Sugar reduction per 100ml
Reduce size of products likely to be consumed in a single occasion
Shift portfolio of sales
Juice based drinks except mono-juice(ii)
9.3 (v) 8.9 107kcal (SWA)
150kcal
maximum
√ √ √
Mono-juice (Kantar Worldpanel data only)
9.7(iv) (vi) - - 150kcal
maximum
√ √
i. Table 2 provides clarity on products in scope
ii. Includes blended juice (including smoothies), juice with water combination drinks, nut and plant sap waters
iii. Applies to mono-juice, blended juice (including smoothies), juice with water combination drinks, nut and plant sap waters
iv. Simple average - monitoring will be based on this figure not increasing
v. The baseline figure for juice which excludes mono juice (Kantar Worldpanel data only) was based on an 80:20 weighting of the Kantar Worldpanel and MCA data. The Kantar Worldpanel baseline figure is 9.6g/100ml and the MCA baseline figure is 8.1g/100ml. The weighting of the 2 figures combined provides a value of 9.3g/100ml
vi. The 9.7g/100ml figure for mono-juices is based on Kantar Worldpanel dataset as data for mono-juices from the MCA data is not available.
25
Sugar reduction: juice and milk based drinks
Next steps
The publication of the technical report for juice and milk based drinks forms part of PHE’s sugar reduction programme of work. The report sets out the ambition for sugar reduction and calorie guidelines for products likely to be consumed in a single occasion. The guidelines apply equally to all sectors of the food industry and have been put in place to help industry achieve the ambitions set for juice and milk based drinks by mid 2021. Industry is encouraged to look at their drinks portfolios and focus sugar reduction on the bigger sellers and/or reduce their product portion size. This will drive a reduction in sugar intake as these products are consumed more regularly and contribute more sugar to the diet. Making these changes will contribute to the success of the sugar reduction programme. The report brings together an analysis of sugar levels in juice and milk based drinks across all drinks sectors. The estimated baseline levels of sugar and calories for 2017 are the first step in ensuring transparency of all parts of the programme. While further work is needed to fully scope all the data and metrics that will be included within the progress reports, these will be published annually from mid 2020 to mid 2022 and will include a repeat of, and comparison to, the baseline data for 2017. To help inform decisions on this and the additional data that these reports will include, PHE will engage with stakeholders in 2019. This will ensure that when the first progress report is published in mid 2020, it will reflect progress in a way that acknowledges success. It will also ensure that all partners and supporters of the programme will find the data useful. The timing of this reporting accounts for lags between the completion of reformulation cycles and products appearing on the market with lower sugar levels that are reflected in the nutrition information on pack. PHE will expect to see reductions in both the SWA levels of sugar across categories and the amount of high sugar products being sold, as well as portion sizes for products likely to be consumed by an individual at 1 time moving downwards. PHE recognise that some businesses made efforts to reduce sugar levels, or the number of calories in products likely be consumed in a single occasion, across product ranges before the baseline year. PHE will set out a process to enable businesses to provide this information in a uniform way in 2019. Significant reductions in sugar levels before the baseline year, that will have affected the SWA across categories by business will be reported in the 2020 progress report.
26
Sugar reduction: juice and milk based drinks
Acknowledgements
We would like to thank the businesses and trade associations across all sectors of the drinks industry, and a number of public health non-governmental organisations, for their constructive engagement and significant contributions to the development of the juice and milk based drinks sugar reduction guidelines.
27
Sugar reduction: juice and milk based drinks
Appendices
Appendix 1
Baseline analysis of sugar levels and calories for juice and milk based drinks.
Appendix 2
Summary of stakeholder engagement to inform the juice and milk based drinks guidelines.
Appendix 3 Summary of reporting timelines for juice and milk based drinks.
28
Sugar reduction: juice and milk based drinks
Appendix 1: Baseline analysis of sugar levels and calories for juice and milk based drinks
Estimated 2017 sugar content in juice and milk based drinks covered by PHE’s sugar reduction programme
Introduction
Analysis has been undertaken to estimate baseline levels of sugar for 2017 for the different drinks categories that are included in Public Health England’s (PHE) sugar reduction programme. The programme is working to reduce the levels of total sugar in products as this is what is declared on food labels. Information on total sugar will be used to set baselines and track progress. Further details and a definition of added sugar are included in the background section in the main report. This appendix sets out the baseline estimates in detail including the data sources, analytical methods, limitations to the data and analysis, and the analytical decisions made. Results are presented for drinks available in 2 settings: • retail and manufacturing sectors (retailer own label and manufacturer branded
products) for in home consumption • eating out of home sector (eg restaurants, takeaways, pubs and cafes)
An overall sales weighted average (SWA) for sugar in each product category has been calculated by combining the in home retailer/manufacturer SWA with the eating out of home SWA, applying an 80:20 weighting respectively. This weighting has been taken from the Years 5 and 6 NDNS analysis showing that, on average, 20% of meals over the survey study period were consumed out of home. The exact proportion varies depending on how the definition of eating out is applied. This weighting will be reviewed for future progress monitoring should new evidence suggest that the frequency of eating out has changed. Throughout this document, ‘sugar content’ refers to total sugar content per 100ml of product.
29
Sugar reduction: juice and milk based drinks
Summary of results
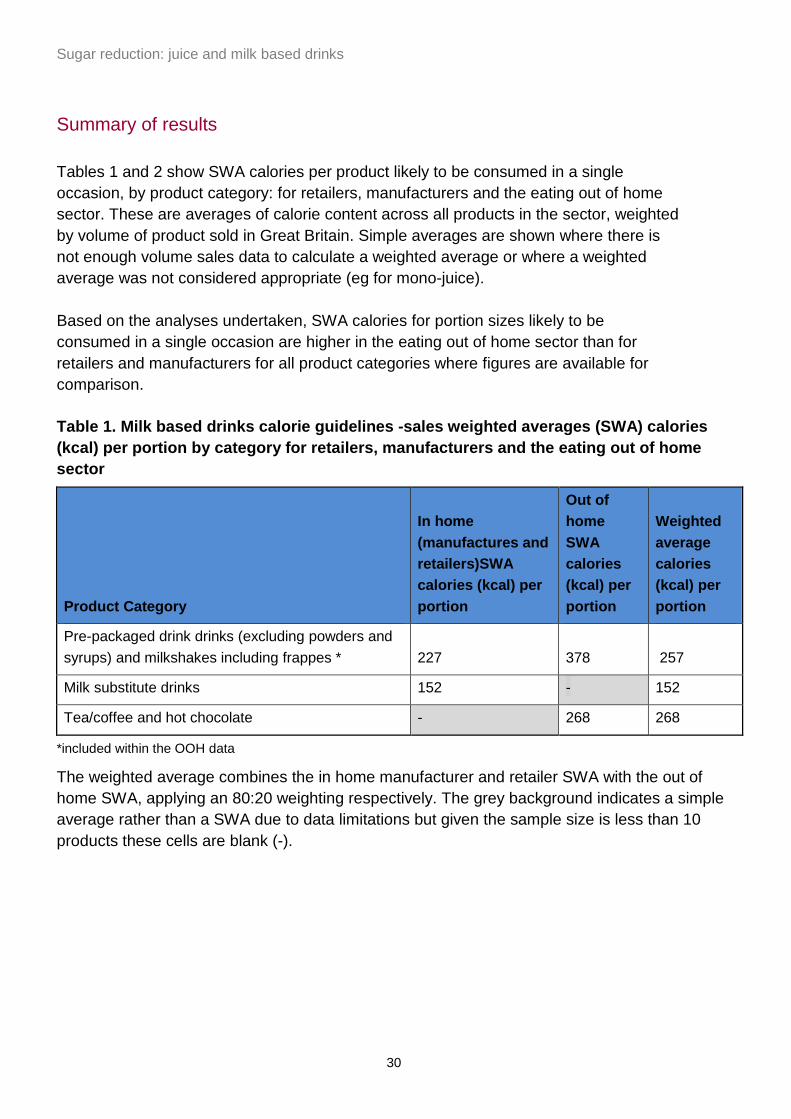
Tables 1 and 2 show SWA calories per product likely to be consumed in a single occasion, by product category: for retailers, manufacturers and the eating out of home sector. These are averages of calorie content across all products in the sector, weighted by volume of product sold in Great Britain. Simple averages are shown where there is not enough volume sales data to calculate a weighted average or where a weighted average was not considered appropriate (eg for mono-juice). Based on the analyses undertaken, SWA calories for portion sizes likely to be consumed in a single occasion are higher in the eating out of home sector than for retailers and manufacturers for all product categories where figures are available for comparison. Table 1. Milk based drinks calorie guidelines -sales weighted averages (SWA) calories (kcal) per portion by category for retailers, manufacturers and the eating out of home sector
Product Category
In home (manufactures and retailers)SWA calories (kcal) per portion
Out of home SWA calories (kcal) per portion
Weighted average calories (kcal) per portion
Pre-packaged drink drinks (excluding powders and syrups) and milkshakes including frappes * 227 378 257
Milk substitute drinks 152 - 152
Tea/coffee and hot chocolate - 268 268
*included within the OOH data
The weighted average combines the in home manufacturer and retailer SWA with the out of home SWA, applying an 80:20 weighting respectively. The grey background indicates a simple average rather than a SWA due to data limitations but given the sample size is less than 10 products these cells are blank (-).
30
Sugar reduction: juice and milk based drinks
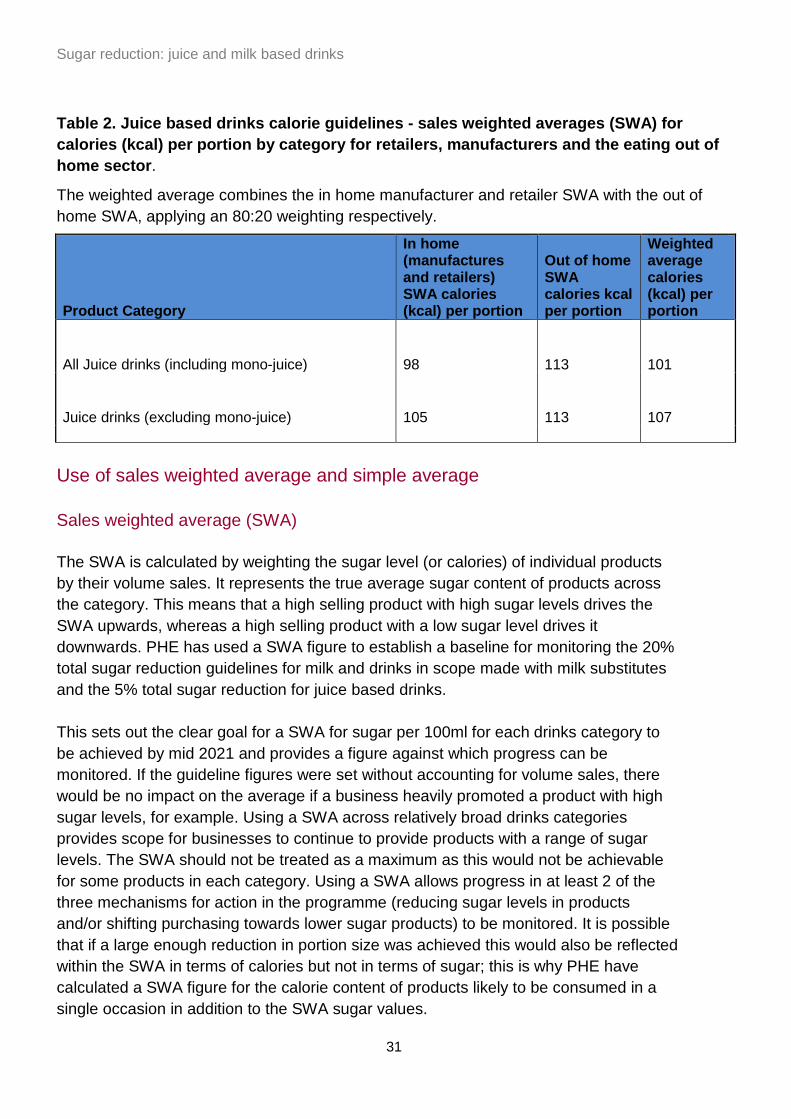
Table 2. Juice based drinks calorie guidelines - sales weighted averages (SWA) for calories (kcal) per portion by category for retailers, manufacturers and the eating out of home sector.
The weighted average combines the in home manufacturer and retailer SWA with the out of home SWA, applying an 80:20 weighting respectively.
Product Category
In home (manufactures and retailers) SWA calories (kcal) per portion
Out of home SWA calories kcal per portion
Weighted average calories (kcal) per portion
All Juice drinks (including mono-juice) 98 113 101
Juice drinks (excluding mono-juice) 105 113 107
Use of sales weighted average and simple average
Sales weighted average (SWA) The SWA is calculated by weighting the sugar level (or calories) of individual products by their volume sales. It represents the true average sugar content of products across the category. This means that a high selling product with high sugar levels drives the SWA upwards, whereas a high selling product with a low sugar level drives it downwards. PHE has used a SWA figure to establish a baseline for monitoring the 20% total sugar reduction guidelines for milk and drinks in scope made with milk substitutes and the 5% total sugar reduction for juice based drinks. This sets out the clear goal for a SWA for sugar per 100ml for each drinks category to be achieved by mid 2021 and provides a figure against which progress can be monitored. If the guideline figures were set without accounting for volume sales, there would be no impact on the average if a business heavily promoted a product with high sugar levels, for example. Using a SWA across relatively broad drinks categories provides scope for businesses to continue to provide products with a range of sugar levels. The SWA should not be treated as a maximum as this would not be achievable for some products in each category. Using a SWA allows progress in at least 2 of the three mechanisms for action in the programme (reducing sugar levels in products and/or shifting purchasing towards lower sugar products) to be monitored. It is possible that if a large enough reduction in portion size was achieved this would also be reflected within the SWA in terms of calories but not in terms of sugar; this is why PHE have calculated a SWA figure for the calorie content of products likely to be consumed in a single occasion in addition to the SWA sugar values.
31
Sugar reduction: juice and milk based drinks
Progress in biggest selling products where the sugar levels are particularly high will be key to seeing a reduction in the SWA for the category and this is where businesses should, therefore, concentrate their efforts. This focus could be determined by using the SWA figure for total sugar for each relevant category to identify the products to concentrate on (that is, products that are above this level). PHE will focus efforts on businesses whose products are among the top selling and have sugar levels above the SWA and/or provide more calories than the maximum set for the category in products likely to be consumed in a single occasion. Simple average
For some sub-categories of juice based drinks and milk based drinks a simple average has been calculated rather than a SWA. A simple average is the average of all the products in the category without any weighting for volume sales. This is the case for mono-juice and milk based powders, syrups and pods. Mono-juice
PHE appreciates the challenge to reduce sugar levels in juices, particularly for 100% mono-juice. The ambition for mono-juice is a simple average of 9.7g sugar per 100ml and monitoring will be based on this figure not increasing. The options of reducing the size of products to be consumed in a single occasion and shifting consumer preference to lower sugar products remain for these juices. To note that given the limitations of the MCA dataset, mono-juices have been excluded only from the Kantar Worldpanel dataset. Milk based powders, syrups and pods
Milk based powders, syrups and pods includes hot chocolates, malted milks, milk shakes, coffee’s and tea’s sold in any of these formats. The datasets that PHE are using for the baseline analysis do not consistently provide data for powders, syrups and pods ‘as consumed’ or ‘as sold’ (dry). PHE have presented powders, syrups and pods data ‘as consumed’, made up to manufacturer’s instructions to allow comparison across the other milk based drinks. The nutrition information for the ‘as consumed data’, made up to manufacturer’s instructions was gathered by looking at both manufactures and retailers websites. The nutrition information was either directly taken from nutrition tables as consumed or calculated using the nutrition information as recommended by the manufacture or retailers. The nutritional information ‘as consumed’ is inconsistent with the volume information presented in the Kantar Worldpanel dataset as this is based on dry weight. As a result,
32
Sugar reduction: juice and milk based drinks
PHE has taken the pragmatic decision to use a simple average for sugar for the powders, syrups and pods. There are limitations in this approach as the key metric for monitoring progress will not take differing volume sales into account. It also means that PHE are unable to combine data for powers, syrups and pods with other milk based drinks. However, without consistent volume data for all products it is not possible to produce meaningful SWA sugar levels. MCA data contained dry powder nutrition information for some of the hot chocolate and malt powders. Given that PHE were unable to present this data ‘as consumed’, these products have been removed from the analysis as their inclusion would have resulted in an inaccurate nutrition value per 100ml as consumed. Sugar allowance calculations
A sugar allowance has been made for sugars present in milk based and milk substitute drinks. The SWA total sugar guideline is based on a 10% and 20% reduction of the added sugar content rather than a 10% and 20% reduction of the total sugar content. The recommended allowances are presented in the main report. Box 1 outlines details of the calculations used to obtain the SWA guideline for total sugar content (g/100ml) in milk based drinks.
Box 1. Example calculation for pre-packaged drinks including milkshake powders and syrups:
1) For the guideline reduction to be based on added sugar, 5.2.g lactose is removed from the 9.7g of total sugar per 100ml, which gives 4.5g/100mlg. (9.7g – 5.2g = 4.5g/100ml). This is the baseline from which to reduce sugar by 20%.
2) To obtain the guideline for added sugar, this figure is reduced by 20% to give 3.6g/100ml: 4.5g x 80% = 3.6g/100ml. This is the guideline for added sugar.
3) To obtain a figure with the added sugar reduced and the milk sugars present and not reduced, the 5.2g/100ml lactose is added back in to give 8.8g/100ml.
33
Sugar reduction: juice and milk based drinks
Data sources
PHE has used a variety of data sources to provide the 2017 baseline and to inform its decisions regarding the sugar reduction programme for drinks. These include commercial consumer panel data from Kantar Worldpanel, MCA data, and nutrition information obtained from individual businesses or websites. Retailers and manufacturers
Estimates of sugar content by drink category for retailers and manufacturers use data from Kantar Worldpanel’s take home consumer panel. Kantar Worldpanel is a global market research business which runs a continuously reporting panel of 30,000 households across Great Britain, who record details of all take home food and drink purchases, including volumes bought. Kantar Worldpanel’s sample of households reflects the demographic makeup of the British population. Demographic targets for the sample are based on region, social class, age of main shopper, household composition and household size. The data collected are weighted to provide a representative picture of total food and drink purchasing in Great Britain over the time period for which data are provided. The 2017 dataset used for setting baseline levels for sugar reduction in juice and milk based drinks covers the 52 weeks ending 10 September 2017, and includes total volume sales in kilograms/litres/servings and nutrition data for individual food products per 100g/100ml/serving as well as details of pack size, number of products included in multipacks etc. Kantar Worldpanel aims to collect all nutrition data from food and drink labels on individual products via the use of fieldworkers who visit key retail stores and capture the information provided on packaging on a rolling 6 monthly basis. Some nutrition information is also collected from third party Brandbankb. Where Kantar Worldpanel is able to do this, usually for the majority of products in a category, this is termed real (real and found) data. Where this is not possible, nutrition values are either copied across from similar products (known as cloned) or an average value for the category or product type is calculated and used instead, designated as imputed data. For the analyses presented in this report, only real data have been used.
b Brandbank collects and supplies pictures of various product data, including nutritional information (https://www.brandbank.com/)
34
Sugar reduction: juice and milk based drinks
Eating out of home sector (MCA data)
Unlike the retail and manufacturing sectors, there is no 1 data source that provides both sales and nutrition data for the eating out of home sector. There is currently no legal obligation to provide nutrition information for foods and drinks consumed out of home although some businesses do provide this on their websites, leaflets or menus.
Sales data for foods eaten out of home
MCA’s Eating Out Panel is a monthly tracker of consumer behaviour in relation to eating and drinking out of home. Respondents are recruited from a panel of over 600,000 UK consumers and 72,000 in-depth online interviews are conducted each year (6,000 per month). The panel is representative of the adult population in the UK in terms of age, gender and region. It’s a continuous tracker with interviewing every day of the year but not a continuous set of the same panel members. The Eating Out Panel provides the frequency of eating and drinking out generally and at different times of the day (breakfast, lunch, dinner and snacking) and full detail of the most recent eating and drinking out occasions: • most recent breakfast, lunch and dinner visits within the last 2 weeks and snack visit
on the previous day • details requested include: channel and brand of purchase, reason for eating out,
what was eaten and how much money was spent In addition to providing data from their existing Eating Out panel, MCA also conducted 2 bespoke data collections:
• a nationally representative survey of 5,000 UK parents to gather information about children’s eating out and
• a survey of 2,000 adults to collect information about drinking out occasions where food is not consumed
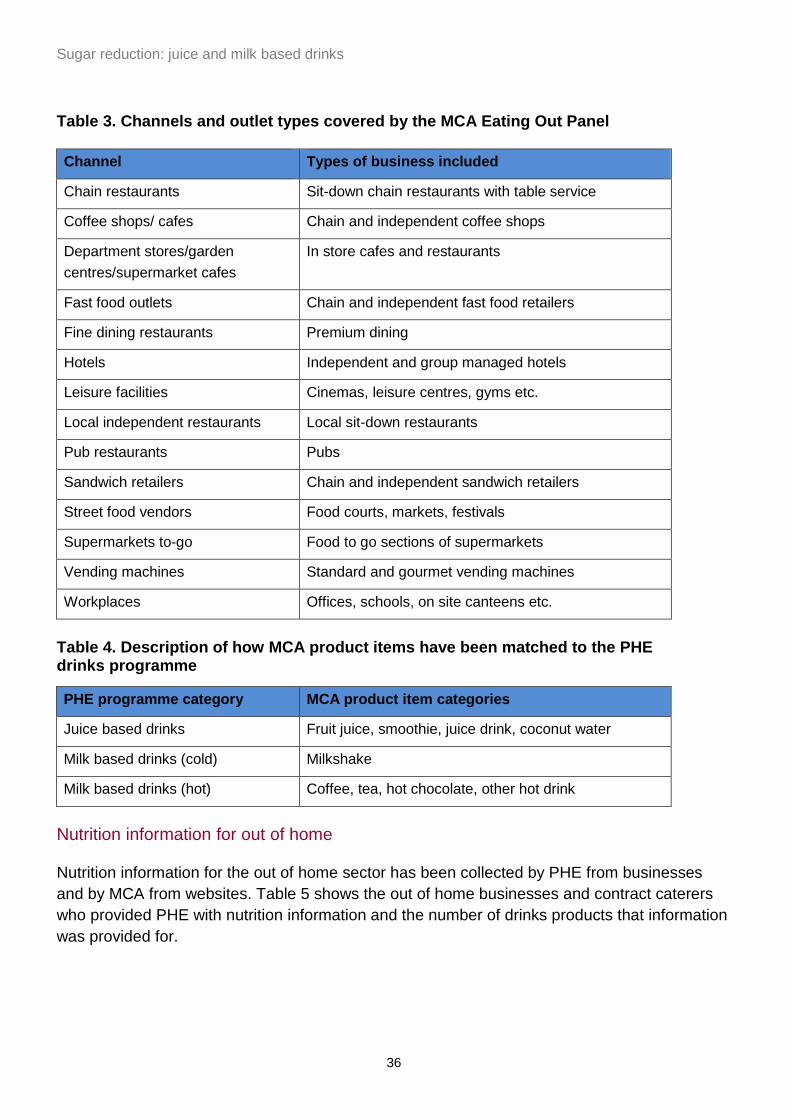
Table 3 shows the channels covered by the MCA Eating Out Panel and Table 4 shows how the product items collected via the panel have been mapped to the PHE drinks categories. Note that for cold milk based drinks only milkshakes are included and that mono-juice cannot be separately identified in the juice based drinks category.
35
Sugar reduction: juice and milk based drinks
Table 3. Channels and outlet types covered by the MCA Eating Out Panel Channel Types of business included
Chain restaurants Sit-down chain restaurants with table service
Coffee shops/ cafes Chain and independent coffee shops
Department stores/garden centres/supermarket cafes
In store cafes and restaurants
Fast food outlets Chain and independent fast food retailers
Fine dining restaurants Premium dining
Hotels Independent and group managed hotels
Leisure facilities Cinemas, leisure centres, gyms etc.
Local independent restaurants Local sit-down restaurants
Pub restaurants Pubs
Sandwich retailers Chain and independent sandwich retailers
Street food vendors Food courts, markets, festivals
Supermarkets to-go Food to go sections of supermarkets
Vending machines Standard and gourmet vending machines
Workplaces Offices, schools, on site canteens etc.
Table 4. Description of how MCA product items have been matched to the PHE drinks programme
Nutrition information for out of home
Nutrition information for the out of home sector has been collected by PHE from businesses and by MCA from websites. Table 5 shows the out of home businesses and contract caterers who provided PHE with nutrition information and the number of drinks products that information was provided for.
PHE programme category MCA product item categories
Juice based drinks Fruit juice, smoothie, juice drink, coconut water
Milk based drinks (cold) Milkshake
Milk based drinks (hot) Coffee, tea, hot chocolate, other hot drink
36
Sugar reduction: juice and milk based drinks
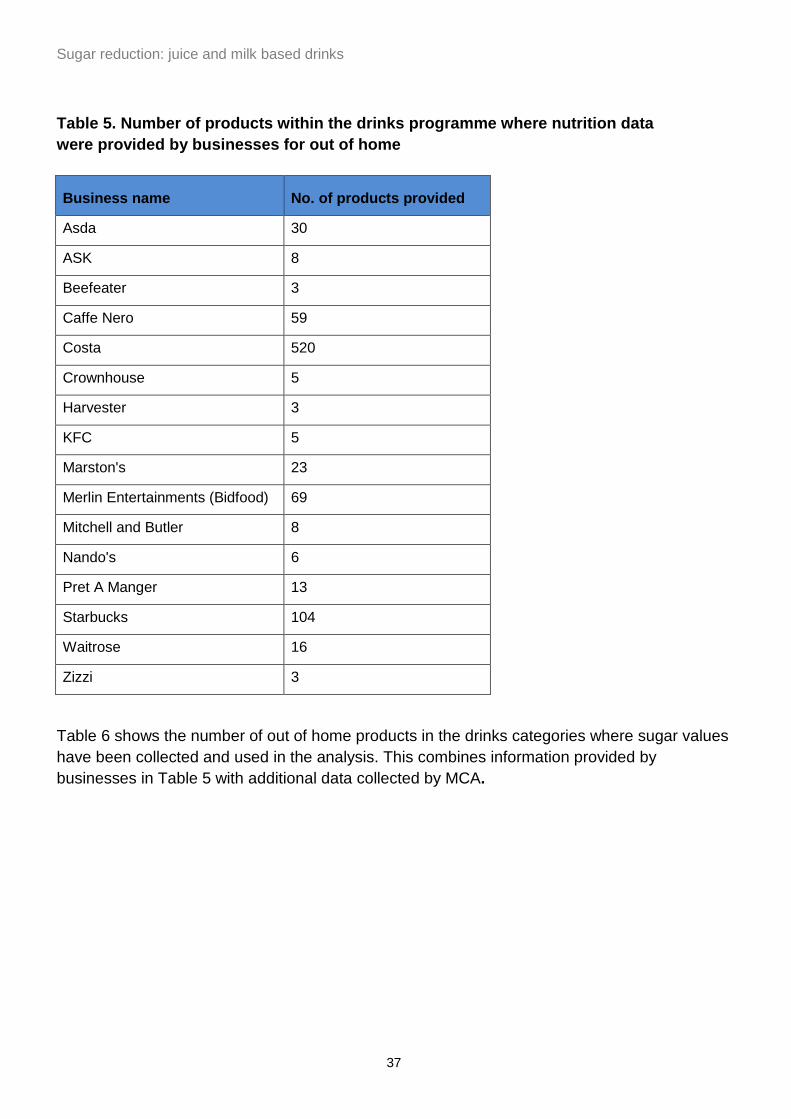
Table 5. Number of products within the drinks programme where nutrition data were provided by businesses for out of home
Business name No. of products provided
Asda 30
ASK 8
Beefeater 3
Caffe Nero 59
Costa 520
Crownhouse 5
Harvester 3
KFC 5
Marston's 23
Merlin Entertainments (Bidfood) 69
Mitchell and Butler 8
Nando's 6
Pret A Manger 13
Starbucks 104
Waitrose 16
Zizzi 3
Table 6 shows the number of out of home products in the drinks categories where sugar values have been collected and used in the analysis. This combines information provided by businesses in Table 5 with additional data collected by MCA.
37
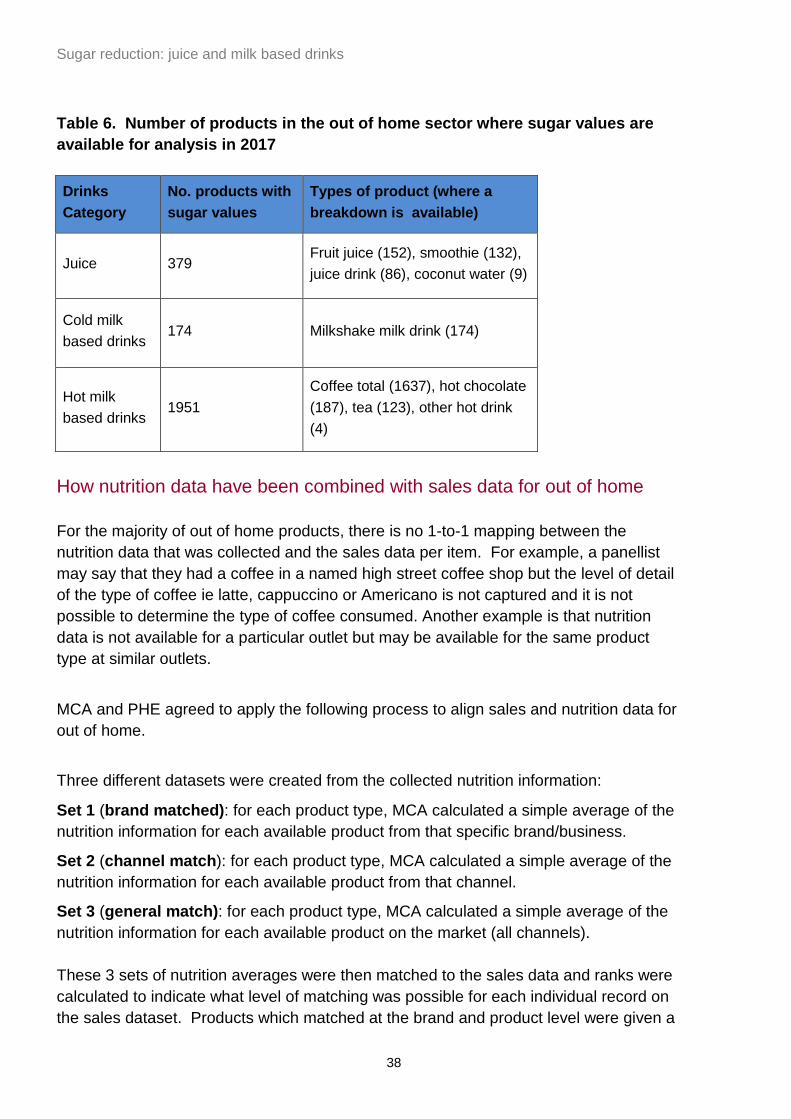
Sugar reduction: juice and milk based drinks
Table 6. Number of products in the out of home sector where sugar values are available for analysis in 2017 Drinks Category
No. products with sugar values
Types of product (where a breakdown is available)
Juice 379 Fruit juice (152), smoothie (132), juice drink (86), coconut water (9)
Cold milk based drinks
174 Milkshake milk drink (174)
Hot milk based drinks
1951 Coffee total (1637), hot chocolate (187), tea (123), other hot drink (4)
How nutrition data have been combined with sales data for out of home
For the majority of out of home products, there is no 1-to-1 mapping between the nutrition data that was collected and the sales data per item. For example, a panellist may say that they had a coffee in a named high street coffee shop but the level of detail of the type of coffee ie latte, cappuccino or Americano is not captured and it is not possible to determine the type of coffee consumed. Another example is that nutrition data is not available for a particular outlet but may be available for the same product type at similar outlets.
MCA and PHE agreed to apply the following process to align sales and nutrition data for out of home.
Three different datasets were created from the collected nutrition information:
Set 1 (brand matched): for each product type, MCA calculated a simple average of the nutrition information for each available product from that specific brand/business.
Set 2 (channel match): for each product type, MCA calculated a simple average of the nutrition information for each available product from that channel.
Set 3 (general match): for each product type, MCA calculated a simple average of the nutrition information for each available product on the market (all channels). These 3 sets of nutrition averages were then matched to the sales data and ranks were calculated to indicate what level of matching was possible for each individual record on the sales dataset. Products which matched at the brand and product level were given a
38

Sugar reduction: juice and milk based drinks
rank of 1, products which matched at the channel but not brand level were given rank 2 and products which only matched at the whole market level were given a rank of 3. PHE took the decision to only use sales data with a match at brand or channel level in the analysis presented. For products which have matched at the channel but not brand level, there is an underlying assumption that the nutrition content of that product is the same as the average for other similar products in the same channel (eg hot chocolates in coffee shops). This approach has limitations when considering any SWA calculations. For in-home, sales and nutrition data are available for each individual product and hence the SWA is a true reflection of the average sugar content of products sold across the category. For out of home, the SWA is necessarily an approximation of the true average because volume sales are not available at a product or granular level and nutrition information is not available for every outlet or product. This is potentially a more significant issue for drinks than food categories since the sales data is only available at a very high level eg all coffee. As a result, it will be more difficult to measure change. For example, as things stand, it will not be possible to reflect shifts towards lower sugar coffees within any particular outlet. Data limitations
Retailer and manufacturer data
Kantar Worldpanel’s fieldworkers go into stores to collect nutrition information on a rolling 6 month basis but this does not update all products in the dataset each time. This means that some reformulation changes may not be picked up and reported on in the year that they occur. Eating out of home data
The eating out of home data does not include sales data for individual products at the same level of detail as the Kantar Worldpanel data, meaning SWAs for sugar and calories cannot be calculated in the same way. Furthermore, nutrition data are not available for all products and all businesses. As a result, the SWA calculations for out of home rely on a number of assumptions. In particular, there is an assumption that the available nutrition data is representative of similar products across the same sales channel. There’s also an assumption that average nutrition composition for a product type is representative of all the products in that group for example that the average sugar content of a coffee in a particular outlet is a reasonable estimate of the sugar content of any particular coffee in that outlet.
39
Sugar reduction: juice and milk based drinks
Reformulation changes may be harder to detect and monitor in the eating out of home sector given the current lack of granular sales data and the use of average sugar, calorie and portion weight values. There is also the risk that businesses that have provided PHE with nutrition data to inform the 2017 analyses may not necessarily supply the same data each year to inform annual progress reporting. This could skew the average values used for SWA estimates and impact on the comparability of results. However, many businesses have a commitment to transparency and making nutrition information available to customers through websites etc., which will allow average changes in sugar content over time to be detected. Discussions will continue with the sector on how to improve the quality of the data used for progress monitoring. Should more data become available in future it is possible that the baseline analyses will be revisited and reviewed. The impact of the out of home data limitations can be seen in the following areas. Coffees and teas
For the out of home data it is not possible to say what type of coffee or tea a panellist has consumed as the survey of the data collected is limited to ‘coffee’ or ‘tea’. It is therefore unclear whether the panellist had a plain coffee, eg a plain latte, or a seasonal coffee with additions. The data is also unable to detect if the beverage was made with a milk substitute. This level of detail is not ideal and unfortunately these limitations did not come to light until stakeholder engagement for juice and milk based drinks had concluded. Reformulation of milk based drinks to reduce their sugar content will be captured in the SWA as will any shift in consumption between outlets or between product items as measured by MCA eg shifts from coffee to tea. However, sales shifts within a product item eg between types of coffees, without any reformulation, will not be picked up through the currently available data. PHE will engage with stakeholders in 2019 with regards to the data and metrics which will be included in the progress report. Juice based drinks
For the out of home data it is also not possible to say whether a panellist has consumed a mono-juice or other type of juice and consequently PHE have not been able to separate mono-juice out from this dataset as has been possible for the in home data. Individual types of smoothie cannot be separately identified in the dataset. Consequently all smoothies, including those where the dairy component is the majority, have been captured under juice based smoothies.
40
Sugar reduction: juice and milk based drinks
Quality assurance
The data sources and methodology used in this report have been presented to external stakeholders (including retailers, manufacturers, eating out of home businesses, trade bodies and non-governmental organisations). Feedback was requested from attendees and the responses received were used to check that PHE’s proposals, the category definitions, analytical methods and data sources used were appropriate. The commercial datasets used from Kantar Worldpanel and MCA have quality control measures built into their production process. In addition, PHE has carried out its own quality control checks of all data used and all analyses. Reporting timeframes
Detailed progress reports will be published annually starting in mid 2020 until mid 2022. Progress reports will be based on data from the preceding year, eg August 2018 – September 2019 will inform the mid 2020 progress report. Progress on the interim ambition of 10% sugar reduction in milk based drinks will be taken into account when HM Treasury reviews the continuation of the exemption from the SDIL for milk based drinks in 2020. A summary of reporting timelines is included in Appendix 3.
41
Sugar reduction: juice and milk based drinks
Appendix 2: Summary of stakeholder engagement to inform the juice and milk-based drinks guidelines
Extensive engagement to inform the development of the juice and milk based drinks guidelines took place between July 2017 and February 2018. Manufacturers, retailers, and businesses representing the eating out-of-home sector were identified on the basis of significant market share and presence within the juice and milk based drinks categories relevant to the programme. This included some businesses that have, to date, not been actively engaged with the reformulation programme. Additional stakeholders attended including non-governmental organisations (NGO’s) and in an observer capacity other government departments and the devolved administrations. Engagement took place through a series of category specific meetings held in July and November 2017, and February 2018, and were supplemented by on request 1:1 meetings. All stakeholders were offered the opportunity to write with feedback to Public Health England (PHE). Through the early meetings, stakeholders were briefed on PHE’s initial thinking on the approach and scope of the programme. To inform PHE’s view on what might be achievable, stakeholders were invited to provide information around technical and other relevant issues associated with sugar reduction activity on these products, including any activity to date. As PHE’s thinking and understanding developed, stakeholder meetings focused on PHE’s draft proposals for reduction and reformulation for the categories and the rationale supporting them. Draft proposals included confirmation of product categories as well as sharing draft baseline analysis. The meetings provided opportunity for individual views from industry and other key stakeholders to be raised. A full list of those met with, and details on those who provided written feedback are included in Table 1. The main areas discussed and key concerns raised are set out below. These are in addition to those published in the sugar reduction and wider reformulation programme: interim review 2017.
42
Sugar reduction: juice and milk based drinks
Baseline and progress reporting
Businesses which had made significant progress in reformulation were concerned that this activity may not be reflected in the 2017 baseline year used for the programme. PHE is committed to working with businesses to support their achievements using a narrative approach consistent with the sugar reduction programme. Businesses expressed concern that the timelines initially proposed for reformulation were too tight given portion size changes can take up to 2 years to launch due to for example, machinery changes. It was raised that the eating out of home sector might be able to make portion size changes more quickly as they may not be as affected by such operational issues. Detailed progress reports will be published annually from mid 2020 until mid 2022 and will include a repeat of, and comparison to, the baseline data for 2017. To help inform decisions on this and the additional data that these reports will include, PHE will engage with stakeholders in 2019. The timing of this reporting accounts for lags between the completion of reformulation cycles and products appearing on the market with lower sugar levels that are reflected in the nutrition information on pack.
Juice based drinks technical concerns
PHE understands that the potential for reducing sugar levels in fruit and vegetable juices is either impossible or extremely limited due to the nature of the product, associated technical issues with production and manufacture, and the need to meet compositional legislative requirements. These considerations have been reflected in the ambition for juices. Calorie guidelines for products likely to be consumed in a single occasion
PHE’s portion size review highlighted the range of sizes for products likely to be consumed in a single occasion for juice and milk based drinks. The larger portion sizes give cause for concern given their potential sugar and calorie contribution to the diet. Some businesses reported that changes in types of products or product portion sizes would require changes to manufacturing processes which would take time to implement and may impact on resource. Juice based drinks guidelines
PHE’s early discussions of guidelines for juices likely to be consumed in a single occasion considered aligning with 5 A Day advice. PHE has since acknowledged issues raised by industry on consumer acceptance of a 150ml product size and reluctance of industry to reduce
43
Sugar reduction: juice and milk based drinks
product size to 150ml unless this is replicated across the market. With this in mind PHE encourages business to produce, serve or develop juice based drinks that are in line with the PHE calorie guidelines. NGO feedback reiterated the importance of maintaining a movement towards an increased number of products at 150ml being available.
Milk based drinks guidelines
Industry expressed concern about the maximum calorie guideline for milk based drinks likely to be consumed in a single occasion set out by PHE at the February 2018 category specific meetings. Maximum calorie guidelines are based on a pragmatic approach following a PHE review of product portion sizes available on the market in February 2018. The portion size review indicates there is clear scope for reduction across the category particularly for the larger portion sizes on the market. Milk substitute drinks
The inclusion of milk substitute drinks (eg soya, almond, oat, hemp, hazelnut or rice) within the milk based drinks categories in the programme has raised concern from businesses. Drinks in scope that are made using a milk substitute will be treated in the same way as products which are based on, or contain cow’s milk. For example in the out of home sector this would include a soya latte, or oat cappuccino. This is consistent with the PHE sugar reduction programme. PHE have made an allowance for a proportion of the sugars in milk substitute drinks to allow for a basic level of sweetening and to ensure consistency across categories, following stakeholder feedback.
44
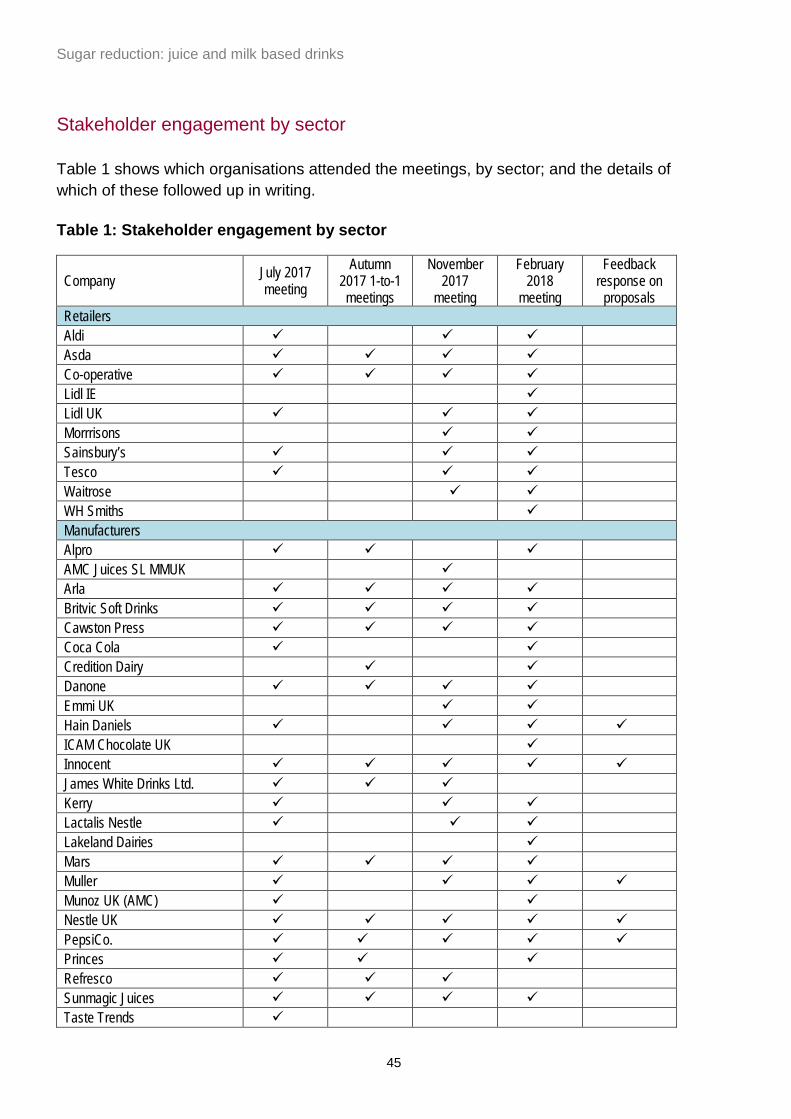
Sugar reduction: juice and milk based drinks
Stakeholder engagement by sector
Table 1 shows which organisations attended the meetings, by sector; and the details of which of these followed up in writing. Table 1: Stakeholder engagement by sector
Company July 2017 meeting
Autumn 2017 1-to-1 meetings
November 2017
meeting
February 2018
meeting
Feedback response on
proposals Retailers Aldi Asda Co-operative Lidl IE Lidl UK Morrrisons Sainsbury’s Tesco Waitrose WH Smiths Manufacturers Alpro AMC Juices SL MMUK Arla Britvic Soft Drinks Cawston Press Coca Cola Credition Dairy Danone Emmi UK Hain Daniels ICAM Chocolate UK Innocent James White Drinks Ltd. Kerry Lactalis Nestle Lakeland Dairies Mars Muller Munoz UK (AMC) Nestle UK PepsiCo. Princes Refresco Sunmagic Juices Taste Trends
45
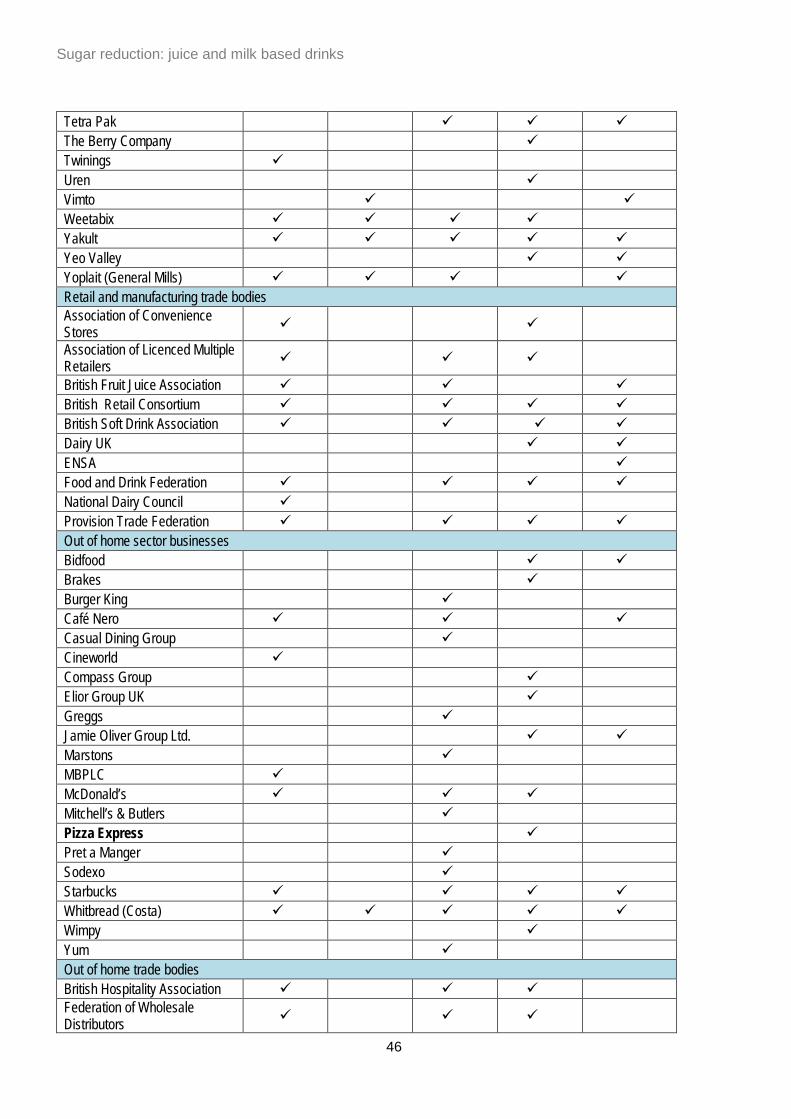
Sugar reduction: juice and milk based drinks
Tetra Pak The Berry Company Twinings Uren Vimto Weetabix Yakult Yeo Valley Yoplait (General Mills) Retail and manufacturing trade bodies Association of Convenience Stores
Association of Licenced Multiple Retailers
British Fruit Juice Association British Retail Consortium British Soft Drink Association Dairy UK ENSA Food and Drink Federation National Dairy Council Provision Trade Federation Out of home sector businesses Bidfood Brakes Burger King Café Nero Casual Dining Group Cineworld Compass Group Elior Group UK Greggs Jamie Oliver Group Ltd. Marstons MBPLC McDonald’s Mitchell’s & Butlers Pizza Express Pret a Manger Sodexo Starbucks Whitbread (Costa) Wimpy Yum Out of home trade bodies British Hospitality Association Federation of Wholesale Distributors
46
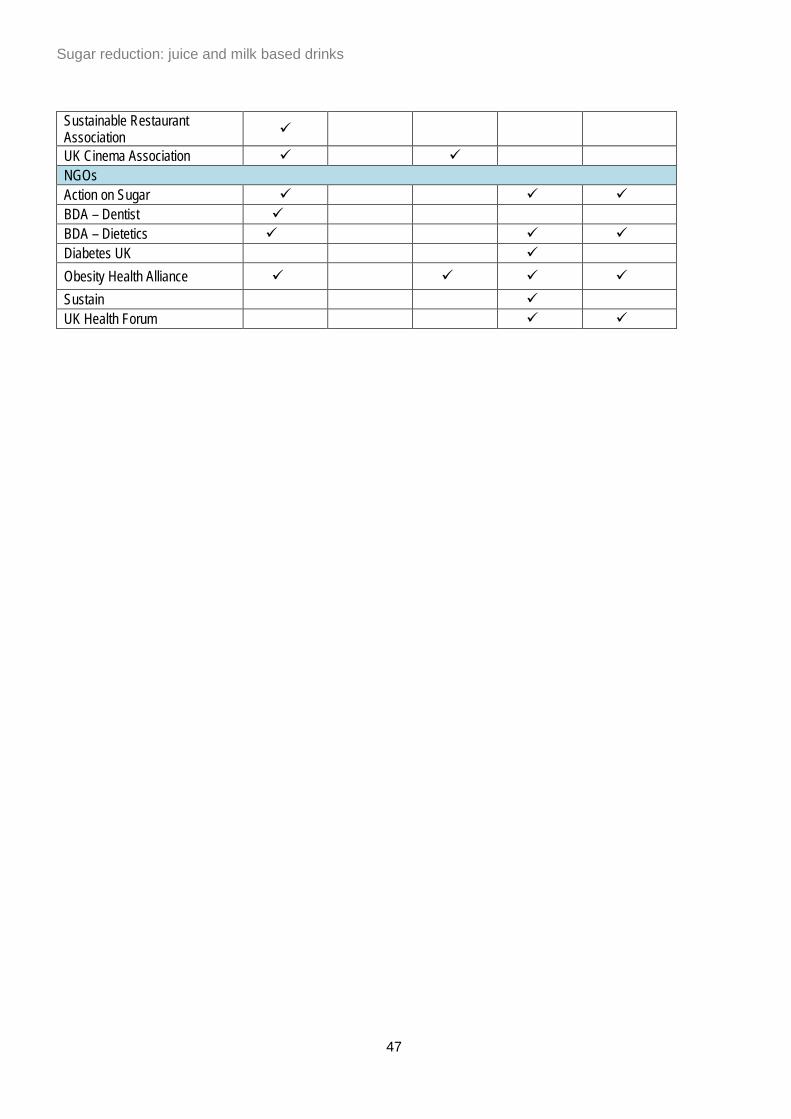
Sugar reduction: juice and milk based drinks
Sustainable Restaurant Association
UK Cinema Association NGOs Action on Sugar BDA – Dentist BDA – Dietetics Diabetes UK Obesity Health Alliance
Sustain UK Health Forum
47
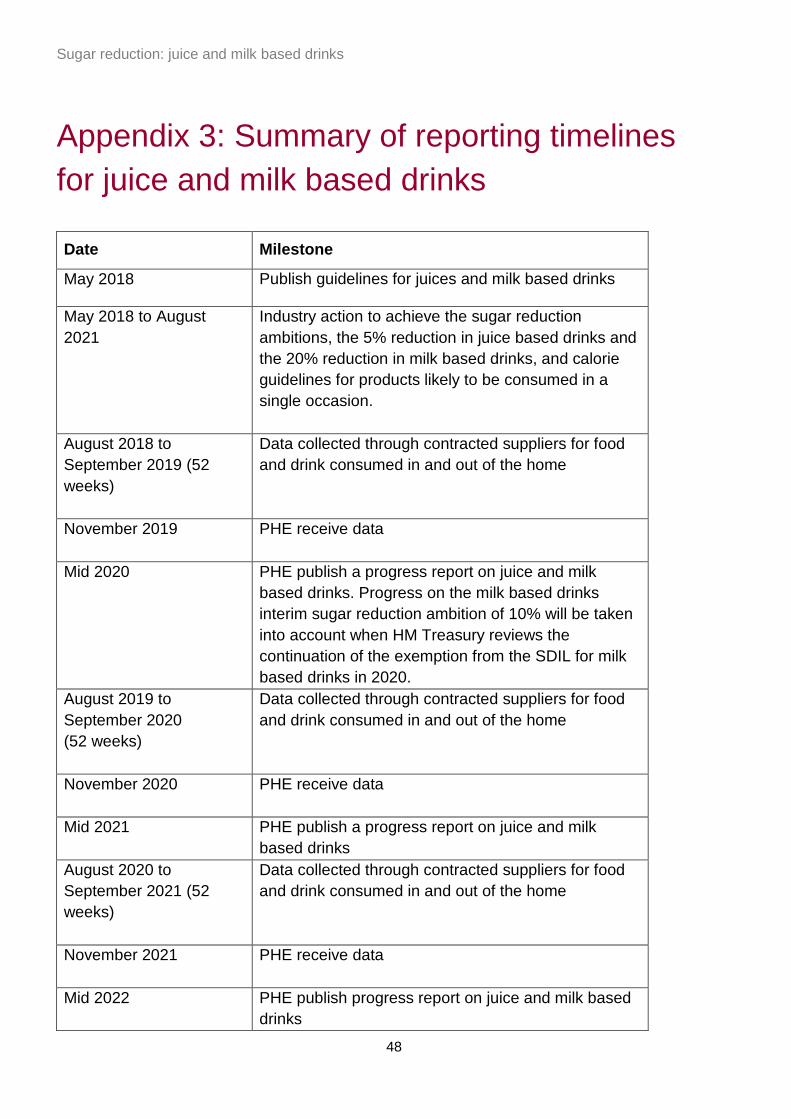
Sugar reduction: juice and milk based drinks
Appendix 3: Summary of reporting timelines for juice and milk based drinks
Date Milestone
May 2018 Publish guidelines for juices and milk based drinks
May 2018 to August 2021
Industry action to achieve the sugar reduction ambitions, the 5% reduction in juice based drinks and the 20% reduction in milk based drinks, and calorie guidelines for products likely to be consumed in a single occasion.
August 2018 to September 2019 (52 weeks)
Data collected through contracted suppliers for food and drink consumed in and out of the home
November 2019 PHE receive data
Mid 2020 PHE publish a progress report on juice and milk based drinks. Progress on the milk based drinks interim sugar reduction ambition of 10% will be taken into account when HM Treasury reviews the continuation of the exemption from the SDIL for milk based drinks in 2020.
August 2019 to September 2020 (52 weeks)
Data collected through contracted suppliers for food and drink consumed in and out of the home
November 2020 PHE receive data
Mid 2021 PHE publish a progress report on juice and milk based drinks
August 2020 to September 2021 (52 weeks)
Data collected through contracted suppliers for food and drink consumed in and out of the home
November 2021 PHE receive data
Mid 2022 PHE publish progress report on juice and milk based drinks
48
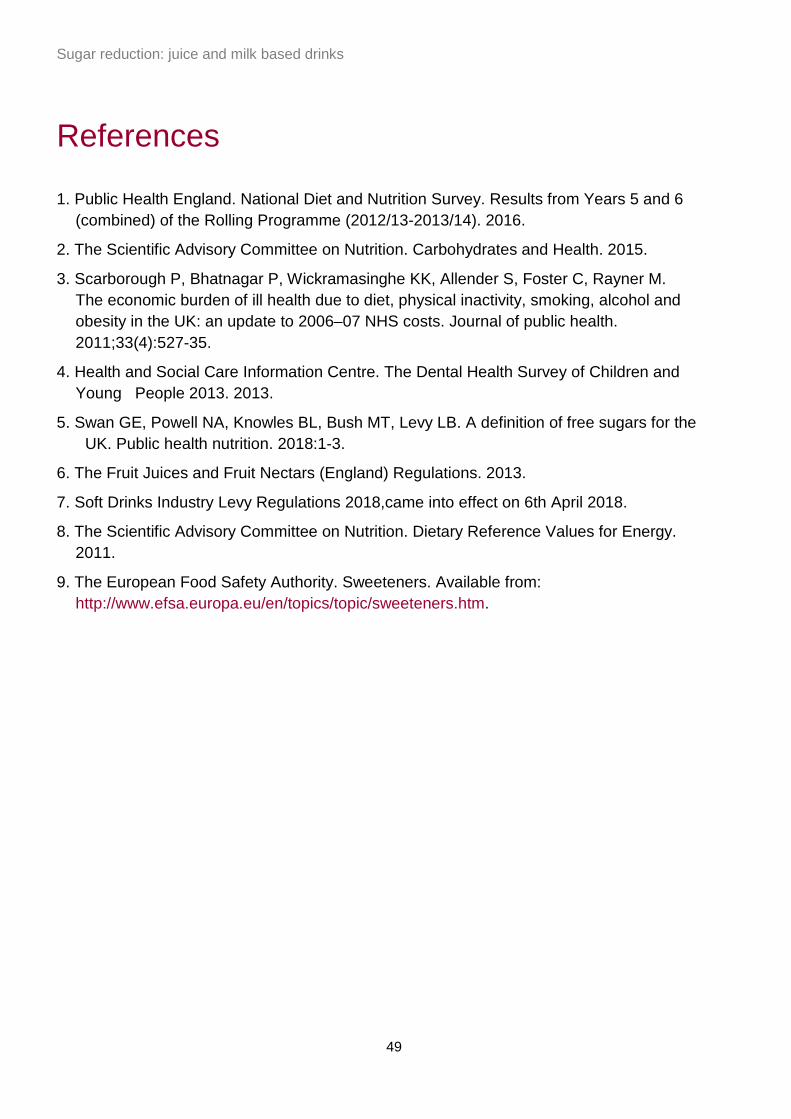
Sugar reduction: juice and milk based drinks
References
1. Public Health England. National Diet and Nutrition Survey. Results from Years 5 and 6 (combined) of the Rolling Programme (2012/13-2013/14). 2016.
2. The Scientific Advisory Committee on Nutrition. Carbohydrates and Health. 2015.
3. Scarborough P, Bhatnagar P, Wickramasinghe KK, Allender S, Foster C, Rayner M. The economic burden of ill health due to diet, physical inactivity, smoking, alcohol and obesity in the UK: an update to 2006–07 NHS costs. Journal of public health. 2011;33(4):527-35.
4. Health and Social Care Information Centre. The Dental Health Survey of Children and Young People 2013. 2013.
5. Swan GE, Powell NA, Knowles BL, Bush MT, Levy LB. A definition of free sugars for the UK. Public health nutrition. 2018:1-3.
6. The Fruit Juices and Fruit Nectars (England) Regulations. 2013.
7. Soft Drinks Industry Levy Regulations 2018,came into effect on 6th April 2018.
8. The Scientific Advisory Committee on Nutrition. Dietary Reference Values for Energy. 2011.
9. The European Food Safety Authority. Sweeteners. Available from: http://www.efsa.europa.eu/en/topics/topic/sweeteners.htm.
49


