134
Sugar reduction Report on progress between 2015 and 2019 October 2020

Sugar reduction Report on progress between 2015 and 2019 October 2020

Sugar reduction: report on progress between 2015 and 2019
2
About Public Health England
Public Health England exists to protect and improve the nation’s health and wellbeing
and reduce health inequalities. We do this through world-leading science, research,
knowledge and intelligence, advocacy, partnerships and the delivery of specialist public
health services. We are an executive agency of the Department of Health and Social
Care, and a distinct delivery organisation with operational autonomy. We provide
government, local government, the NHS, Parliament, industry and the public with
evidence-based professional, scientific and delivery expertise and support.
Public Health England
Wellington House
133-155 Waterloo Road
London SE1 8UG
Tel: 020 7654 8000
www.gov.uk/phe
Twitter: @PHE_uk
Facebook: www.facebook.com/PublicHealthEngland
Prepared by: Nick Coyle, Emma Little, Sarah Williamson, Sakhi Dodhia, Victoria Targett, Samantha Montel, Paul Niblett, Adele Mildon, Kate Hutchinson, Gabrielle Owtram, Dr Alison Tedstone, and others at PHE
For queries relating to this document, please contact:
© Crown copyright 2020
You may re-use this information (excluding logos) free of charge in any format or
medium, under the terms of the Open Government Licence v3.0. To view this licence,
visit OGL. Where we have identified any third-party copyright information you will need
to obtain permission from the copyright holders concerned.
Published April 2021
PHE publications PHE supports the UN
gateway number: GW-1996 Sustainable Development Goals

Sugar reduction: report on progress between 2015 and 2019
3
Contents
Executive summary 4
Introduction 13
Methodology 16
Results 23
Conclusions and next steps 83
Appendix 1: Guide to the category tables and charts 86
Appendix 2: Details of the data sources and methods used to assess progress of
the sugar reduction programme 93
Appendix 3: Methodology and results for juice and milk based drinks 108
References 134
Acknowledgements
PHE would like to thank the food and drink businesses across all sectors, trade bodies
and non-governmental organisations for their engagement in the development of the
data and metrics for this report. PHE would also like to thank food and drinks
businesses for provision of data and for giving permission for their data to be published,
where applicable.

Sugar reduction: report on progress between 2015 and 2019
4
Executive summary
Public Health England (PHE) oversees the voluntary sugar reduction programme and
the wider reformulation programme on behalf of the government. The sugar reduction
programme is a key commitment in all chapters of the ‘Childhood obesity: a plan for
action’; ‘Childhood obesity: a plan for action, chapter 2’; ‘Advancing our health:
prevention in the 2020s’ and in the government strategy paper ‘Tackling obesity:
empowering adults and children to live healthier lives’ published in July 2020. This
programme challenges all sectors of the food industry to reduce sugar by 20%1 by
2020 in the categories of food that contribute most to the sugar intakes of children aged
up to 18 years.
In May 2018 unsweetened juice and sweetened milk based drinks were incorporated
into the sugar reduction programme, and technical guidelines published. All sectors of
industry were challenged to reduce sugar by 5% in juice based drinks, and 20% for milk
based drinks by 2021. Milk based drinks also have an interim ambition of 10%
reduction by 2019. The ambition for mono juices is no increase in the baseline simple
average sugar content. In January 2019 fermented (yogurt) drinks were added to the
programme, with a sugar reduction ambition of 20% by 2021.
This latest report presents a detailed assessment of progress made by industry, over
the first 3 years of the sugar reduction programme, towards the 20% reduction
ambition. For the first time, there is also an assessment of changes in sugar across the
range of juice and milk based drink categories in scope of the programme. For retailers
and manufacturer branded products, this analysis is based on data for the year ending
8 September compared with a baseline of year 2015. For the eating out of home
sector, a comparison over time is made for the year ending August 2019 against a
baseline year of 2017. To monitor the full impact of the programme, an assessment of
the change in calories likely to be consumed on a single occasion (calories per single
serve) is included for all categories across the sectors.
PHE monitors progress of the Soft Drinks Industry Levy (SDIL) on behalf of HM
Revenue and Customs (HMRC). Therefore, this report also includes an assessment of
the changes in the sugar content and sales of drinks covered by SDIL between 2015
and 2019.
Progress is reported for retailers and manufacturer branded products purchased for
consumption in the home, and for products sold in those businesses that provide the
food and meals that we buy and eat out of the home, take away or have delivered to
1 This is measured by sales weighted average total sugar content in grams per 100g.

Sugar reduction: report on progress between 2015 and 2019
5
the home (which will now be referred to as the eating out of home sector2). The results
are not comparable across the sectors due to the difference in metrics used; sales
weighted average for retailers and manufacturer branded products and simple
averages for the eating out of home sector. To enable a comparison across the
sectors, the simple average is also calculated for retailers and manufacturer branded
products.
It is worth highlighting that all comparisons made in this progress report are made
based on data which precedes the Coronavirus (COVID-19) pandemic.
Headline results
Sugar content of food products
Retailers and manufacturer branded products
The main findings were (see Table ES1a):
• overall there was a 3.0% reduction in the sales weighted average total sugar per
100g in products sold between baseline (2015) and year 3 (2019)
• there were larger reductions for specific product categories, yogurts and fromage
frais down 12.9%, and breakfast cereals down 13.3% compared with baseline
• there was a small increase in the puddings category3
Eating out of home sector
The main findings were (see Table ES1a):
• overall there has been hardly any change in the simple average sugar content from
24.6g per 100g at baseline (2017) to 24.5g per 100g in year 3 (2019)4
• the largest decreases were 17.1% for breakfast cereals, 6.8% for cakes and 3.9%
for biscuits
• there was an increase for chocolate confectionery of 10.7%
For most categories, the simple average sugar content per 100g in products from the
eating out of home sector is roughly the same as in retailers and manufacturer branded
products in year 3 (2019).
2 The data for the eating out of home sector only captures purchases which are not eaten at home, therefore very few
purchases of takeaways and delivery services are included in this assessment of progress. However, the overall ambition
remains inclusive of these business models.
3 The increase for puddings can be attributed to the inclusion of mince pies for the first time in 2019 data when they did not
appear in the baseline. Excluding them from the 2019 data results in a sales weighted average decrease of 2.4%. 4 Progress for the eating out of home sector is compared with a baseline of 2017, because robust data for 2015 is not
available. Progress is also based on simple averages rather than sales weighted averages, as the available data does not
match purchases with nutrition information at product level.

Sugar reduction: report on progress between 2015 and 2019
6
The analysis for the eating out of home sector is based on more limited data and less
comprehensive nutrition information than that used for retailers and manufacturer
branded products.
Table ES1a. Summary of change in sugar content by food category
Calorie content of food products likely to be consumed on a single occasion
Retailers and manufacturer branded products
The main findings were (see Table ES1b):
• overall there has been hardly any change, since 2015, in calories in products likely
to be consumed on a single occasion (sales weighted average 146 kcals per portion
in 2015 and 147 kcals in 2019)
• there have been some changes at category level; the largest decreases were 7.8%
for yogurts and fromage frais, and 3.1% for chocolate confectionery
• the largest increase was 9.0% for puddings5
• cakes had an increase of 2.2% and morning goods had an increase of 2.5%, both
against a 2017 baseline6
5 The increase for puddings can be attributed to the inclusion of mince pies for the first time in 2019 data when they did not
appear in the baseline. Excluding them from the 2019 data results in a sales weighted average increase of 4.9%. 6 Only a small amount of data was collected for cakes and morning goods in 2015, therefore progress is being compared with
a baseline year of 2017. More information is given in the methodology chapter and Appendix 2.

Sugar reduction: report on progress between 2015 and 2019
7
Eating out of home sector
The main findings were (see Table ES1b):
• overall there has been a reduction in average calories per portion from 394 kcals in
2017 to 355 kcals in 2019, which represents a decrease of 9.7%
• ice creams, lollies and sorbets (down 17.6%), cakes (down 11.5%) and puddings
(down 9.1%) showed the largest decreases
• chocolate confectionery had the largest increase in calories per portion (up 6.1%)
Calories in products likely to be consumed on a single occasion in the eating out of
home sector are higher than in retailers and manufacturer branded products across all
categories, apart from chocolate confectionery.
Table ES1b. Summary of change in calories likely to be consumed on a single occasion (per single serve) by food category
There is a great deal of variation in the change in the sugar and calorie content of
products at business and brand level, with some businesses moving towards or doing
more than the guidelines set, while others have not changed or have seen an increase
in sugar and/or calorie content.
The full assessment of changes made in retailers and manufacturer branded food
products and food products in the eating out of home sector can be found in the results
chapter.

Sugar reduction: report on progress between 2015 and 2019
8
Volume of sales for retailers and manufacturer branded products
Total sales of sugar
• overall there has been a 2.6% increase in the tonnes of sugar sold from the product
categories included in the programme between baseline and year 3
• the population of Great Britain increased during this period, therefore this increase
represents no change in sugar purchased per person
• the largest increases in tonnes of sugar sold were 16.3% for chocolate confectionery
and 7.2% for sweet confectionery
• the largest decreases were 15.9% for yogurts and fromage frais, and 13.9% for
breakfast cereals
Total volume sales
• there has also been an overall increase in the tonnes of products sold from the
categories included in the programme of 3.4% between baseline and year 3
• this represents a 0.8% increase per person after accounting for the increase in
population in Great Britain over the same time
• large increases in sales of chocolate confectionery (up 16.3%), sweet spreads and
sauces (up 12.0%), and ice cream, lollies and sorbets (up 8.0%) were seen
• sales decreased in 3 categories; breakfast cereals (down 0.5%), puddings (down
3.0%), and yogurts and fromage frais (down 3.3%)
• equivalent figures for the eating out of home sector are not available
Juice and milk based drinks
Retailers and manufacturer branded products – changes in sugar and calorie content
The main findings were (see Table ES1c):
• there have been reductions in the sales weighted average sugar per 100ml for some
categories, including 22.1% for pre-packed milk based drinks, 5.3% for pre-packed
flavoured milk substitute drinks and 13.4% for pre-packed fermented (yogurt) drinks
• there were also some reductions in the simple average sugar per 100ml, in particular
17.8% for coffee and tea powders, syrups and pods as consumed, and 12.1% for
milkshake powders, syrups and pods as consumed (both made up as per
manufacturer’s instructions)
• there was a 3.6% reduction in the sales weighted average sugar per 100ml for pre-
packed blended juices. For pre-packed mono juices there was no increase in the
simple average sugar per 100ml
• the number of calories likely to be consumed on a single occasion decreased in all
categories other than pre-packed mono juices

Sugar reduction: report on progress between 2015 and 2019
9
Table ES1c. Summary of change in sugar content and the number of calories
likely to be consumed on a single occasion (per single serve) by juice and milk
based drink category in retailers and manufacturer branded products
Eating out of home sector – changes in sugar and calorie content
The main findings were (see Table ES1d):
• there was an increase in the simple average sugar content for open cup milkshakes
of 7.8%, but a decrease in the number of calories likely to be consumed on a single
occasion of 2.8%
• there was a decrease in the simple average sugar content of 6.8% for open cup
hot/cold drinks, but an increase in the number of calories likely to be consumed on a
single occasion of 10.0%
• there has been a 1.5% increase in the simple average sugar content of blended
juices, and a 1.1% increase in the calories likely to be consumed on a single
occasion

Sugar reduction: report on progress between 2015 and 2019
10
Table ES1d. Summary of change in sugar content and the number of calories
likely to be consumed on a single occasion (per single serve) by juice and milk
based drink category in the eating out of home sector7
The results for the assessment of progress in juice and milk based drinks can be found
in Appendix 3.
Soft Drinks Industry Levy
The main findings were:
• for retailers and manufacturer branded products, there was a 43.7% reduction in the
total sugar content per 100ml between 2015 and 2019 for the drinks subject to the
levy
• overall sales (in litres) of drinks subject to the levy have increased by 14.9%, but the
total sugar sales from the soft drinks decreased by 35.4%
• the total sugar purchased per household from drinks subject to the SDIL has
decreased across all socio-economic groups. The reduction is largest in Group C2
(those households where the main wage earner is in a skilled manual occupation)
with 38.5%, and then is similar across all remaining socio-economic groups
(between 32.7% and 35.1% reduction)
• the number of calories likely to be consumed on a single occasion fell by 35.2%
between 2015 and 2019
• in the eating out of home sector, there was a reduction of 38.5% in the simple
average total sugar content for drinks subject to the SDIL and a reduction of 37.7%
in the calories for drinks likely to be consumed on a single occasion
7 April 2021 – Due to an error found with the data, baseline figures for juices and milk based drinks for the eating out of home
sector have been revised
Product Category
Open cup Milkshakes
Open cup hot/cold drinks
Blended juices
Notes
*Simple average is the simple arithmetic mean. Products are given equal influence
Change (%) in simple average*
Sugar per 100ml
7.8
-6.8
1.5
Calories consumed on a single occasion
-2.8
10
1.1

Sugar reduction: report on progress between 2015 and 2019
11
The percentage decreases from the SDIL are much greater than those seen for the
food categories included in the voluntary sugar reduction programme. The full
assessment of changes made in drinks subject to the SDIL can be found in the results
chapter.
The analysis of changes in sugar purchased by socio-economic group has not
accounted for other factors that could be causing some of the differences in
purchasing, such as price changes and other household characteristics (such as size
and family composition). Further analysis would be required to fully understand the
changes seen.
Limitations
There are a number of limitations to the data and analysis presented in this report. It is
not possible to test the statistical significance of the changes over time which means
that some of the changes or differences between food categories could have occurred
by chance. In addition, PHE acknowledge that not all reformulation progress will be
captured in the data used to assess progress in this report.
For the eating out of home sector, it is not possible to produce the sales weighted
average sugar content of products in grams per 100g due to problems linking sales and
nutrition data. Therefore, simple averages have been used, but these have the
disadvantage of not taking into account the volume of sales of the product which
means that low selling products are given the same weight as high selling products.
Also, there may be bias as nutrition information is not available for some outlets.
The baseline used for retailers and manufacturer branded products is 2015. However
only a small amount of data was collected for cakes and morning goods in 2015 so
progress for these categories is being compared with a baseline year of 2017. Analysis
of the eating out of home sector also uses a 2017 baseline as individual business level
data was unavailable before this.
For juice and milk based drinks, it is not possible to calculate sales weighted averages
for retailers and manufacturer branded products which are not sold as consumed (that
is, they have to be made up as per manufacturer’s instructions). Therefore, simple
averages are used. In the eating out of home sector, for juices and milk based drinks,
there is an assumption that the product will be made in such a way that it is identical to
the drink used to calculate the nutrition information and that the consumer does not add
sugar or additional milk. More details can be found in Appendix 3.

Sugar reduction: report on progress between 2015 and 2019
12
Next steps
Transparent monitoring of the sugar reduction programme, and further expert advice on
the potential levers to address excess sugar consumption, will continue to be provided
to government.
The next progress report, due in 2021, will provide a fourth annual assessment of
progress by all sectors of industry towards achieving the 20% reduction ambition for
the food categories included in the programme. This report will also include a second
assessment of progress made by industry towards the ambitions set for juice and milk
based drinks. Consideration is being given to the measurement period and timing of
data for this report due to changes in food purchases caused by Coronavirus
(COVID-19).
Next steps for the wider reformulation programme, during 2020, include the publication
of guidelines to improve the nutrient content of commercial baby foods and drinks.
There will continue to be engagement with stakeholders on the reduction and
reformulation programme where appropriate.

Sugar reduction: report on progress between 2015 and 2019
13
Introduction
Public Health England (PHE) oversees the government’s voluntary sugar reduction and
wider reformulation programme, as set out in all chapters of the of ‘Childhood obesity: a
plan for action’; ‘Childhood obesity: a plan for action, chapter 2’; ‘Advancing our health:
prevention in the 2020s’ and in the government strategy paper ‘Tackling obesity:
empowering adults and children to live healthier lives’ published in July 2020.
The ambition of the sugar reduction programme is for all sectors of the food industry to
reduce the amount of sugar in the foods that contribute most to the intakes of children
by 20% by 2020. This means that retailers, manufacturers and the businesses that
provide the food and meals that we buy and eat out of the home, take away or have
delivered to the home (this will now be referred to as the eating out of home sector8)
are all expected to take action. This comparison is made against a baseline of 2015 for
retailers and manufacturer branded products (year ending 31 January 2016). For the
eating out of home sector the comparison is against a baseline year ending 10
September 2017, primarily due to a change in data provider between 2015 and 2017.
More detail is given in the year 1 progress report.
The categories included in the programme are biscuits; breakfast cereals; cakes;
chocolate confectionery; ice cream, lollies and sorbets; morning goods (such as
pastries and buns); puddings; sweet confectionery; sweet spreads and sauces; and
yogurts and fromage frais. The programme covers children up to the age of 18 years.
As children eat a wide range of foods, not just those that are manufactured for or
marketed to children, all foods in each category are included.
In March 2017, PHE published a technical report outlining guidelines for total sugar
content per 100g and calories per single serve portion, for the categories included in
the programme, to help industry in achieving the programme’s overall ambition. This
technical report also included the baseline analysis for each category. Both the sugar
and calorie guidelines were set as sales weighted averages which are used to assess
progress against the ambition for sugar reduction. A maximum calorie per single serve
portion guideline was also set for most categories.
In April 2018 HM Revenue and Customs (HMRC) introduced the SDIL which is aimed
at the producers and importers of added sugar soft drinks, and is designed to
encourage producers to reformulate their overall product ranges by reducing added
sugar content, helping customers choose lower/no added sugar products and reducing
8 The data for the eating out of home sector only captures purchases which are not eaten at home, therefore very few
purchases of takeaways and delivery services are included in this assessment of progress. However, the overall ambition
remains inclusive of these business models.
Sugar reduction: report on progress between 2015 and 2019
14
portion size. It was amongst the commitments in the government’s ‘Childhood obesity:
a plan for action’ (published in August 2016).
PHE was asked to monitor progress of the SDIL by HMRC, and this report includes an
assessment of the changes in sugar content and sales of drinks covered by SDIL
between 2015 and 2019. It also includes an analysis of the trend in the sales of drinks
covered by SDIL by socio-economic group.
Although not in scope of the SDIL, unsweetened juices and sweetened milk based
drinks can also contribute to children’s sugar and calorie intakes, particularly given
some of the larger products available that are likely to be consumed on a single
occasion. In May 2018 these drinks were incorporated into the sugar reduction
programme, and technical guidelines published to help industry to achieve these. Every
sector of the drinks industry (retailers, manufacturers and the eating out of home
sector) is expected to reduce the overall sugar content of juice based drinks by 5% and
milk based drinks by 20% by 2021. The guidelines include an interim sugar reduction
ambition for milk based drinks of 10% by 20199. Further details on the methodology
and results for juice and milk based drink can be found in Appendix 3.
In January 2019 PHE published a sugar reduction ambition for fermented (yogurt)
drinks of a 20% reduction by 2021. These drinks form a sub-category to the yogurts
and fromage frais category of the sugar reduction programme due to the composition
and similarity between fermented (yogurt) drinks and yogurts.
Businesses can adopt 1 of 3 mechanisms for taking action: reducing the amount of
sugar per 100g or 100ml (reformulation); reducing portion size; or, shifting consumers’
purchasing patterns towards lower/no added sugar products. For all food and drink
categories included in the programme, reductions in sugar should also be accompanied
by reductions in calories where possible, with no increases in saturated fat and the
achievement of current salt targets, if applicable.
In September 2019 PHE published the second assessment of industry progress
between 2015 and 2018. Overall, this showed a 2.9% reduction in the sales weighted
average total sugar per 100g for retailers and manufacturer branded products and a
4.9% reduction in simple average of total sugar per 100g for the eating out of home
sector (against a baseline of 2017). The average sugar content of drinks subject to the
SDIL decreased by 28.8% in retailers and manufacturer branded products (measured
in sales weighted average grams per 100ml) and 27.2% for the eating out of home
sector.
9 Progress on the interim sugar reduction ambition of 10% for milk based drinks will be taken into account when HM Treasury
reviews the continuation of their exemption from the Soft Drinks Industry Levy (SDIL) in 2020.

Sugar reduction: report on progress between 2015 and 2019
15
This latest report details progress made by all sectors of industry in the third year of the
programme. This includes an assessment of changes in sugar content and sales of
drinks covered by the SDIL between 2015 and 2019, and an analysis of the trend in the
sales of drinks covered by the SDIL by socio-economic group.
The assessment of progress for retailers and manufacturer branded products is based
on the analysis of data for the year ending 8 September 2019, compared with the
baseline year of 2015. For the eating out of home sector, a comparison over time is
made for the year ending August 2019 against a baseline year of 2017, as earlier
detailed data were not available.
For the first time, the current report also includes an assessment of changes made for
juice and milk based drinks. This first assessment of progress is made for the year
ending 8 September 2019 against a baseline year of 2017. The results of this analysis
are available in Appendix 3.
The 2015 baseline figures published previously have been revised to reflect
improvements in methodology. Further details can be found in the methodology chapter
and Appendix 2.
All comparisons in this progress report are made against data which precedes the
Coronavirus (COVID-19) pandemic. Case studies are not included in this report.

Sugar reduction: report on progress between 2015 and 2019
16
Methodology
Introduction
This section briefly sets out descriptions of the underlying data sources and analytical
methods used to produce this report. A more detailed description of the methodology,
including limitations to the data and analysis, can be found in Appendix 2.
Product categories covered by the sugar reduction programme (a fuller description of
each category is given in Appendix 2) are:
• biscuits
• breakfast cereals
• cakes
• chocolate confectionery
• ice cream, lollies and sorbets
• morning goods
• puddings
• sweet confectionery
• sweet spreads and sauces
• yogurts and fromage frais
This report also includes the first assessment of progress made in unsweetened juice
and sweetened milk based drinks, further details are available in Appendix 3. There is
also an assessment of changes in drinks covered by the SDIL10.
Metrics used to measure progress
A series of metrics have been used to monitor progress and these can be mapped to
the 3 options businesses are likely to be taking to reduce sugar content of products
covered by the programme. Some businesses may choose to use just one of these
options and some may choose to implement a combination. The options are:
• reducing the amount of sugar per 100g or 100ml (reformulation)
• reducing the portion size of a product likely to be consumed on a single occasion
• shifting consumers’ purchasing patterns towards lower or no added sugar products
10 The SDIL covers drinks that contain added sugar and have total sugar levels of 5g per 100ml and over. The levy does not
cover unsweetened juices and sweetened milk based drinks for which PHE published separate guidelines in May 2018.

Sugar reduction: report on progress between 2015 and 2019
17
Retailers and manufacturer branded products
This report uses 4 metrics for retailers and manufacturer branded products to measure
progress against the sugar reduction ambitions.
Sales weighted average total sugar content (grams per 100g or 100ml)
The average (mean) sugar content of each food product is weighted by its total sales
volume in weight (kilogrammes) to give more influence to products with higher sales.
Therefore, changes to the sugar content of products with higher sales will have a
greater impact on the sales weighted average than changes for products with fewer
sales. For the SDIL and juice and milk based drinks, sales in litres are used to weight
the sugar content of each product to give a sales weighted average grams per 100ml.
Simple average: the simple arithmetic average of total sugar content (grams per
100g or 100ml)
Products are not weighted according to volume sales in this calculation, so this
measures the average (mean) sugar content of products regardless of how much are
sold. Again, there is a SDIL and juice and milk based drinks equivalent expressed as
grams per 100ml.
Sales weighted average calories in products likely to be consumed on a single
occasion (single serve)
This measure is restricted to a subset of products which are likely to be consumed on a
single occasion. It is the average (mean) number of calories (expressed as kcals) per
serving of each product, where the contribution of each product to the average is
weighted by its total sales volume in servings.
Portion size has been estimated through analysis and consumption information and is
not always consistent with portion size information provided on product packaging by
retailers or manufacturers.
The proportion of single serve products included in this analysis varies between
categories, with around three-quarters of products being included for morning goods
but only around a third for chocolate and sweet confectionery. Breakfast cereals and
sweet spreads and sauces are not included in this analysis as consumers take variable
sized servings out of individual packs and it is therefore not possible to measure single
serve portions as there is no standard size. Powders and syrups in the milk based
drinks analysis have been excluded for the same reason. Pods and sachets have also
not been included as consumers could have more than a single pod or sachet to make
up their drink.

Sugar reduction: report on progress between 2015 and 2019
18
This metric is designed to adjust for any potential negative impacts of reducing sugar
such as increasing calories at the same time or increasing the size of a portion.
Total sugar sales
This is the total volume of sugar sold (in tonnes) in the categories included in the
programme. It is calculated by multiplying the sugar content of each product by the
volume sales of that product. Therefore, it will reflect both changes in sales volumes
and changes in sugar content of products.
The metrics align against the mechanisms available for change as shown in Box 1.
Box 1: Metrics used to assess sugar reformulation programme for retailers and manufacturer branded products
Metric
Simple average of sugar per 100g/ml
Sales weighted
average of sugar per 100g/ml
Sales weighted
average of calories
per single serve
Total sugar sales
1. Reformulate to reduce sugar
content in products ✓ ✓ ✓ ✓
2. Reduce the portion size for
products likely to be consumed
on a single occasion
✓ ✓
3. Shift consumer purchasing
patterns towards lower or no
added sugar products
✓ ✓ ✓
For retailers and manufacturers, the headline metrics in this report are largely based on
the sales weighted average total sugar content per 100g or 100ml, and the sales
weighted average calories in products likely to be consumed on a single occasion.
However, the other metrics help to monitor the full impact of the reformulation
programme. The sales weighted average total sugar per 100g or 100ml is used as the
main metric for monitoring progress because it is based on all products purchased
(apart from some juice and milk based drinks categories), whereas the calories metric
is based on those which have a single serve portion size (as determined by PHE)
which is a subset of all products purchased.

Sugar reduction: report on progress between 2015 and 2019
19
Eating out of home sector
Following publication of the report on the first year of progress, PHE reviewed the data
and metrics used for the eating out of home sector. For this and all subsequent reports,
PHE intends to use simple averages to track progress for this sector rather than sales
weighted averages. This is because of limitations with the commercially available
dataset used for this sector, which mean that it is not possible to link the nutrition data
to purchases at product level with the same level of accuracy as for retailers and
manufacturer branded products. Therefore, only the following metrics are used for the
eating out of home sector.
Metrics used in this report to assess progress of the sugar reduction programme
for the eating out of home sector
1. Simple average total sugar content per 100g (or 100ml for SDIL and juice and milk
based drinks).
2. Simple average for calories in products likely to be consumed on a single occasion
(calories per single serve).
These metrics are also compared against the equivalent simple average metrics for
retailers and manufacturer branded products.
Time periods covered
For retailers and manufacturer branded products, comparisons are generally made
between the baseline year of 2015 and the third year (2019) of the programme.
An exception relates to cakes and morning goods, where the 2015 baseline data for
these categories was not considered to be robust and the data for subsequent years
has been gradually improved to include more products. Therefore, for these 2
categories the data for 2017 (year 1) has been used as the baseline instead of 2015,
with comparisons therefore being made between 2017 and 2019.
While this approach also has some limitations, the 2017 data is more complete than the
2015 data for these categories so allows for more robust comparisons to be made.
However, comparisons between 2017 and 2019 should still be made with caution,
because data were collected for around 40% more products in 2019 compared with
2017 (the number of products included in the analysis can be seen in Table 1).
To enable an overall comparison for all categories combined to be made with the
updated baseline year of 2015, the 2017 data for cakes and morning goods has been
used to replace the 2015 data for these 2 categories. This may underestimate overall
change between 2015 and 2019 because it implies that there has been no change for
cakes and morning goods between 2015 and 2017.

Sugar reduction: report on progress between 2015 and 2019
20
As reported in the year 1 sugar reduction progress report, it is not possible to report on
progress for Aldi and Lidl in the same way as for other businesses due to a lack of
baseline data. Data is now available for these retailers for 2017 (year 1) and 2019 (year
3), and therefore progress reported for these retailers’ products will be based on
comparisons between year 1 and year 3.
More information on this methodology and other small changes in the time periods
used for comparisons is available in Appendix 2. For juice and milk based drinks this is
set out in Appendix 3.
For the eating out of home sector, comparisons are made between 2017 and 2019,
making 2017 the baseline period for this sector. For juice and milk based drinks,
comparisons are made between 2017 and 2019.
Data sources
Retailers and manufacturer branded products
The baseline and year 3 analyses for retailers and manufacturer branded products use
commercially available data from Kantar FMCG’s consumer panel (formerly Kantar
Worldpanel). This includes data on volume of sales and nutrition information. The
baseline year for this report used data collected over 52 weeks ending 31 January
2016 and the third-year dataset covers the 52 weeks ending 8 September 2019.
Nutrition data is collected at category level on a rolling basis throughout the year and
the frequency of data collection increased from every 6 months in the baseline year to
every 4 months in year 3. Therefore, nutrition data for all categories will have been
collected in the 4 months leading up to 8 September 2019. If no nutrition information for
a product was found in 2019 then the most recently collected nutrition information
available from a previous year was used. In 2019 Kantar FMCG (fast-moving consumer
goods) also undertook a one-off exercise after the initial data collection period had
ended to improve nutrition information, focusing particularly on the top sellers in each
category.
Despite this improvement, some reformulation changes may not be identified and
reported on in the year that they occur if the reformulated products appeared on the
shelves after the last set of nutrition data was collected for that category. More
information on the data collection methodology used by Kantar FMCG is provided in
Appendix 2.
There are no confidence intervals associated with the estimates calculated, as
described in Appendix 2. This means that the statistical significance of the changes
cannot be assessed.

Sugar reduction: report on progress between 2015 and 2019
21
Eating out of home sector
The sales data for this sector are from a commercially available dataset provided
through a consumer survey run by Lumina Intelligence (formerly MCA). Nutrition
information for the eating out of home sector has been collected by PHE from
businesses and additionally by Lumina Intelligence from business websites.
Comparisons are made between 2017 and 2019 and a fuller description of the eating
out of home sector data is provided in Appendix 2.
As with the analysis for retailers and manufacturer branded products, there are no
confidence intervals associated with the estimates calculated as described in Appendix
2. This means that the statistical significance of the changes cannot be assessed.
Geographical coverage
Both commercially available datasets cover Great Britain, therefore the results
presented in this report are representative of Great Britain as a whole. A dataset
covering just England was not available.
Quality assurance
The data sources and methodology used in this report were presented to external
stakeholders (including retailers, manufacturers, eating out of home businesses, trade
bodies and non-governmental organisations) before the first-year progress report was
produced. Feedback received from stakeholders was used to check that PHE’s proposals,
the category definitions, analytical methods, and data sources used were appropriate.
The commercial datasets used from Kantar FMCG and Lumina Intelligence have
quality control measures built into their production process. In addition, PHE has
carried out quality control checks of all data used and all analyses to mitigate against
issues remaining with the data. These include:
• checking datasets for implausible values and excluding those from the analysis
• checking the consistency of nutrition variables across a product line
• cross-referencing to other datasets or online information
• replicating analyses as a quality control measure
• examining data behind business-specific results to ensure they are plausible and
comparable (otherwise excluded from the analysis)
• checking data against information supplied by businesses
Specific data checks and questions were sent to data suppliers as and when they
arose, where there were anomalies, or other queries over the collection of certain
variables or the viability of data collection from certain outlets.
More information related specifically to quality assurance for juice and milk based
drinks data is available in Appendix 3.

Sugar reduction: report on progress between 2015 and 2019
22
Obtaining permission to publish individual business data for retailers and
manufacturers
Due to limitations placed on the use of individual business sales data by Kantar FMCG,
PHE requested written agreement from each retailer or manufacturer to show the
percentage change in the sales weighted average sugar and calories for their products
in the report.
This applies to all categories included in the sugar reduction programme – food and
juice and milk based drinks – and to the drinks subject to the SDIL. Where permission
was declined or no response was received, the relevant data was not included in
Appendix Tables 2, 3, 4 and 9, and the appropriate reason given next to the business
name.
Of the 129 businesses that were contacted, 80 replied and gave permission; 8 replied
and did not give permission; 41 did not reply.

Sugar reduction: report on progress between 2015 and 2019
23
Results
Introduction
This chapter has 3 sections as follows:
1. Retailers and manufacturer branded products – this provides an assessment of
changes made between baseline (2015) and year 3 (2019) in retailers and
manufacturer branded food products included in the programme.
2. Eating out of home sector – this provides an assessment of changes between year
1 (2017) and year 3 (2019) for the food products included in the programme.
3. The SDIL – this provides an assessment of changes between baseline (2015) and
year 3 (2019) across the sectors, and an analysis by socio-economic group for
retailers and manufacturer branded products.
The results for juice and milk based drinks are available in Appendix 3.
The analysis presented in this chapter is supplemented by detailed tables which accompany
this report. These are described in Appendix 1.
All percentage changes presented in this report have been calculated from unrounded data, so
it may not be possible to reproduce them from the rounded data which follows.
Retailers and manufacturer branded products
Sales weighted average total sugar content per 100g for retailers and
manufacturer branded products
The sales weighted average is quoted in Chapter 1 of the Childhood Obesity Plan as
the main metric by which progress towards the 20% reduction ambition will be
measured. There are some limitations on whether this metric captures all reformulation
activity as discussed in Appendix 2. However, despite these limitations it remains the
best metric to assess progress against the 20% reduction ambition.
The overall and product category level sales weighted average total sugar content per
100g for retailers and manufacturer branded products at baseline (2015) and year 3
(2019), are shown in Figure 1.
Figure 2 shows the percentage change between the same period. It can be seen that:
• overall there was a 3.0% reduction in total sugar per 100g in products sold between
baseline (2015) and year 3 (2019)

Sugar reduction: report on progress between 2015 and 2019
24
• there were larger reductions for some specific product categories (yogurts and
fromage frais down 12.9%, and breakfast cereals down 13.3% compared with the
2015 baseline)
• there was a reduction of 6.4% for ice creams lollies and sorbets and 5.6% for sweet
spreads and sauces compared with 201511
• there were reductions of 4.8% for cakes and 5.6% for morning goods, compared with
their baseline of 201712
• there were much smaller reductions for 3 other categories: biscuits (1.6%), chocolate
confectionery (0.4%) and sweet confectionery (0.1%)
• there was a small increase in the puddings category13 (Table 1)
11 The decrease for spreads and sauces is largely due to an increase in the proportion of sales in that category which are due
to peanut butter. Peanut butter has a much lower sugar content than chocolate spreads, fruit spreads and desert toppings
which make up the remainder of that category. Therefore, an increase in the proportion of sales for peanut butter relative to the
other products resulted in a decrease in the sales weighted average total sugar g/100g, though there was actually an increase
in sugar content for most peanut butter brands. 12 Only a small amount of data was collected for cakes and morning goods in 2015 so progress is being compared with a
baseline year of 2017. More information is given in the methodology chapter and Appendix 2. 13 The increase can be attributed to the inclusion of mince pies for the first time. Excluding them results in a decrease in sales
weighted average total sugar per 100g for puddings of 2.4%

Sugar reduction: report on progress between 2015 and 2019
25
Figure 1: Sales weighted average total sugar (g/100g) by category for baseline (2015) and year 3 (2019) for retailers and manufacturer branded products
Baseline Year 3
Overall 25.6 24.8
Biscuits 31.6 31.1
Breakfast Cereals 16.7 14.5
Chocolate Confectionery 54.4 54.2
Ice Cream, Lollies and Sorbets 18.6 17.4
Puddings 18.3 18.7
Sweet Spreads and Sauces 30.7 29.0
Sweet Confectionery 61.2 61.1
Yogurts and Fromage Frais 12.5 10.9
Cakes 34.1 32.5
Morning Goods 12.6 11.9
0 20 40 60 80
Sales Weighted Average Sugar (g/100g)
Baseline
Year 3

Sugar reduction: report on progress between 2015 and 2019
26
% Change
Overall -3.0
Biscuits -1.6
Breakfast Cereals -13.3
Chocolate Confectionery -0.4
Ice Cream, Lollies and Sorbets -6.4
Puddings 2.0
Sweet Spreads and Sauces -5.6
Sweet Confectionery -0.1
Yogurts and Fromage Frais -12.9
Cakes -4.8
Morning Goods -5.6
-15 -10 -5 0 5
Change in Sales Weighted Average Sugar (%)
Figure 2: Percentage change in sales weighted average total sugar (g/100g) by category between baseline (2015) and year 3 (2019) for retailers and manufacturer branded products

Sugar reduction: report on progress between 2015 and 2019
27
Simple average total sugar content per 100g for retailers and manufacturer
branded products
This metric is a simple arithmetic average of the products purchased in each category
and therefore does not give more influence to those products which have higher sales.
The simple average is used later in this chapter to compare retailers and manufacturer
branded products with businesses operating in the eating out of home sector.
Figure 3 shows the simple average at both overall and product category level for
baseline (2015) and year 3 (2019). Figure 4 shows the change between this period.
It can be seen that:
• overall there has been a 2.2% reduction in the simple average total sugar per 100g
• the largest decreases at a category level were 17.7% for sweet spreads and sauces,
13.8% for yogurts and fromage frais, and 13.6% for breakfast cereals
• other categories had much smaller changes, and there was an increase for biscuits
of 0.6% and for puddings of 0.9%14
• there was a decrease for cakes (down 1.5%) and morning goods (down 1.8%) from
201715 (Table 1)
In general, the changes seen in the simple average for each category are similar to
those seen for the sales weighted average. The most noticeable difference is for
spreads and sauces which had a decrease of 17.7% for the simple average compared
with a decrease of 5.6% for the sales weighted average. This is primarily due to one of
the largest selling brands not changing their sugar content between baseline and year
3. As the products within this brand account for around 20% of sales for this category
they have quite a large influence on the sales weighted average, but the same
influence as all the other products in this category on the simple average.
14 The increase can be attributed to the inclusion of mince pies for the first time. Excluding them results in a decrease in simple
average for puddings of 0.5% 15 Only a small amount of data was collected for cakes and morning goods in 2015 so progress is being compared with a
baseline year of 2017. More information is given in the methodology chapter and Appendix 2.

Sugar reduction: report on progress between 2015 and 2019
28
Figure 3: Simple average total sugar (g/100g) by category for baseline (2015) and year 3 (2019) for retailers and manufacturer branded products
Baseline Year 3
Overall 34.1 33.4
Biscuits 31.2 31.4
Breakfast Cereals 18.3 15.8
Chocolate Confectionery 51.3 50.7
Ice Cream, Lollies and Sorbets 20.9 19.8
Puddings 22.7 22.9
Sweet Spreads and Sauces 30.5 25.1
Sweet Confectionery 60.5 59.1
Yogurts and Fromage Frais 13.1 11.3
Cakes 33.8 33.3
Morning Goods 16.1 15.8
0 20 40 60 80
Simple Average Sugar (g/100g)
Baseline
Year 3

Sugar reduction: report on progress between 2015 and 2019
29
Figure 4: Percentage change in simple average total sugar (g/100g) by category between baseline (2015) and year 3 (2019) for retailers and manufacturer branded products
% Change
Overall -2.2
Biscuits 0.6
Breakfast Cereals -13.6
Chocolate Confectionery -1.2
Ice Cream, Lollies and Sorbets -5.0
Puddings 0.9
Sweet Spreads and Sauces -17.7
Sweet Confectionery -2.2
Yogurts and Fromage Frais -13.8
Cakes -1.5
Morning Goods -1.8
-20 -15 -10 -5 0 5
Change in Simple Average Sugar (%)

Sugar reduction: report on progress between 2015 and 2019
30
Sales weighted average calories in products likely to be consumed on a single
occasion (single serve) for retailers and manufacturer branded products
For some categories, such as chocolate and sweet confectionery, the mechanisms for
action are more limited due to technical limitations and issues around consumer
acceptability. This may mean that the primary mechanism that businesses can use to
take action is to reduce the portion size of the product, because reducing the sugar
content may alter the taste or texture of the product quite significantly which could
affect sales. Products that are likely to be consumed on a single occasion, and where a
portion size could be calculated, were identified and the following analysis is restricted
to that subset.
Changes over time which are discussed in the remainder of this section may be due to
the portion sizes of existing products changing and/or new products being introduced
which have different portion sizes to those already on the market.
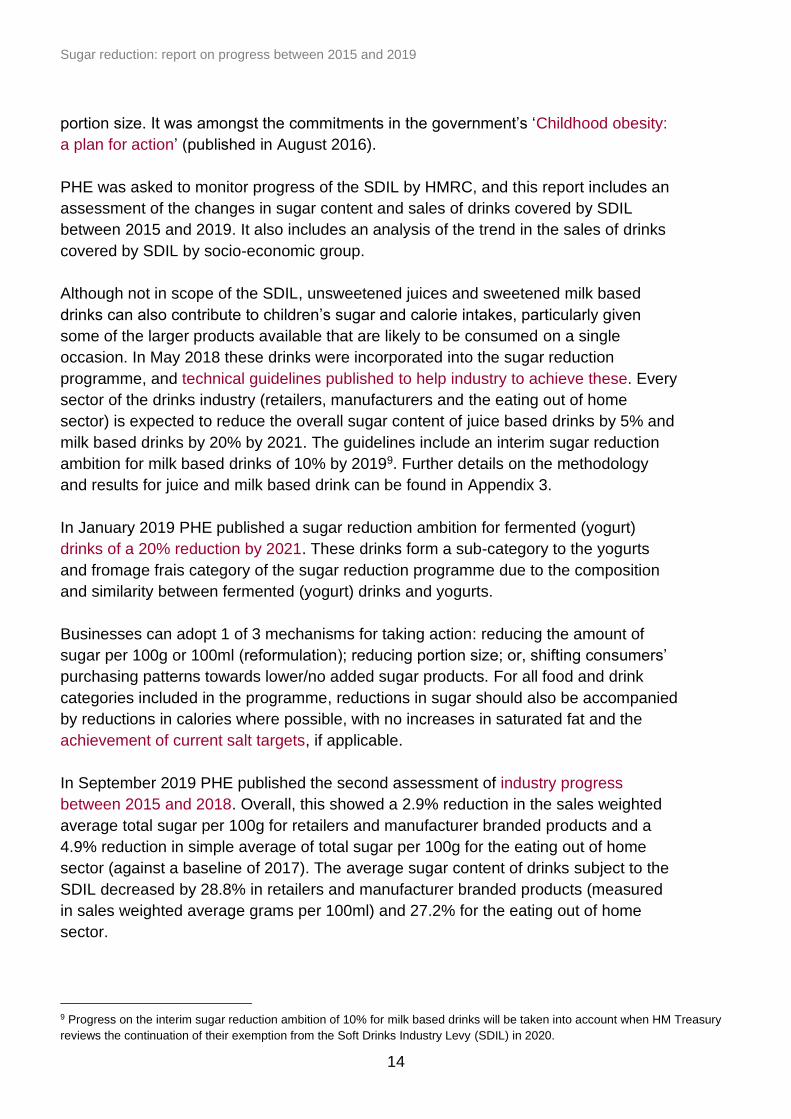
Figure 5 shows the sales weighted average for calories in a single serve portion at
category and overall level for baseline (2015) and year 3 (2019). Figure 6 shows the
change during this period, it can be seen that:
• overall there has been hardly any change, since 2015, in calories in products likely
to be consumed on a single occasion (146 kcals per portion in 2015 and 147 kcals in
2019)
• there have been some changes at category level and the largest decreases were
7.8% for yogurts and fromage frais, and 3.1% for chocolate confectionery
• the largest increase was 9.0% for puddings16
• cakes had an increase of 2.2% against the 2017 baseline17 and morning goods had
an increase of 2.5%
• other categories had smaller changes (Table 3)
16 Much of the increase can be attributed to the inclusion of mince pies for the first time. Excluding them results in an increase
in sales weighted average for puddings of 4.9%. 17 Only a small amount of data was collected for cakes and morning goods in 2015 so progress is being compared with a
baseline year of 2017. More information is given in the methodology chapter and Appendix 2.
Sugar reduction: report on progress between 2015 and 2019
31
Figure 5: Sales weighted average calories (kcals) for products likely to be consumed on a single occasion by category for baseline (2015) and year 3 (2019) for retailers and manufacturer branded products
Baseline Year 3
Overall 146 147
Biscuits 125 125
Chocolate Confectionery 173 168
Ice Cream, Lollies and Sorbets 159 156
Puddings 179 196
Sweet Confectionery 147 147
Yogurts and Fromage Frais 129 119
Cakes 134 137
Morning Goods 157 161
0 50 100 150 200 250
Sales Weighted Average Calories per Single Serve Portion (kcal)
Baseline
Year 3

Sugar reduction: report on progress between 2015 and 2019
32
% Change
Overall 0.9
Biscuits 0.3
Chocolate Confectionery -3.1
Ice Cream, Lollies and Sorbets -1.5
Puddings 9.0
Sweet Confectionery 0.2
Yogurts and Fromage Frais -7.8
Cakes 2.2
Morning Goods 2.5
-10 -5 0 5 10
Change in Sales Weighted Average Calories per Single Serve Portion (%)
Figure 6: Percentage change in sales weighted average calories for products likely to be consumed on a single occasion by category between baseline (2015) and year 3 (2019) for retailers and manufacturer branded products

Sugar reduction: report on progress between 2015 and 2019
33
Differences between retailers and manufacturers
This section compares progress made in retailers and manufacturer branded products
using the sales weighted average total sugar content per 100g (Figure 7) and the sales
weighted average calories for products likely to be consumed on a single occasion
(Figure 8).
It can be seen that:
• overall, retailers made more progress than manufacturers in reducing total sugar per
100g (decreasing 4.6% and 1.7% respectively)
• this was not the case for calories in products likely to be consumed on a single
occasion, where manufacturers had a decrease of 1.2% while retailers had an
increase of 3.6%
• in terms of sugar per 100g, manufacturers made greater progress than retailers for
most categories (breakfast cereals, chocolate confectionery, ice cream, lollies and
sorbets, puddings, sweet spreads and sauces, yogurts and fromage frais, cakes,
and morning goods)
• retailers made more progress than manufacturers in biscuits and sweet
confectionery
• for calories per portion, manufacturers made more progress than retailers for
biscuits, chocolate confectionery, yogurts and fromage frais, cakes, and morning
goods
• however, this was not the case for ice cream, lollies and sorbets, puddings and
sweet confectionery where retailers had larger decreases or smaller increases in
calories per portion than manufacturers (Table 2 and 4)

Sugar reduction: report on progress between 2015 and 2019
34
Figure 7: Percentage change in sales weighted average total sugar per 100g by category between baseline (2015) and year 3 (2019) for retailers and manufacturer branded products
Manufacturers Retailers
Overall -1.7 -4.6
Biscuits -0.5 -1.5
Breakfast Cereals -13.8 -10.6
Chocolate Confectionery -0.3 -0.2
Ice Cream, Lollies and Sorbets -18.4 -4.5
Puddings -0.2 1.2
Sweet Spreads and Sauces -9.6 10.1
Sweet Confectionery 2.5 -5.1
Yogurts and Fromage Frais -13.4 -12.4
Cakes -11.4 -4.9
Morning Goods -9.1 -1.0
-20 -15 -10 -5 0 5 10 15
Change in Sales Weighted Average Sugar (%)
Manufacturers
Retailers
Sugar reduction: report on progress between 2015 and 2019
35
Figure 8: Percentage change in sales weighted average calories for products likely to be consumed on a single occasion by category between baseline (2015) and year 3 (2019) for retailers and manufacturer branded products
Manufacturers Retailers
Overall -1.2 3.6
Biscuits -1.6 6.6
Chocolate Confectionery -3.2 -2.1
Ice Cream, Lollies and Sorbets 5.1 -5.8
Puddings 10.7 4.1
Sweet Confectionery -2.1 -2.8
Yogurts and Fromage Frais -8.3 -6.3
Cakes -1.0 6.6
Morning Goods -0.4 5.3
-10 -5 0 5 10 15Change in Sales Weighted Average Calories per Single Serve Portion (%)
Manufacturers
Retailers

Sugar reduction: report on progress between 2015 and 2019
36
Decrease in sugar of more
than 2% =
44%
Change of less than 2% =
37%
Increase in sugar of more
than 2% =
19%
Differences between retailers and manufacturers
This section looks at the brand level analysis reported in Table 4. The top selling 20
brands in each category (based on volume of sales) were analysed for changes in
sugar content. The analysis was completed separately for the top 20 selling retailer
brands and top 20 selling manufacturer brands18.
Any brand owned by businesses who did not give permission for their sales weighted
averages to be shown have had their figures suppressed in the report tables. There
were also some businesses which did not respond to the request to show their data,
and others where the results were removed because they were not felt to be
comparable between the baseline and year 319.
In total, 258 retailers and manufacturer branded products were analysed and of these,
Figure 9 shows that:
• 114 brands (44%) showed a decrease in sales weighted average total sugar
content per 100g of more than 2%20
• 50 brands (19%) showed an increase in sales weighted average total sugar content
per 100g of more than 2%
• 94 brands (37%) showed either no change or a change of less than 2% (Appendix
Table 4)
Figure 9: Proportion of brands showing changes of 2% or more in the sales weighted average total sugar per 100g between baseline (2015) and year 3 (2019)
18 Manufacturer brands were only included if they contributed more than 1% of sales in both the baseline year and year 3. This
was to avoid including comparisons which may only be based on a small number of products. 19 In all these cases, the data for these brands was still used to calculate overall and category level averages. 20 The figure of 2% was chosen so that a reasonable number of brands would show a difference of more than this, given that
the average decrease is 3.0%.

Sugar reduction: report on progress between 2015 and 2019
37
Figure 10 shows the same information but within each category. It also includes the
proportion of brands where the sales weighted averages were either not comparable
between years or the business did not give permission for their data to be shown.
It shows that:
• the highest proportion of brands with a decrease in their sales weighted average
total sugar per 100g of 2% or more were in the breakfast cereals (65%) and yogurts
and fromage frais (58%) categories
• puddings (34%), biscuits (27%), sweet spreads and sauces (27%) and chocolate
confectionery (21%) were the categories with the highest proportion of brands
increasing their sales weighted average total sugar per 100g by 2% or more
(Table 4)

Sugar reduction: report on progress between 2015 and 2019
38
Figure 10: Proportion of brands showing changes of 2% or more in the sales weighted average total sugar per 100g between baseline (2015) and year 3 (2019) by category
22%
65%
3%
26%
26%
33%
39%
58%
32%
35%
38%
25%
51%
5%
23%
23%
34%
17%
32%
35%
27%
5%
21%
5%
34%
27%
13%
8%
26%
24%
14%
5%
26%
64%
17%
17%
13%
17%
11%
6%
0% 20% 40% 60% 80% 100%
Biscuits
Breakfast Cereals
Chocolate Confectionery
Ice Cream, Lollies and Sorbets
Puddings
Sweet Spreads and Sauces
Sweet Confectionery
Yogurts and Fromage Frais
Cakes
Morning Goods
Decrease in sugar of more than 2% Change of less than 2% Increase in sugar of more than 2% Not comparable/No permission
Sugar reduction: report on progress between 2015 and 2019
39
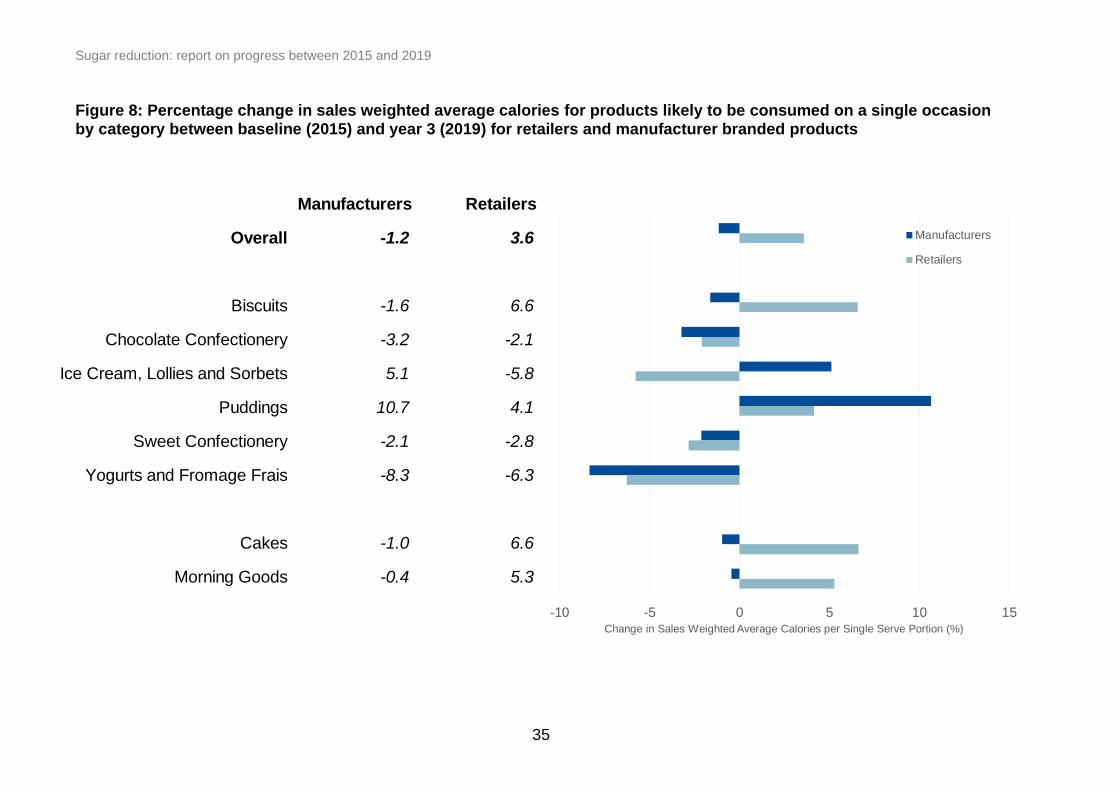
For the 114 brands which showed a decrease in sales weighted average sugar content
of more than 2%, further analysis was conducted to see if this resulted in an increase in
saturated fat.
Of these brands, Figure 11 shows that:
• 19 brands (17%) showed a decrease in saturated fat of more than 10%21
• 30 brands (26%) showed no change or a change of less than 10% in saturated fat
• 11 brands (10%) showed an increase in saturated fat of more than 10%
• the remaining 54 brands (47%) did not have a valid saturated fat value (Appendix
Table 4).
Figure 11: Analysis of changes in saturated fat for top selling brands with more than a 2% decrease in sugar
There is also an assessment of changes in salt content, available in Appendix Table 4.
21 The figure of 10% was chosen as it would clearly show where brands were clearly adding saturated fat to compensate for a
decrease in sugar.
Increase in saturated fat
10%
No change or small change in
saturated fat
26%
Decrease in saturated fat
17%
No valid saturated fat
value
47%

Sugar reduction: report on progress between 2015 and 2019
40
Progress at business level
Figure 12 shows comparisons between baseline (2015) and year 3 (2019) for the sales
weighted average total sugar per 100g at business level for retailers and
manufacturers. The green dotted line represents the 20% reduction ambition for 2020.
It can be seen that very few businesses have reached this ambition so far and some
had increases in their sales weighted average total sugar per 100g (Figure 12 and
Appendix Table 2).
A restriction on the use of the data from Kantar FMCG meant that businesses had to
give permission to have their results shown in Figure 12 and Appendix Table 2.
Therefore, some data has been omitted where permission was not given, and some
additional data has been removed where there were concerns around the comparability
of the results between baseline and year 3.
Figure 13 shows a similar comparison between baseline (2015) and year 3 (2019) for
the sales weighted average calories (kcals) for products likely to be consumed on a
single occasion at a business level for retailers and manufacturers (Appendix Table 3).
The same restrictions apply in terms of requiring permission to show businesses figures
and non-comparable figures have also been removed. Puddings have not been
included in Figure 12 and 13 as the analysis of this category is additionally complicated
by the inclusion of more mince pies in 2019 than in the baseline data, due to
improvements in the coverage of seasonal products during this period. Therefore,
analysis for this category both including and excluding this product are shown in
Appendix Table 2 and 3.
Progress at product level
Appendix Table 5 shows the calories in products likely to be consumed on a single
occasion for the top 30 products by total servings for each category. Of the 135
products where it is possible to make a comparison between the baseline and year 3,
39 (29%) show a decrease in calories per serving of 2% or more.

Sugar reduction: report on progress between 2015 and 2019
41
Figure 12: Changes in sales weighted average total sugar per 100g by category and business between baseline (2015) and year 3 (2019) for retailers and manufacturer branded products
Manufacturers Retailers
Biscuits 0% Biscuits -1%
Burton's Biscuit Company -3% ALDI Stores Ltd 0%
Foxs Biscuits Ltd No response Asda Stores Ltd -9%
Kellogg Co. of GB Ltd -6% Co-op -6%
Mondelez International -5% Iceland Foods Ltd N/A
Nestle UK -1% Lidl UK 4%
Pladis 1% Marks and Spencer plc 1%
Thomas Tunnocks Ltd No response Sainsbury’s Plc -3%
Tesco Food Stores Ltd -4%
Waitrose & Partners -5%
WM Morrisons Supermarkets Plc -4%
Breakfast Cereals -14% Breakfast Cereals -11%
Cereal Partners UK -9% ALDI Stores Ltd -12%
Kellogg Co. of GB Ltd -11% Asda Stores Ltd -10%
PepsiCo -16% Co-op Not comparable
Weetabix Ltd -17% Iceland Foods Ltd N/A
Lidl UK -15%
Marks and Spencer plc 0%
Sainsbury’s Plc -15%
Tesco Food Stores Ltd -13%
Waitrose & Partners -16%
WM Morrisons Supermarkets Plc 1%
Cakes -5%
ALDI Stores Ltd 4%
Asda Stores Ltd -6%
Lidl UK 1%
Marks and Spencer plc -4%
Pladis 3%
Premier Foods -4%
Sainsbury’s Plc -3%
Samworth Brothers Not comparable
Tesco Food Stores Ltd Not comparable
WM Morrisons Supermarkets Plc -1%
Note:
2. Manufacturers and retailers are listed in alphabetical order within each category. They are not listed by volume of sugar sales. The list includes those who account for the top 80% of sugar sales. For
manufacturers, any businesses which did not have at least 1% of sales in 2015 and 2019 were removed.
1. The baseline year for cakes and morning goods is 2017 rather than 2015. The list of businesses for cakes and morning goods is a combined list of manufacturers and retailers.
-30% -20% -10% 0% 10% 20% 30% -30% -20% -10% 0% 10% 20% 30%

Sugar reduction: report on progress between 2015 and 2019
42
Manufacturers Retailers
Chocolate Confectionery 0% Chocolate Confectionery 0%
Mars Wrigley Confectionery UK Ltd 0% ALDI Stores Ltd 2%
Mondelez International 0% Asda Stores Ltd 0%
Nestle UK 0% Co-op -11%
Lidl UK -1%
Marks and Spencer plc 1%
Sainsbury’s Plc -2%
Tesco Food Stores Ltd -1%
Waitrose & Partners 7%
Wilko Retail Ltd -7%
WM Morrisons Supermarkets Plc 0%
Ice Cream, Lollies and Sorbets -18% Ice Cream, Lollies and Sorbets -4%
Froneri -14% ALDI Stores Ltd 5%
Unilever UK -23% Asda Stores Ltd -7%
Co-op 0%
Iceland Foods Ltd -8%
Lidl UK 8%
Marks and Spencer plc Not comparable
Sainsbury’s Plc -9%
Tesco Food Stores Ltd -25%
Waitrose & Partners Not comparable
WM Morrisons Supermarkets Plc 9%
Morning Goods -6%
ALDI Stores Ltd Not comparable
Asda Stores Ltd -2%
Co-op -4%
Lidl UK Not comparable
Marks and Spencer plc Not comparable
Sainsbury’s Plc -3%
Tesco Food Stores Ltd -3%
Waitrose & Partners Not comparable
Warburtons Ltd Not comparable
WM Morrisons Supermarkets Plc -7%
Note:
1. The baseline year for cakes and morning goods is 2017 rather than 2015. The list of businesses for cakes and morning goods is a combined list of manufacturers and retailers.
2. Manufacturers and retailers are listed in alphabetical order within each category. They are not listed by volume of sugar sales. The list includes those who account for the top 80% of sugar sales. For
manufacturers, any businesses which did not have at least 1% of sales in 2015 and 2019 were removed.
-30% -20% -10% 0% 10% 20% 30% -30% -20% -10% 0% 10% 20% 30%

Sugar reduction: report on progress between 2015 and 2019
43
Manufacturers Retailers
Sweet Spreads and Sauces -10% Sweet Spreads and Sauces 10%
Chocolate Spreads 0% Chocolate Spreads -5%
Ferrero UK Ltd -1% ALDI Stores Ltd -11%
Asda Stores Ltd -10%
Co-op 0%
Costco Wholesale UK Ltd N/A
Lidl UK 15%
Marks and Spencer plc N/A
Sainsbury’s Plc 0%
Tesco Food Stores Ltd -7%
Waitrose & Partners 13%
WM Morrisons Supermarkets Plc -7%
Dessert Toppings 3% Dessert Toppings 0%
The Silver Spoon Company 1% ALDI Stores Ltd -49%
Asda Stores Ltd Not comparable
Co-op 0%
Marks and Spencer plc Not comparable
Sainsbury’s Plc 10%
Tesco Food Stores Ltd -11%
Waitrose & Partners -5%
WM Morrisons Supermarkets Plc Not comparable
Note:
1. The baseline year for cakes and morning goods is 2017 rather than 2015. The list of businesses for cakes and morning goods is a combined list of manufacturers and retailers.
2. Manufacturers and retailers are listed in alphabetical order within each category. They are not listed by volume of sugar sales. The list includes those who account for the top 80% of sugar sales. For
manufacturers, any businesses which did not have at least 1% of sales in 2015 and 2019 were removed.
-30% -20% -10% 0% 10% 20% 30%-30% -20% -10% 0% 10% 20% 30%

Sugar reduction: report on progress between 2015 and 2019
44
Manufacturers Retailers
Fruit Spreads 5% Fruit Spreads -13%
St Dalfour No permission Marks and Spencer plc N/A
Sweet Confectionery 2% Sweet Confectionery -5%
Dunhills PLC - Haribo 0% ALDI Stores Ltd -3%
Mars Wrigley Confectionery UK Ltd 1% Asda Stores Ltd 0%
Mondelez International 3% Co-op Not comparable
Nestle UK 0% Lidl UK -2%
Pervetti Van Melle - PVM UK -2% Marks and Spencer plc -1%
Swizzels Matlow Ltd No response Sainsbury’s Plc -3%
Valeo Foods -8% Tesco Food Stores Ltd -11%
TJ Morris No response
Waitrose & Partners -2%
WM Morrisons Supermarkets Plc -2%
Yogurts and Fromage Frais -13% Yogurts and Fromage Frais -12%
Danone UKI -15% ALDI Stores Ltd -17%
Muller UK and Ireland No permission Asda Stores Ltd -15%
Yeo Valley Farms (Production) Ltd -11% Co-op -22%
Yoplait -18% Iceland Foods Ltd Not comparable
Lidl UK -8%
Marks and Spencer plc -8%
Sainsbury’s Plc -4%
Tesco Food Stores Ltd -16%
Waitrose & Partners -15%
WM Morrisons Supermarkets Plc -13%
Note:
1. The baseline year for cakes and morning goods is 2017 rather than 2015. The list of businesses for cakes and morning goods is a combined list of manufacturers and retailers.
2. Manufacturers and retailers are listed in alphabetical order within each category. They are not listed by volume of sugar sales. The list includes those who account for the top 80% of sugar sales. For
manufacturers, any businesses which did not have at least 1% of sales in 2015 and 2019 were removed.
-30% -20% -10% 0% 10% -30% -20% -10% 0% 10% 20% 30%

Sugar reduction: report on progress between 2015 and 2019
45
Figure 13: Changes in sales weighted average calories (kcals) for products likely to be consumed on a single occasion by category and business between baseline (2015) and year 3 (2019) for retailers and manufacturer branded products
Manufacturers Retailers
Biscuits -2% Biscuits 7%
Burton's Biscuit Company -4% ALDI Stores Ltd 2%
Foxs Biscuits Ltd No response Asda Stores Ltd 2%
General Mills UK 3% Co-op Not comparable
Kellogg Co. of GB Ltd 0% Lidl UK -2%
Mondelez International -1% Marks and Spencer plc -3%
Nestle UK -1% Sainsbury’s Plc Not comparable
Pladis -5% Tesco Food Stores Ltd Not comparable
Thomas Tunnocks Ltd No response TJ Morris No response
Waitrose & Partners -16%
WM Morrisons Supermarkets Plc -23%
Cakes 2%
ALDI Stores Ltd -5%
Asda Stores Ltd 1%
Finsbury Food Group -8%
General Mills UK N/A
Pladis 4%
Premier Foods 1%
Sainsbury’s Plc 11%
Samworth Brothers Not comparable
Tesco Food Stores Ltd 18%
WM Morrisons Supermarkets Plc -11%
Chocolate Confectionery -3% Chocolate Confectionery -2%
Mars Wrigley Confectionery UK Ltd 2% ALDI Stores Ltd 3%
Mondelez International -4% Asda Stores Ltd 5%
Nestle UK -5% Co-op Not comparable
Lidl UK Not comparable
Marks and Spencer plc Not comparable
Sainsbury’s Plc -22%
Tesco Food Stores Ltd -14%
TJ Morris No response
Wilko Retail Ltd -3%
WM Morrisons Supermarkets Plc 1%
Note:
1. The baseline year for cakes and morning goods is 2017 rather than 2015. The list of businesses for cakes and morning goods is a combined list of manufacturers and retailers.
2. Manufacturers and retailers are listed in alphabetical order within each category. They are not listed by volume of servings. The list includes those who account for the top 80% of servings. For manufacturers, any
businesses which did not have at least 1% of servings in 2015 and 2019 were removed.
-30% -20% -10% 0% 10% 20% 30% -30% -20% -10% 0% 10% 20% 30%

Sugar reduction: report on progress between 2015 and 2019
46
Manufacturers Retailers
Ice Cream, Lollies and Sorbets 5% Ice Cream, Lollies and Sorbets -6%
Froneri 7% ALDI Stores Ltd 9%
Unilever UK -4% Asda Stores Ltd -14%
Co-op -11%
Iceland Foods Ltd -13%
Lidl UK 31%
Marks and Spencer plc Not comparable
Sainsbury’s Plc -20%
Tesco Food Stores Ltd -14%
Waitrose & Partners -2%
WM Morrisons Supermarkets Plc -12%
Morning Goods 3%
ALDI Stores Ltd 1%
Asda Stores Ltd Not comparable
Brioche Pasquier SA No permission
Lidl UK -6%
Marks and Spencer plc Not comparable
New York Bagel Co Ltd No response
Sainsbury’s Plc Not comparable
Tesco Food Stores Ltd 16%
Warburtons Ltd -4%
WM Morrisons Supermarkets Plc 1%
Note:
1. The baseline year for cakes and morning goods is 2017 rather than 2015. The list of businesses for cakes and morning goods is a combined list of manufacturers and retailers.
2. Manufacturers and retailers are listed in alphabetical order within each category. They are not listed by volume of servings. The list includes those who account for the top 80% of servings. For manufacturers,
any businesses which did not have at least 1% of servings in 2015 and 2019 were removed.
-30% -20% -10% 0% 10% 20% 30% -30% -20% -10% 0% 10% 20% 30%

Sugar reduction: report on progress between 2015 and 2019
47
Manufacturers Retailers
Sweet Confectionery -2% Sweet Confectionery -3%
Cloetta UK Ltd 1% ALDI Stores Ltd Not comparable
Cornscape Ltd No response Asda Stores Ltd -5%
Dunhills PLC - Haribo 7% Co-op Not comparable
Kellogg Co. of GB Ltd 0% Lidl UK -58%
KP Snacks Limited -8% Marks and Spencer plc Not comparable
Nestle UK 15% Sainsbury’s Plc -1%
Pervetti Van Melle - PVM UK -6% Tesco Food Stores Ltd Not comparable
Swizzels Matlow Ltd No response TJ Morris No response
Valeo Foods 19% Waitrose & Partners Not comparable
WM Morrisons Supermarkets Plc Not comparable
Yogurts and Fromage Frais -8% Yogurts and Fromage Frais -6%
Danone UKI -12% ALDI Stores Ltd -14%
Muller UK and Ireland No permission Asda Stores Ltd -8%
Co-op 0%
Iceland Foods Ltd Not comparable
Lidl UK -1%
Marks and Spencer plc -9%
Sainsbury’s Plc -16%
Tesco Food Stores Ltd -11%
Waitrose & Partners 24%
WM Morrisons Supermarkets Plc 1%
Note:
2. Manufacturers and retailers are listed in alphabetical order within each category. They are not listed by volume of servings. The list includes those who account for the top 80% of servings. For manufacturers,
any businesses which did not have at least 1% of servings in 2015 and 2019 were removed.
1. The baseline year for cakes and morning goods is 2017 rather than 2015. The list of businesses for cakes and morning goods is a combined list of manufacturers and retailers.
-30% -20% -10% 0% 10% 20% 30%-30% -20% -10% 0% 10% 20% 30%

Sugar reduction: report on progress between 2015 and 2019
48
Volume of sales for retailers and manufacturer branded products
This section looks at the volume of sales for the categories included in the sugar
reduction programme and change between baseline (2015) and year 3 (2019) for
retailers and manufacturer branded products.
For this analysis data for cakes and morning goods are excluded. This is due to
substantially more products being captured for these categories in year 3 (2019)
compared to other years due to improvements in data collection (see Appendix Table 1
for the number of products).
Therefore, the sales figures quoted in this section are underestimates of the total
amount of sugar purchased because cakes and morning goods are excluded.
The section is split into 2 parts:
1. Total sales of sugar – this analysis looks at the volume of sugar being purchased
and how this has changed over time.
2. Total volume sales – this analysis looks at the volume of products being purchased.
It is important to look at how the total volume sales for each product and category vary
over time as the product level sales are being used to weight the contribution of each
product in the sales weighted average calculation. Therefore, if the sales of higher
sugar content products increase relative to lower sugar content products then this can
lead to an increase in the sales weighted average, even if some of those higher sugar
products have been reformulated to decrease their sugar content. In other words,
increases in sales of some of the higher sugar categories and/or decreases in lower
sugar categories can neutralise any reformulation work overall, as the average product
purchased will have a higher average sugar content.
Total sales of sugar
Figure 14 shows the sales in tonnes of sugar sold by category (excluding cakes and
morning goods) for baseline and year 3. Figure 15 shows how this has changed over
time.
For retailers and manufacturers, it can be seen that:
• overall there has been an increase from 723,103 tonnes of sugar sold at baseline to
741,966 tonnes in year 3 which represents an increase of 2.6% (the overall sugar
sales are shown in Figure 15)
• as the population of Great Britain increased during this period the increase in sugar
sold represents no change in sugar purchased per person from the food product
categories included in the programme

Sugar reduction: report on progress between 2015 and 2019
49
• the largest increases in tonnes of sugar sold were 16.3% for chocolate
confectionery, 7.2% for sweet confectionery, 6.1% for sweet spreads and sauces,
and 5.7% for biscuits
• the largest decreases were 15.9% for yogurts and fromage frais, 13.9% for
breakfast cereals and 4.0% for puddings (Table 5)

Sugar reduction: report on progress between 2015 and 2019
50
Figure 14: Sales of sugar by category in baseline (2015) and year 3 (2019) for retailers and manufacturer branded products
Baseline Year 3
Biscuits 158,366 167,316
Breakfast Cereals 84,315 72,570
Chocolate Confectionery 169,315 196,868
Ice Cream, Lollies and Sorbets 64,608 65,146
Puddings 75,154 72,155
Sweet Spreads and Sauces 11,979 12,705
Sweet Confectionery 91,616 98,257
Yogurts and Fromage Frais 67,750 56,949
Note: Cakes and morning goods are excluded from this chart. This is because there are around 50% more products in the 2019 dataset compared
to 2017 so a comparison of sales would show a large increase which would be due to an increase in data quality rather than an increase in sales.
0 50,000 100,000 150,000 200,000 250,000
Sugar Sales (tonnes)
BaselineYear 3

Sugar reduction: report on progress between 2015 and 2019
51
Figure 15: Percentage change in sales of sugar by category between baseline (2015) and year 3 (2019) for retailers and manufacturer branded products
% Change
Overall 2.6
Biscuits 5.7
Breakfast Cereals -13.9
Chocolate Confectionery 16.3
Ice Cream, Lollies and Sorbets 0.8
Puddings -4.0
Sweet Spreads and Sauces 6.1
Sweet Confectionery 7.2
Yogurts and Fromage Frais -15.9
Note: Cakes and morning goods are excluded from this chart. This is because there are around 50% more products in the 2019 dataset compared
to 2017 so a comparison of sales would show a large increase which would be due to an increase in data quality rather than an increase in sales.
-20 -10 0 10 20
Change in Sugar Sales (%)

Sugar reduction: report on progress between 2015 and 2019
52
Total volume sales
This section looks at the total volume of sales in the same categories (excluding cakes
and morning goods). It firstly looks at the actual level of sales and then it analyses the
proportion of sales each category contributes to the overall total, as this indicates the
contribution each category is making to the overall sales weighted average22.
Figure 16 shows the total volume sales by category for baseline and year 3 and Figure
17 shows how this has changed over time.
For retailers and manufacturers, they show that:
• overall there has been an increase from 2,804,089 tonnes of products sold at
baseline to 2,900,197 tonnes in year 3 which represents an increase of 3.4% (the
overall total sales are shown in Figure 17)
• as the population of Great Britain increased during this period, the increase in tonnes
of products sold represents a 0.8% increase per person from food product categories
included in the programme
• sales decreased in 3 categories: breakfast cereals (down 0.5%), puddings (down
3.0%), and yogurts and fromage frais (down 3.3%)
• there were increases in sales in other categories including chocolate confectionery
(up 16.3%), sweet spreads and sauces (up 12.0%), ice cream, lollies and sorbets (up
8.0%), sweet confectionery (up 7.3%) and biscuits (up 6.8%) (Table 5)
22 The sugar content of each product is weighted according to its total sales in the calculation of the sales weighted average.
Therefore, looking at how the proportion of sales each category contributes to the total and how this has changed between
baseline and year 3 is a good proxy for seeing how the contribution of high and low sugar products will have changed over
time.

Sugar reduction: report on progress between 2015 and 2019
53
Figure 16: Total volume sales by category in baseline (2015) and year 3 (2019) for retailers and manufacturer branded products
Baseline Year 3
Biscuits 506,159 540,424
Breakfast Cereals 502,302 499,652
Chocolate Confectionery 313,539 364,743
Ice Cream, Lollies and Sorbets 345,415 373,029
Puddings 397,704 385,713
Sweet Spreads and Sauces 39,301 44,003
Sweet Confectionery 151,607 162,610
Yogurts and Fromage Frais 548,062 530,023
Note: Cakes and morning goods are excluded from this chart. This is because there are around 50% more products in the 2019 dataset compared
to 2017 so a comparison of sales would show a large increase which would be due to an increase in data quality rather than an increase in sales.
0 150,000 300,000 450,000 600,000
Total Sales (tonnes)
Baseline
Year 3

Sugar reduction: report on progress between 2015 and 2019
54
Figure 17: Percentage change in total volume sales by category between baseline (2015) and year 3 (2019) for retailers and manufacturer branded products
% Change
Overall 3.4
Biscuits 6.8
Breakfast Cereals -0.5
Chocolate Confectionery 16.3
Ice Cream, Lollies and Sorbets 8.0
Puddings -3.0
Sweet Spreads and Sauces 12.0
Sweet Confectionery 7.3
Yogurts and Fromage Frais -3.3
Note: Cakes and morning goods are excluded from this chart. This is because there are around 50% more products in the 2019 dataset compared
to 2017 so a comparison of sales would show a large increase which would be due to an increase in data quality rather than an increase in sales.
-10 0 10 20
Change in Total Sales (%)

Sugar reduction: report on progress between 2015 and 2019
55
Figure 18 shows the proportion of sales each food category contributes to overall total
volume sales and Figure 19 shows how this has changed over time.
For retailers and manufacturers, they show that in 2019:
• biscuits (18.6%), yogurts and fromage frais (18.3%), and breakfast cereals (17.2%)
account for over half the sales from the 8 categories shown
• by contrast, sweet spreads and sauces account for only 1.5% of sales
• the proportion of sales accounted for by yogurts and fromage frais, and breakfast
cereals has fallen by 1.3 percentage points and 0.7 percentage points respectively,
meaning that although these categories had large reductions in their total sugar
sales weighted average per 100g, the impact of this improvement on the overall
sugar reduction (across all categories) will have been diluted as their proportion of
sales has reduced
• the proportion of sales accounted for by chocolate confectionery has increased by
1.4 percentage points which will increase the overall sales weighted average
(across all categories) as it is one of the categories with the highest sugar content
(Table 5)

Sugar reduction: report on progress between 2015 and 2019
56
Figure 18: Percentage of total volume sales by category in baseline (2015) and year 3 (2019) for retailers and manufacturer branded products
Baseline Year 3
Biscuits 18.1 18.6
Breakfast Cereals 17.9 17.2
Chocolate Confectionery 11.2 12.6
Ice Cream, Lollies and Sorbets 12.3 12.9
Puddings 14.2 13.3
Sweet Spreads and Sauces 1.4 1.5
Sweet Confectionery 5.4 5.6
Yogurts and Fromage Frais 19.5 18.3
Note: Cakes and morning goods are excluded from this chart. This is because there are around 50% more products in the 2019 dataset compared
to 2017 so a comparison of sales would show a large increase which would be due to an increase in data quality rather than an increase in sales.
0 5 10 15 20 25
Proportion of Total Sales (%)
Baseline
Year 3

Sugar reduction: report on progress between 2015 and 2019
57
% pt Change
Biscuits 0.6
Breakfast Cereals -0.7
Chocolate Confectionery 1.4
Ice Cream, Lollies and Sorbets 0.5
Puddings -0.9
Sweet Spreads and Sauces 0.1
Sweet Confectionery 0.2
Yogurts and Fromage Frais -1.3
Note: Cakes and morning goods are excluded from this chart. This is because there are around 50% more products in the 2019 dataset
compared to 2017 so a comparison of sales would show a large increase which would be due to an increase in data quality rather than an
increase in sales.
-2 -1 0 1 2
Change in Proportion of Total Sales (% pts)
Figure 19: Percentage point change in the proportion of total volume sales by category between baseline (2015) and year 3 (2019) for retailers and manufacturer branded products

Sugar reduction: report on progress between 2015 and 2019
58
Eating out of home sector
This section focuses on progress made by businesses operating in the eating out of
home sector, which covers businesses such as:
• quick service restaurants
• casual dining restaurants
• contract caterers (foodservice)
• cafés and coffee shops
• sandwich and bakery led shops
• pubs
• vending
• retail food on the go
• takeaway and delivery services23
Due to limitations in the data, simple averages are the sole metric used to assess
progress in this sector. More information is given in Appendix 2, however in summary, it
is not possible to link purchases and nutrition data in the eating out of home sector with
the same level of accuracy as for retailers and manufacturer branded products.
Simple averages for each category in the eating out of home sector are presented in
this chapter, in addition to a comparison with the simple averages for retailers and
manufacturer branded products as presented earlier.
Quality of data
There are fewer products in the eating out of home sector dataset (1,112 in 2019 with
data for sugar per 100g and 2,300 with data for calories per single serve portion)
compared with the data for retailers and manufacturer branded products (15,465 for
sugar per 100g and 6,435 for calories per single serve portion). In the commentary
which follows, large changes based on a small number of products are mentioned as
potentially not being robust. Also, some very large changes which were based on quite
different sets of products in each year have been removed, because the products were
not considered comparable between the 2 years.
Data for contract caterers is not presented in this report as there is much less data for
these types of businesses in year 3, making meaningful comparisons very difficult.
23 The data for the eating out of home sector only captures purchases which are not eaten at home, therefore very few
purchases of takeaways and delivery services are included in this assessment of progress. However, the overall ambition
remains inclusive of these business models.

Sugar reduction: report on progress between 2015 and 2019
59
Time periods covered
No data is available for the baseline period of 2015, so comparisons are made between
year 1 (2017) and year 3 (2019). This is primarily due to a change in data provider
between 2015 and 2017 and more detail on this is given in the year 1 report. Therefore,
for the eating out of home sector, year 1 is the baseline for the analysis in this report.
Simple average total sugar per 100g for the eating out of home sector products
Figures 20 and 21 show the simple average total sugar at category level and overall for
year 1 (2017 – baseline year for the analysis for this sector) and year 3 (2019), and the
change during this period.
For businesses in the eating out of home sector:
• overall there has been hardly any change in the simple average sugar content from
24.6g per 100g in 2017 to 24.5g/100g in 2019
• the largest decreases were 17.1% for breakfast cereals, 6.8% for cakes, and 3.9%
for biscuits
• there was an increase for chocolate confectionery of 10.7% (Table 8)

Sugar reduction: report on progress between 2015 and 2019
60
Figure 20: Simple average total sugar (g/100g) by category for year 1 (2017) and year 3 (2019) for products in the eating out of home sector
Year 1 Year 3
Overall 24.6 24.5
Biscuits 33.6 32.3
Breakfast Cereals 9.3 7.7
Cakes 31.6 29.4
Chocolate Confectionery 44.4 49.2
Ice Cream, Lollies and Sorbets 22.0 21.5
Morning Goods 15.1 15.0
Puddings 22.5 23.1
Sweet Confectionery N/A N/A
Yogurts and Fromage Frais 11.3 11.6
Note: Data for sweet confectionery has been excluded as the businesses providing data for 2019 were quite different to those providing data in 2017
so comparisons were not reliable. It is also excluded from the "Overall" row as it was found to be distorting the comparison.
0 20 40 60
Simple Average Sugar (g/100g)
Year 1
Year 3

Sugar reduction: report on progress between 2015 and 2019
61
Figure 21: Percentage change in simple average total sugar (g/100g) by category between year 1 (2017) and year 3 (2019) for products in the eating out of home sector
% Change
Overall -0.3
Biscuits -3.9
Breakfast Cereals -17.1
Cakes -6.8
Chocolate Confectionery 10.7
Ice Cream, Lollies and Sorbets -2.3
Morning Goods -0.4
Puddings 2.4
Sweet Confectionery N/A
Yogurts and Fromage Frais 2.4
Note: Data for sweet confectionery has been excluded as the businesses providing data for 2019 were quite different to those providing data in 2017
so comparisons were not reliable. It is also excluded from the "Overall" row as it was found to be distorting the comparison.
-20 -15 -10 -5 0 5 10 15Change in Simple Average Sugar (%)

Sugar reduction: report on progress between 2015 and 2019
62
Simple average calories in products likely to be consumed on a single occasion
(single serve) in the eating out of home sector
Figures 22 and 23 show the simple average calorie content of products likely to be
consumed on a single occasion at category level and overall for year 1 (2017) and year
3 (2019), and the change during this period.
It can be seen that:
• overall there has been a decrease in average calories per single serve portion from
394 kcals in 2017 to 355 kcals in 2019 which represents a decrease of 9.7% (Figure
22)
• ice creams, lollies and sorbets (down 17.6%), cakes (down 11.5%) and puddings
(down 9.1%) showed the largest decreases
• chocolate confectionery had the largest increase in calories per single serve portion
(up 6.1%)
• other categories had smaller changes (Table 9)

Sugar reduction: report on progress between 2015 and 2019
63
Figure 22: Simple average calories (kcals) for products likely to be consumed on a single occasion by category for year 1 (2017) and year 3 (2019) for products in the eating out of home sector
Year 1 Year 3
Overall 394 355
Biscuits 270 258
Breakfast Cereals 253 258
Cakes 416 368
Chocolate Confectionery 155 164
Ice Cream, Lollies and Sorbets 386 318
Morning Goods 357 347
Puddings 524 476
Sweet Confectionery N/A N/A
Yogurts and Fromage Frais 245 247
Note: Data for sweet confectionery has been excluded as the businesses providing data for 2019 were quite different to those providing data in 2017
so comparisons were not reliable. It is also excluded from the "Overall" row as it was found to be distorting the comparison.
0 100 200 300 400 500 600
Simple Average Calories per portion (kcal)
Year 1
Year 3

Sugar reduction: report on progress between 2015 and 2019
64
% Change
Overall -9.7
Biscuits -4.4
Breakfast Cereals 1.9
Cakes -11.5
Chocolate Confectionery 6.1
Ice Cream, Lollies and Sorbets -17.6
Morning Goods -2.7
Puddings -9.1
Sweet Confectionery N/A
Yogurts and Fromage Frais 1.0
Note: Data for sweet confectionery has been excluded as the businesses providing data for 2019 were quite different to those providing data in 2017
so comparisons were not reliable. It is also excluded from the "Overall" row as it was found to be distorting the comparison.
-20 -10 0 10Change in Simple Average Sugar (%)
Figure 23: Percentage change in simple average calories for products likely to be consumed on a single occasion by category between year 1 (2017) and year 3 (2019) for products in the eating out of home sector
Sugar reduction: report on progress between 2015 and 2019
65
Differences between the eating out of home sector and retailers and manufacturer
branded products
This section compares the simple average sugar content in the eating out of home
sector with products sold through retailers and manufacturers, as presented earlier in
this report. Only simple averages should be used when comparing across the sectors,
as due to the difficulty of linking sales and nutrition information, sales weighted
averages are not available for the eating out of home sector. The simple average total
sugar per 100g (Figure 24) and the simple average number of calories in products likely
to be consumed on a single occasion (Figure 25) are shown for each sector.
It can be seen that:
• for most categories, the simple average sugar content per 100g in products in the
eating out of home sector is roughly the same as the simple average for retailers and
manufacturer branded products, except for breakfast cereals
• calories in products likely to be consumed on a single occasion in the eating out of
home sector are higher than for retailers and manufacturer branded products across
all categories apart from chocolate confectionery (Tables 1, 3, 8 and 9)

Sugar reduction: report on progress between 2015 and 2019
66
Figure 24: Simple average total sugar per 100g by category in year 3 (2019) for retailers and manufacturer branded products (in home) and products in the eating out of home sector (out of home)
In home Out of home
Biscuits 31.4 32.3
Breakfast Cereals 15.8 7.7
Cakes 33.3 29.4
Chocolate Confectionery 50.7 49.2
Ice Cream, Lollies and Sorbets 19.8 21.5
Morning Goods 15.8 15.0
Puddings 22.9 23.1
Sweet Confectionery 59.1 N/A
Yogurts and Fromage Frais 11.3 11.6
Note: Data for sweet confectionery has been excluded for out of home as the businesses providing data for 2019 were quite different to those providing data
in 2017 so comparisons were not reliable.
0 20 40 60 80
Simple Average Sugar (g/100g)
In home
Out of home

Sugar reduction: report on progress between 2015 and 2019
67
Figure 25: Simple average calories for products likely to be consumed on a single occasion by category in year 3 (2019) for retailers and manufacturer branded products (in home) and products in the eating out of home sector (out of home)
In home Out of home
Biscuits 148 258
Breakfast Cereals N/A 258
Cakes 180 368
Chocolate Confectionery 219 164
Ice Cream, Lollies and Sorbets 147 318
Morning Goods 203 347
Puddings 234 476
Sweet Confectionery 210 N/A
Yogurts and Fromage Frais 141 247
Note: Data for sweet confectionery has been excluded for out of home as the businesses providing data for 2019 were quite different to those providing data
in 2017 so comparisons were not reliable.
0 100 200 300 400 500 600
Simple Average Calories per portion (kcal)
In home
Out of home

Sugar reduction: report on progress between 2015 and 2019
68
Progress at business level
Figure 26 shows a comparison between year 1 (2017) and year 3 (2019) for the simple average total sugar per 100g at
business level and calories in products likely to be consumed on a single occasion (based on most portions sold). The green
dotted line represents the 20% sugar reduction ambition for 2020. It can be seen that no businesses have achieved this
guideline so far in terms of sugar reduction, though it appears some progress has been made in terms of calories per single
serve portion (Appendix Table 6).
Figure 26: Changes in simple average total sugar per 100g and calories for products likely to be consumed on a single occasion by brand between year 1 (2017) and year 3 (2019)
Sugar Calories
Burger King N/A Burger King -27.4%
Caffe Nero -3.2% Caffe Nero -21.9%
Costa Coffee -10.1% Costa Coffee -16.0%
Greggs -8.1% Greggs -4.8%
JD Wetherspoon N/A JD Wetherspoon -25.1%
KFC N/A KFC -4.7%
McDonald's 2.2% McDonald's -15.4%
Starbucks N/A Starbucks -15.3%
Subway N/A Subway 0.0%
Tesco (Food to Go section) N/A Tesco (Food to Go section) N/A
-20% -10% 0% 10% -30% -20% -10% 0%

Sugar reduction: report on progress between 2015 and 2019
69
Contract caterers
It is not possible to compare the 2019 figures for contract caterers to 2017 because
there are around half the number of products in the 2019 dataset. Therefore, any
comparison would not be made on a like-for-like basis (Table 11).
Soft Drinks Industry Levy
Introduction
The SDIL was announced in the Budget in March 2016 and introduced in April 2018. It
applies to sugar sweetened beverages containing added sugar and was introduced as
part of the government’s initiative to tackle childhood obesity by encouraging
manufacturers and retailers to reduce the sugar content in their drinks products.
There are 2 rates of tax, depending on the sugar content:
• the ‘standard rate’ (18p per litre) applies to drinks with total sugar content between
5g and up to (but not including) 8g per 100ml
• the ‘higher rate’ (24p per litre) applies to drinks with total sugar content equal to or
greater than 8g per 100ml
There is no tax applied to drinks with sugar content of less than 5g per 100ml.
All drinks subject to the SDIL, including those with a sugar content of less than 5g per
100ml, are included in the analysis in this section. It is important to include this lower
sugar group of drinks so that consumers switching from higher sugar drinks and any
reformulation of products can be monitored.
Unsweetened juice and sweetened milk based drinks are not in scope of the SDIL. They
are included in the sugar reduction programme and the first report on progress can be
found in Appendix 3. As detailed in Chapter 2 of the Childhood Obesity Plan and the
prevention green paper Advancing our health: prevention in the 2020s – consultation
document, progress on the interim sugar reduction ambition of 10% for milk based
drinks will be taken into account when HM Treasury reviews the continuation of their
exemption from the SDIL in 2020.

Sugar reduction: report on progress between 2015 and 2019
70
Retailers and manufacturer branded products
Figure 27 shows the sales in litres of products subject to the SDIL for the baseline year
(2015) and year 3 (2019) for retailers and manufacturer branded products. Figure 28
shows the proportion of these sales by the different levy rates.
It can be seen that:
• overall, sales (in litres) of soft drinks classified within the 3 sugar tiers of the levy
have increased by 14.9% from 3,542,574 thousand litres in 2015 to 4,070,902 in
2019, which was due to an increase in sales of drinks containing less than 5g of
sugar per 100ml24
• at the same time the total sugar sales from the soft drinks decreased by 35.4% from
135,501 tonnes in 2015 to 87,602 tonnes in 2019
Further results of this analysis are available in the supplementary data Table 7, which
shows:
• the sales weighted average total sugar content fell from 3.8g per 100ml in 2015 to 2.2g
per 100ml in 2019, which is a decrease of 43.7%
• the sales weighted average number of calories for products likely to be consumed on a
single occasion fell from 64 kcals per single serve to 41 kcals, which is a fall of 35.2%
• there has been a large shift in sales towards lower sugar products, as sales (in litres) of
products with no levy attached (less than 5g sugar per 100ml) have increased by
54.2%, while sales of products with a levy attached have fallen by 79.1% for those in
the 5g to less than 8g per 100ml group and by 54.8% for those in the 8g or more per
100ml group
• the proportion of sales with no levy attached has also increased from 66% to 88% while
the proportion of products with no levy attached has increased from 48% to 78%
24 Drinks containing less than 5g of sugar per 100ml are subject to the SDIL but no tax is applied as their sugar content is
below the taxation threshold.

Sugar reduction: report on progress between 2015 and 2019
71
Figure 27: Sales (thousand litres) of drinks subject to the Soft Drinks Industry Levy by total sugar content per 100ml in baseline (2015) and year 3 (2019) for retailers and manufacturer branded products
Baseline Year 3
Overall 3,542,574 4,070,902
Less than 5g 2,327,806 3,588,853
5g or more but less than 8g 275,797 57,701
8g or more 938,971 424,347
0 1,000,000 2,000,000 3,000,000 4,000,000 5,000,000
Sales (thousand litres)
Baseline
Year 3

Sugar reduction: report on progress between 2015 and 2019
72
Less than 5g66%
5g or more but less than 8g
8%
8g or more26%
Baseline
Less than 5g88%
5g or more but less than
8g1%
8g or more11%
Year 3
Figure 28: Proportion of sales of drinks subject to the Soft Drinks Industry Levy by total sugar content per 100ml in baseline (2015) and year 3 (2019) for retailers and manufacturer branded products

Sugar reduction: report on progress between 2015 and 2019
73
Figure 29 shows how the distribution of products purchased by their sugar content has
changed over time. The curves show the number of products sold by their total sugar
content per 100ml for baseline (2015) and year 3 (2019), and the vertical lines show the
sales weighted average sugar content for the same time periods.
The general shift in the distribution to the left between 2015 and 2019 indicate that
drinks being purchased are on average lower in total sugar per 100ml in year 3 than
they were in the baseline year.
Figure 29: Number of drinks subject to the Soft Drinks Industry Levy purchased by total sugar per 100ml for baseline (2015) and year 3 (2019) for retailers and manufacturer branded products
Note: The lines on this chart are a smoothed line of best fit through the underlying data points which allow the general direction of change to be seen clearly. Therefore, the number of products for a particular sugar content per 100ml is an approximation rather than the exact number. In particular, there are steeper drops than this line indicates close to the sugar content levels where the levy increases.
Figure 30 shows a comparison between baseline (2015) and year 3 (2019) for the sales
weighted average total sugar per 100ml at business level for drinks subject to the SDIL.
While there is no comparable reduction ambition for soft drinks as there is for categories
in the sugar reduction programme, all of the top selling brands have shown a decrease
in their sales weighted average sugar content per 100ml (where figures are available)
and many have reduced this by more than 60% (Appendix Table 2).

Sugar reduction: report on progress between 2015 and 2019
74
Figure 30: Changes in sales weighted average total sugar per 100ml of drinks subject to the Soft Drinks Industry Levy by business between baseline (2015) and year 3 (2019) for retailers and manufacturers
Eating out of home sector
Manufacturers -44% Retailers -44%
AG Barr -53% ALDI Stores Ltd -55%
Britvic Soft Drinks Ltd -59% Asda Stores Ltd -53%
Coca-Cola GB -24% Co-op -62%
Lucozade Ribena Suntory -56% Iceland Foods Ltd -62%
Lidl UK -56%
Marks and Spencer plc -32%
Sainsbury’s Plc -68%
Tesco Food Stores Ltd -62%
Waitrose & Partners -73%
WM Morrisons Supermarkets Plc -71%
Note: The overall percentage change is a combined figure for manufacturers and retailers.
Note: Cott Beverages Ltd are now owned by Refresco Beverages UK Ltd. This is not reflected in the data above
-80% -60% -40% -20% 0%-80% -60% -40% -20% 0%

Sugar reduction: report on progress between 2015 and 2019
75
Although data for the eating out of home sector are more limited, it is possible to look at
changes in sugar and calories between year 1 (2017) and year 3 (2019) and the
distribution of products and sales by the different sugar levy bands for drinks covered by
the SDIL. However, comparisons should be treated with caution as there are a different
number of products analysed in each year (more details are available in Table 10).
The main findings are:
• the simple average total sugar content fell from 5.8g per 100ml in year 1 to 3.6g per
100ml in year 3 (down 38.5%)
• the simple average calorie content for products likely to be consumed on a single
occasion fell from 95 kcals to 59 kcals, which is a fall of 37.7%
• the equivalent year 3 simple averages for retailers and manufacturer branded
products are 3.5g per 100ml and 66 kcals for products likely to be consumed on a
single occasion (Table 7 and 10)
It is not possible to compare the level of sales (expressed as servings) in the eating out
of home sector between 2017 and 2019 as they are based on a different number of
products; 220 products in 2017 and 108 products in 2018. Therefore, the fall in the
number of servings would be due to data for less products being collected rather than a
real decrease in servings.
Retailers and manufacturer branded products – analysis by socio-economic group
This section looks at changes in the sales of products subject to the SDIL by socio-
economic group of households for retailers and manufacturer branded products. The
groups considered are:
• A: higher managerial, administrative and professional workers
• B: intermediate managerial, administrative and professional workers
• C1: supervisory, clerical and junior managerial, administrative and professional
workers
• C2: skilled manual workers
• D: semi-skilled and unskilled manual workers
• E: people on long term state benefits, casual and lowest grade workers,
unemployed with state benefits only
The Kantar FMCG data assigns each household to a group based on the head of the
household. Groups A and B are combined in the dataset.
Group E is quite different to the other groups in terms of the number of people in the
household and the age of the main shopper. This group made up only 11.5% of
households in the 2019 dataset. In year 3, 48% of the main shoppers in Group E were
retired compared with 28% for the dataset as a whole. Group E had more single person

Sugar reduction: report on progress between 2015 and 2019
76
households (55%) compared with 31% for all the groups combined, and fewer families25
(11% of the households in the group) compared with 28% for all the groups combined.
The analyses presented here do not take into account differences in household
structure and how this may be influencing the findings seen by socio-economic group.
In addition, the analyses do not consider price changes and how these could affect the
results seen. For these reasons, conclusions cannot be drawn on the independent
effects of the SDIL on different socio-economic groups.
Figure 31 shows the percentage change in total volume sales of drinks that are subject
to the SDIL by socio-economic group, and the change in the total sugar in those drinks
between baseline (2015) and year 3 (2019).
It shows that:
• overall there has been an increase of 14.9% in sales of all soft drinks included in the
SDIL analysis, but a reduction in the total sugar sales from those drinks of 35.4%,
reflecting the shift in sales towards lower sugar drinks
• all groups have shown an increase in volume of drinks purchased and a reduction in
sugar purchased, but there are some differences by socio-economic group
• the largest increase in sales was for Group E (up 20.5%), with groups C1 (up 18.1%)
and AB (up 15.9%) also increasing by similar amounts
• there has been an increase in the total drinks purchased per household and a
reduction in the total sugar purchased per household, across all socio-economic
groups; the reduction in total sugar is largest in Group C2 (38.5%) and then is similar
across all remaining socio-economic groups (between 32.7% and 35.1% reduction)
• groups AB, C1 and C2, which contain over three-quarters of the families in the
dataset, had increases in total sales of 15.9%, 18.1% and 9.0% respectively, and
their decreases in total sugar purchased were 35.1%, 34.2% and 38.5% respectively
25 A family is defined as a household containing children aged below 17 years old.

Sugar reduction: report on progress between 2015 and 2019
77
Total Sugar
SalesTotal Sales
All -35.4% 14.9%
AB -35.1% 15.9%
C1 -34.2% 18.1%
C2 -38.5% 9.0%
D -34.9% 9.6%
E -32.7% 20.5%-50% -40% -30% -20% -10% 0% 10% 20% 30%
Proportion of sales (%)
Total Sales
Total SugarSales
Figure 31: Change in total volume sales (litres) of drinks subject to the Soft Drinks Industry Levy and change in total sugar content of those drinks by socio-economic group between baseline year (2015) and year 3 (2019) for retailers and manufacturer branded products

Sugar reduction: report on progress between 2015 and 2019
78
Baseline Year 3 % change Baseline Year 3 % change
All 132 147 11.0% 5.1 3.2 -37.6%
AB 123 128 3.8% 4.4 2.6 -41.8%
C1 115 136 18.4% 4.2 2.8 -34.1%
C2 157 166 6.0% 6.0 3.6 -40.1%
D 161 166 3.2% 6.6 4.0 -38.7%
E 127 159 25.9% 5.1 3.6 -29.6%
Sales per household
(litres)
Sugar sales per household
(kgs)
0 50 100 150 200
Sales per household (litres)
0 2 4 6 8
Sugar sales per household (kgs)
Baseline
Year 3
Figure 32 shows the total purchases of drinks subject to the SDIL and the total sugar purchased from these drinks, per
household by socio-economic group.
It shows that:
• there has been an increase in the total drinks purchased per household and a reduction in the total sugar purchased per
household, across all socio-economic groups; however, households in group E had the lowest reduction of all groups
(29.6% compared with 37.6% overall)
• sugar purchases per household in year 3 in groups C2 (3.6kg), D (4.0kg) and E (3.6kg) are now similar
Figure 32: Total volume sales (litres) of drinks subject to the Soft Drinks Industry Levy and change in total sugar sales
from those drinks by socio-economic group between baseline year (2015) and year 3 (2019), for retailers and
manufacturer branded products

Sugar reduction: report on progress between 2015 and 2019
79
Figures 33 and 34 show the sales weighted average total sugar content per 100g both overall and at product category level for
baseline (2015) and year 3 (2019), and the change between this period.
It can be seen for retailers and manufacturers that:
• in both baseline and year 3, the drinks purchased by those in the lower socio-economic groups had a slightly higher average
sugar content than the drinks purchased by those in the higher socio-economic groups
all socio-economic groups have shown a reduction in sales weighted average total sugar content per 100ml by approximately the same amount across all groups (Table 7) Figure 33: Sales weighted average total sugar (g/100ml) of drinks subject to the Soft Drinks Industry Levy by socio-economic group in baseline year (2015) and year 3 (2019) for retailers and manufacturer branded products
Baseline Year 3
All 3.8 2.2
AB 3.6 2.0
C1 3.6 2.0
C2 3.8 2.2
D 4.1 2.4
E 4.0 2.3
0 1 2 3 4 5
Sales Weighted Average Sugar (g/100ml)
Baseline Year 3

Sugar reduction: report on progress between 2015 and 2019
80
Figure 34: Percentage change in sales weighted average total sugar (g/100ml) of drinks subject to the Soft Drinks Industry Levy by socio-economic group between baseline (2015) and year 3 (2019) for retailers and manufacturer branded products
% Change
All -44%
AB -44%
C1 -44%
C2 -44%
D -41%
E -44%
-50% -40% -30%
% Change in Sales Weighted Average

Sugar reduction: report on progress between 2015 and 2019
81
Figure 35 shows the sales in litres of products subject to the SDIL for the baseline year
(2015) and year 3 (2019) for retailers and manufacturer branded products by the
different taxation levels.
It can be seen that:
• there has been an increase in the proportion of sales with no levy attached (<5g per
100ml) for all socio-economic groups
• the proportion of drinks purchased that have no levy attached is similar across the
groups (Table 7)

Sugar reduction: report on progress between 2015 and 2019
82
Figure 35: Proportion of sales of drinks subject to the Soft Drinks Industry Levy by total sugar content per 100ml by
socio-economic group in baseline (2015) and year 3 (2019) for retailers and manufacturer branded products
67%
89%
67%
89%
66%
88%
63%
86%
64%
88%
9%
2%
8%
1%
7%
1%
7%
1%
7%
1%
24%
9%
25%
9%
27%
11%
29%
13%
29%
11%
0% 20% 40% 60% 80% 100%
Baseline
Year 3
Baseline
Year 3
Baseline
Year 3
Baseline
Year 3
Baseline
Year 3
AB
C1
C2
DE
<5g per 100ml 5g to <8g per 100ml >=8g per 100ml

Sugar reduction: report on progress between 2015 and 2019
83
Conclusions and next steps
The results presented in this report give a detailed assessment of the third year of
progress for the food categories included in the programme. Also included is an
assessment of the first year of progress made by industry towards the ambitions set for
unsweetened juice and sweetened milk based drinks.
For retailers and manufacturer branded products, overall progress achieved is
comparable to previous annual reports. There has been progress in some, but not all,
food categories. Sustained progress in sugar reduction has been seen for breakfast
cereals (down 13.3%) and yogurt and fromage frais (down 12.9%). However, as
described previously, these reductions are not being fully realised in the programme
overall. This is due to a reduction in the proportion of total sales from these lower sugar
categories and increases in sales in higher sugar categories such as chocolate
confectionery (which is reporting hardly any change in total sugar per 100g).
Overall these changes have resulted in more sugar from these products now appearing
in shopping baskets than was the case in 2015. Given that some categories are
showing hardly any progress in product reformulation accompanied by increasing
volume sales (up by 16.3% for chocolate confectionery), it is likely that further action will
be needed to drive change and meet the ambition. This includes limiting the promotion
and advertising of higher sugar foods, as set out in the government’s strategy paper
Tackling obesity: empowering adults and children to live healthier lives.
For the eating out of home sector, there has been hardly any change in the simple
average sugar content since the baseline of 2017. Comparisons for this sector between
different years of the programme should be treated with caution due to the differing
number and profile of products included in each dataset. The analysis shows a
reduction of 9.7% in the calories likely to be consumed on a single occasion suggesting
that, for the products included in the current analysis, this sector has focused more on
reducing portion size than the sugar content of products. However, the simple average
calories per single serve remains higher than for retailers and manufacturer branded
products across all categories, apart from chocolate confectionery.
Progress achieved by retailers and manufacturers at brand and product level is mixed.
Some businesses are making progress whilst others are showing little or no change,
and some brands are showing increases in their sales weighted average for both sugar
and calorie content. Data suggests that overall, retailers branded products have
changed to a greater extent than manufacturer branded products (a reduction of 4.6%
compared to 1.7% in sales weighted average total sugar per 100g).
The first assessment of sugar reduction in juice and milk based drinks shows some
positive progress. For milk based drinks there has been progress against the interim

Sugar reduction: report on progress between 2015 and 2019
84
sugar reduction ambition. Progress has also been seen for juices where there is more
limited scope for sugar reduction. Although there is more work to do for some
categories, for example in milk based drinks in the eating out of home sector, this is an
encouraging start towards meeting the ambitions for the programme.
The sugar levels of soft drinks subject to the SDIL have continued to fall. The reductions
have been much larger when compared with the food categories in the sugar reduction
programme and have been achieved despite an overall increase in sales of soft drinks.
It should be noted, however, that reducing sugar in drinks is more straightforward than it
is for some food categories because sugar generally does not provide functionality
beyond taste to drinks (that is, it does not often contribute to colour or structure).
The analysis of retailers and manufacturer branded product purchases shows that,
between 2015 and 2019, patterns of purchases of drinks subject to the SDIL have
changed across all socio-economic groups. All groups purchased fewer high sugar
drinks and more lower sugar drinks in 2019 than in 2015 for consumption in the home.
This change in the balance of drinks purchased has resulted in all socio-economic
groups purchasing less sugar from drinks subject to the SDIL.
From this analysis, conclusions cannot be drawn on the extent to which these changes are
caused by the levy as this analysis does not take into account other factors or trends that
could be important in determining patterns of drink purchases, including price changes.
The analysis by socio-economic group presented in the current report broadly fits with
time trend analysis from the National Diet and Nutrition Survey (NDNS) which shows a
downward trend in children’s consumption of sugar-sweetened soft drinks between 2008
to 2009 and 2016 to 2017. Changes for adults are in the same direction but less marked.
Although consumption patterns have not been assessed in this report (only purchases),
if the findings translate into reduced sugar consumption from drinks, other dietary
components remain unchanged and these trends are sustained over time, then all
socio-economic groups are likely to accrue the health benefits linked to lower levels of
sugar in the diet.
There are a number of limitations to the data and analysis presented in this report,
which have been described elsewhere.
Monitoring of sugar reformulation programme using other data sources
Changes in nutrient intakes and sources of sugar in the diet will also continue to be
monitored via other surveys and datasets. The most recently published results from the
NDNS showed that free sugars intake as a percentage of energy fell in children between

Sugar reduction: report on progress between 2015 and 2019
85
2008 to 2009 and 2016 to 2017 by 2.4 to 3.5 percentage points in each age group26, and
by 1.2 percentage points in adults. However, intakes remained at least double the
maximum recommendation of no more than 5% of total energy over the whole period.
Monitoring of the prevalence of obesity in both children and adults takes place regularly
through the National Child Measurement Programme (NCMP) and Health Survey for
England (HSE).
It is not expected that changes will be seen in these data for some time as there is likely
to be a significant lag between reductions in intakes and any change in obesity levels.
The fieldwork for the NDNS, NCMP and the HSE monitoring programmes has been
impacted by the Coronavirus (COVID-19) pandemic.
Next steps
Transparent monitoring of the sugar reduction programme, and further expert advice on
the potential levers to address excess sugar consumption, will continue to be provided
to government.
The next progress report, due in 2021, will provide a fourth annual assessment of
progress by all sectors of industry towards achieving the 20% reduction ambition for the
food categories included in the programme. This report will also include a second
assessment of progress made by industry towards the ambitions set for juice and milk
based drinks. Consideration is being given to the measurement period and timing of data
for this report due to changes in food purchases caused by Coronavirus (COVID-19).
We anticipate that businesses will be invited to submit case studies ahead of the
publication of the next progress report. These highlight specific reformulation activity
carried out which may not have been captured in the datasets used to assess progress,
but which could be used as evidence to demonstrate activity towards the 20% sugar
reduction ambition (and 5% for juice based drinks). This will apply to all categories
included in the sugar reduction programme – food and juice and milk based drinks –
and to the drinks subject to the SDIL.
In September 2020 following continued commitment from government to tackling
obesity, PHE published calorie reduction guidelines for industry to achieve by 2024. At
the same time, PHE also published a second progress report towards the 2017 salt
targets and the latest set of revised salt targets for industry to achieve by 2024.
Next steps for the wider reformulation programme, during 2020, include the publication
of guidelines to improve the nutrient content of commercial baby foods and drinks.
There will continue to be engagement with stakeholders on the reduction and
reformulation programme where appropriate.
26 Child year groups used in NDNS reporting are 1½ to 3 years, 4 to 10 years and 11 to 18 years.

Sugar reduction: report on progress between 2015 and 2019
86
Appendix 1: Guide to the category tables
and charts
A range of statistical tables and charts highlighting progress between the baseline year
and 2019 are provided for each of the categories included in the sugar reduction
programme. These are available in the supplementary excel tables. This Appendix
explains how these tables have been created and how to interpret them. See Appendix
2 for further information about the data sources and methodology used.
For all tables, percentage changes have been calculated on unrounded figures.
Main tables for retailers and manufacturer branded products
Table 1: Simple average and sales weighted average total sugar content (g/100g)
for retailers and manufacturer branded products
This table provides the simple average and sales weighted average total sugar content
per 100g. Figures are given for baseline (2015) and year 3 (2019) as well as the
percentage change for both metrics over this period.
Table 2: Simple average and sales weighted average total sugar content (g/100g)
by retailers and manufacturer branded products
As Table 1, but with separate analysis of progress for retailers and manufacturers. The
combined retailers and manufacturer figures from Table 1 are also included for
comparison purposes.
Table 3: Simple average and sales weighted average calories in products
consumed on a single occasion (single serve) for retailers and manufacturer
branded products
This table provides simple average and sales weighted average calories per single
serve portion for baseline (2015) and year 3 (2019), as well as the percentage change
for both metrics over this period.
Table 4: Simple average and sales weighted average calories in products
consumed on a single occasion (single serve) for retailers and manufacturer
branded products

Sugar reduction: report on progress between 2015 and 2019
87
As Table 3, but with separate analysis of progress for retailers and manufacturers. The
combined retailers and manufacturer figures from Table 3 are also included for
comparison purposes.
Table 5: Total volume sales and total sugar sales for retailers and manufacturer
branded products
This table provides total volume sales and total sugar sales in tonnes for baseline
(2015) and year 3 (2019). It also shows the proportion of sales each category
contributes to the overall level. The percentage change in total volume and total sugar
sales is given over this period along with the percentage point change in the
contribution each category makes to the total.
Table 6: Total volume sales and total sugar sales by retailers and manufacturer
branded products
As Table 5, but with separate analysis for retailers and manufacturers. Also shown is
the contribution of total category sales by retailers and manufacturers. The combined
retailers and manufacturer figures from Table 5 are also included for comparison
purposes.
Table 7: Sales (litres) and sales weighted average total sugar content (g/100ml)
and sales weighted average single serve calories per portion (kcal) for drinks
covered by Soft Drinks Industry Levy (SDIL) for retailers and manufacturer
branded products by socio-economic group
This table provides information on sales in litres, sales weighted average total sugar
content per 100ml, and calories per single serve portion for products covered by the
SDIL by socio-economic group. Figures are given for baseline (2015) and year 3 (2019)
as well as the percentage change for these metrics over this period.
Main tables for the eating out of home sector
Table 8: Simple average total sugar content (g/100g) for the eating out of home
sector
This table provides the simple average total sugar content per 100g. Figures are given
for baseline (2017) and year 3 (2019) as well as the percentage change for this metric
over this period.
Table 9: Simple average calories in products consumed on a single
occasion (single serve) for the eating out of home sector
This table provides simple average calories per single serve portion. Figures are given
for baseline (2017) and year 3 (2019) as well as the percentage change for this metric
Sugar reduction: report on progress between 2015 and 2019
88
over this period. It also includes the equivalent simple averages for retailers and
manufacturer branded products.
Table 10: Simple average total sugar content (g/100ml) and simple average single
serve calories per portion (kcal) for drinks covered by Soft Drinks Industry Levy
(SDIL) for the eating out of home sector
This table provides information on the simple average total sugar content per 100ml and
single serve calories per portion for products covered by the SDIL for the eating out of
home sector. Figures are given for baseline (2017) and year 3 (2019) as well as the
percentage change for both metrics over this period. It also includes the equivalent
simple averages for retailers and manufacturer branded products.
Table 11: Simple average total sugar content (g/100g) and simple average single
serve calories per portion (kcal) for products consumed on a single occasion
(single serve) for contract caterers in the eating out of home sector
This table provides the simple average total sugar content per 100g and single serve
calories per portion for catering companies in the eating out of home sector for year 3
(2019). No comparison is made to baseline (2017) as the number of products for which
data was collected in each year is very different.
Appendix tables for retailers and manufacturers
Appendix Table 1: Sales weighted average total sugar content (g/100g) and sales
weighted average single serve calories per portion (kcal) for retailers and
manufacturer branded products
Appendix Table 1 provides information on the following metrics by category for baseline
(2015), year 1 (2017), year 2 (2018) and year 3 (2019) and the percentage change over
this period:
Sales weighted average total sugar (g/100g)
• number of products with real nutrition information
• proportion of all products that have real nutrition information (% of all products in
category)
• proportion of volume sales with real nutrition information (% of all sales in category)
• volume sales by category as a proportion of all sales (%)
• sales weighted average total sugar content (g/100g)
Calories in products likely to be consumed on a single occasion (single serve)
• number of products with real nutrition information
• proportion of all products that have real nutrition information (% of all products in
category)

Sugar reduction: report on progress between 2015 and 2019
89
• proportion of volume sales with real nutrition information (% of all sales in category)
• volume sales by category as a proportion of all sales (%)
• sales weighted average calories per portion (for single serve products – kcal)
Appendix Table 2: Percentage change in sales weighted average total sugar for
the top 10 manufacturers and top 10 retailers based on total sugar sales in the
category
Appendix Table 2 provides information on the change in sales weighted average total
sugar 100g between baseline (2015) and year 3 (2019) for the top 10 selling
manufacturers and retailers defined by their total sugar sales.
Manufacturers and retailers are listed in alphabetical order in each category. They are
not listed by volume of sugar sales. The list includes those who account for the top 80%
of sugar sales in the category. For manufacturers, any businesses which did not have at
least 1% of sales in both 2015 and 2019 were removed. A maximum of 10
manufacturers and 10 retailers are shown.
Aldi and Lidl brands and all cakes and morning goods, are compared with a baseline of
2017 rather than 2015 as their data for the earlier year are not robust.
Appendix Table 3: Percentage change in sales weighted average calories for
products likely to be consumed on a single occasion for the top 10 manufacturers
and top 10 retailers based on total servings in the category
Appendix Table 3 provides information on the change in sales weighted average
calories between baseline (2015) and year 3 (2019) for the top 10 selling manufacturers
and retailers defined by their total sales.
As with Appendix Table 2, manufacturers and retailers are listed in alphabetical order
within each category. They are not listed by volume of sugar sales. The list includes
those who account for the top 80% of sugar sales in the category. For manufacturers,
any businesses which did not have at least 1% of sales in 2015 and 2019 were
removed. A maximum of 10 manufacturers and 10 retailers are shown.
Aldi and Lidl brands and all cakes and morning goods, are compared with a baseline of
2017 rather than 2015 as their data for the earlier year are not robust.
Appendix Table 4: Percentage change in sales weighted average of nutrients per
100g for top 20 manufacturer and retailer brands based on total sugar sales in a
category

Sugar reduction: report on progress between 2015 and 2019
90
Appendix Table 4 provides information on the change between baseline (2015) and
year 3 (2019) for the top 20 selling manufacturer retailer brands defined by their total
sugar sales. Brands are listed in alphabetical order within each category.
Aldi and Lidl brands, and all cakes and morning goods, are compared with a baseline of
2017 rather than 2015 as their data for the earlier year are not robust.
The metrics shown are the percentage change for:
• sugar (%)
• calories (%)
• saturated fat (%)
• salt (%)
Appendix Table 5: Calories in products consumed on a single occasion (single
serve) for the top 30 products by total servings in a category
Appendix Table 5 provides information on the change in calories per single serve
portion between baseline (2015) and year 3 (2019) for the top 30 selling manufacturer
and retailer products defined by sales in servings.
Aldi and Lidl brands, and all cakes and morning goods, are compared with a baseline of
2017 rather than 2015 as their data for the earlier year are not robust.
Product density curves
This shows the product density curves for each category for total sugar per 100g and
calories for products likely to be consumed on a single occasion. The curve is a
smoothed line of best fit through the underlying data points which allow the general
direction of change to be seen clearly. Therefore, the number of products for a particular
content of sugar is an approximation rather than the exact number.
Appendix tables for the eating out of home sector
Appendix Table 6: Percentage change in simple average total sugar (g) and
calories per portion (kcal) for the top eating out of home businesses based on
total sugar sales in the category
Appendix Table 6 provides information on the change in the simple average total sugar
per 100g, between year 1 (2017) and year 3 (2019), for the top 10 selling businesses
defined by their total sugar sales for brands with nutrition data.

Sugar reduction: report on progress between 2015 and 2019
91
Tables for juice and milk based drinks
Appendix Table 7: Simple average and sales weighted average sugar content per
100ml of milk based drink and juice categories for retailers and manufacturer
branded products
This table provides the simple average and sales weighted average total sugar content
per 100ml for baseline (2017) and year 1 (2019). Figures are given for baseline (2017)
and year 1 (2019) as well as the percentage change for both metrics over this period.
The percentage change is based on added sugar rather than total sugar for the milk
based drink categories.
Appendix Table 8: Simple average and sales weighted average calories per
serving of milk based drink and juice categories for retailers and manufacturer
branded products
This table provides the simple average and sales weighted average calories per serving
for baseline (2017) and year 1 (2019). Figures are given for baseline and year 1 as well
as the percentage change for both metrics over this period.
Appendix Table 9: Percentage change in simple average or sales weighted
average sugar per 100ml value for the top 10 manufacturers and retailers based
on total sugar sales in the category
This table provides information on the change in simple average or sales weighted
average total sugar content per 100ml between baseline (2017) and year 1 (2019) for
the top 10 selling manufacturer and retailer brands defined by their total sugar sales.
The percentage change is based on added sugar rather than total sugar for the milk
based drink categories. Brands are listed in alphabetical order within each category.
Appendix Table 10: Proportion of products meeting the maximum calories per
serving guideline in year 1 (2019) for the top 10 manufacturers and retailers based
on total servings sold in the category
This table provides information on the number and proportion of products meeting the
maximum calories per portion guideline in year 1 (2019) for the top 10 manufacturers
and retailers based on total servings sold. Brands are listed in alphabetical order within
each category.
Appendix Table 11: Simple average sugar content per 100ml of milk based drink
and juice categories in the eating out of home sector
This table provides the simple average total sugar content per 100ml for baseline (2017)
and year 1 (2019) for the eating out of home sector. Figures are given for baseline and

Sugar reduction: report on progress between 2015 and 2019
92
year 1 as well as the percentage change for this metric over this period. The percentage
change is based on added sugar rather than total sugar for the milk based drink
categories.
Appendix Table 12: Simple average calories per serving of milk based drink and
juice categories in the eating out of home sector
This table provides the simple average calories per serving for baseline (2017) and year
1 (2019) for the eating out of home sector. Figures are given for baseline and year 1 as
well as the percentage change for this metric over this period.
Appendix Table 13: Percentage change in simple average total sugar per 100ml
and proportion meeting maximum calories per portion guideline in the top eating
out of home sector businesses based on total sugar sales for milk based drink
and juice categories.
This table provides information on the change between baseline (2017) and year 1
(2019) for the top eating out of home businesses defined by their total sugar sales for
milk based drinks and juice products. Businesses are listed in alphabetical order within
each category.
The metrics shown are the simple average sugar content grams per 100ml, percentage
change in simple average sugar content (based on added sugar rather than total sugar
for the milk based drink category), and the proportion of products at or below the
maximum calories per portion guideline.

Sugar reduction: report on progress between 2015 and 2019
93
Appendix 2: Details of the data sources and
methods used to assess progress of the
sugar reduction programme
Analysis has been undertaken to examine trends in the sugar and calorie content of
products in the food categories included in the sugar reduction programme. For retailers
and manufacturers the comparison is between baseline (2015) and year 3 (2019), and
for the eating out of home sector it is between year 1 (2017) and year 3 (2019).
A list of the food categories included in the programme are:
• biscuits
• breakfast cereals
• cakes
• chocolate confectionery
• ice creams, lollies and sorbets
• morning goods
• puddings
• sweet confectionery
• sweet spreads and sauces
• yogurts and fromage frais
This report contains the first progress report for unsweetened juice and sweetened milk
based drinks. For this analysis, the sources of data used are the same as for both the
food categories and the Soft Drinks Industry Levy (SDIL), but the baseline year is 2017,
and year 1 is the most recent year (2019). There are methodological considerations
specific to these drinks described in Appendix 3.
An analysis has also been carried out to assess changes in the sugar content of drinks
covered by the SDIL between 2015 and 2019.
Data sources
Retailers and manufacturer branded products
The baseline and year 3 estimates of sugar and calorie content by food group for retailers
and manufacturers use data from Kantar FMCG’s (formerly Kantar Worldpanel) take home
consumer panel. Kantar FMCG is a global market research business which runs a
continuous reporting panel of 30,000 households across Great Britain, recording details of
all food and drink purchases brought in to the home, including the volume of sales.

Sugar reduction: report on progress between 2015 and 2019
94
Kantar FMCG’s sample of households reflects the demographic makeup of the British
population. Demographic targets for the sample are based on region, social class, age
of main shopper, household composition and household size. The data collected are
weighted to provide a representative picture of total food and drink purchasing in Great
Britain over the time period for which data are provided.
The 2019 dataset used for monitoring progress in year 3 of the sugar reduction
programme covers the 52 weeks ending 8 September 2019. It includes total volume of
sales in kilograms/litres/servings and nutrition data for individual food products per
100g/100ml/serving as well as details of pack size (such as number of products
included in multipacks). The baseline dataset covered the 52 weeks ending 31 January
2016.
Kantar FMCG aims to collect all nutrition data from food labels on individual products
through the use of fieldworkers, who visit key retail stores and capture the information
provided on packaging on a rolling 4 monthly basis. This is an improvement from the
data being collected every 6 months in the baseline year. Kantar FMCG also receive
nutrition information from third parties; Brandbank on a continuous basis and
MySupermarket at intervals throughout the year. The most recent nutrition information
from these sources is then used. If no nutrition information for a product was found in
2019 then the most recently collected nutrition information available from a previous
year is used. Therefore, if the product has been reformulated since the last time
nutrition information was collected then this reformulation will not be captured in the
analysis, but it will be included in future reports when the nutrition information is
refreshed.
Where Kantar FMCG is able to collect the nutrition data, usually for the majority of
products in a category, this is termed ‘real’ (real and found) data. Where this is not
possible, nutrition values are either copied across from similar products in the same
brand (for example using a different pack size, known as ‘cloned’) or an average value
for the category or product type is calculated and used instead. This is known as
‘imputed‘ data. For 2019 Kantar FMCG undertook a one-off exercise after the initial
collection period had ended to update the nutrition information for some of the cloned
data or older nutrition data, focussing particularly on the top sellers in each category.
Only real and cloned data has been used for the analyses in this report which present
average nutrition information. This is because an imputed value would not take account
of any recent reformulation of a particular product unless there has been wholesale
reformulation within the product category. The imputed data is used in the analyses of
sales volumes to ensure the total level of sales is reported.

Sugar reduction: report on progress between 2015 and 2019
95
Time periods covered for retailers and manufacturers
For retailers and manufacturers, comparisons are made between the baseline (2015)
and year 3 of the programme (2019) where possible. This is the case for most
categories and businesses included in the report.
However, there are 3 instances where comparisons are made to a baseline of 2017
rather than 2015.
Data for cakes and morning goods has been gradually improved since the programme
began and while limitations with the data for cakes and morning goods remain, the data
included in the 2015 dataset for these categories had a substantially greater degree of
limitation and so has not been used as the baseline for these categories. Improvements
were made to the data for these categories in the 2017 dataset, and further
improvements were subsequently made for the 2018 and 2019 datasets. Therefore, it
was decided to use 2017 as the baseline period for both these categories. Comparisons
with 2017 should still be made with caution, as data were collected for around 50%
more products in 2019 than 2017. The 2017 cakes and morning goods data has been
used to estimate the data for 2015 in tables that include data for all categories
combined so that progress can be measured against a baseline. Therefore, any
progress made between 2015 and 2017 for these categories will not be included.
There was no specific collection of nutrition data for Aldi and Lidl in 2015 so
comparisons in the appendix tables use 2017 as the baseline for these retailers.
However, the 2015 data for these retailers has been used in the calculation of the
overall and category level figures in this report as including and excluding these data
was shown to have little impact.
Due to an error with how nutrition information was labelled on Häagen-Dazs ice cream,
data for 2015 cannot be used. As a result, any comparisons made for this range of
products uses the 2017 data as a baseline and comparisons are made against this.
Eating out of home sector
Unlike the retail and manufacturing sectors, there is no single data source that provides
both sales and nutrition information for the eating out of home sector. There is currently
no legal obligation to provide nutrition information for foods consumed out of the home
although many businesses do provide this on their websites, leaflets or menus. The
government has announced that, as part of its obesity strategy, calorie labelling for the
eating out of home sector will be mandatory.

Sugar reduction: report on progress between 2015 and 2019
96
Sales data for foods in the eating out of home sector
For the baseline data presented for 2015, PHE used data on food purchases collected
by NPD from their Consumer Reports on Eating Share Trends (CREST) survey.
Following a competitive tender process, the contract for providing sales data for the
eating out of home sector for 2017 and subsequent years was awarded to Lumina
Intelligence (formerly MCA). Unlike the NPD sales data available for the 2015 baseline
analysis, Lumina Intelligence’s consumption data (based on the reported number of
servings of product consumed27) is provided at individual business level which is
invaluable to PHE in its monitoring of the programme. As a result, the 2019 data for the
eating out of home sector is compared with data from 2017, as opposed to 2015.
Lumina Intelligence’s Eating Out Panel is a monthly tracker of consumer behaviour in
relation to the eating out of home sector. Each year there are 72,000 in-depth online
interviews conducted, equating to 6,000 per month. The panel is representative of the
adult population in the UK in terms of age, gender and region. It is a continuous tracker
interviewing respondents every day of the year, but not a continuous set of the same
panel members.
The Eating Out Panel interviewees provided:
• frequency of eating and drinking out generally and at different times of the day
(breakfast, lunch, dinner and snacking)
• full detail of the most recent eating and drinking out occasions
o most recent breakfast, lunch and dinner visits within the last 2 weeks and
snack visit on the previous day
o details requested include channel and operator brand, reason for eating out,
what was eaten and how much money was spent per head per visit
In addition to providing data from their existing Eating Out Panel, Lumina Intelligence
also conduct 2 bespoke surveys which were:
• a nationally representative survey of 5,000 parents in the UK to gather information
about children’s food and drink consumption in the eating out of home sector
• a survey of 2,000 adults to collect information about drinking in the eating out of
home sector on occasions where food is not consumed
All 3 datasets were combined in the data used in this analysis.
Nutrition information for the eating out of home sector
Nutrition information for the eating out of home sector has been collected by PHE from
businesses and additionally by Lumina Intelligence from company websites. From 2017
27 Note that additions to meals such as extra chips might not be recorded by the panel member.

Sugar reduction: report on progress between 2015 and 2019
97
a far more comprehensive range of information has been collected, providing a more
representative picture of the eating out of home sector compared with 2015. This was
further improved upon in 2018 and 2019.
For the majority of products in the eating out of home sector there is no one-to-one
mapping between the nutrition data that was collected and purchases by item. For
example, a panellist may say that they had an ice cream in a restaurant, but the type of
ice cream is not recorded. As the restaurant has several flavours of ice cream, all of
which have different nutrition data, it is not possible to accurately match the nutrition
data to the actual ice cream purchased. On other occasions nutrition data may not be
available for a particular operator but is available for the same type of product at similar
operators.
As it is not possible to match purchases and nutrition information at product level, the
decision was taken from 2018 to move to reporting simple averages using only the
nutrition data provided to PHE by businesses (and additionally by Lumina Intelligence).
This ensures that nutrition information is correctly ascribed to products and businesses.
Data cleaning and categorisation
Before any analysis is carried out on either set of data it is cleaned and categorised.
Cleaning the data involves making several checks and adjustments to the nutrition data
to ensure that it is as accurate as possible. This process includes checking the nutrition
data of a product to see whether it relates to the product as sold or as consumed,
decisions around whether to exclude products based on their sugar content and
conversion or dilution factors being applied to some foods and drinks (for squashes and
cordials for example).
The commercial datasets used from Kantar FMCG and Lumina Intelligence have quality
control measures built into their production processes. In addition, PHE has carried out
its own quality control checks of all data used and all analyses. These include:
• checking datasets for implausible values, and excluding those from the analysis
• checking the quality of certain variables by cross checking against other variables
that show product detail in the datasets, or cross-referencing to other datasets
• specific data checks and questions sent to data suppliers as and when they arise
Products are categorised into one of the sugar reduction categories as described in the
table below or classified as a soft drink in scope of the SDIL as set out by HM Treasury.
Please refer to Appendix 3 for more information on the categorisation of juice and milk
based drinks.

Sugar reduction: report on progress between 2015 and 2019
98
Product category Category description
Biscuits All types of sweet biscuits; cereal bars and toaster pastries; breakfast biscuits; rice cakes; gluten free sweet biscuits; in-store bakery products.
Breakfast cereals All breakfast cereals, for example: ready to eat cereals, granola, muesli, porridge oats, instant porridge, and other hot oat cereals.
Cakes All types of cakes, ambient and chilled, including cake bars and slices.
Chocolate confectionery
Includes chocolate bars, filled bars, assortments, carob, diabetic and low-calorie chocolate and seasonal products.
Ice cream, lollies and sorbets
All types of ice cream, dairy and non-dairy, choc ices, ice cream-based desserts, milk ice lollies, ice lollies; low fat/low calorie ice cream; sorbet; frozen yogurt.
Morning goods Includes croissants, crumpets, English muffins, pancakes, buns, teacakes, scones, waffles, Danish pastries, fruit loaves and bagels.
Puddings All types of ambient, chilled and frozen large and individual pies, tarts and flans, cheesecake, gateaux, dairy desserts, sponge and rice puddings and seasonal products such as mince pies.
Sweet confectionery
Includes boiled sweets, gums, pastilles, fudge, chews, mints, rock, liquorice, toffees, chewing gum, sweet popcorn, nougat and halva, seasonal products.
Sweet spreads and sauces
Includes chocolate spread, peanut butter, ice cream and dessert sauces, dessert toppings and compotes, jam type spreads that do not fall under relevant legislation.
Yogurts and fromage frais
Includes all sweetened dairy and dairy alternative yogurt and fromage frais products and all yogurts containing low/non-caloric sweeteners.
At the same time, work has also been undertaken to determine which products can be
included in the analysis of calories per single serve products. These products, which are
likely to be consumed by an individual on a single occasion, have been identified for
each category (except for breakfast cereals and sweet spreads and sauces) to study
the distribution of calories per portion. A description of the types of products included in
the portion size analysis is provided in the table below. Items sold both individually and
in multi-packs have been considered.

Sugar reduction: report on progress between 2015 and 2019
99
Product category
Single serve items
Biscuits
Includes: • biscuit/cereal bars, including two-finger Kit Kats, Penguin bars, etc
• mini bags (≤80g) of biscuits/chocolate mallows/rice cakes
• large biscuits (for example giant custard cream) and individual cookies up to 80g
• packets of 3 biscuits (for example short bread, bourbons), toaster pastries
Excludes: all products below 10g or above 80g (for example roll packs, packet biscuits, large packs of rice cakes), selection/assortment boxes, boxes of cookies.
Cakes
Includes: single portions/slices of cake products, and single serve items in multipacks
Excludes: all products below 10g (for example ‘bitesize’ products) or above 150g (for example large whole cakes, pies, tarts, Swiss rolls), small whole cakes marketed for sharing occasions.
Chocolate confectionery
Includes: • individual chocolate bars (sold as single items or part of multi packs) (≤80g)
• mini and treat size bags (≤80g)
• duo, trio and bar and half chocolate
• chocolate lollipops
• single seasonal items (≤80g) (for example chocolate bunnies, Santa’s or eggs)
Excludes: all products below 10g or above 80g (for example moulded chocolate bars/slabs, sharing bags), boxes/tins of chocolate, seasonal products sold as multiple miniature items (for example chocolate coins, Christmas tree decorations, advent calendars).
Ice cream, lollies and sorbets
Includes: • miniature ice creams
• ice cream in a cone or on a stick
• lollies, choc ices
• ice cream or sorbet cups/tubs (≤120g)
Excludes: all products exceeding 120g.
Morning goods
Includes: morning goods sold as single items or single serve items in multipacks
Excludes: all products below 10g (for example ‘bitesize’ products) or above 150g; all pancakes and small waffles (people generally consume more than one); finger buns.
Puddings
Includes: individually wrapped puddings, puddings in multipacks (for example 2 pack sticky toffee puddings)
Excludes: all products below 35g (for example ‘bitesize’ products) or above 200g, patisserie/party selections.
Sweet confectionery
Includes: • lollipops, tubes and packs of sweets (≤100g)
• multipacks where individual items are less than or equal to 100g
Excludes: all products below 10g or above 100g, products sold in pellets or pieces, wafers/cones.
Yogurts and fromage frais
Includes: yogurts between 100-200g
Excludes: all products below 100g or above 200g.
Sugar reduction: report on progress between 2015 and 2019
100
Analysis
For retailers and manufacturer branded products, 3 metrics have been calculated for
each product and category, where possible, using the most recent data. These are:
sales weighted averages (SWA) of total sugar content (g/100g); simple averages of the
total sugar content of products sold; and calories in products likely to be consumed in a
single occasion (single serve). The value for 2019 is then compared with the baseline
year (2015 for all categories apart from cakes and morning goods where a 2017
baseline is used, due to poor data quality in 2015) and a percentage change between
the years is calculated. This is done for the whole category, as well as for
manufacturers and retailers individually. In addition, an estimate has been made of the
total tonnes of sugar sold and of how this is split between the different sugar categories
included in the programme.
For retailers and manufacturer branded drinks in scope of the SDIL, the SWA and
simple average total sugar content and calories in products likely to be consumed on a
single occasion have been calculated for each of the different levy categories (less than
5g per 100ml, 5g or more but less than 8g per 100ml and 8g or more per 100ml) and
overall for the most recent year of data available. As with the food categories, these
have been compared with the 2015 data and a percentage change calculated. In
addition, an analysis by socio-economic group has been conducted.
For the eating out of home sector, only the simple average total sugar content and
calories per serving for products sold have been calculated. These have been
compared with the data available for 2017 (the baseline for the eating out of home
sector) and percentage changes have been calculated. The data has been presented
alongside the simple average for the retailers and manufacturer branded products to
provide some context.
The simple average total sugar content of products sold have also been used to look at
the drinks included in the SDIL which are purchased in the eating out of home sector.
As for retailers and manufacturer branded products, the 3 different categories of the
levy have been presented in addition to the percentage change.
This analysis is broadly the same as for assessing progress in juice and milk based
drinks. Please see Appendix 3 for specific considerations relevant to these products.
Several supplementary tables have also been produced. For retailers and manufacturer
branded products these include:
• an overview of the category (Appendix Table 1)
• a table looking at the change in SWA total sugar content for those manufacturers
and retailers that make up the majority of the market share (80%) for each category
(Appendix Table 2)

Sugar reduction: report on progress between 2015 and 2019
101
• an equivalent table for calories for products likely to be consumed on a single
occasion (Appendix Table 3)
• the SWA of sugar content and nutrient changes for the top 20 brands (based on
total tonnes of sugar sold) by category (Appendix Table 4)
• the average of calories per portion for the top 30 products (based on total servings
sold) by category (Appendix Table 5)
For the eating out of home sector, due to the limitations of the data, only 1
supplementary table has been produced. This looks at the change in simple average
total sugar content and calories per single serving for the top 10 businesses (based on
total tonnes of sugar sold, Appendix Table 6).
Monitoring the change per single serving is more appropriate than monitoring averages
expressed in g/100g/ml or calories per 100g/ml, because averages per 100g/ml will not
pick up any reformulation work which was solely based on reducing product size.
This is best explained by using an example. Consider a product which weighs 50g and
contains 10g of total sugar and 200 kcals, equating to a sugar and calorie content per
100g of 20g and 400 kcals respectively. If it was reformulated solely by reducing the
product size to 40g and reducing the sugar and energy content proportionately to 8g of
sugar and 160 kcals, then the averages per 100g remain at 20g of sugar and 400 kcals
so it would appear as if no progress had been made. This change, however, would be
picked up in the analysis of calories per single serve portion.
Product category-specific considerations and exceptions
Breakfast cereals and sweet spreads and sauces
Both categories have been excluded from the analysis of calories per single serve. This
is because no standard portion sizes have been set for these categories, as consumers
take multiple servings from individual packs and it is not possible to measure single
portions from these.
Cakes and morning goods
Volume of sales of cakes and morning goods in the Kantar FMCG dataset are generally
presented in terms of portions or servings and information on portion size is not
routinely available for many products. To estimate sugar content (g/100g) for many
products in these categories the portion size is needed and must be collected through
fieldwork in retail stores. Kantar FMCG conducted these exercises in 2017, 2018 and
2019. In 2019, a particular emphasis was placed on collecting the weights of more
seasonal products. Cake mixes have been excluded from the analysis as nutrition
information is predominantly provided ‘as sold’, which skews sugar content in the
category towards the higher end.

Sugar reduction: report on progress between 2015 and 2019
102
Information on the difficulties associated with collecting data on cakes and morning
goods was mentioned previously and an explanation given for why 2019 data in this
category is compared with 2017 as the baseline.
Ice creams, lollies and sorbets
Analysing the nutrient data for ice creams, lollies and sorbets is more problematic than it
is for some other categories covered by the programme. This is because the nutrition
information given on pack for these products can be expressed as either grams of total
sugar per 100 ml or grams of total sugar per 100g, rather than always being stated as
grams of total sugar per 100g (as it is for the other categories). Some businesses may
add air to their products which makes the total sugar content lower when expressed per
100ml than per 100g. Therefore, an adjustment needs to be made to ensure
comparisons are on a like-for-like basis.
The analysis included for ice creams, lollies and sorbets in the year 1 progress report
was based on the year 1 (2017) dataset and used conversion factors to change any on
pack nutrition information per 100ml to per 100g. The conversion factors went some
way to accommodate the different types of ice cream by using different factors for soft
scoop or premium ice cream for example, but there were some concerns expressed
from stakeholders about the accuracy of this process.
This process was modified for the year 2 report. The nutrition information was used as
provided on pack regardless of whether it was expressed per 100g or per 100ml. While
this was a more simplistic method it did allow the sugar content of ice cream, lollies and
sorbets to be tracked over time as long as the ratio of products where this information is
in ml or grams stayed roughly constant over time.
However, in the 2018 (year 2) Kantar FMCG dataset there were more products with
nutrition information expressed in millilitres (around 30% of all ice cream products) than
there were in 2015 (around 10%). This was primarily due to the data provider changing
from using nutrition information per 100g as the default if it was provided in both units in
2015 and 2017 to using nutrition information per 100ml as the default in 2018.
If this was not adjusted for it would give a misleading comparison and may lead to an
artificial decrease in sugar content in products over the analysis period, which would
reflect the shift to more products having their nutrition information expressed as grams
of total sugar per 100ml, rather than any real reduction in sugar content.
This change was adjusted for by scaling up the influence of the nutrition information
expressed per 100ml in 2015 and 2017 (by weighting) and scaling down the influence of
the information expressed per 100g for the same years, so it matches as much as
possible the distribution of products in 2018.

Sugar reduction: report on progress between 2015 and 2019
103
For 2019 (year 3) this process has evolved further to help increase the accuracy of
reporting in this category. This has been achieved by:
1. Scaling factors (proportion of grams (g) vs millilitres (ml) products in 2019 used to weight
previous year’s data to enable comparability):
a. In the year 2 report, these were only created at an overall level for sugar and calories and
applied to all data at a manufacturer/retailer and business level when presenting more
granular data.
b. In the year 3 report, separate scaling factors are created for manufacturer/retailer and
business level tables to ensure sales are not falsely inflated/deflated at a more granular
level.
2. Applying scaling factors to simple average calculations:
a. In the year 2 report, simple averages were calculated by dividing the sum of the ice cream
products sugar per 100g value by the sum of the scaling factors derived from the proportion
of ice cream sales in g vs ml, that is, the calculation was using sales data which should only
be adjusted for when calculating SWA not simple average. This approach was aiming to
adjust the simple average calculations to reflect the changing proportion of g vs ml products
throughout the years, but rather than adjusting for the count of products in g vs ml, instead
adjusted for the sales of these products.
b. In the year 3 report, a count-specific weight (created at an overall, manufacturer vs retailer,
and business level as per point 1 above) has been created for the simple average
calculations, based on the ratio of the count (not sales) of ice creams products measured
per 100g vs per 100ml, and the following weighted mean formula is used to calculate the
simple average: Weighted mean = sum( X * weight) / sum(weight).
3. Conversion factors (single serve analysis specific):
a. In the year 2 report, to calculate per serving information of ice cream products, per 100g/ml
nutrition information and pack weight was used and the standard approach used for all
other categories. However, due to ice creams being measured in both g and ml a problem
would arise if a product’s nutrition information was in g, but its pack size was in ml or vice
versa, and per serving information would be calculated using a mix of units which resulted
in less accurate per serving values.
b. In the year 3 report, to reduce the number of products with a g vs ml discrepancy, the first
step was to attempt to use the pack weight information in a product’s description field as
this would sometimes contain the pack weight value in both g and ml. Then to enable
products with nutrition information in g and pack size in ml or vice versa to be used in the
single serve analysis and have more accurate single serve values, conversion factors
would have been applied to the per 100 nutrition information to convert from g to ml or ml to
g ensuring the nutrition information unit matched the pack weight unit. Conversion factors
were derived based on the ice cream sub-category defined by Kantar, and from previously
used conversion factors produced for the year 1 report in addition with cross-checking
products online to ensure accuracy.
A further issue for ice cream is that there was an error with how nutrition information
was labelled on Häagen-Dazs ice cream in 2015 and therefore data for this brand from
that year cannot be used. As a result, any comparisons made for this range of products
uses the 2017 data as a baseline and comparisons are made against this.

Sugar reduction: report on progress between 2015 and 2019
104
Puddings
Quick-set jellies, powdered desserts and custards have been excluded from the
analysis for the pudding category because nutrition information is predominantly
provided ‘as sold’, which skews sugar content in the category towards the higher end.
Some products from this category are also part of the weighing exercise Kantar FMCG
undertake each year (for more information on this please see the sections on cakes and
morning goods). It should also be noted that the weighing exercise for 2019 included
more seasonal products meaning that mince pies were included in the analysis for the
first time. This has had an impact on results in this category and these have been noted
throughout the report.
A small number of products in this category are also part of the weighing exercise for
cakes and morning goods which was explained earlier. Therefore, the business level
analyses presented in appendix tables 2 and 3 for puddings also contains an additional
column to show the results excluding mince pies so users of this report can make a
more valid comparison.
Soft Drinks Industry Levy
Where nutrition information for dilutable fruit squashes has been provided ‘as sold’
(assumed for squash products with more than 12.5g sugar per 100g), this has been
converted to nutrition information ‘as consumed’ by dividing by a factor of 5 to account
for dilution. The cut-off of 12.5g and dilution factor were agreed by examining the
nutrition information and dilution instructions for a sample of products online.
Sweet confectionery
Sweet confectionery has been excluded from analysis of the eating out of home sector
due to the data between the 2 years not being comparable. This is because the nutrition
information collected in 2017 and 2019 was from different business sectors which
resulted in misleading results for the category as a whole.
Yogurts and fromage frais
Some errors are known to be present in the nutrition information for certain products
such as implausible sugar content. Yogurts and fromage frais is the only category
where a minimum sugar content of 3.8g per 100g was agreed due to the naturally
occurring lactose present; all products with a sugar content lower than this have been
excluded from the analysis. Natural yogurts and unsweetened yogurts are excluded
from the category and, therefore also excluded from the analysis. In this progress
report, sugar content, sugar SWAs and simple averages for yogurts are presented
without any adjustment for lactose.

Sugar reduction: report on progress between 2015 and 2019
105
This current report provides an assessment of the changes in milk based drinks for the
first time. This also includes an analysis of changes in fermented (yogurt) drinks, which
are a sub set of the yogurt and fromage frais category. Please refer to Appendix 3 for
further information.
Aldi and Lidl
As reported in the year 1 progress report, it was not possible to report on progress for
Aldi and Lidl due to lack of baseline data. Data is now available for these retailers for
2017 and 2019 and therefore progress reported for these retailers and their products
will compare year 1 (2017) with year 3 (2019).
Data limitations
Retailers and manufacturer data
The data received from Kantar FMCG is based on a survey sample. Consequently,
there is a degree of uncertainty present in the results calculated but Kantar FMCG
calculate confidence intervals around the estimates.
Kantar FMCG’s fieldworkers enter stores to collect nutrition information on a rolling 4-
month basis but this does not update all products in the dataset each time. This means
that some reformulation changes may not be picked up and reported on in the year that
they occur.
Eating out of home sector data
Only simple averages are published due to problems linking purchases and nutrition
data, as explained previously. Comparisons between year 1 (2017) and year 3 (2019)
should also be treated with caution due to differing numbers and profile of products
included in each year’s analysis.
Quality assurance
As previously mentioned, the commercial datasets used from Kantar FMCG and Lumina
Intelligence have quality control measures built into their production processes and the
data has also been cleaned by PHE. In addition to this, the analysis has been
independently replicated and business specific results have been examined to ensure
they are plausible and comparable.
Specific data checks and questions were sent to data suppliers as and when they arose
where there were anomalies or other queries over the collection of certain variables or
the viability of data collection from certain outlets.

Sugar reduction: report on progress between 2015 and 2019
106
Impact of changes in sales on sales weighted averages
The SWA total sugar g/100g and calories for products likely to be consumed on a single
occasion presented in this report are determined by either the sugar or calorie content
respectively, and the volume of sales of each product expressed in tonnes. The sales
volume determines the contribution (or weight) each product makes to the overall sugar
or calorie SWA. Therefore, a top selling product would make a higher contribution to the
SWA than a lower selling product. It is also the case that an increase in sales of a
product with a higher sugar content relative to other products can cancel out any
contribution of the reduction in the sugar content of that product to the change in the
SWA.
This is demonstrated by the following example: consider there are 3 chocolate
confectionery products A, B and C, which have the following sales (in tonnes of product
sold) and sugar content per 100g in periods 1 and 2 respectively.
The table shows that between the 2 periods there was an increase in sales for product
A of 35% and a decrease in sugar content for product A of 4%.
The impact on the SWA sugar per 100g is as follows:
𝑆𝑊𝐴 = ∑ 𝑠𝑎𝑙𝑒𝑠 𝑥 𝑠𝑢𝑔𝑎𝑟
∑ 𝑠𝑎𝑙𝑒𝑠
𝑆𝑊𝐴 𝑖𝑛 𝑝𝑒𝑟𝑖𝑜𝑑 1 = ((1000 × 50) + (500 × 30) + (100 × 20))
(1000 + 500 + 100) = 41.9 𝑔/100𝑔
𝑆𝑊𝐴 𝑖𝑛 𝑝𝑒𝑟𝑖𝑜𝑑 2 = ((1350 × 48) + (500 × 30) + (100 × 20))
(1350 + 500 + 100) = 41.9 𝑔/100𝑔
This example shows that even though product A has been reformulated to contain less
sugar, the overall SWA sugar content in g/100g across the 3 products has remained the
same. This is because sales for product A have increased and product A has a higher
sugar content than products B and C. Overall this increase in sales has cancelled out
the impact of the decrease in sugar content in product A.
Product
Sales
(tonnes)
Sugar
(g/100g)
Sales
(tonnes)
Sugar
(g/100g)
Sales
(%)
Sugar
(%)
A 1,000 50 1,350 48 35 -4
B 500 30 500 30 0 0
C 100 20 100 20 0 0
Period 1 Period 2 Change

Sugar reduction: report on progress between 2015 and 2019
107
In other words, even though product A has less sugar in period 2, there are more high
sugar products in total sold in period 2 than in period 1.
Whilst this is a theoretical example designed to show the impact of a change in sales,
the results in this report have been impacted in this way.
As seen in the results section in Figure 2, there was a decrease of 0.4% in the SWA
total sugar per 100g for chocolate confectionery. However, Figure 19 showed there has
been an increase of 1.4 percentage points in the proportion of total sales that are
chocolate confectionery. Therefore, when looking at the overall change for all
categories, as chocolate is a relatively high sugar product, this increase in sales will
offset some of the reduction in total sugar content per 100g for chocolate.
This can also work the other way around if the proportion of products sold that have low
sugar content decreases over time. Between 2015 and 2019, there was a decrease of
0.7 percentage points in the proportion of sales from breakfast cereals, so some of the
13.3% reduction in SWA total sugar per 100g for breakfast cereals will be nullified when
looking at the average across all categories. This is because breakfast cereals in
general have lower sugar content than the average of all categories included in the
analysis.

Sugar reduction: report on progress between 2015 and 2019
108
Appendix 3: Methodology and results for
juice and milk based drinks
This section sets out the methodological approach used for the analysis of juice and
milk based drinks and the results of that analysis.
Methodology
Much of the methodology used in the analysis of products that come under the different
categories of juice and milk based drinks is the same as that used in the analysis of the
different food categories in the voluntary sugar reformulation programme and the drinks
that fall under the Soft Drinks Industry Levy (SDIL). This is detailed elsewhere in this
report and therefore this section will focus on the methodological aspects of the analysis
that are relevant only to juice and milk based drinks.
Time periods covered
The baseline year for juice and milk based drinks is 2017, and year 1 is 2019 for
retailers and manufacturer branded products and for relevant products sold in the eating
out of home sector.
Reporting metrics, categories and ambitions
Details of the drinks in scope, baseline figures, sugar reduction ambitions, sugar
allowances and maximum calorie guidelines for products likely to be consumed on a
single occasion can be found in the PHE technical guidelines, published in May 2018.
As is consistent with the rest of the sugar reduction programme, a series of metrics
have been used to measure progress in these drinks categories. Two commercial
datasets have been used to establish baseline sugar levels and monitor progress in
sugar and calorie reduction for juice and milk based drinks: Kantar FMCG (formerly
Kantar Worldpanel) for retailers and manufacturer branded products, and Lumina
Intelligence (formerly MCA) for the eating out of home sector.
The categories and associated reporting metrics for juice and milk based drinks are
presented below in Table 1. These apply to all sectors of the drinks industry:
• retailers and manufacturer branded products for consumption in the home
• the eating out of home sector (such as restaurants, takeaways, pubs and cafes)

Sugar reduction: report on progress between 2015 and 2019
109
Table 1. Summary of metrics, guidelines and examples of products for retailers and manufacturer branded and the eating out of home sector juice and milk based drink categories
Category
Simple average
(SA) against baseline
sugar (g per 100ml)
Sales weighted average (SWA) against baseline (g sugar
per 100ml)
Calorie (Kcal)
guidelines for
products likely to be consumed in a single occasion
Reduction ambitions
Product examples
Sweetened milk based drinks – retailers and manufacturer branded products
Pre-packed milk based drinksii
✓ ✓
Sugar per 100ml: - 10% interim reduction SWAi
- 20% final reduction SWAi
Kcals single serve: - 300kcal max
Milkshakes, flavoured milks, coffees, smoothies with larger % dairy
Pre-packed flavoured milk substitute drinks
✓ ✓
Sugar per 100ml: - 10% interim reduction SWAi - 20% final reduction SWAi Kcals single serve: - 300kcal max
Drinks in scope made with milk substitutes, including flavoured varieties
Pre-packed fermented (yogurt) drinks
✓ ✓
Sugar per 100ml: - 20% final reduction SWAi Kcals single serve: - 300kcal max
Kefirs, pre and probiotics, lassis, plant stanols and sterols
Coffee and tea powders, syrups and pods as consumediii
✓
Sugar per 100ml: - 10% interim reduction SAi - 20% final reduction SAi
Hot chocolate and malt powders, syrups and pods as consumediii
✓
Sugar per 100ml: - 10% interim reduction SAi - 20% final reduction SAi

Sugar reduction: report on progress between 2015 and 2019
110
Milkshake powders syrups and pods as consumediii
✓
Sugar per 100ml: - 10% interim reduction SAi - 20% final reduction SAi
Sweetened milk based drinks – eating out of home sector
Open cup hot/cold drinksiv
✓ ✓
Sugar per 100ml: - 10% interim reduction SAi - 20% final reduction SAi Kcals single serve: - 300kcal max
Coffees, hot chocolate, tea, frappes, seasonal beverages. Includes drinks in scope made with milk substitutes
Open cup milkshakesiv
✓ ✓
Sugar per 100ml: - 10% interim reduction SAi - 20% final reduction SAi Kcals single serve: - 300kcal max
Includes drinks in scope made with milk substitutes
Unsweetened juices – retailers and manufacturer branded products
Pre-packed mono juice
✓ ✓
Sugar per 100ml: - No increase in baseline SA Kcals single serve: - 150kcal max
For example, 100% apple, 100% orange, 100% carrot juice
Pre-packed blended juices
✓ ✓
Sugar per 100ml: - 5% final reduction SWA Kcals single serve: - 150kcal max
Mixed 100% juices, includes blended juices with dairy where the greater % is juice. Juice with water combinations drinks (minimum 20% juice), nut and plant sap waters
Unsweetened juices – eating out of home sector
Blended juices
✓ ✓
Sugar per 100ml: - 5% final reduction SA Kcals single serve: - 150kcal max
Mixed 100% juices, includes blended juices with dairy where the greater % is juice. Juice with water combinations drinks (minimum 20% juice), nut and plant sap waters

Sugar reduction: report on progress between 2015 and 2019
111
i Adjusted for sugar allowance for naturally occurring lactose or a basic level of sweetening for milk substitute drinks ii Containing more than 75% milk iii Made up to manufacturer’s instructions iv Whole drink as sold, with additions such as syrups, flavourings, and toppings
Progress for blended juices will be reported separately across the sectors. For retailers
and manufacturer branded blended juices progress against the ambition is assessed
using a sales weighted average, whereas for the eating out of home sector progress is
assessed using a simple average. Mono juices are reported on only for retailers and
manufacturer branded products and are monitored against the baseline simple average
not increasing.
The ambitions for juice and milk based drinks include maximum calorie guidelines for
products likely to be consumed on a single occasion for all categories apart from
powders, pods and syrups, due to the format in which these products are sold. The
individual categories of juice and milk based drinks have different calorie guidelines for
products likely to be consumed on a single occasion, as found in the juice and milk
based drinks technical guidelines and detailed in Table 1 above.
Retailers and manufacturer branded powdered, syrup and pod-based drinks
Kantar FMCG typically collects nutrition information for products as they are sold. There
are some products which are not consumed in the same way in which they are sold (for
example, milkshake and coffee powders, syrups or pods) and the information available
on packaging is for the product as it is consumed. Kantar FMCG provide a flag on their
dataset to indicate if the nutrition information is for the product ‘as consumed’ or ‘as
sold’. In instances where the information is provided ‘as sold’, efforts were made by
PHE nutritionists to source the ‘as consumed’ values through online searches, and
where this was not possible a standardised/individual dilution factor was applied to the
nutrition values.
No powders, syrups or pod products were used in the eating out of home sector
analysis.
Sugar allowances
Allowances have been made for naturally occurring sugars in milk (lactose) and a basic
level of sweetening for milk substitute drinks, as the sugars per 100ml guidelines are
based on a percentage reduction of the added sugar content rather than the total sugar
content. These allowances were established in collaboration with relevant trade bodies
and industry for the technical guidelines.
The sugar allowances for milk based drinks vary by category as detailed in Table 2.

Sugar reduction: report on progress between 2015 and 2019
112
Table 2: Sugar allowances for milk based drinks by category
Category Sugar allowance
per 100ml
Pre-packed milk based drinks Milkshake powders, syrups and pods (as consumed) Open cup milkshakes (eating out of home sector)
5.2g
Coffee and tea powders, syrups and pods (as consumed) 1.5g
Hot chocolate and malt powders, syrups and pods (as consumed)
2.8g
Pre-packed fermented (yogurt) drinks 3.8g
Open cup hot/cold milk based drinks (eating out of home sector)
3.8g
Pre-packed milk substitute drinks 2.0g
When calculating the percentage change from baseline (2017) to year 1 (2019) a similar
calculation takes place so the percentage change in added sugar content is compared
and not total sugar. For example, for pre-packed milk based drinks 5.2g sugar is
removed from both the baseline and year 1 sales weighted average sugar per 100ml
values before calculating the percentage difference between these values.
The milk based drinks categories for the eating out of home sector contain a
combination of cow’s milk and milk substitute products within the same categories.
Therefore, an average sugar allowance was created for these categories which may
vary between baseline and subsequent years depending on the ratio of cow’s milk to
milk substitute products included in the analysis.
The following is an example of applying sugar allowances to an eating out of home
sector category which contains a combination of cow’s milk and milk substitute products
to calculate percentage reduction guidelines.
The example is based on the open cup milkshake category:
1. For the guideline reduction to be based on added sugar rather than total sugar, an
average sugar allowance needs to be calculated which is then removed from the
baseline (2017) simple average total sugar per 100ml value. This allowance is
specific to each year’s dataset (as the category may have a differing proportions of
cow’s milk vs milk substitute products for example 60:40 in baseline vs 70:30 in
year 1) and is calculated by summing the product specific sugar allowances (5.2g
for cow’s milk products and 2.0g for milk substitute products) and dividing by the
number of products in the category.

Sugar reduction: report on progress between 2015 and 2019
113
2. For example, using a hypothetical category with 30 cow’s milk products and 20 milk
substitute products, the average sugar allowance would be: ((30 * 5.2) + (20 * 2.0)) /
50 = 3.9g sugar per 100ml. This allowance is then removed from the category’s
baseline simple average sugar per 100ml value, which for this example is 10g per
100ml: 10 – 3.9 = 6.1g added sugar per 100ml.
3. The 20% reduction guideline for added sugar is then calculated by reducing the
baseline added sugar value (6.1g/100ml) by 20% to give 4.9g/100ml (6.1 * 80% =
4.9). This is the guideline for added sugar.
4. To obtain the guideline value for total sugar, 3.9g sugar (the average sugar
allowance) is added back in to give 8.8g/100ml (4.9 + 3.9 = 8.8).
When calculating the percentage change from baseline (2017) to year 1 (2019) a similar
calculation takes place so the percentage change in added sugar is compared as
opposed to total sugar. This requires the average sugar allowance for the category in
the year 1 dataset to be calculated as in step 1. This allowance is then removed from
the year 1 simple average sugar per 100ml value before calculating the percentage
difference between these values. For example, if there was a 70:30 split of cow’s milk to
milk substitute products in year 1, the average sugar allowance for year 1 would be 4.2g
sugar per 100ml ((70 * 5.2) + (30 * 2.0)) / 100 = 4.2g.
Results
Retailers and manufacturer branded products
Sugar content of juice and milk based drinks products
For milk based drinks (excluding fermented (yogurt) drinks), there are interim and
overall ambitions of a 10% reduction in sugar content by 2019 and a 20% reduction in
sugar content by 2021 respectively. These ambitions are either based on the simple
average or sales weighted average sugar content depending on the category (see
Table 1). For juices, there is a 5% ambition for sugar reduction in the sales weighted
average in blended juices and an ambition for mono juices of no increase in the
baseline simple average sugar content.
In this section, simple averages are presented first as this provides an overview for all
categories.
Figure 1 shows that, for milk based drinks, there has been a reduction of more than
10% in the simple average sugar content (grams per 100 ml) in 5 of the 6 categories
between baseline (2017) and year 1 (2019).

Sugar reduction: report on progress between 2015 and 2019
114
Specifically, it can be seen that for the simple average sugar content (g/100ml):
• there were large reductions for pre-packed fermented (yogurt) drinks (down 26.0%),
pre-packed flavoured milk substitute drinks (down 21.7%), pre-packed milk based
drinks (down 21.0%), coffee and tea powders, syrups and pods as consumed (down
17.8%), and milkshake powders, syrups and pods as consumed (down 12.1%)
• only hot chocolate and malt powders, syrups and pods (as consumed) have shown
no progress (0.2% increase)
• progress was also seen for the 2 juice based drinks categories, with a reduction of
1.2% average sugar content for pre-packed mono juice and 4.5% for pre-packed
blended juice

Sugar reduction: report on progress between 2015 and 2019
115
Figure 1: Percentage change in simple average sugar by juice and milk based drinks category between baseline
(2017) and year 1 (2019) for retailers and manufacturer branded products
Number of
products
baseline
Number of
products
Year 1
% change
simple
average
Milk based drinks
Pre-packed milk based drinks 242 231 -21.0
Pre-packed flavoured milk substitute drinks 39 49 -21.7
Pre-packed fermented (yogurt) drinks 139 136 -26.0
Coffee and tea powders, syrups and pods as consumed 121 168 -17.8
Hot chocolate and malt powders, syrups and pods as consumed 159 141 0.2
Milkshake powders, syrups and pods as consumed 33 31 -12.1
Juices
Pre-packed mono juices 540 466 -1.2
Pre-packed blended juices 478 436 -4.5
Note: The percentage change is based on added sugar rather than total sugar for the milk based drink categories, meaning the sugar allowance values
are removed from both the baseline and Year 1 total sugar values before the percentage change is calculated.
-30 -25 -20 -15 -10 -5 0 5
Change in Simple Average Sugar per 100ml (%)

Sugar reduction: report on progress between 2015 and 2019
116
The sales weighted average sugar content (g/100ml) is being used to monitor progress for 4 categories. These are presented
in Figure 2 which shows that:
• all 4 categories (3 milk based drinks and 1 juice based drink) show a decrease in the sales weighted average sugar content
• the reduction in pre-packed milk based drinks and pre-packed fermented (yogurt) drinks was 22.1% and 13.4% respectively
• the reduction in pre-packed flavoured milk substitute drinks was lower at 5.3%
• the reduction in pre-packed blended juices was 3.6%
Figure 2: Percentage change in sales weighted average (SWA) sugar by juice and milk based drinks category between
baseline (2017) and year 1 (2019) for retailers and manufacturer branded products
Number of
products
baseline
Number of
products
Year 1
% change
SWA
Milk based drinks
Pre-packed milk based drinks 242 231 -22.1
Pre-packed flavoured milk substitute drinks 38 48 -5.3
Pre-packed fermented (yogurt) drinks 139 136 -13.4
Juices
Pre-packed blended juices 478 436 -3.6
Note: The percentage change is based on added sugar rather than total sugar for the milk based drink categories, meaning the sugar allowance values
are removed from both the baseline and Year 1 total sugar values before the percentage change is calculated.
-25 -20 -15 -10 -5 0
Change in Sales Weighted Average Sugar per 100ml (%)

Sugar reduction: report on progress between 2015 and 2019
117
Progress at business level
The top selling 10 retailers and manufacturer branded businesses in each category
(based on volume of sales) were analysed for changes in average sugar content
between baseline (2017) and year 1 (2019). The percentage change in sales weighted
average or simple average grams of sugar per 100ml at a business level is shown in
Figure 3. The green dotted line shows the year 1 interim ambition for milk based drinks,
highlighting that a number of businesses have met or exceeded this across the milk
based drinks categories.
A restriction on the use of the data from Kantar FMCG meant that businesses were
required to consent to have their individual business level results presented. Therefore,
some data is missing from the Figure 3 where permission was not given or no response
received to the request, and some additional data has been removed if it was felt that
the where there were concerns around the comparability of the results between
baseline (2017) and year 1 (2019) data were not comparable28.
Figure 3 (see next page): Changes in sales weighted average (SWA) and simple
average sugar per 100ml by category and business between baseline (2017) and
year 1 (2019) for retailers and manufacturers
28 Data for these businesses was still used to calculate category level averages.

Sugar reduction: report on progress between 2015 and 2019
118
Milk based drinks
Manufacturer or retailer % change1
Baseline (2017) Year 1 (2019) SWA change2
Pre-packed milk based drinks -22%
Arla Foods 20 21 -1%
Asda Stores Ltd 17 17 -41%
Co-op 3 6 -2%
Friesland Campina No response
Lidl UK 2 5 -31%
Muller UK and Ireland No permission
Sainsbury’s Plc 6 7 Not comparable
Tesco Food Stores Ltd 10 21 -45%
Waitrose & Partners 3 4 2%
WM Morrisons Supermarkets Plc 12 10 -33%
SWA change2
Pre-packed flavoured milk substitute drinks -5%
ALL Market Europe Ltd No permission
Alpro UK Ltd 16 17 -4%
Blue Diamond Growers 3 1 0%
Califia Farms LLC 0 5 N/A
Fayrefield Foods Ltd No response
Hain Daniels No permission
Oatly UK 3 2 0%
Provitamil from Drinks Brokers Ltd 2 2 -46%
Rebel Kitchen 5 4 -8%
Rude Health Foods Ltd No response
SWA change2
Pre-packed fermented (yogurt) drinks -13%
ALDI Stores Ltd 5 6 -64%
Asda Stores Ltd 7 5 -19%
Danone UKI 30 30 -4%
Lactalis Nestle UK Ltd 3 2 0%
Lidl UK 7 10 6%
Raisio No response
Tesco Food Stores Ltd 7 7 -27%
WM Morrisons Supermarkets Plc 5 10 -84%
Yakult UK Ltd 3 4 -2%
Yoplait 5 8 -6%
SA change2
Coffee and tea powders, syrups and pods as consumed -18%
Aimia Foods No response
ALDI Stores Ltd 2 6 45%
All About Food Limited 0 1 N/A
Asda Stores Ltd 10 11 -47%
Asia UK Trading Ltd No response
Douwe Egberts (U K)Ltd No response
Euro Caps Bv No response
Lidl UK 0 4 N/A
Nestle UK 59 79 -15%
Royaltea Ltd No response
SA change2
Hot chocolate and malt powders, syrups and pods as consumed 0%
ALDI Stores Ltd 0 1 N/A
Asda Stores Ltd 10 7 -1%
Clipper Teas Ltd (Trading as Wessanen UK) 2 2 0%
GSK+Novartis No response
Mars Wrigley Confectionery UK Ltd 26 24 -13%
Mondelez International 31 31 Not comparable
Nestle UK 9 7 Not comparable
Prinsen Berning No permission
Tesco Food Stores Ltd 6 9 -30%
Twinings No response
SA change2
Milkshake powders, syrups and pods as consumed -12%
Aimia Foods No response
Asda Stores Ltd 3 3 Not comparable
Mondelez International 0 1 N/A
Nestle UK 6 7 -10%
Tesco Food Stores Ltd 5 4 -35%
The Silver Spoon Company 17 12 N/A3
WM Morrisons Supermarkets Plc 2 2 -11%
Notes
Number of products
1. This is a change in sales weighted average for the categories with sales weighted average guidelines, and simple averages for the categories with simple average
guidelines (all powders, syrups and pod categories).
2. The percentage change is based on added sugar rather than total sugar for the milk based drink categories, meaning the sugar allowance values are removed from
both the baseline and year 1 total sugar values before the percentage change is calculated.
3. A percentage decrease was observed but cannot be accurately reported due to methodological limitations.
4. Manufacturers and retailers are listed in alphabetical order within each category. They are not listed by volume of sugar sales.
5. The green dotted line indicates the category's interim guideline. There is no line for pre-packed fermented (yogurt) drinks as this category does not have an interim
guideline.
-100% -80% -60% -40% -20% 0% 20%

Sugar reduction: report on progress between 2015 and 2019
119
Calories likely to be consumed on a single occasion
There are 5 juice and milk based drinks categories where the calories likely to be
consumed on a single occasion are being monitored. Of these, 4 of the 5 categories
have shown a decrease in simple average calorie content between baseline (2017) and
year 1 (2019), and all 5 categories have also shown a decrease in the sales weighted
average sugar content.
The change in sales weighted average calories likely to be consumed on a single
occasion (per single serving) is shown in Figure 4 and presented as a percentage
change in Figure 5.
It can be seen that:
• pre-packed milk based drinks achieved the largest percentage decrease of 11.2%
(from 227 calories to 201 calories per serving)
• all the other categories (pre-packed flavoured milk substitute drinks, pre-packed
fermented (yogurt) drinks, pre-packed mono juices, and pre-packed blended juices)
showed a reduction in the sales weighted average calories per serving of between
2.9% and 6.1%
Juices
Manufacturer or retailer % change1
Baseline (2017) Year 1 (2019) SA change
Pre-packed mono juices -1%
ALDI Stores Ltd 22 18 -9%
Asda Stores Ltd 44 33 -5%
Co-op 21 19 0%
Innocent drinks 16 14 1%
Lidl UK 17 13 -6%
PepsiCo 59 49 -4%
Sainsbury’s Plc 52 42 0%
Tesco Food Stores Ltd 53 55 2%
Waitrose & Partners 40 34 -5%
WM Morrisons Supermarkets Plc 35 39 -3%
SWA change
Pre-packed blended juices -4%
ALDI Stores Ltd 4 4 -21%
Asda Stores Ltd 28 26 -4%
Co-op 7 3 3%
Innocent drinks 67 76 2%
Lidl UK 5 8 -8%
PepsiCo 64 64 2%
Sainsbury’s Plc 24 20 -8%
Tesco Food Stores Ltd 32 19 -2%
Waitrose & Partners 14 14 -14%
WM Morrisons Supermarkets Plc 19 14 -1%
Note
Number of products
1. This is a change in sales weighted average for the categories with sales weighted average guidelines, and simple averages for the categories with simple average
guidelines (mono juices).
-30% -20% -10% 0% 10%

Sugar reduction: report on progress between 2015 and 2019
120
Figure 4: Change in sales weighted average (SWA) calories in products likely to be consumed on a single occasion by
juice and milk based drink category for baseline (2017) and year 1 (2019) for retailers and manufacturer branded
products
Baseline Year 1 Baseline Year 1
Milk based drinks
Pre-packed milk based drinks 194 175 227 201
Pre-packed flavoured milk substitute drinks 25 26 151 146
Pre-packed fermented (yogurt) drinks 133 127 61 58
Juices
Pre-packed mono juices 145 133 94 91
Pre-packed blended juices 211 196 103 97
SWA
(kcals/serving)Number of products
0 50 100 150 200 250
Sales Weighted Average Calories (kcals/serving)
Baseline
Year 1

Sugar reduction: report on progress between 2015 and 2019
121
Figure 5: Percentage change in sales weighted average (SWA) of calories in products likely to be consumed on a
single occasion by juice and milk based drink category between baseline (2017) and year 1 (2019) for retailers and
manufacturer branded products
Number of
products
baseline
Number of
products
Year 1
% change
SWA
Milk based drinks
Pre-packed milk based drinks 194 175 -11.2
Pre-packed flavoured milk substitute drinks 25 26 -2.9
Pre-packed fermented (yogurt) drinks 133 127 -4.1
Juices
Pre-packed mono juices 145 133 -3.6
Pre-packed blended juices 211 196 -6.1
-15 -10 -5 0Change in Sales Weighted Average
Calories per serving (%)

Sugar reduction: report on progress between 2015 and 2019
122
Figure 6 shows the proportion of products at or below the guideline for calories likely to
be consumed on a single occasion (per single serving), for the different categories, and
how this has changed between baseline (2017) and year 1 (2019).
It can be seen that:
• the proportion of pre-packed flavoured milk substitute drinks meeting the guideline
has remained at 100%
• the remaining 4 categories have all seen increases in the proportion of products that
are at or below the guideline for calories per serving

Sugar reduction: report on progress between 2015 and 2019
123
Figure 6: Proportion of products at or below the guideline for calories per serving for baseline (2017) and year 1 (2019)
for retailers and manufacturer branded products
Baseline Year 1 Baseline Year 1
Milk based drinks
Pre-packed milk based drinks 300 194 175 79 90
Pre-packed flavoured milk substitute drinks 300 25 26 100 100
Pre-packed fermented (yogurt) drinks 300 133 127 89 91
Juices
Pre-packed mono juices 150 145 133 86 87
Pre-packed blended juices 150 211 196 82 83
Number of products
% meeting
guidelineGuideline
(kcal/serving)
0 20 40 60 80 100
Proportion at or below maximum calories per serving guideline (%)
Baseline
Year 1

Sugar reduction: report on progress between 2015 and 2019
124
Progress at business level
Figure 7 shows the proportion of retailers and manufacturer branded products meeting
the maximum calories per serving guidelines in year 1 (2019) at a business level. The
number of products used in the analysis is also present to aid interpretation. A higher
proportion of businesses in the milk based drinks categories have all of their products
meeting the maximum calories per serving guideline compared to juice based drinks
categories.
Figure 7: Proportion of products meeting the maximum calories per serving
guideline for products likely to be consumed on a single occasion by category
and business between baseline (2017) and year 1 (2019) for retailers and
manufacturers
Milk based drinks
Manufacturer or Retailer Number of products
Proportion meeting
maximum calories per
serving guideline (%)
Guideline: 300 kcals/serve
Pre-packed milk based drinks 175 90%
Arla Foods 20 90%
Asda Stores Ltd 12 100%
Crediton Dairy Ltd 5 100%
Emmi UK Ltd 5 100%
Friesland Campina No response
Good Natured (Happy Monkey) Ltd 4 100%
Lidl UK 2 100%
Mars Wrigley Confectionery UK Ltd 10 100%
Muller UK and Ireland No permission
Tesco Food Stores Ltd 11 100%
Guideline: 300 kcals/serve
Pre-packed flavoured milk substitute drinks 26 100%
ALL Market Europe Ltd No permission
Alpro UK Ltd 8 100%
Califia Farms LLC 2 100%
Chi Drinks Ltd No response
First Grade International No response
Framptons Ltd No response
Minor Figures Ltd No response
Plenish No response
Rebel Kitchen 4 100%
Vitasoy Int Holdings Ltd No response
Guideline: 300 kcals/serve
Pre-packed fermented (yogurt) drinks 127 91%
ALDI Stores Ltd 6 100%
Asda Stores Ltd 5 100%
Danone UKI 30 100%
Lactalis Nestle UK Ltd 2 100%
Lidl UK 4 100%
Raisio No response
Tesco Food Stores Ltd 7 100%
WM Morrisons Supermarkets Plc 10 100%
Yakult UK Ltd 4 100%
Yoplait 8 75%
Note
1. Manufacturers and retailers are listed in alphabetical order within each category. They are not listed by number of
servings sold.
0% 50% 100%

Sugar reduction: report on progress between 2015 and 2019
125
Eating out of home sector29
Sugar content of juice and milk based drinks products and calories likely to be
consumed on a single occasion
Analysis of the eating out of home sector looks at the simple average of both sugar
content (grams per 100ml) and calories likely to be consumed on a single occasion. For
this sector, sales weighted averages cannot be calculated due to problems linking
purchases and nutrition data, as explained previously.
Comparisons between baseline (2017) and year 1 (2019) should be treated with caution
due to differing numbers and profile of products included in the analysis. Figure 8 shows
the change in values for sugar content and calories likely to be consumed on a single
occasion from baseline while Figure 9 shows the percentage change. The proportion of
products at or below the guidelines for calories likely to be consumed on a single
occasion (per single serve) are set out in Figure 10.
29 April 2021 – Due to an error found with the data, baseline figures for juices and milk based drinks for the eating out of home
sector have been revised
Juices
Manufacturer or Retailer Number of products
Proportion meeting
maximum calories per
serving guideline (%)
Guideline: 150 kcals/serve
Pre-packed mono juices 133 87%
ALDI Stores Ltd 3 100%
Asda Stores Ltd 5 100%
Co-op 4 100%
Coca-Cola GB 6 83%
Lidl UK 1 100%
PepsiCo 17 100%
Sainsbury’s Plc 11 100%
Tesco Food Stores Ltd 17 100%
Waitrose & Partners 5 80%
WM Morrisons Supermarkets Plc 8 100%
Guideline: 150 kcals/serve
Pre-packed blended juices 196 83%
Asda Stores Ltd 3 67%
Britvic Soft Drinks Ltd 15 100%
Cawston Press 13 100%
Coca-Cola GB 13 100%
Good Natured (Happy Monkey) Ltd 3 100%
Innocent drinks 38 68%
J Garcia Carrion S.A. No response
Marks and Spencer plc 10 60%
PepsiCo 20 40%
Tesco Food Stores Ltd 5 100%
Note
1. Manufacturers and retailers are listed in alphabetical order within each category. They are not listed by number of
servings sold.
0% 50% 100%

Sugar reduction: report on progress between 2015 and 2019
126
Figures 8, 9 and 10 show that:
• open cup milkshakes showed a 7.8% increase in sugar content, but a 2.8% decrease
in calories per single serving from baseline
• by contrast, open cup hot/cold drinks showed a decrease in sugar content of 6.8%,
but an increase in calories per single serving of 10.0%
• over the same time, blended juice drinks showed a 1.5% increase in sugar content
1.1% increase in calories per serving
• between baseline and year 1, all categories showed a decrease in the percentage of
products at or below the maximum calories per serving guideline (open cup
milkshakes 43% down to 38%, open cup hot/cold drinks from 69% to 56%, and
blended juice drinks from 46% to 39%)
The average portion size in each of the product categories has increased for this sector.
This can help to explain the results observed in the open cup hot/cold drinks category,
because an increase in portion size will generally lead to an increase in calories per
single serving (even if the sugar content has reduced). This is particularly the case in
drinks which contain more milk, such as lattes. For open cup milkshakes the average
sugar content has increased while the average calories per single serving has
decreased. This can be attributed to the increase in products included in the calories
per single serving analysis, some of which are smaller servings aimed at children.

Sugar reduction: report on progress between 2015 and 2019
127
Figure 8: Change in sugar content (g/100ml) and calories per single serving in the eating out of home sector
categories between baseline (2017) and year 1 (2019)
Simple average total sugar (g/100ml) by category
BaselineYear 1
Milk based drinks
Open cup milkshakes 14.2 14.9
Open cup hot/cold drinks 7.7 7.4
Juices
Blended juices 8.8 8.9
Simple average calories (kcals/serving) by category
BaselineYear 1
Milk based drinks
Open cup milkshakes 376 366
Open cup hot/cold drinks 253 279
Juices
Blended juices 196 198
0 100 200 300 400
Simple Average Calories (kcals/serving)
Baseline
0 5 10 15 20
Simple Average Total Sugar (g/100ml)
Baseline
Year 1

Sugar reduction: report on progress between 2015 and 2019
128
Figure 9: Percentage change in sugar content (g/100ml) and calories per single serving in the eating out of home
sector categories between baseline (2017) and year 1 (2019)
Percentage change simple average sugar (g/100ml) by category
% change
Milk based drinks
Open cup milkshakes 7.8
Open cup hot/cold drinks -6.8
Juices
Blended juices 1.5
Percentage change simple average kcals per serving by category
% change
Milk based drinks
Open cup milkshakes -2.8
Open cup hot/cold drinks 10.0
Juices
Blended juices 1.1
Note: This is calculated using the adjusted simple average sugar values for the milk based drinks category,
and the simple average total sugar for the blended juices category.
-10 -5 0 5 10
Change in Simple Average Sugar per
100ml (%)
-5 0 5 10 15
Change in Simple Average Calories
per serving (%)

Sugar reduction: report on progress between 2015 and 2019
129
Figure 10: Percentage of products at or below the maximum calories per serving guideline in the eating out of
home sector categories between baseline (2017) and year 1 (2019)
Proportion at or below maximum calories per serving guideline by category (%)
Guideline
kcal/serving BaselineYear 1
Milk based drinks
Open cup milkshakes 300 43 38
Open cup hot/cold drinks 300 69 56
Juices
Blended juices 150 46 39
0 20 40 60 80
Proportion at or below maximum calories per serving guideline (%)
Baseline
Year 1

Sugar reduction: report on progress between 2015 and 2019
130
Progress at business level
For the eating out of home sector the business level data is more limited than for
retailers and manufacturers. The business level analysis, presented in Appendix Table
13 shows the change in simple average total sugar (grams) and the proportion of
products meeting maximum calories per portion guideline. Figure 11 shows the simple
average total sugar by category for baseline (2017 and year 1 (2019), and Figure 12
shows the proportion of products meeting the guidance by business for the eating out of
home sector.
Appendix Table 13 and Figures 11 and 12 show that:
• for the 3 businesses with valid data on milk based drinks at baseline (2017) and
year 1 (2019) reductions in the simple average sugar content (grams per 100ml)
were seen. Of these, 1 has achieved the 10% interim guideline
• the simple average sugar content for juices decreased for 2 of the 3 businesses
with valid data during the same period
• Figure 12 shows variability in the proportion of products that were at or below the
maximum calories per single serving guideline between businesses in the year 1
analysis (2019), ranging from 0% to 100%
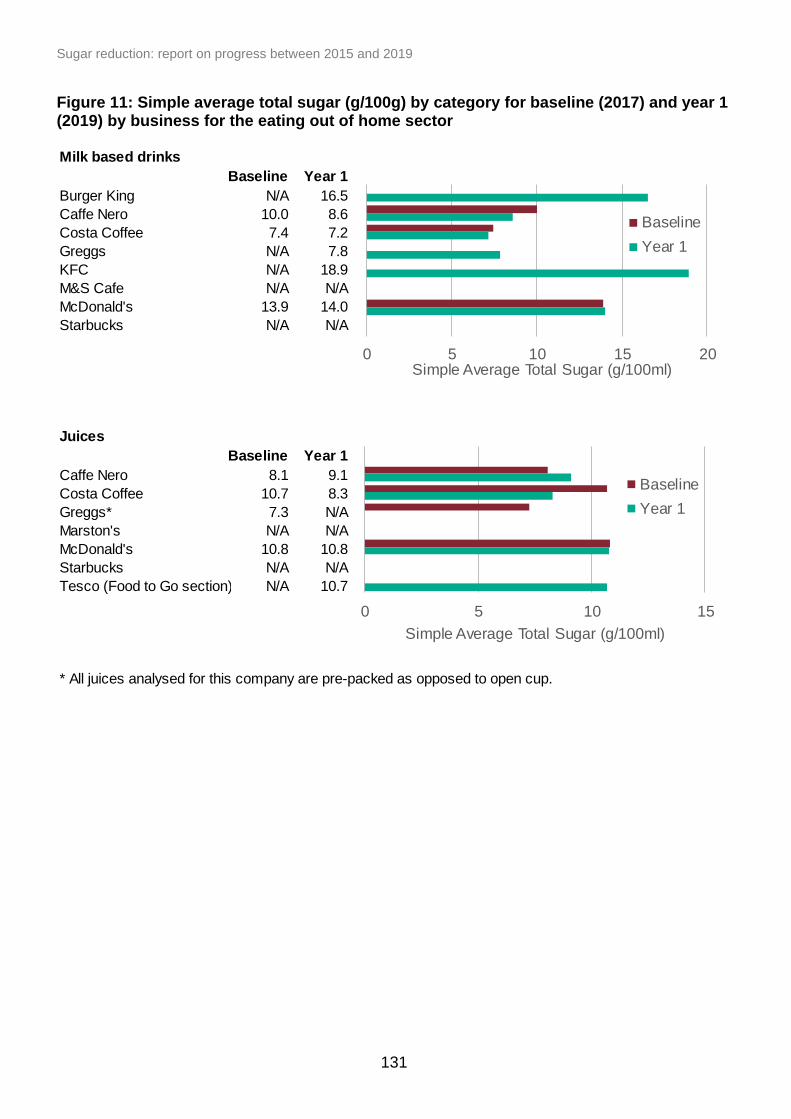
Sugar reduction: report on progress between 2015 and 2019
131
Figure 11: Simple average total sugar (g/100g) by category for baseline (2017) and year 1 (2019) by business for the eating out of home sector
Milk based drinks
Baseline Year 1
Burger King N/A 16.5
Caffe Nero 10.0 8.6
Costa Coffee 7.4 7.2
Greggs N/A 7.8
KFC N/A 18.9
M&S Cafe N/A N/A
McDonald's 13.9 14.0
Starbucks N/A N/A
Juices
Baseline Year 1
Caffe Nero 8.1 9.1
Costa Coffee 10.7 8.3
Greggs* 7.3 N/A
Marston's N/A N/A
McDonald's 10.8 10.8
Starbucks N/A N/A
Tesco (Food to Go section)* N/A 10.7
* All juices analysed for this company are pre-packed as opposed to open cup.
0 5 10 15 20Simple Average Total Sugar (g/100ml)
Baseline
Year 1
0 5 10 15
Simple Average Total Sugar (g/100ml)
Baseline
Year 1

Sugar reduction: report on progress between 2015 and 2019
132
Figure 12: Percentage of products at or below the maximum calories per serving guideline in year 1 (2019) by category and business for the eating out of home sector#
Data limitations
The sugar allowance values for milk based drinks (both for retailers and manufacturer
branded product data and the eating out of home sector data) are specific to the
category, rather than the product, as the sugar allowance values at the product level to
inform the calculations were not available. However, these allowances were established
in collaboration with relevant trade bodies and industry therefore are as accurate as
possible.
Milk based drinks
Burger King 8%
Caffe Nero 52%
Costa Coffee 60%
Greggs 100%
KFC 91%
M&S Cafe N/A
McDonald's 46%
Starbucks 53%
Juices
Caffe Nero 71%
Costa Coffee 83%
Greggs* N/A
Marston's 67%
McDonald's 0%
Starbucks N/A
Tesco (Food to Go section)* 100%
* All juices analysed for this company are pre-packed as opposed to open cup.
0% 20% 40% 60% 80% 100%
Proportion at or below maximum calories per serving guideline (%)
0% 20% 40% 60% 80% 100%
Proportion at or below maximum calories per serving guideline (%)

Sugar reduction: report on progress between 2015 and 2019
133
Retailers and manufacturer branded products
For the powders, syrups and pods milk based drinks category, there is an assumption
that the consumer will make the product according to the manufacturer’s instructions,
with the exact ratio of powder/syrup/pod to milk, and that they will be using the type of
milk stated in the instructions, for example semi-skimmed milk. This category cannot
accurately have sales information adjusted to ‘as consumed’ values because of
limitations in the dataset meaning that simple average reduction ambitions are used as
opposed to sales weighted average.
Eating out of home sector
For open cup milk based drinks there is an assumption that the drink will be made
identically to the drink on which the nutrition information is calculated, with the same
ratio of each ingredient used. There is also the assumption that the consumer does not
add additional ingredients, for example sugar or milk after they have received the drink.
Data quality and availability of the data for the eating out of home sector has improved
from baseline to year 1 meaning there are a larger number of drinks included in the year
1 analysis than at baseline. These drinks could have existed at baseline, but if their
nutrition information was not available to PHE at this time they would not be included in
the analysis. This should be considered when comparing results between baseline and
year 1.
Since publication of the sugar reduction technical guidelines for juice and milk based
drinks, PHE has undertaken work with Lumina Intelligence, the commercial data
provider for the eating out of home sector, to explore opportunities to improve the level
of detail in data collection for juice and milk based drinks. This was to ensure that PHE
are able to capture an increased level of detail for monitoring sugar reduction progress
by industry in juice and milk based drinks that are purchased in the eating out of home
sector. Further detail on the limitations of this data are available in the technical
guidelines.
Although efforts were made to improve the granularity of the data received, it was not
possible to get meaningful results within the timeframe required. Therefore, results are
not presented within this report.

Sugar reduction: report on progress between 2015 and 2019
134
References
HM Government:
• Childhood obesity: a plan for action (2016)
• Childhood obesity: a plan for action, chapter 2 (2018)
• Advancing our health: prevention in the 2020s (2019)
• Tackling obesity: empowering adults and children to live healthier lives (2020)
• Sugar reduction: juice and milk-based drinks (2018)
• Soft Drinks Industry Levy (2018)
• Sugar reduction: report on first year progress (2018)
• Sugar reduction: achieving the 20% (2017)
• Fermented (yogurt) drinks (2019)
• Salt reduction: targets for 2024 (2020)
• Sugar reduction: report on progress between 2015 and 2018 (2019)
• Budget 2016 (2016)
• SACN Carbohydrates and health report (2015)
• NDNS: time trend and income analyses for Years 1 to 9 (2019)
• Calorie reduction: guidelines for the food industry (2020)
• Salt targets 2017: second progress report (2020)
NHS Digital:
• National Child Measurement Programme England
• Health Survey for England 2017 – Adult overweight and obesity: National Statistics
(2018)


