12
Sugary Drinks: How Much Do We Consume? A Neighborhood Report by the Bronx, Brooklyn and Harlem District Public Health Offices
| Date post: | 21-Apr-2018 |
| Category: |
Documents |
| Upload: | nguyendiep |
| View: | 215 times |
| Download: | 1 times |

Sugary Drinks:How Much Do We Consume?
A Neighborhood Report by the Bronx, Brooklyn
and Harlem District Public Health Offices

District Public Health Offices
1. Residents of East and Central Harlem, North and Central Brooklyn, andthe South Bronx are more likely to drink sugary drinks, and to drink 4 ormore sugary drinks daily, than are residents of the Upper West Side andFlatbush. • Across all neighborhoods surveyed, most respondents (84%) reported drinking sugary drinks in a typical week.
• 4 in 10 East and Central Harlem, North and Central Brooklyn, and South Bronx residents drink 4 or more sugary drinks daily, compared with 1 in 10 Upper West Side residents.
2. Water is generally accepted as an alternative to sugary drinks, but someresidents expressed concern about the safety of tap water. • Nearly all respondents (97%) who drink sugary drinks reported they would be willing to drinkwater as an alternative if sugary drinks weren’t available.
• More than 1 in 4 respondents reported that they would not drink New York City tap water.
3. Sugary drinks are introduced to children, on average, at age 4 years orearlier, and soda consumption increases with a child’s age. • Half of the youngest children (0 to 2 years) consume juice drinks, and almost 4 in 10 of theoldest children (13 to 17 years) drink regular, non-diet soda.
• Parents in the South Bronx and East and Central Harlem introduce sugary drinks to their childrenearlier (around 3.5 years of age) than do parents in North and Central Brooklyn, the Upper WestSide and Flatbush (around 4.5 years of age).
4. Residents of East and Central Harlem, North and Central Brooklyn and theSouth Bronx are much more likely to think that their close friends drinkregular soda and give it to their children than are residents of the UpperWest Side and Flatbush.
5. Despite the fact that most young children are given soda to drink, themajority of adult residents across all neighborhoods do not think it is anacceptable practice.• Across all neighborhoods, few respondents (16%) think it is acceptable to give 5-year-old childrenregular, non-diet soda; even fewer (5%) believe it is acceptable to give regular soda to children 1 year of age.
Key Findings
Citation: Alberti P and Noyes P. Sugary Drinks: How Much Do We Consume? New York, NY. New York City Department of Health andMental Hygiene, 2011
Acknowledgements: We would like to acknowledge: Cindy Gordon, Ruqayyah Abdulla, Raffaella Espinoza, Tamara Dumanovsky, Lynn Silver, Erum Hadi, SarahTimmins-DeGregory, Jane Bedell, Audrey Castillo, Jennifer Charles, Tegan Culler, Maria Garcia, Britney Garr, Roger Hayes, Lenore James,Jordan Katz, Crystal Lee, Aletha Maybank, Jeannette Pineda, Amy Henderson Riley, Richard Sierra, Rebecca Wellman, Lynette Wright
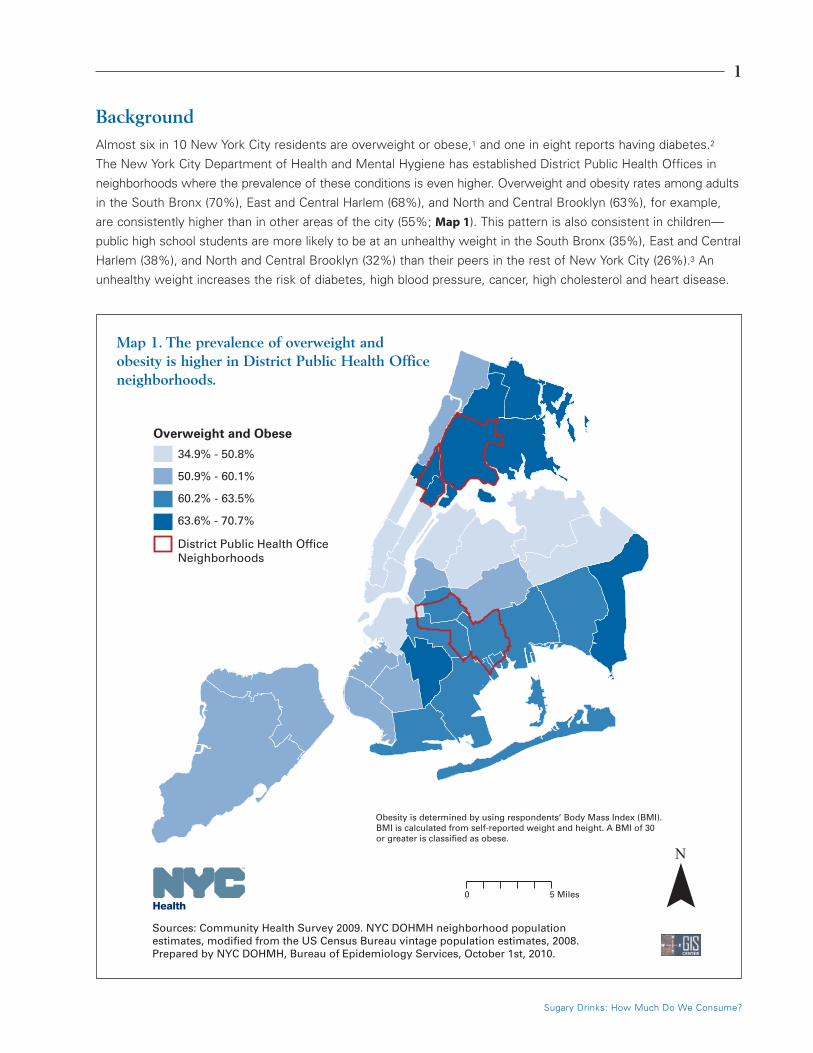
BackgroundAlmost six in 10 New York City residents are overweight or obese,1 and one in eight reports having diabetes.2
The New York City Department of Health and Mental Hygiene has established District Public Health Offices in
neighborhoods where the prevalence of these conditions is even higher. Overweight and obesity rates among adults
in the South Bronx (70%), East and Central Harlem (68%), and North and Central Brooklyn (63%), for example,
are consistently higher than in other areas of the city (55%; Map 1). This pattern is also consistent in children—
public high school students are more likely to be at an unhealthy weight in the South Bronx (35%), East and Central
Harlem (38%), and North and Central Brooklyn (32%) than their peers in the rest of New York City (26%).3 An
unhealthy weight increases the risk of diabetes, high blood pressure, cancer, high cholesterol and heart disease.
1
Sugary Drinks: How Much Do We Consume?
Overweight and Obese
34.9% - 50.8%
50.9% - 60.1%
60.2% - 63.5%
63.6% - 70.7%
District Public Health Office Neighborhoods
O
Obesity is determined by using respondents’ Body Mass Index (BMI). BMI is calculated from self-reported weight and height. A BMI of 30 or greater is classified as obese.
0 5 Miles
N
Sources: Community Health Survey 2009. NYC DOHMH neighborhood population estimates, modified from the US Census Bureau vintage population estimates, 2008.Prepared by NYC DOHMH, Bureau of Epidemiology Services, October 1st, 2010.
Map 1. The prevalence of overweight and obesity is higher in District Public Health Officeneighborhoods.

2
District Public Health Offices
Many factors contribute to weight gain and diet-related illnesses. An abundance of heavily-marketed, high-calorie
foods with low nutritional value (common in underserved areas) and fewer opportunities for physical activity
contribute to overweight and obesity.4 Over the past 30 years, Americans’ caloric intake has increased by 200
to 300 calories per day,5 with the largest single increase due to sugary drinks. Nearly half of the added sugar
we consume is now from sugar-sweetened drinks.6 Consuming sugary drinks is directly related to weight gain
and obesity.7
In the Health Department’s annual Community Health Survey (a telephone survey of adult residents aged 18 and
older across all 5 boroughs of the city), residents in District Public Health Office neighborhoods reported drinking
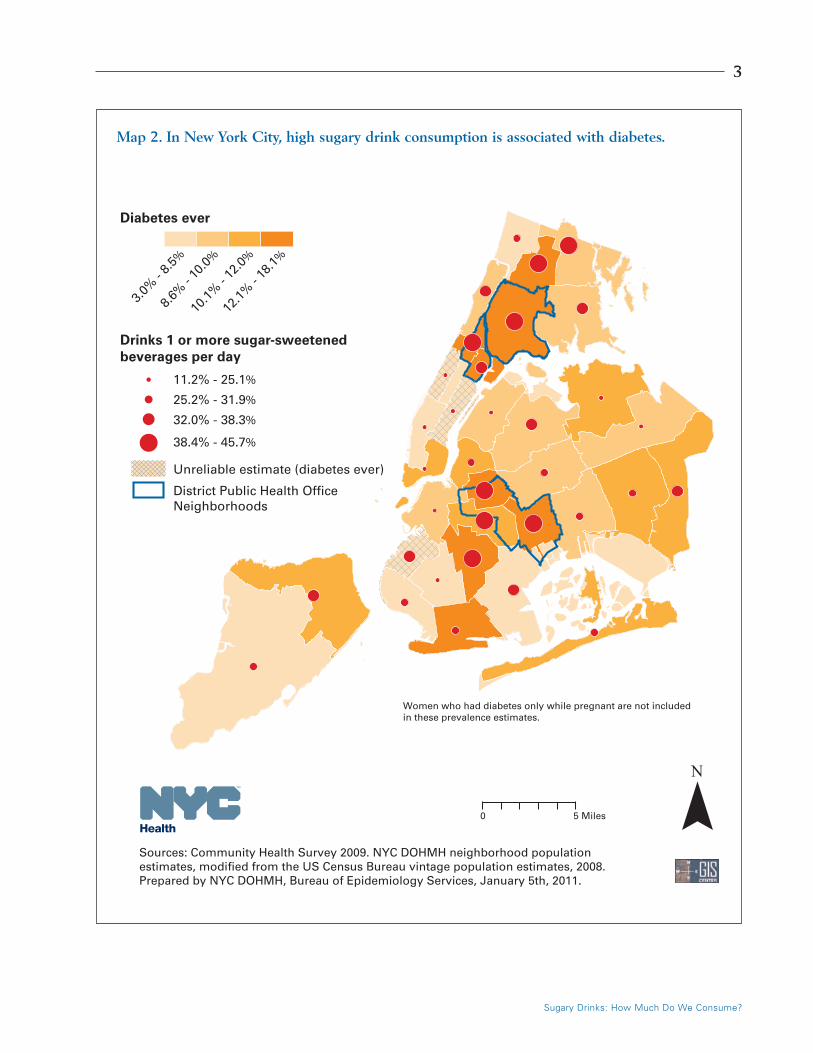
more sugary drinks than people living in other parts of the city (Table 1). Map 2 shows the relationship between
consumption of sugary drinks and diabetes (which is obesity-related); residents of neighborhoods where sugary
drink consumption is high are more likely to report a diagnosis of diabetes.
This report examines sugary drink consumption patterns in specific New York City neighborhoods (East and
Central Harlem, the South Bronx, North and Central Brooklyn, the Upper West Side and Flatbush).
Table 1. Adult residents of District Public Health Office neighborhoods reported consumingmore sugar-sweetened beverages than did residents of other New York City neighborhoods.*
Survey respondents who drink 1 ormore 12-ounce sugar-sweetened
beverages** daily (%)
Survey respondents who drink2 or more 12-ounce sugar-sweetened sodas daily (%)
District Public Health Officeneighborhoods
Bronx 45.5 12.5
Brooklyn 43.2 13.2
Harlem 41.7 11.8
All other New York Cityneighborhoods 29.1 8.4
*Source: 2009 Community Health Survey: www.nyc.gov/health/epiquery **Soda, iced tea, sports drinks, juice drinks, energy drinks
3
Sugary Drinks: How Much Do We Consume?
Map 2. In New York City, high sugary drink consumption is associated with diabetes.
0 5 Miles
N
Sources: Community Health Survey 2009. NYC DOHMH neighborhood population estimates, modified from the US Census Bureau vintage population estimates, 2008.Prepared by NYC DOHMH, Bureau of Epidemiology Services, January 5th, 2011.
Women who had diabetes only while pregnant are not included in these prevalence estimates.
Diabetes ever
Drinks 1 or more sugar-sweetenedbeverages per day
11.2% - 25.1%
25.2% - 31.9%
32.0% - 38.3%
38.4% - 45.7%
Unreliable estimate (diabetes ever)
District Public Health Office Neighborhoods
3.0%
- 8.5%
8.6%
- 10
.0%
10.1%
- 12
.0%
12.1%
- 18
.1%
4
District Public Health Offices
MethodsIn the spring of 2010, Health Department staff surveyed 1,184 New York City adult residents of 5 neighborhoods:
the 3 District Public Health Office neighborhoods (South Bronx, East and Central Harlem, and North and Central
Brooklyn), the Upper West Side of Manhattan and Flatbush, Brooklyn. The Upper West Side and Flatbush were
chosen as comparison neighborhoods because, according to 2008 Community Health Survey data, the Upper
West Side had the lowest rates of obesity and sugary drink consumption, and Flatbush residents, although similar
to District Public Health area residents in race/ethnicity, reported consuming significantly fewer sugary drinks and
were less likely to be obese.
Six data collection sites were chosen in each neighborhood – 3 supermarkets and 3 transportation hubs (subway
stations or bus stops). The goal was to recruit and survey 40 people (individuals 18 years of age and older with
ZIP codes in the target neighborhoods) at each location, for a total of 240 study participants in each of the
5 neighborhoods.
Since this study used convenience sampling (rather than random sampling), health information from the survey
respondents was compared with Community Health Survey data (Table 2) to identify any possible bias from this
sampling method. Overall, the sample was representative of the neighborhoods from which it was drawn.
The 15-minute survey included questions about sugary drink consumption, substitutes for sugary drinks, sugary
drink consumption among respondents’ children and perceptions of sugary drink consumption patterns among
friends and neighbors. Sugary drinks were defined as drinks with more than 25 calories per 8-ounce serving and
included non-diet soda, iced teas, sports drinks, flavored waters with added sugars, powdered drinks, energy
drinks and juice drinks with added sugar.
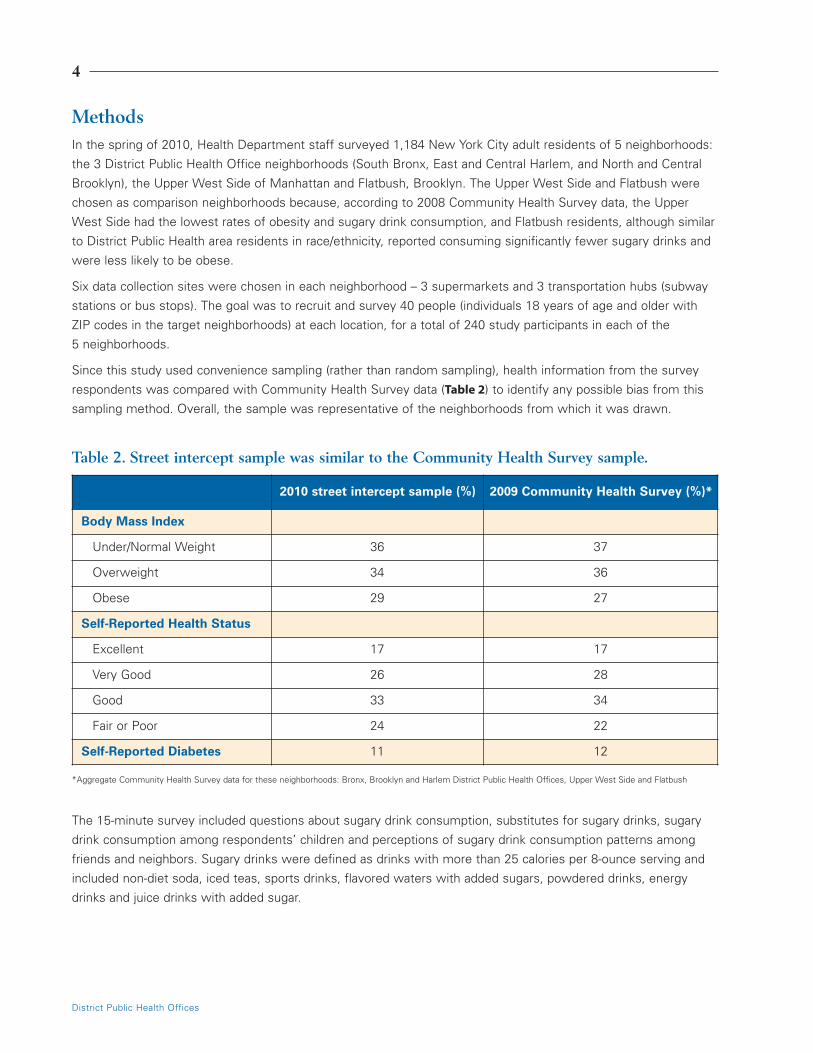
Table 2. Street intercept sample was similar to the Community Health Survey sample.
2010 street intercept sample (%) 2009 Community Health Survey (%)*
Body Mass Index
Under/Normal Weight 36 37
Overweight 34 36
Obese 29 27
Self-Reported Health Status
Excellent 17 17
Very Good 26 28
Good 33 34
Fair or Poor 24 22
Self-Reported Diabetes 11 12
*Aggregate Community Health Survey data for these neighborhoods: Bronx, Brooklyn and Harlem District Public Health Offices, Upper West Side and Flatbush
5
Sugary Drinks: How Much Do We Consume?
Other New York City surveys, such as the Community Health Survey and the Youth Risk Behavior Survey (a self-
administered questionnaire completed by a representative sample of New York City public high school students),
contain 1 or 2 questions that gauge daily sugary drink consumption, whereas this survey had questions about
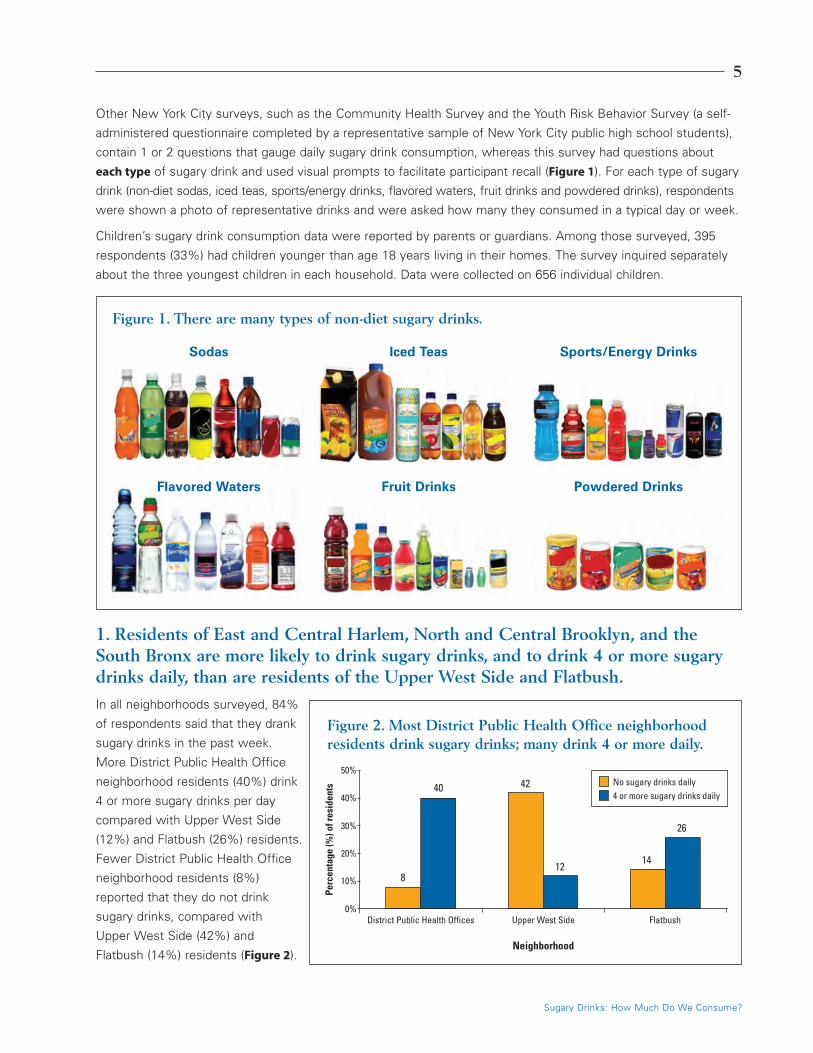
each type of sugary drink and used visual prompts to facilitate participant recall (Figure 1). For each type of sugary
drink (non-diet sodas, iced teas, sports/energy drinks, flavored waters, fruit drinks and powdered drinks), respondents
were shown a photo of representative drinks and were asked how many they consumed in a typical day or week.
Children’s sugary drink consumption data were reported by parents or guardians. Among those surveyed, 395
respondents (33%) had children younger than age 18 years living in their homes. The survey inquired separately
about the three youngest children in each household. Data were collected on 656 individual children.
1. Residents of East and Central Harlem, North and Central Brooklyn, and theSouth Bronx are more likely to drink sugary drinks, and to drink 4 or more sugarydrinks daily, than are residents of the Upper West Side and Flatbush.
In all neighborhoods surveyed, 84%
of respondents said that they drank
sugary drinks in the past week.
More District Public Health Office
neighborhood residents (40%) drink
4 or more sugary drinks per day
compared with Upper West Side
(12%) and Flatbush (26%) residents.
Fewer District Public Health Office
neighborhood residents (8%)
reported that they do not drink
sugary drinks, compared with
Upper West Side (42%) and
Flatbush (14%) residents (Figure 2).
Figure 1. There are many types of non-diet sugary drinks.
Sodas Sports/Energy Drinks
Fruit Drinks Powdered Drinks
8
40 42
14
26
12
50%
40%
30%
20%
10%
0%District Public Health Offices Upper West Side
No sugary drinks daily
Flatbush
Neighborhood
Perc
enta
ge (%
) of r
esid
ents
4 or more sugary drinks daily
Figure 2. Most District Public Health Office neighborhoodresidents drink sugary drinks; many drink 4 or more daily.
Flavored Waters
Iced Teas
6
District Public Health Offices
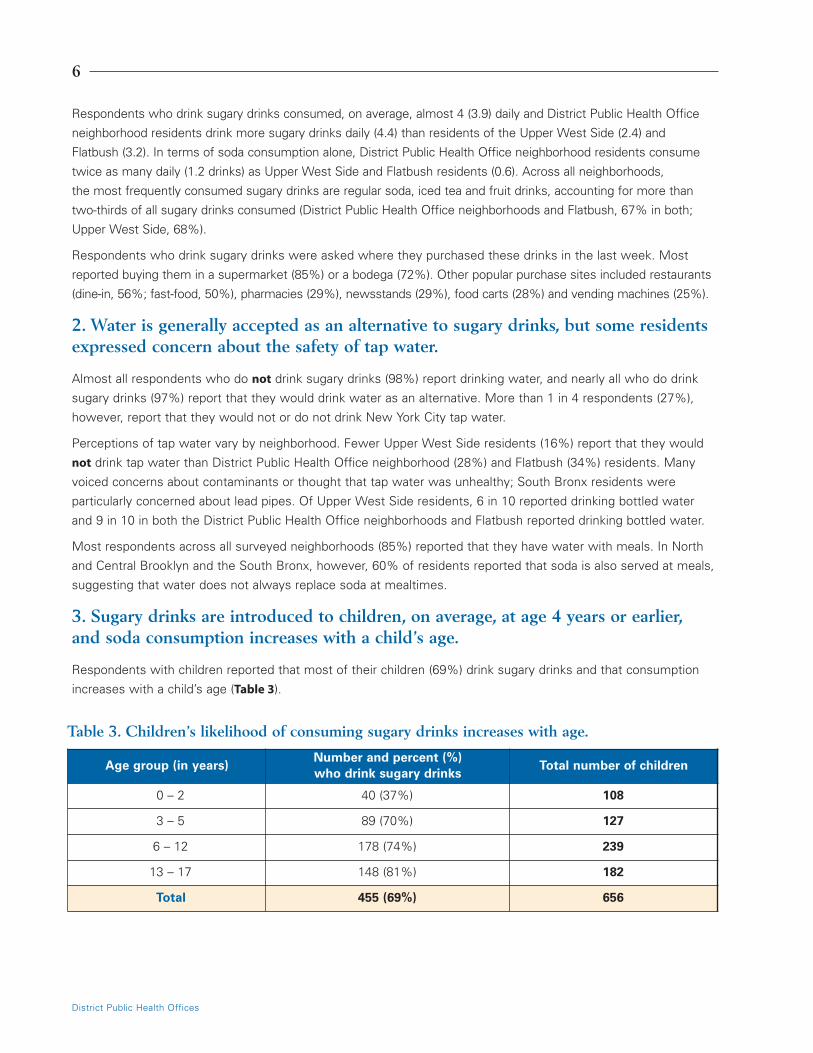
Respondents who drink sugary drinks consumed, on average, almost 4 (3.9) daily and District Public Health Office
neighborhood residents drink more sugary drinks daily (4.4) than residents of the Upper West Side (2.4) and
Flatbush (3.2). In terms of soda consumption alone, District Public Health Office neighborhood residents consume
twice as many daily (1.2 drinks) as Upper West Side and Flatbush residents (0.6). Across all neighborhoods,
the most frequently consumed sugary drinks are regular soda, iced tea and fruit drinks, accounting for more than
two-thirds of all sugary drinks consumed (District Public Health Office neighborhoods and Flatbush, 67% in both;
Upper West Side, 68%).
Respondents who drink sugary drinks were asked where they purchased these drinks in the last week. Most
reported buying them in a supermarket (85%) or a bodega (72%). Other popular purchase sites included restaurants
(dine-in, 56%; fast-food, 50%), pharmacies (29%), newsstands (29%), food carts (28%) and vending machines (25%).
2. Water is generally accepted as an alternative to sugary drinks, but some residentsexpressed concern about the safety of tap water.
Almost all respondents who do not drink sugary drinks (98%) report drinking water, and nearly all who do drink
sugary drinks (97%) report that they would drink water as an alternative. More than 1 in 4 respondents (27%),
however, report that they would not or do not drink New York City tap water.
Perceptions of tap water vary by neighborhood. Fewer Upper West Side residents (16%) report that they would
not drink tap water than District Public Health Office neighborhood (28%) and Flatbush (34%) residents. Many
voiced concerns about contaminants or thought that tap water was unhealthy; South Bronx residents were
particularly concerned about lead pipes. Of Upper West Side residents, 6 in 10 reported drinking bottled water
and 9 in 10 in both the District Public Health Office neighborhoods and Flatbush reported drinking bottled water.
Most respondents across all surveyed neighborhoods (85%) reported that they have water with meals. In North
and Central Brooklyn and the South Bronx, however, 60% of residents reported that soda is also served at meals,
suggesting that water does not always replace soda at mealtimes.
3. Sugary drinks are introduced to children, on average, at age 4 years or earlier, and soda consumption increases with a child’s age.
Respondents with children reported that most of their children (69%) drink sugary drinks and that consumption
increases with a child’s age (Table 3).
Table 3. Children’s likelihood of consuming sugary drinks increases with age.
Age group (in years)Number and percent (%) who drink sugary drinks
Total number of children
0 – 2 40 (37%) 108
3 – 5 89 (70%) 127
6 – 12 178 (74%) 239
13 – 17 148 (81%) 182
Total 455 (69%) 656

7
Sugary Drinks: How Much Do We Consume?
Among children who consume sugary drinks, the type consumed varies by age. Among the youngest (0 to 2 years),
half of all sugary drinks consumed (50%) are juice drinks and less than one-quarter (23%) are sodas. Among children
ages 13 to 17 years, soda accounts for 36% of sugary drinks consumed (Figure 3).
Respondents were asked at what age they introduce sugary drinks into their children’s diet and, on average,
how many sugary drinks their children consume daily.
• Parents in the South Bronx and East and Central Harlem District Public Health Office neighborhoods introduce
sugary drinks to their children at an earlier age (around 3.5 years) than do parents in the other surveyed
neighborhoods (around 4.5 years).
• Children living in the South Bronx and East and Central Harlem District Public Health Office neighborhoods
also consume more sugary drinks daily (about 3.5 per day) than children in the other neighborhoods surveyed
(about 2.5 per day).
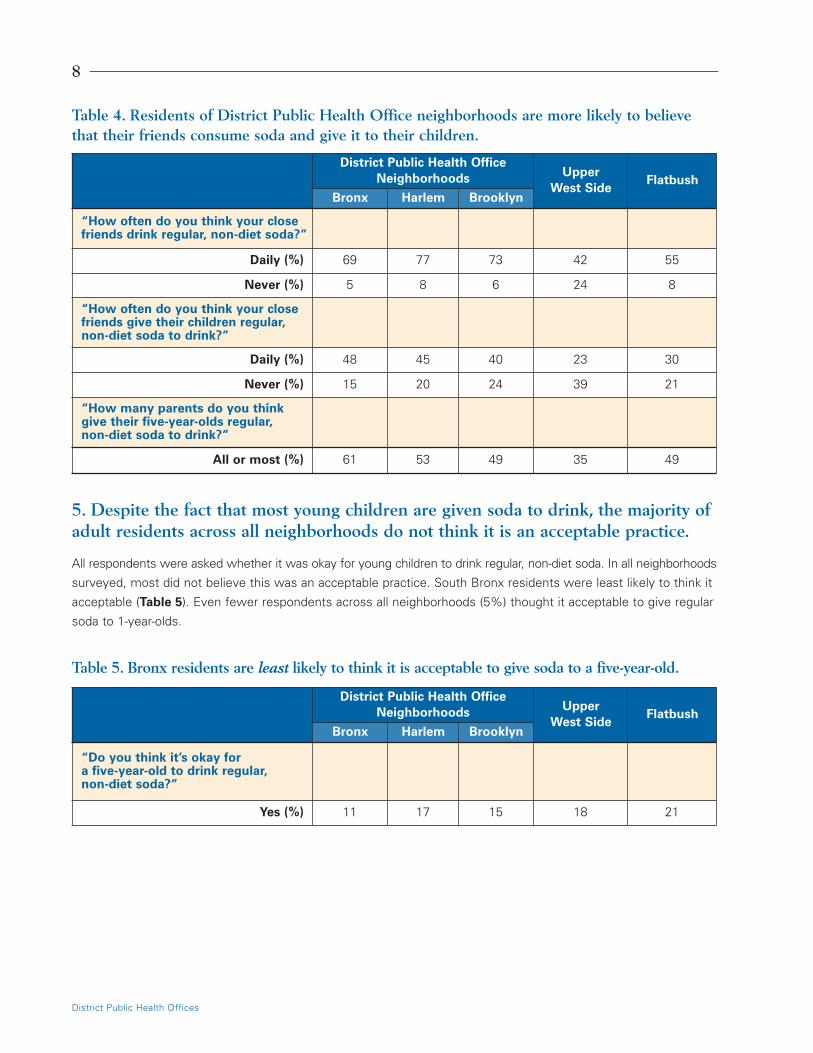
4. Residents of District Public Health Office neighborhoods are much more likely tothink that their close friends drink regular soda and give it to their children than areresidents of the Upper West Side and Flatbush.
There were large neighborhood differences in respondents’ perceptions of soda consumption among their friends
and neighbors. Residents of District Public Health Office neighborhoods were much more likely than people living
in Flatbush or the Upper West Side to think that their close friends drink regular soda and give it to their children.
When asked, generally, whether parents give their 5-year-old children soda to drink, residents of the South Bronx
(61%) were more likely than residents of the Upper West Side (35%), Flatbush (49%), and North and Central
Brooklyn (49%) to believe that all or most parents do so (Table 4).
100%90%80%70%60%50%40%30%20%10%
0%
Bev
erag
es c
onsu
med
(%)
0 to 2 3 to 5
Juice/Punch
6 to 12 13 to 17Age (in years)
Soda Milk Iced Tea Sports 100% Juice Other Vitamin Water
Figure 3. Young children are more likely to consume juicedrinks and older children are more likely to drink soda.
District Public Health Offices
5. Despite the fact that most young children are given soda to drink, the majority ofadult residents across all neighborhoods do not think it is an acceptable practice.
All respondents were asked whether it was okay for young children to drink regular, non-diet soda. In all neighborhoods
surveyed, most did not believe this was an acceptable practice. South Bronx residents were least likely to think it
acceptable (Table 5). Even fewer respondents across all neighborhoods (5%) thought it acceptable to give regular
soda to 1-year-olds.
8
District Public Health OfficeNeighborhoods Upper
West SideFlatbush
Bronx Harlem Brooklyn
“How often do you think your closefriends drink regular, non-diet soda?”
Daily (%) 69 77 73 42 55
Never (%) 5 8 6 24 8
“How often do you think your closefriends give their children regular,non-diet soda to drink?”
Daily (%) 48 45 40 23 30
Never (%) 15 20 24 39 21
“How many parents do you thinkgive their five-year-olds regular, non-diet soda to drink?”
All or most (%) 61 53 49 35 49
Table 4. Residents of District Public Health Office neighborhoods are more likely to believethat their friends consume soda and give it to their children.
District Public Health OfficeNeighborhoods Upper
West SideFlatbush
Bronx Harlem Brooklyn
“Do you think it’s okay for a five-year-old to drink regular, non-diet soda?”
Yes (%) 11 17 15 18 21
Table 5. Bronx residents are least likely to think it is acceptable to give soda to a five-year-old.
9
Sugary Drinks: How Much Do We Consume?
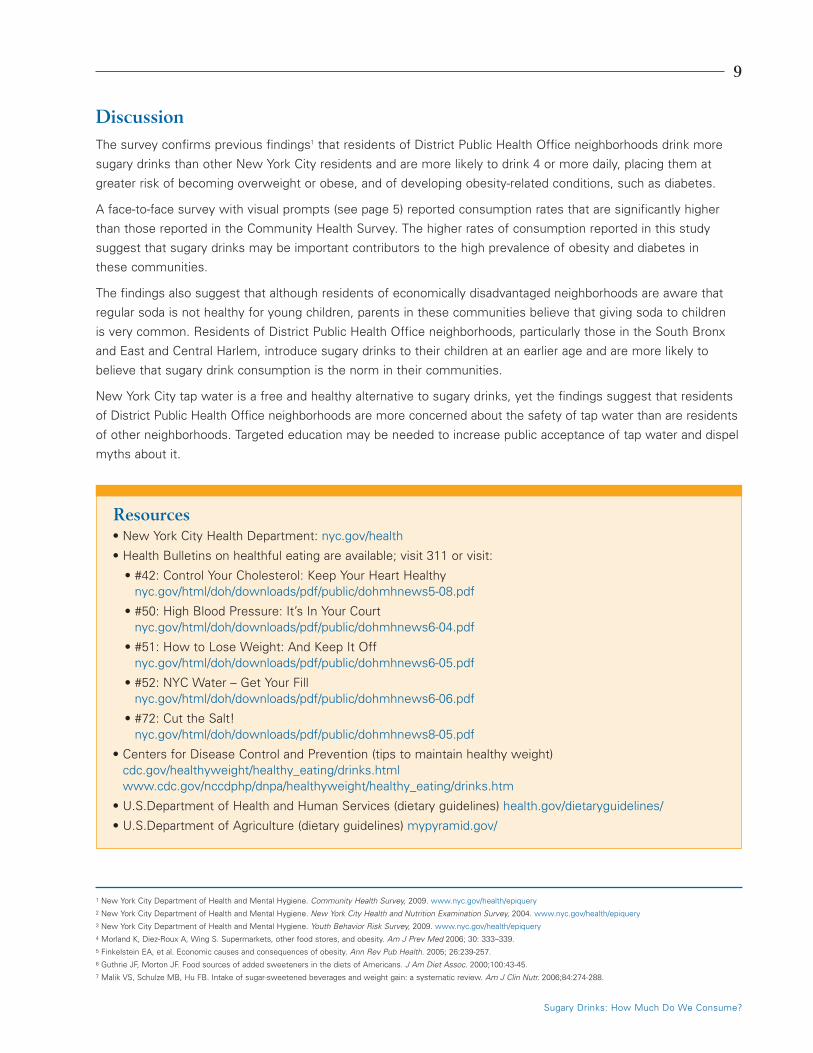
DiscussionThe survey confirms previous findings1 that residents of District Public Health Office neighborhoods drink more
sugary drinks than other New York City residents and are more likely to drink 4 or more daily, placing them at
greater risk of becoming overweight or obese, and of developing obesity-related conditions, such as diabetes.
A face-to-face survey with visual prompts (see page 5) reported consumption rates that are significantly higher
than those reported in the Community Health Survey. The higher rates of consumption reported in this study
suggest that sugary drinks may be important contributors to the high prevalence of obesity and diabetes in
these communities.
The findings also suggest that although residents of economically disadvantaged neighborhoods are aware that
regular soda is not healthy for young children, parents in these communities believe that giving soda to children
is very common. Residents of District Public Health Office neighborhoods, particularly those in the South Bronx
and East and Central Harlem, introduce sugary drinks to their children at an earlier age and are more likely to
believe that sugary drink consumption is the norm in their communities.
New York City tap water is a free and healthy alternative to sugary drinks, yet the findings suggest that residents
of District Public Health Office neighborhoods are more concerned about the safety of tap water than are residents
of other neighborhoods. Targeted education may be needed to increase public acceptance of tap water and dispel
myths about it.
1 New York City Department of Health and Mental Hygiene. Community Health Survey, 2009. www.nyc.gov/health/epiquery2 New York City Department of Health and Mental Hygiene. New York City Health and Nutrition Examination Survey, 2004. www.nyc.gov/health/epiquery3 New York City Department of Health and Mental Hygiene. Youth Behavior Risk Survey, 2009. www.nyc.gov/health/epiquery4 Morland K, Diez-Roux A, Wing S. Supermarkets, other food stores, and obesity. Am J Prev Med 2006; 30: 333–339.5 Finkelstein EA, et al. Economic causes and consequences of obesity. Ann Rev Pub Health. 2005; 26:239-257.6 Guthrie JF, Morton JF. Food sources of added sweeteners in the diets of Americans. J Am Diet Assoc. 2000;100:43-45.7 Malik VS, Schulze MB, Hu FB. Intake of sugar-sweetened beverages and weight gain: a systematic review. Am J Clin Nutr. 2006;84:274-288.
Resources• New York City Health Department: nyc.gov/health
• Health Bulletins on healthful eating are available; visit 311 or visit:
• #42: Control Your Cholesterol: Keep Your Heart Healthynyc.gov/html/doh/downloads/pdf/public/dohmhnews5-08.pdf
• #50: High Blood Pressure: It’s In Your Court nyc.gov/html/doh/downloads/pdf/public/dohmhnews6-04.pdf
• #51: How to Lose Weight: And Keep It Off nyc.gov/html/doh/downloads/pdf/public/dohmhnews6-05.pdf
• #52: NYC Water – Get Your Fill nyc.gov/html/doh/downloads/pdf/public/dohmhnews6-06.pdf
• #72: Cut the Salt! nyc.gov/html/doh/downloads/pdf/public/dohmhnews8-05.pdf
• Centers for Disease Control and Prevention (tips to maintain healthy weight)cdc.gov/healthyweight/healthy_eating/drinks.htmlwww.cdc.gov/nccdphp/dnpa/healthyweight/healthy_eating/drinks.htm
• U.S.Department of Health and Human Services (dietary guidelines) health.gov/dietaryguidelines/
• U.S.Department of Agriculture (dietary guidelines) mypyramid.gov/
HPD734632 – 5.11
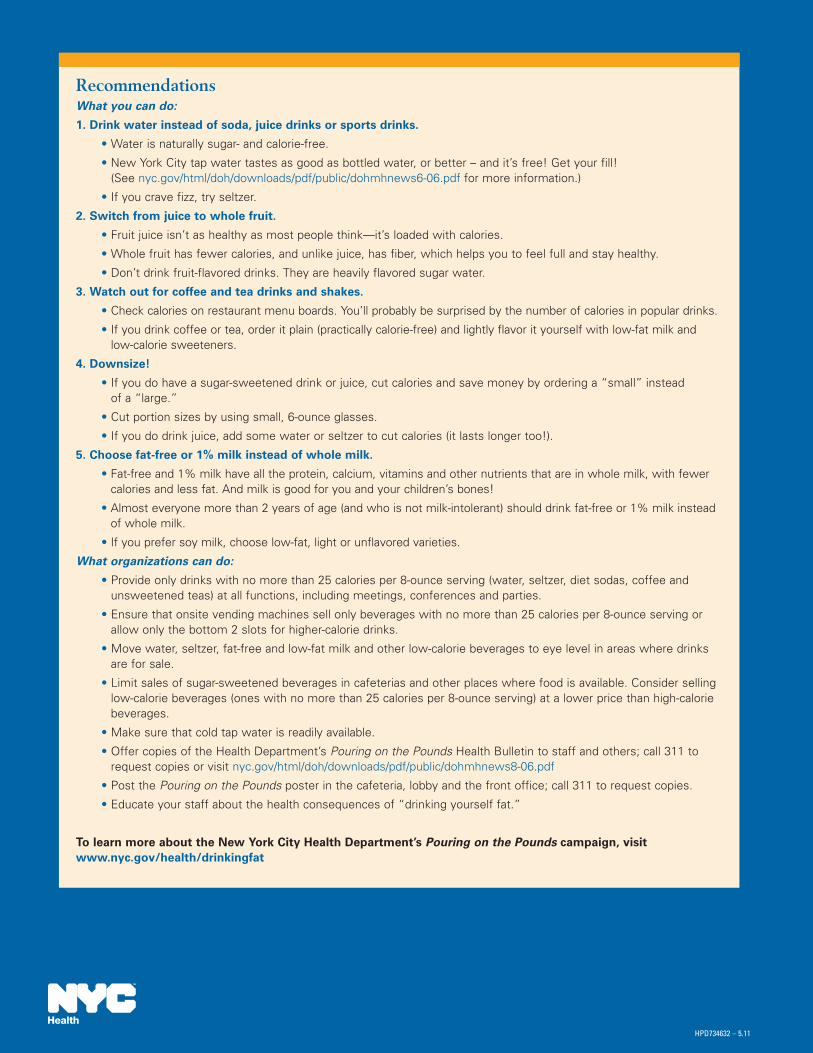
RecommendationsWhat you can do:
1. Drink water instead of soda, juice drinks or sports drinks.
• Water is naturally sugar- and calorie-free.
• New York City tap water tastes as good as bottled water, or better – and it’s free! Get your fill!(See nyc.gov/html/doh/downloads/pdf/public/dohmhnews6-06.pdf for more information.)
• If you crave fizz, try seltzer.
2. Switch from juice to whole fruit.
• Fruit juice isn’t as healthy as most people think—it’s loaded with calories.
• Whole fruit has fewer calories, and unlike juice, has fiber, which helps you to feel full and stay healthy.
• Don’t drink fruit-flavored drinks. They are heavily flavored sugar water.
3. Watch out for coffee and tea drinks and shakes.
• Check calories on restaurant menu boards. You’ll probably be surprised by the number of calories in popular drinks.
• If you drink coffee or tea, order it plain (practically calorie-free) and lightly flavor it yourself with low-fat milk andlow-calorie sweeteners.
4. Downsize!
• If you do have a sugar-sweetened drink or juice, cut calories and save money by ordering a “small” insteadof a “large.”
• Cut portion sizes by using small, 6-ounce glasses.
• If you do drink juice, add some water or seltzer to cut calories (it lasts longer too!).
5. Choose fat-free or 1% milk instead of whole milk.
• Fat-free and 1% milk have all the protein, calcium, vitamins and other nutrients that are in whole milk, with fewercalories and less fat. And milk is good for you and your children’s bones!
• Almost everyone more than 2 years of age (and who is not milk-intolerant) should drink fat-free or 1% milk insteadof whole milk.
• If you prefer soy milk, choose low-fat, light or unflavored varieties.
What organizations can do:
• Provide only drinks with no more than 25 calories per 8-ounce serving (water, seltzer, diet sodas, coffee andunsweetened teas) at all functions, including meetings, conferences and parties.
• Ensure that onsite vending machines sell only beverages with no more than 25 calories per 8-ounce serving orallow only the bottom 2 slots for higher-calorie drinks.
• Move water, seltzer, fat-free and low-fat milk and other low-calorie beverages to eye level in areas where drinksare for sale.
• Limit sales of sugar-sweetened beverages in cafeterias and other places where food is available. Consider sellinglow-calorie beverages (ones with no more than 25 calories per 8-ounce serving) at a lower price than high-caloriebeverages.
• Make sure that cold tap water is readily available.
• Offer copies of the Health Department’s Pouring on the Pounds Health Bulletin to staff and others; call 311 torequest copies or vi sit nyc.gov/html/doh/downloads/pdf/public/dohmhnews8-06.pdf
• Post the Pouring on the Pounds poster in the cafeteria, lobby and the front office; call 311 to request copies.
• Educate your staff about the health consequences of “drinking yourself fat.”
To learn more about the New York City Health Department’s Pouring on the Pounds campaign, visit www.nyc.gov/health/drinkingfat


