CHALMERS UNIVERSITY OF TECHNOLOGY Applied Acoustics 412 96 Göteborg, Sweden Visiting address: Sven Hultins gata 8 A Telephone: +4631772 8604 Fax: +4631772 22 12 Reg. No: 5564795598 Email: [email protected]Suggested facade cases for study of sound insulation considering wall, window and air intake Jens Forssén, April 2014 Report Department of Civil and Environmental Engineering, Chalmers University of Technology 2014:1, ISSN 16529162
Transcript
CHALMERS UNIVERSITY OF TECHNOLOGY Applied Acoustics 412 96 Göteborg, Sweden Visiting address: Sven Hultins gata 8 A Telephone: +46-‐31-‐772 8604 Fax: +46-‐31-‐772 22 12 Reg. No: 556479-‐5598 E-‐mail: [email protected]
Suggested facade cases for study of sound insulation considering wall, window and air intake
Jens Forssén, April 2014
Report Department of Civil and Environmental Engineering, Chalmers University of Technology 2014:1, ISSN 1652-‐9162
1. Introduction In the project Quieter Transport for More Efficient Distribution we are investigating sounds from noise improved heavy-‐duty road vehicles and their indoor impact in urban environments, whereby it is of interest to define a relevant set of facade cases. As input we have reduction indices in third-‐octave bands 25–20 000 Hz, delivered from acoustic consultant Simmons akustik & utveckling ab, for a set of facade elements that were selected with objectives of both frequency of use and of spread in sound reduction. The third-‐octave band reduction indices for three facade walls, four windows and two air intakes are listed in the appended report (in Swedish). From these facade elements a set of six cases are suggested for use within the project.
2. Suggested cases The set of facade walls consists of (1) an ordinary timber frame type, (2) a new steel frame type (i.e. a lightweight wall) and (3) a new concrete wall type. For the set of window examples we have an old window of (1) a normal type and of (2) an improved type, (3) a new ordinary window and (4) a new noise proof window. The air intakes are of (1) an ordinary type and (2) a noise proof type. For all facade cases the same room is assumed, a bedroom type of room with a 12 m2 floor area and a 10 m2 facade area facing the road. The reverberation time is assumed to be 0.5 s for all frequencies. Concerning the individual areas of the facade elements, the old windows are 1.9 m2 whereas the new windows are 1.5 m2 in size, and the air intakes use a 10 m2 reference area.
Since the project mainly concerns sounds from trucks, we here make use of the Ctr spectrum (standardized emission spectrum for heavy road vehicles [1]) as an outdoor spectrum to illustrate the indoor levels, after extending the domain from the third-‐octaves 50–5000 Hz to the 25–20 000 Hz range used here. The A-‐weighted spectrum used here is shown in Figure 1 (and listed in Table 1).
31.5 63 125 250 500 1k 2k 4k 8k 16k 35
30
25
20
15
10
5
Frequency, Hz
Awe
ight
ed S
PL, d
B
Figure 1. Ctr spectrum in the frequency extended version used here. Plotted is A-‐weighted sound pressure level, normalized to 0 dB(A).
The indoor noise level, Lp,indoor, is calculated using the conventional formula based on statistical room acoustical conditions and assuming a 0.5 s reverberation time, as follows
Lp,indoor = Lp,outdoor + 3 – R + 10log(3S/V), (1)
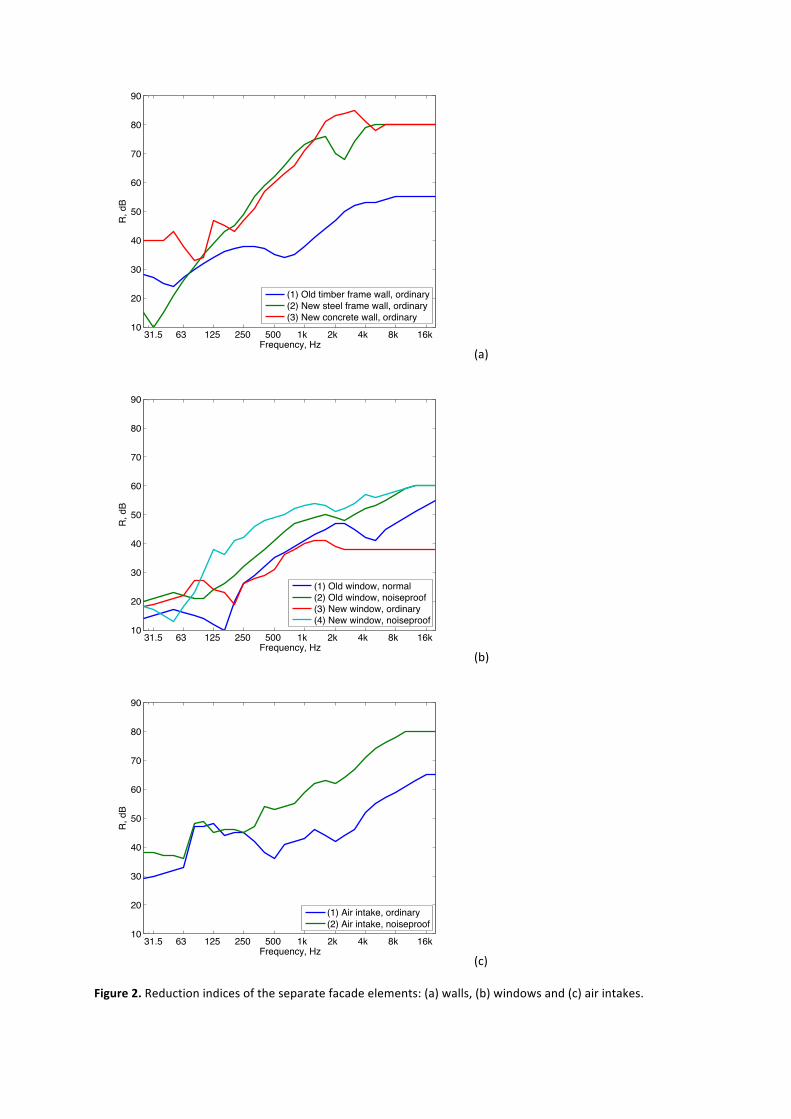
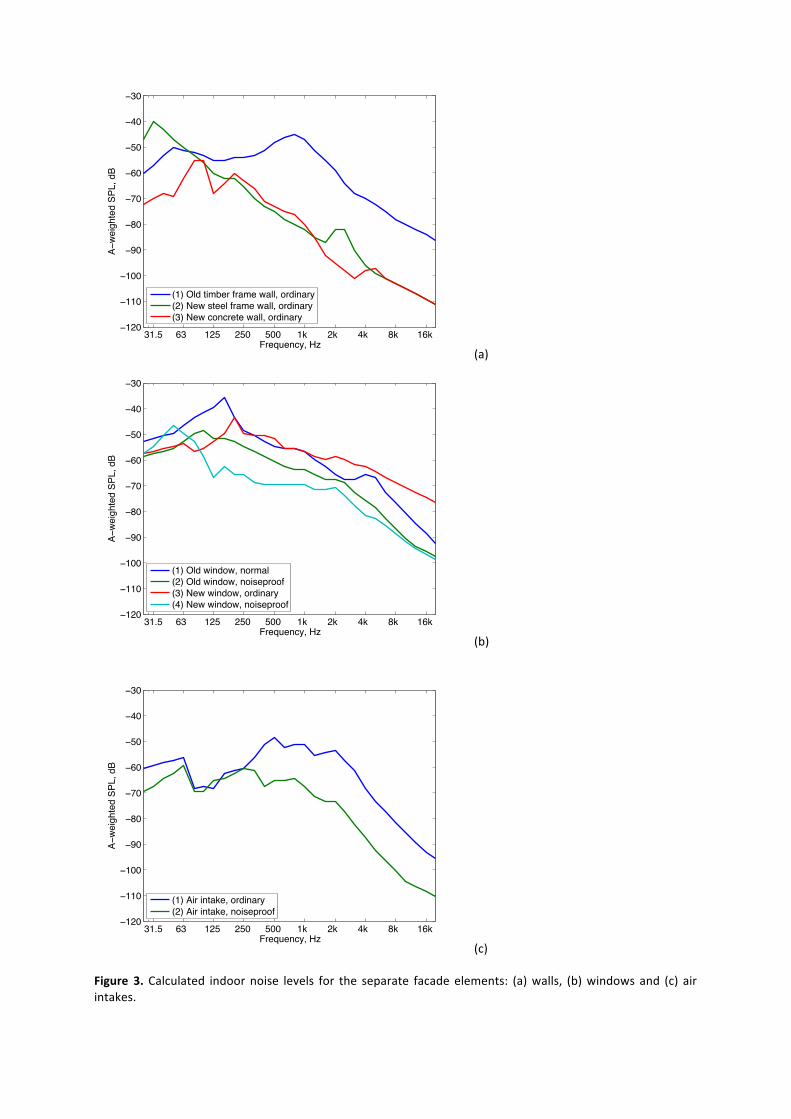
where Lp,outdoor is the free field level outside the facade (i.e. omitting the facade reflection), R is the reduction index of the corresponding facade element with surface area S, and V is the room volume, see e.g. [2]. The reduction indices for the different facade elements, as shown in Figure 2 and tabulated in the Appendix, are used in the above formula (Eq. 1) with Lp,outdoor given the values of the Ctr spectrum as shown in Figure 1 and Table 1. The resulting indoor spectra for each separate facade element is shown in Figure 3.
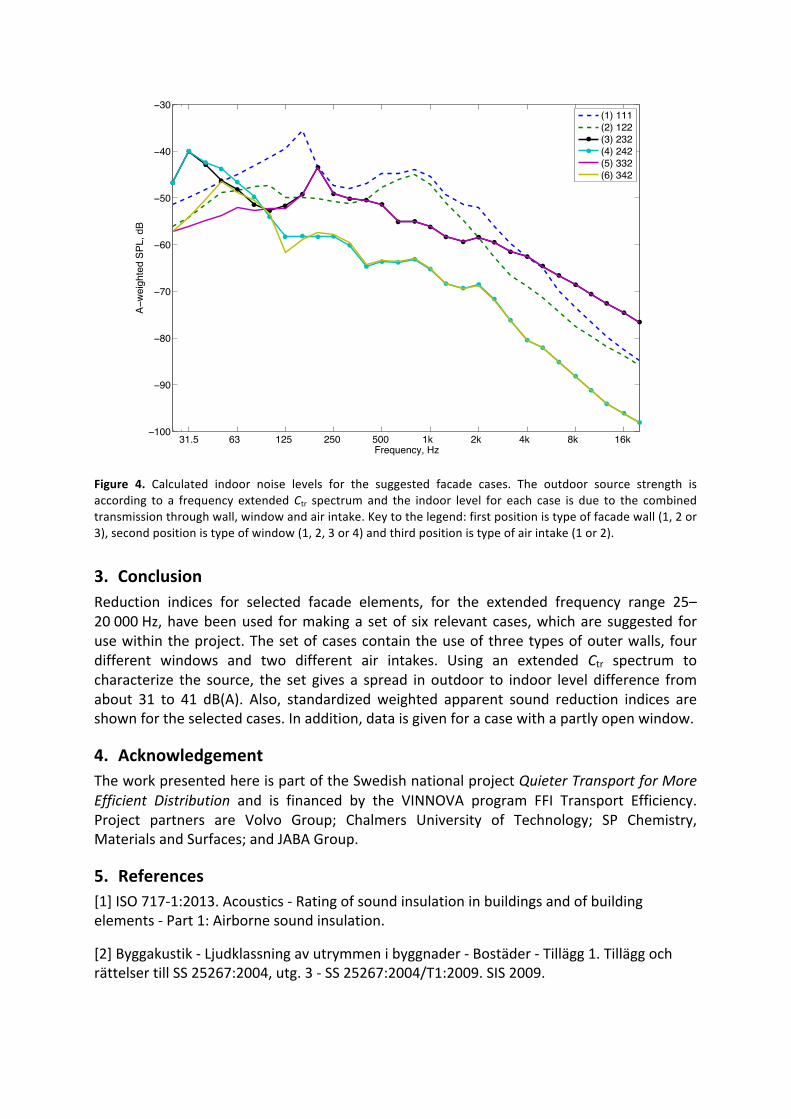
From making a combination of facade elements, i.e. selecting a type of wall, a window and an air intake, the total indoor level can be calculated by adding the separate contributions. Here, six different facade cases are selected that are suggested for further use within the project. The corresponding indoor noise levels are plotted in Figure 4 and listed in Table 1, where also data is given for a case with a partly open window.1 The differences between outdoor and indoor single number levels are 30.6, 36.2, 34.7, 35.7, 38.3 and 41.4 dB(A) for cases 1–6, respectively. The first case, with the smallest difference between outdoor and indoor A-‐weighted level, uses the wooden facade, the old untreated window and the ordinary air intake. The other five cases all have the better air intake, which can be shown to give a negligible deterioration compared to having no air intake. The second case has the improved window (and the better air intake) and shows a significantly better overall sound insulation except at mid frequencies (around 800 Hz) and toward high frequencies. Cases 3 and 4 use both the new steel frame wall and, respectively, the two different new windows. It can be seen that this lightweight wall gives very poor performance at the lowest frequency bands and that the choice of window makes a significant difference above 100 Hz. Cases 5 and 6 use both the new concrete wall and, respectively, the two different new windows. Using the concrete wall is predicted to give a sound insulation at low frequencies that is better than the one from using the lightweight wall, but comparable to the one from using the wooden wall in case 2. Above 100 Hz, the use of the new noise proof window is predicted to result in a very high noise reduction.
The estimated apparent sound reduction index R'tr,s,w, according to standard ISO 717-‐1, is listed for the selected cases 1–6, see Table 2. It can be noted that the results from the frequency extended Ctr spectrum used here largely agree with the standardized values of R'tr,s,w + Ctr,50-‐5000 (or R'tr,s,w + Ctr,50-‐3150), except for cases 3 and 4, where the standardized value under predicts the A-‐weighted indoor noise level by about 2 and 4 dB, respectively, due to the lightweight wall.
1 Measured case in Report S13-‐01 by Patrik Andersson, Division of Applied Acoustics, Chalmers University of Technology, August 31, 2013. The Room has a floor area 12 m2, ceiling height 2.5 m, window width 1.2 m, window height 1.4 m, and an opening slit width of 60 mm.
31.5 63 125 250 500 1k 2k 4k 8k 16k 10
20
30
40
50
60
70
80
90
Frequency, Hz
R, d
B
(1) Old timber frame wall, ordinary(2) New steel frame wall, ordinary(3) New concrete wall, ordinary
(a)
31.5 63 125 250 500 1k 2k 4k 8k 16k 10
20
30
40
50
60
70
80
90
Frequency, Hz
R, d
B
(1) Old window, normal(2) Old window, noiseproof(3) New window, ordinary(4) New window, noiseproof
(b)
31.5 63 125 250 500 1k 2k 4k 8k 16k 10
20
30
40
50
60
70
80
90
Frequency, Hz
R, d
B
(1) Air intake, ordinary(2) Air intake, noiseproof
(c) Figure 2. Reduction indices of the separate facade elements: (a) walls, (b) windows and (c) air intakes.
31.5 63 125 250 500 1k 2k 4k 8k 16k 120
110
100
90
80
70
60
50
40
30
Frequency, Hz
Awe
ight
ed S
PL, d
B
(1) Old timber frame wall, ordinary(2) New steel frame wall, ordinary(3) New concrete wall, ordinary
(a)
31.5 63 125 250 500 1k 2k 4k 8k 16k 120
110
100
90
80
70
60
50
40
30
Frequency, Hz
Awe
ight
ed S
PL, d
B
(1) Old window, normal(2) Old window, noiseproof(3) New window, ordinary(4) New window, noiseproof
(b)
31.5 63 125 250 500 1k 2k 4k 8k 16k 120
110
100
90
80
70
60
50
40
30
Frequency, Hz
Aw
eigh
ted
SPL,
dB
(1) Air intake, ordinary(2) Air intake, noiseproof
(c) Figure 3. Calculated indoor noise levels for the separate facade elements: (a) walls, (b) windows and (c) air intakes.
31.5 63 125 250 500 1k 2k 4k 8k 16k 100
90
80
70
60
50
40
30
Frequency, Hz
Aw
eigh
ted
SPL,
dB
(1) 111(2) 122(3) 232(4) 242(5) 332(6) 342
Figure 4. Calculated indoor noise levels for the suggested facade cases. The outdoor source strength is according to a frequency extended Ctr spectrum and the indoor level for each case is due to the combined transmission through wall, window and air intake. Key to the legend: first position is type of facade wall (1, 2 or 3), second position is type of window (1, 2, 3 or 4) and third position is type of air intake (1 or 2).
3. Conclusion Reduction indices for selected facade elements, for the extended frequency range 25–20 000 Hz, have been used for making a set of six relevant cases, which are suggested for use within the project. The set of cases contain the use of three types of outer walls, four different windows and two different air intakes. Using an extended Ctr spectrum to characterize the source, the set gives a spread in outdoor to indoor level difference from about 31 to 41 dB(A). Also, standardized weighted apparent sound reduction indices are shown for the selected cases. In addition, data is given for a case with a partly open window.
4. Acknowledgement The work presented here is part of the Swedish national project Quieter Transport for More Efficient Distribution and is financed by the VINNOVA program FFI Transport Efficiency. Project partners are Volvo Group; Chalmers University of Technology; SP Chemistry, Materials and Surfaces; and JABA Group.
5. References [1] ISO 717-‐1:2013. Acoustics -‐ Rating of sound insulation in buildings and of building elements -‐ Part 1: Airborne sound insulation.
[2] Byggakustik -‐ Ljudklassning av utrymmen i byggnader -‐ Bostäder -‐ Tillägg 1. Tillägg och rättelser till SS 25267:2004, utg. 3 -‐ SS 25267:2004/T1:2009. SIS 2009.
Total level [dB(A)] 0 -‐30.6 -‐36.2 -‐34.7 -‐35.7 -‐38.3 -‐41.4
Table 1. Third-‐octave band values [dB] corresponding to the curves in Figure 4. Last row is the total A-‐weighted level for the extended frequency range. Right-‐most column is the apparent sound reduction index R'tr,s [dB] for the measured case with a partly open window. (The numbers in parenthesis are connected with a larger uncertainty.)
Reduction index [dB] Case 1 Case 2 Case 3 Case 4 Case 5 Case 6 R'tr,s,w 37 40 43 54 43 54
R'tr,s,w + C 35 39 41 52 41 52
R'tr,s,w + Ctr 31 37 38 48 38 48
R'tr,s,w + C100-‐5000 36 40 42 53 42 53
R'tr,s,w + Ctr,100-‐5000 31 37 38 48 38 48
R'tr,s,w + C50-‐5000 36 40 42 51 42 52
R'tr,s,w + Ctr,50-‐5000 30 36 37 40 38 42
R'tr,s,w + C50-‐3150 35 39 41 50 41 51
R'tr,s,w + Ctr,50-‐3150 30 36 37 40 38 42 Table 2. Apparent sound reduction index R'tr,s,w, according to standard ISO 717-‐1, for the selected cases 1–6.
Appendix: Chalmers-‐Volvo: Ytterväggar, databas med ljudisolering 25-‐20000 Hz
rapport
Simmons akustik & utveckling ab postadress telefon kontor/mobil fax kontor/mobil bankgiro org.nr. Chalmers Teknikpark +46 (0)31 27 66 00 +46 (0)709 72 71 65 5298 - 3426 556625-6417 SE-412 88 Göteborg e-post & internet SMS/e-post mobil plusgiro innehar F-skattebevis besök [email protected] +46 (0)709 72 72 65 ! moms reg.nr/VAT no Sven Hultins gata 9 www.simmons.se [email protected] SE556625641701
Vårt ombud Vår ref – uppdragsbeteckning
Christian Simmons 1360 Mölndal, vårt datum Vårt dokument-ID 2013-05-30 SAURa-Chalmers-1360-Chalmers-Volvo_Ytterväggar-ljudisolering.docx
Chalmers-Volvo: Ytterväggar, databas med ljudisolering 25-20000 Hz Uppdrag Beställaren uppdrog att ge exempel på reduktionstal för ett antal vanligt förekommande ytterväggskonstruktioner, fönster och luftintag inom ett utvidgat frekvensområde 25-20000 Hz. Se vidare i uppdragsbeskrivningen som skickades med e-post den 8 maj. Reduktions-talen är framtagna för att demonstrera hur olika ytterväggskonstruktioner kan påverka ljud-nivåerna inomhus vid olika trafikslag samt för forskning och undervisning på Chalmers. De ska inte användas för projektering av byggnader med avseende på bullerskydd.
Metod
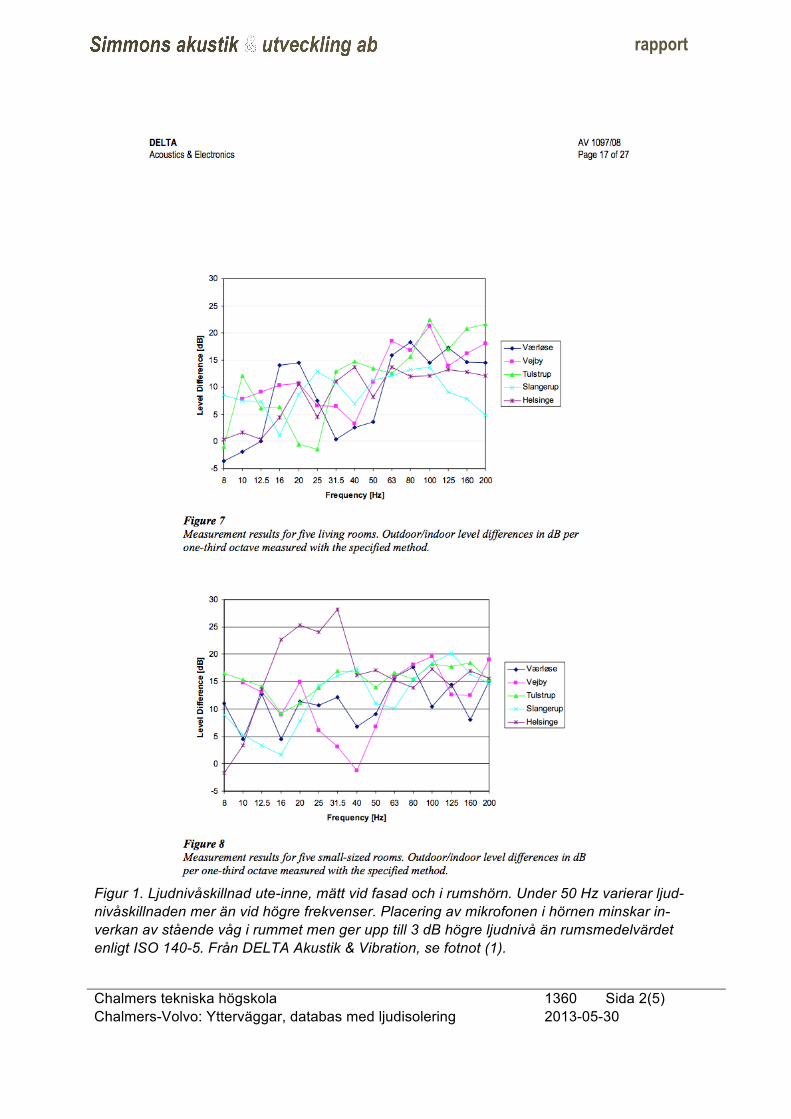
De reduktionstal som anges i tabell 1 baseras på mätdata eller teoretiskt beräknade data i frekvensområdet 50-5000 Hz och har hämtats från den nordiska databasen till BASTIAN (www.bastian.nu). En utvidgning har gjorts ned till 25 Hz och upp till 20 kHz, på basis av beräkningar och bedömningar enligt allmänt vedertagen teori för dubbelväggar (www.insul.co.nz). Reduktionstalen vid de lägsta frekvenserna har bedömts på erfaren-hetsmässig grund med stöd av 1) värden vid högre frekvenser, 2) masslagen, 3) inverkan av grundresonans samt 4) ökad strålningsdämpning vid låga frekvenser. Vid höga frekven-ser har reduktionstalen begränsats med tanke på 5) flanktransmission och 6) luftläckage. Huruvida denna blandning av teoretiska och empiriska metoder är giltig för det utvidgade frekvensområdet kan inte garanteras. Några få mätningar (ej publicerade) och en publice-rad studie angående isolering mot ljud vid mycket låga frekvenser från vindkraftverk1 indike-rar att antagandet kan vara realistiskt, se figur 1. Att det är svårt att hitta mätdata beror på att ljudkraven inte går så långt ned (resp upp) i frekvens i något land och att mätstandar-derna inte heller omfattar dessa frekvenser. Värdena i tabell 1 bör därför inte tolkas som någon garanti på vilken A-vägd ljudnivå som kan uppnås inne i en byggnad. Osäkerheten är sannolikt i den storleksordningen, att cirka vart tionde fall ligger 5 dB högre än beräknat.
1 Sound insulation of dwellings at low frequencies. Dan Hoffmeyer (1) and Jørgen Jakobsen (2). Artikeln baseras på rapport AV 1097/08 från DELTA Akustik & Vibration. 1) DELTA, Venlighedsvej 4, DK-2970 Hørsholm. 2) Dansh Environmental Pro-tection Agency, Strandgade 29, DK-1401 København K. J of Low Frequency Noise, Vibration and active control Vol. 29 2010.
rapport
Chalmers tekniska högskola Chalmers-Volvo: Ytterväggar, databas med ljudisolering
1360 Sida 2(5) 2013-05-30
Figur 1. Ljudnivåskillnad ute-inne, mätt vid fasad och i rumshörn. Under 50 Hz varierar ljud-nivåskillnaden mer än vid högre frekvenser. Placering av mikrofonen i hörnen minskar in-verkan av stående våg i rummet men ger upp till 3 dB högre ljudnivå än rumsmedelvärdet enligt ISO 140-5. Från DELTA Akustik & Vibration, se fotnot (1).
rapport
Chalmers tekniska högskola Chalmers-Volvo: Ytterväggar, databas med ljudisolering
Chalmers tekniska högskola Chalmers-Volvo: Ytterväggar, databas med ljudisolering
1360 Sida 4(5) 2013-05-30
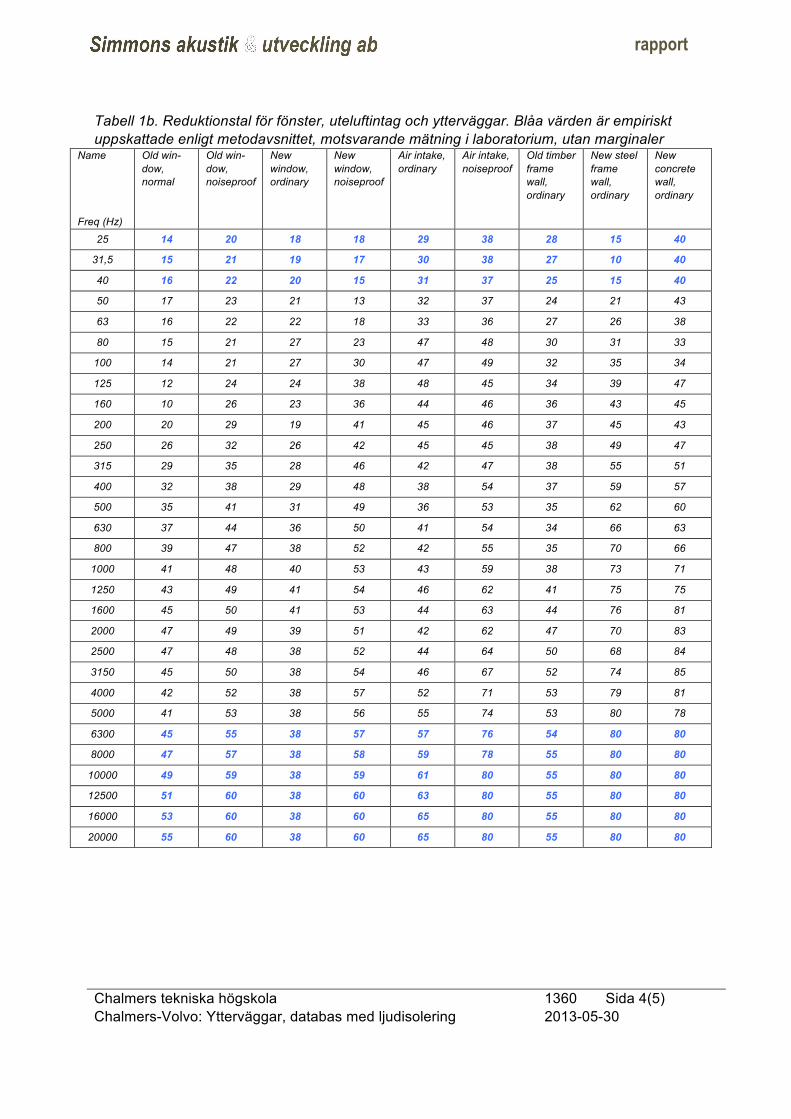
Tabell 1b. Reduktionstal för fönster, uteluftintag och ytterväggar. Blåa värden är empiriskt uppskattade enligt metodavsnittet, motsvarande mätning i laboratorium, utan marginaler
Name Freq (Hz)
Old win-dow, normal
Old win-dow, noiseproof
New window, ordinary
New window, noiseproof
Air intake, ordinary
Air intake, noiseproof
Old timber frame wall, ordinary
New steel frame wall, ordinary
New concrete wall, ordinary
25 14 20 18 18 29 38 28 15 40
31,5 15 21 19 17 30 38 27 10 40
40 16 22 20 15 31 37 25 15 40
50 17 23 21 13 32 37 24 21 43
63 16 22 22 18 33 36 27 26 38
80 15 21 27 23 47 48 30 31 33
100 14 21 27 30 47 49 32 35 34
125 12 24 24 38 48 45 34 39 47
160 10 26 23 36 44 46 36 43 45
200 20 29 19 41 45 46 37 45 43
250 26 32 26 42 45 45 38 49 47
315 29 35 28 46 42 47 38 55 51
400 32 38 29 48 38 54 37 59 57
500 35 41 31 49 36 53 35 62 60
630 37 44 36 50 41 54 34 66 63
800 39 47 38 52 42 55 35 70 66
1000 41 48 40 53 43 59 38 73 71
1250 43 49 41 54 46 62 41 75 75
1600 45 50 41 53 44 63 44 76 81
2000 47 49 39 51 42 62 47 70 83
2500 47 48 38 52 44 64 50 68 84
3150 45 50 38 54 46 67 52 74 85
4000 42 52 38 57 52 71 53 79 81
5000 41 53 38 56 55 74 53 80 78
6300 45 55 38 57 57 76 54 80 80
8000 47 57 38 58 59 78 55 80 80
10000 49 59 38 59 61 80 55 80 80
12500 51 60 38 60 63 80 55 80 80
16000 53 60 38 60 65 80 55 80 80
20000 55 60 38 60 65 80 55 80 80
rapport
Chalmers tekniska högskola Chalmers-Volvo: Ytterväggar, databas med ljudisolering
1360 Sida 5(5) 2013-05-30
Underlag En generell specifikation av byggdelar lämnades av uppdragsgivaren, som vi har preciserat utifrån tillgängliga uppgifter i databasen.
Vi tackar för uppdraget.
Med vänlig hälsning Simmons akustik & utveckling ab Christian Simmons Bilaga: Resultaten har även skickats som Excel-fil.