SUIT WESTSIDE CBM SEEP CAPTURE AND USE PROJECT Document Prepared By Mike Huisenga, WSP Environment & Energy Project Title Southern Ute Indian Tribe Westside CBM Seep Capture & Use Project Version Version 10 Date of Issue Original Issue 04 August, 2011 reissued on 30 November 2012 Prepared By Mike Huisenga, WSP Environment & Energy Contacts Kyle Siesser Southern Ute Department of Energy 14933 Highway 172 P.O. Box 367 Ignacio, CO 81137 (970) 563 5556 [email protected]Mike Huisenga WSP Environment & Energy 507 Canyon Blvd, Ste 203 Boulder, CO 80305 (720) 974 0250 [email protected]
Transcript
SUIT WESTSIDE CBM SEEP
CAPTURE AND USE PROJECT
Document Prepared By Mike Huisenga, WSP Environment & Energy
Project Title Southern Ute Indian Tribe Westside CBM Seep Capture & Use Project
Version Version 10
Date of Issue Original Issue 04 August, 2011 reissued on 30 November 2012
Prepared By Mike Huisenga, WSP Environment & Energy
Table of Contents 1 Project Details .................................................................................................................... 3
1.1 Summary Description of the Project ........................................................................... 3
1.2 Sectoral Scope and Project Type ................................................................................. 3 1.3 Project Proponent ........................................................................................................ 3 1.4 Other Entities Involved in the Project ......................................................................... 4 1.5 Project Start Date ........................................................................................................ 4
1.6 Project Crediting Period .............................................................................................. 4
1.7 Project Scale and Estimated GHG Emission Reductions or Removals ...................... 4 1.8 Description of the Project Activity ............................................................................. 5
1.8.1 A description of how the project will achieve GHG emission reductions and/or removal enhancements: ...................................................................................................... 5 1.8.2 Project technologies, products, services and the expected level of activity: ....... 5
1.11 Compliance with Laws, Statutes and Other Regulatory Frameworks ..................... 8 1.12 Ownership and Other Programs .............................................................................. 8
1.12.1 Proof of Title ........................................................................................................ 8 1.12.2 Emissions Trading Programs and Other Binding Limits ..................................... 9 1.12.3 Participation under Other GHG Programs ........................................................... 9 1.12.4 Other Forms of Environmental Credit ................................................................. 9 1.12.5 Projects Rejected by Other GHG Programs......................................................... 9
1.13 Additional Information Relevant to the Project ...................................................... 9 2 Application of Methodology ............................................................................................ 11
2.1 Title and Reference of Methodology ........................................................................ 11 2.2 Applicability of Methodology ................................................................................... 12 2.3 Project Boundary ....................................................................................................... 12 2.4 Baseline Scenario ...................................................................................................... 13 2.5 Additionality.............................................................................................................. 16 2.6 Methodology Deviations ........................................................................................... 18
3 Quantification of GHG Emission Reductions and Removals .......................................... 18 3.1 Baseline Emissions .................................................................................................... 18 3.2 Project Emissions ...................................................................................................... 23
3.3 Leakage ..................................................................................................................... 25 3.4 Summary of GHG Emission Reductions and Removals ........................................... 25
4.1 Data and Parameters Available at Validation ........................................................... 26 4.2 Data and Parameters Monitored ................................................................................ 28
4.3 Description of the Monitoring Plan ........................................................................... 34 4.3.1 Roles and responsibilities .................................................................................. 34 4.3.2 Data Collection / Monitoring Equipment .......................................................... 35
4.3.3 Title and reference of the VCS methodology (which includes the monitoring requirements) applied to the project activity and explanation of methodology choices: 36 4.3.4 3.2 Monitoring, including estimation, modeling, measurement or calculation approaches: ...................................................................................................................... 36
Coal bed methane (CBM) is the name given to methane that is found in coal seams. It is formed during coalification, the process in which plant material is transformed into coal. CBM has recently become an important resource in the natural gas sector, as exploration and production companies have developed and perfected technologies and techniques for extracting this energy resource from previously uneconomic deposits. Under normal CBM production conditions, wells are drilled to facilitate the evacuation of groundwater (known as dewatering) which lowers vapor pressures within the coal seams such that methane molecules are released from the bonds of adsorption to the coal surfaces, are liberated, and thus become available for extraction to the surface. Under normal CBM production conditions, the coal seams have geologic integrity that contains the liberated methane gas such that it is either produced and captured at the surface or else remains contained within the geologic structure.
However, in the case of the SUIT CBM production operations, the unusual features of the coal-bearing geologic structure, comprising a basin whose edges manifest as outcroppings, provides a pathway by which some desorbed methane migrates along the strata to the outcroppings where it becomes fugitive methane. Methane, or, CH4, is a relatively potent greenhouse gas (GHG) emission with a high global warming potential (GWP), meaning that its contribution to climate change is significantly higher than carbon dioxide (CO2), the most commonly known GHG emission. When averaged over 100 years, each unit of methane warms the planet 21 times as much as the same unit of CO2.
While fugitive methane can be captured and flared to minimize its global warming effects, it can also be productively utilized in ways that not only reduce its environmental impact but provide a valuable source of energy. Methane is a primary constituent of natural gas and although the quality of recovered gas determines how it can be used, there is a variety of applications to which recovered methane emissions can be applied. For example, recovered methane can be distributed through existing natural gas pipelines to end users, including electricity generators, or used as a fuel for on-site generation serving CBM activities or for nearby industrial facilities.
1.2 Sectoral Scope and Project Type
The SUIT project falls into Sectoral Scope Numbers 1 and 10 as defined by the United Nations Framework Convention on Climate Change (UNFCCC) and the Voluntary Carbon Standard (VCS).
1.3 Project Proponent
Southern Ute Indian Tribe – Growth Fund - Department of Energy
The Southern Ute Indian Tribe – Growth Fund or “SUGF” is the project proponent. SUGF is a division of the Southern Ute Indian Tribe and is responsible for developing energy producing assets on the reservation.
Role of SUGF in the project SUGF is the sole equity owner of the project and is responsible for all aspects of operations and management. Additionally SUGF will be responsible for all efforts to monetize and market VCUs generated from the project. WSP Environment & Energy, a consultant with SUGF, will assist in the validation and verification process.
1.4 Other Entities Involved in the Project
Provide contact information and roles/responsibilities for any other entities involved in the development of the project.
WSP is responsible for compiling the annual monitoring reports and producing this Project Description document.
1.5 Project Start Date
The project began operations on 01 January, 2009
1.6 Project Crediting Period
The project crediting period began on 01 January, 2009 and will end 31 December, 2018 for a total of 10 years.
1.7 Project Scale and Estimated GHG Emission Reductions or Removals
Project Yes
Mega-project No
SUIT Westside Fugitive CBM Capture & Use Project
v3.0
5
Years Estimated GHG emission reductions or removals (tCO2e)
2009 28,818 2010 28,818 2011 28,818 2012 28,818 2013 28,818 2014 28,818 2015 28,818 2016 28,818 2017 28,818 2018 28,818 Total estimated ERs 288,175 Total number of crediting years 10
Average annual ERs 28,818
1.8 Description of the Project Activity
1.8.1 A description of how the project will achieve GHG emission
reductions and/or removal enhancements:
The project will achieve emission reductions because methane which would otherwise continue to travel up the coal seam to the outcropping and be emitted to the atmosphere will be intercepted. The methane intercepted by the vent wells will be collected, pressurized, treated for hydrogen sulfide, water and CO2 removal and injected into a natural gas transmission pipeline at the site. From there, it will be distributed to end users and combusted. This project prevents CH4 emissions to the atmosphere and avoids the use of natural gas. 1.8.2 Project technologies, products, services and the expected level of
activity:
The technology employed at the project site consists of relatively simple equipment. The gas collection system consists of steel piping drilled into the coal seam and gas fired compressors. A large gas engine driven compressor is used to boost the gas pressure in order to treat it at the processing. Onsite monitoring equipment consists of gas flow meters and gas chromatographs. The captured methane is upgraded to pipeline quality gas at a gas treatment plant managed by Red Cedar. This plant uses the amine scrubbing process to remove carbon dioxide from the coal bed methane. In addition, the plant also removes water and hydrogen sulfide. The product gas is compressed to pipeline pressures and injected into Kinder Morgan’s Trans Colorado gas transmission pipeline. The project produces pipeline quality natural gas which is distributed throughout the southwest United States and used by a variety of end users. It is assumed that all of this natural gas is combusted by industrial users, for power generation, or in commercial and residential gas furnaces to produce heat and power.
SUIT Westside Fugitive CBM Capture & Use Project
v3.0
6
Using data collected during the pre-project monitoring period as well as actual gas sales invoices from the first 2 years of operation, the annual quantity of natural gas delivered to end users is projected for the project crediting period. Table 1 shows the expected quantity of natural gas sold annually to Kinder Morgan. At an annual average price of $3.67 per thousand scf at the wellhead in 20091, this would be equivalent to roughly a quarter of a million dollars per year.
Table 1: Projected Natural Gas Production Crediting Year Projected Natural
The methane capture project is located in La Plata County, Colorado, United States. The project site is situated approximately 25 miles west of Ignacio, Colorado where the tribe’s headquarters is located. The gas compression station, processing plant, and well head are also located at this site but approximately 1.5 miles south. The zip code for this location is 81326. The project is located in the WECC Rockies eGRID sub-region. The boundaries of the initial instance of the project include 16 wells and are presented in Table 2. The boundaries for the planned expansion of the project during phase II are shown in Table 3 which is located immediately adjacent to phase I’s north boundary. Gas compression equipment, upgrading equipment, and the point of transmission pipeline injection which are shared by other CBM operations are not included the GPS coordinate polygons presented below but are included in the project’s physical boundary. The final step in the gas upgrading and pipeline injection process is accomplished by the Red Cedar Coyote Gulch Gas Treating Plant located at (37.013524, -108.061158).
1 2009 US Average wellhead price, http://www.eia.gov/dnav/ng/ng_pri_sum_dcu_nus_a.htm
SUIT Westside Fugitive CBM Capture & Use Project
v3.0
7
Figure 1: Map of Colorado showing location of La Plata County
Figure 2: Map of La Plata County, CO, showing project location starred
Table 2: Project GPS Boundaries for Phase I gas interception wells Boundary Latitude (degrees) Longitude (degrees) Northwest 37.052817 -108.080298 Northeast 37.052727 -108.089428 Southeast 37.003401 -108.102099 Southwest 37.003552 -108.113645
Table 3: Project GPS Boundaries for Phase II gas interception wells Boundary Latitude (degrees) Longitude (degrees) Northwest 37.109066 -108.054146 Northeast 37.107978 -108.068204 Southeast 37.052817 -108.080298 Southwest 37.052727 -108.089428
1.10 Conditions Prior to Project Initiation
Prior to the start of the project methane gas was being freely emitted at the ground level from the outcropping of the Fruitland formation. This has been confirmed in a field test performed by LT Environmental using a portable gas flux meter and measuring methane concentrations at the ground surface. The flux meter records the concentration increases over time for a given area, which is proportional to flux. The flux is calculated and reported as a mass flux in units of moles per square meter per day (moles/m2*day). Volumetric flow rates can be calculated using the molecular weight and density of the gas. LT Environmental main findings were that methane gas was seeping from the ground surface. LT’s test included 8 separate seep areas, encompassing a total of 437 acres. The report shows that a total 3,711,000 standard cubic feet per day of methane are being released from these sites. The wells which are now being used to intercept fugitive methane were first installed and used by a coal mining company to monitor water levels in the coal seam. This activity was conducted as part of a feasibility study for strip mining coal in the area. The Southern Ute’s decided not to allow mining on the reservation and the monitoring wells were sold to the tribe. These wells were sealed following their use as ground water level monitoring wells. However, the Southern Ute’s discovered that they could be used to extract fugitive methane identified by the above mentioned study. The Southern Ute’s decided that they could use the monitoring wells as gas interception wells, and could test the flow rate by opening the wells and allowing them to vent freely to the atmosphere. This baseline monitoring exercise confirmed the feasibility of using the wells for the project and also
SUIT Westside Fugitive CBM Capture & Use Project
v3.0
8
confirmed that the wells could successfully intercept fugitive methane migrating up-dip and re-direct it to a gas collection system. Pre-project monitoring was conducted over a four year period beginning on January 1st, 2005 and ending on December 31st, 2008. The project site consists of 16 individual wells which were all tested during this period although not each well was tested for this entire 4 year duration. Pre-project monitoring data for 2008 are available for some of the wells used by the project. This data is supplied to help establish the baseline condition. It is important to note however, that monitoring has been conducted on only a fraction of the outcropped basin perimeter and so the actual volume of fugitive methane is believed to be much higher. Table 4 shows the total annual coal bed methane escaping from vent wells within the project boundary. Over the course of 2008 a total of 144 million scf of CBM escaped to the atmosphere. Assuming a methane concentration of 57.5% by volume, this amounts to 83 million scf of methane, or over 33,100 tCO2e of greenhouse gas emissions. Again, these flows have been measured in the absence of a vacuum and represent methane that is freely venting to the atmosphere.
Table 4: Pre-project measured CBM gas flow rates from project wells Well ID Well Name 2008 Metered Flow
Rate (scf) M14L SU #14 L 26,838,030 M19U SU #19U 17,734,261 MB02 BHP VW #202 132,458 MCV2 BHP VW #201 20,582,464 MCV3 Cinder Buttes VW #3 29,378,748 MCV4 Cinder Buttes VW #4 17,274,718 MSS1 Soda Springs #1 30,265,432 MSS2 Soda Springs #2 635,019 MVC3 Valencia Canyon #3 1,002,996 Total 143,844,126 Total Methane (@57.7% CH4) 82,998,061
1.11 Compliance with Laws, Statutes and Other Regulatory Frameworks
Permits
Operating permits are not required for the interceptor well system or for the Coyote Gulch Compressor Station as they are not significant emission sources. As discussed, this project relies on common infrastructure to produce natural gas. Red Cedar Gathering Company owns and operates the gas treatment plant. Red Cedar currently has a valid Title V operating permit for this facility and it is included as a report Annex. This permit covers gas burning engine compressors, reboilers and process heating equipment.
1.12 Ownership and Other Programs
1.12.1 Proof of Title
The Southern Ute Indian Tribe of the Southern Ute Reservation, Colorado is listed by the US Department of the Interior’s Bureau of Indian Affairs as tribal entity that is recognized and eligible for funding and services from the Bureau of Indian Affairs by virtue of their status as an Indian Tribe. Since the project activity is located on lands owned by a federally recognized
SUIT Westside Fugitive CBM Capture & Use Project
v3.0
9
Indian tribe, the Southern Ute Indian Tribe rightfully owns the emission reductions produced by the project activity. The map below, taken from the US Census website, shows the boundaries of the Southern Ute Indian Reservation along with a star representing the project location demonstrating that the project is located on SUIT’s tribal lands. The Southern Ute Indian Tribe – Growth Fund is responsible for oil and gas production on tribal lands and is the entity responsible for the administration of the SUIT Westside Fugitive CBM Capture and Use Project. The Growth Fund will own and market the VCUs generated by the project.
1.12.2 Emissions Trading Programs and Other Binding Limits
The project will sell VCUs in the voluntary carbon markets, they will not be used for compliance purposes or in other programs
1.12.3 Participation under Other GHG Programs
N/A; project has never been proposed to any other GHG program
1.12.4 Other Forms of Environmental Credit
N/A; This project will not create any additional environmental credits. Captured coal bed methane is being treated and injected into a natural gas transmission pipeline. There is no power being generated onsite with the gas, and the gas is of fossil origin and therefore this project would not qualify as a renewable electricity generating project.
1.12.5 Projects Rejected by Other GHG Programs
N/A; project has never been proposed to any other GHG program
1.13 Additional Information Relevant to the Project
This project is a grouped project and the initial project activity instance will contain up to 16 individual fugitive methane capture wells. At a later date the project will be expanded to bring
SUIT Westside Fugitive CBM Capture & Use Project
v3.0
10
online additional wells and/or gas seep collectors within the same geographic area. Since the future project instance will be located within the same geographic area as the initial instance, the baseline determination and additionality assessment for the project includes both instances. These new wells will tie into the existing gas collection system and utilize the same project infrastructure. The future project activity instance will only act to increase the annual volumes of captured fugitive methane, thus increasing the baseline emissions, project emissions and net emission reductions.
Eligibility Criteria
Eligibility criteria for new instances of the project activity are defined as follows:
1. The new instance is located within the same geographic region as the initial instance, and collects fugitive methane from the same methane gas seep area
2. The new gas interceptor wells are connected to the gas collection system which has been constructed for the initial instance of the project
3. The gas collected by the new project instance will utilize all of the same project infrastructure and monitoring systems in place for the initial project instance
4. The new instance will only be used to produce the same end product as the initial project instance, namely pipeline quality natural gas
Leakage Management
N/A
Commercially Sensitive Information
N/A
Further Information
Legislative / Regulatory
At the present time, no state or local legislation or regulations exist or are planned that require fugitive methane emissions from CBM production to be mitigated. In addition, there is no federal requirement to capture and/or utilize methane captured at CBM production sites, and no requirements are anticipated in the foreseeable future. Even if these regulations were put into place, they likely would not be enforceable on tribal lands and therefore SUIT would not be required to address this issue.
Economic
The economic viability of projects like this are highly dependent on natural gas prices. During the first year of operations, 2009, the project paid out more money in contracted operations and maintenance than it took in in revenue. The project recorded a net loss for the year. This will be the case as long as gas prices remain low. This project needs additional revenue in the form of VCU sales as well as higher gas prices in order to be cash flow positive.
Sectoral
The SUIT fugitive CBM capture and use project is the first of its kind. It is the first commercial-scale project that captures fugitive methane produced by CBM wells using underground interceptor wells
SUIT Westside Fugitive CBM Capture & Use Project
v3.0
11
and which subsequently cleans and injects the gas in a natural gas distribution grid. The SUIT project began commercial operations on 01 January, 2009.
Geographic
The San Juan basin is one of the largest coal bed methane producing regions active in the United States. The basin accounts for over half of the 1.9 trillion cubic feet of natural gas produced annually from CBM sources in the US.23 The San Juan basin has the second largest proven reserves of any gas field in the US.
Site-specific
Methane gas seeps at the ground level have been observed for in the outcropping of the Fruitland formation surrounding the San Juan basin. The figure below shows the Kirtland and Fruitland formation outcropping and the location of some but not all observed gas seeps in the area, not including those on the SUIT reservation.
Figure 3: Location of known gas seeps on the outcropping of the Fruitland and Kirtland formations
2 APPLICATION OF METHODOLOGY
2.1 Title and Reference of Methodology
Methodologies approved by the UNFCCC for Clean Development Mechanism (CDM) projects are a major reference for identifying a project’s baseline scenario and calculating the emission reductions of GHG offset projects. For the analysis of coal mine methane project activities, there is a methodology approved under the UNFCCC. However, this CDM methodology is
2 EIA Natural Gas Navigator http://www.eia.gov/dnav/ng/ng_prod_coalbed_s1_a.htm
3 (Fassett, 2010)
SUIT Westside Fugitive CBM Capture & Use Project
v3.0
12
not applicable to fugitive CBM that migrates up-dip and escapes from coal seam outcroppings.
WSP Environment & Energy along with SUIT submitted a proposed new methodology element in June of 2010 to the Voluntary Carbon Standard Association (VCSA) to begin the double approval process. This revision document is based on the CDM approved methodology ACM0008 but is drafted to be specific to coal bed methane production activities rather than the coal mining sector. This new methodology, entitled “Interception and destruction of fugitive methane from Coal Bed Methane (CBM) seeps” or VM0014, was approved by VCS in June of 2011, and provides a baseline calculation and monitoring methodology which is applicable to the SUIT project.
2.2 Applicability of Methodology
The VCS methodology, VM0014, is the only methodology approved by use by VCS that would apply to this project. The SUIT CBM seeps project meets the methodology’s applicability criteria, specifically because the SUIT project:
• Captures and destroys methane which would otherwise be released to the atmosphere from coalbed outcroppings.
• It is implemented at a coal seam where the hogback ridge of the Fruitland formation is exposed to the atmosphere.
• It has documented coalbed methane seeps, and this documentation is provided along with this PD.
• The project utilizes monitoring wells which act as gas drainage wells and intercept up-dip migrating fugitive methane at the location of the gas seeps.
• The project is located adjacent to conventional CBM wells and gas production
2.3 Project Boundary
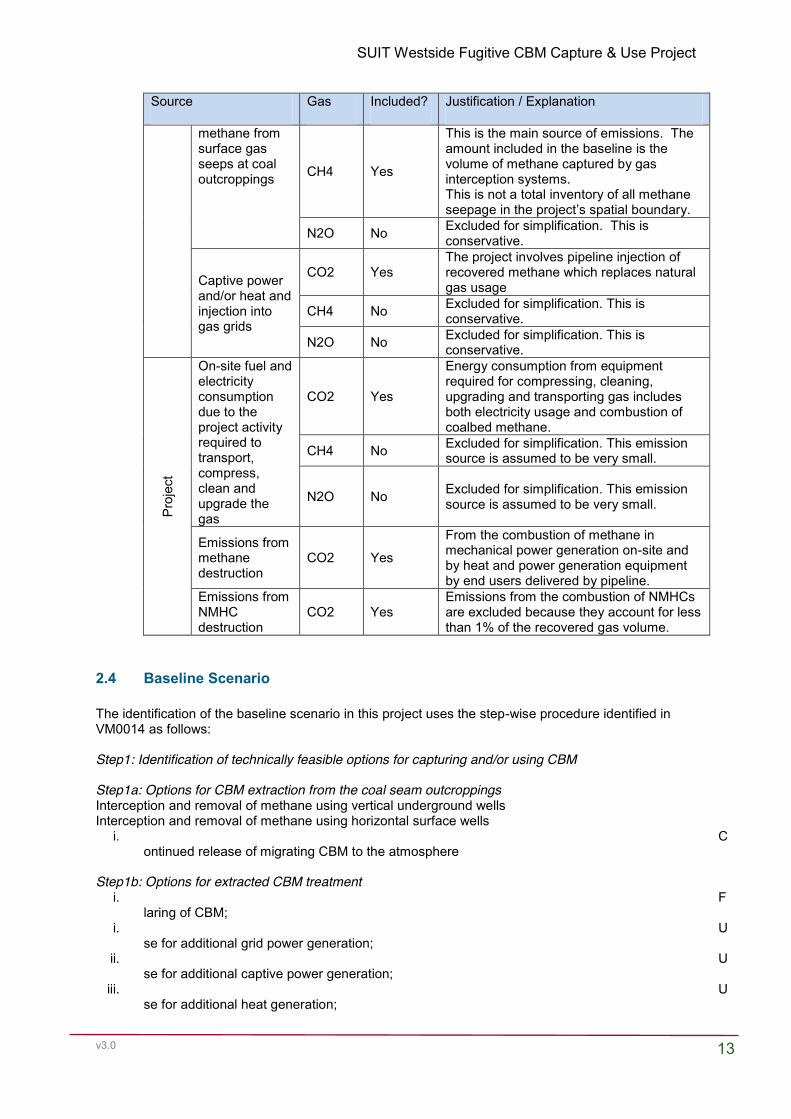
The table below delineates the sources, sinks and reservoirs of GHG emissions considered by VM0014. There are two primary sources of baseline emissions identified:
1. Emissions from the continued venting of methane from coal seam outcroppings. 2. Emissions from the combustion of natural gas replaced by the project activity.
There are three primary sources of project emissions identified and they include:
1. Combustion of coalbed methane to operate gas compression equipment and process heaters at the project site
2. Emissions associated with the production of electricity used to run pumps and motors in the gas processing facility
3. Emissions from combustion of recovered methane by end users.
Source Gas Included? Justification / Explanation
B as eli
ne
Emissions of CO2 No Excluded.
SUIT Westside Fugitive CBM Capture & Use Project
v3.0
13
Source Gas Included? Justification / Explanation
methane from surface gas seeps at coal outcroppings CH4 Yes
This is the main source of emissions. The amount included in the baseline is the volume of methane captured by gas interception systems. This is not a total inventory of all methane seepage in the project’s spatial boundary.
N2O No Excluded for simplification. This is conservative.
Captive power and/or heat and injection into gas grids
CO2 Yes The project involves pipeline injection of recovered methane which replaces natural gas usage
CH4 No Excluded for simplification. This is conservative.
N2O No Excluded for simplification. This is conservative.
Proj
ect
On-site fuel and electricity consumption due to the project activity required to transport, compress, clean and upgrade the gas
CO2 Yes
Energy consumption from equipment required for compressing, cleaning, upgrading and transporting gas includes both electricity usage and combustion of coalbed methane.
CH4 No Excluded for simplification. This emission source is assumed to be very small.
N2O No Excluded for simplification. This emission source is assumed to be very small.
Emissions from methane destruction
CO2 Yes
From the combustion of methane in mechanical power generation on-site and by heat and power generation equipment by end users delivered by pipeline.
Emissions from NMHC destruction
CO2 Yes Emissions from the combustion of NMHCs are excluded because they account for less than 1% of the recovered gas volume.
2.4 Baseline Scenario
The identification of the baseline scenario in this project uses the step-wise procedure identified in VM0014 as follows: Step1: Identification of technically feasible options for capturing and/or using CBM Step1a: Options for CBM extraction from the coal seam outcroppings Interception and removal of methane using vertical underground wells Interception and removal of methane using horizontal surface wells
i. Continued release of migrating CBM to the atmosphere
Step1b: Options for extracted CBM treatment
i. Flaring of CBM;
i. Use for additional grid power generation;
ii. Use for additional captive power generation;
iii. Use for additional heat generation;
SUIT Westside Fugitive CBM Capture & Use Project
v3.0
14
iv. Feed into gas pipeline (to be used as fuel for heat and / or power generation or vehicle fuel);
Step1c: Options for producing energy other than the project scenario
i. Natural gas supplied to the pipeline from other conventional sources including coalbed methane and shale gas;
Step1d: Eliminate baseline options that do not comply with legal or regulatory requirements
i. All of the above options comply with local laws and regulations.
Step1e: Formulation of baseline scenarios
i. Continued release of methane to the atmosphere and natural gas supplied to pipeline from other sources
ii. Interception, removal and flaring of fugitive CBM
iii. Interception and removal of fugitive CBM and use for additional grid power generation
iv. Interception and removal of fugitive CBM and use for captive power generation
v. Interception and removal of fugitive CBM and use for additional heat generation
vi. Interception and removal of fugitive CBM and feed into gas pipelines
vii. Any combination of (ii) through (vi) at various shares
Step 2: Barrier Analysis Sub-step 2a: identify barriers that would prevent the implementation of alternative scenarios
Non-financial investment barriers
There are a number of non-financial barriers to implementing projects that mitigate fugitive emissions generated during CBM extraction activities. These include:
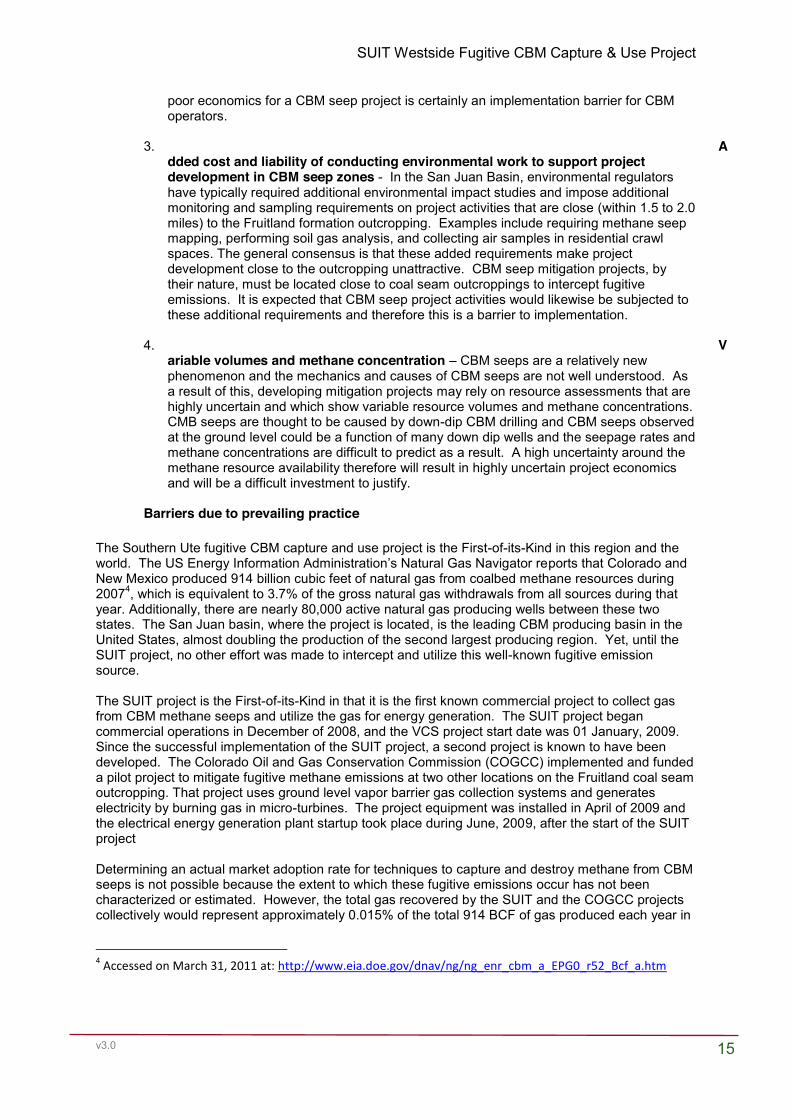
1. Perceived risk of legal liability associated with CBM seeps – Local laws and regulations currently do not require CBM operators to control fugitive methane emissions. However, many operators have the impression that regulators would interpret their involvement with a CBM seep mitigation activity as an admission that the fugitives are caused by their CBM drilling activities. The industry is understandably reluctant to get involved with CBM seep mitigation projects as their involvement might draw regulatory attention that would ultimately increase their legal liability, and trigger additional compliance costs and obligations. The perceived legal liability and potential added regulatory burden are barriers to CBM seep mitigation project implementation.
2. L
ow production volumes and project cash flows – The total scale of CBM seeps in the US and in the San Juan Basin is not fully understood but generally CBM seeps occur in relatively small volumes distributed over a large area when compared with what can be extracted from a conventional CBM well. The CBM operators (traditional big oil and gas companies) who obtain gas rights to produce natural gas in these regions are only interested in natural gas projects that produce relatively large volumes of CBM and have exceptional project economics. CBM seep mitigation projects, by comparison, are much smaller in gas production output resulting in lower project cash flows than these companies would require to justify their involvement. The low production volumes and
SUIT Westside Fugitive CBM Capture & Use Project
v3.0
15
poor economics for a CBM seep project is certainly an implementation barrier for CBM operators.
3. A
dded cost and liability of conducting environmental work to support project development in CBM seep zones - In the San Juan Basin, environmental regulators have typically required additional environmental impact studies and impose additional monitoring and sampling requirements on project activities that are close (within 1.5 to 2.0 miles) to the Fruitland formation outcropping. Examples include requiring methane seep mapping, performing soil gas analysis, and collecting air samples in residential crawl spaces. The general consensus is that these added requirements make project development close to the outcropping unattractive. CBM seep mitigation projects, by their nature, must be located close to coal seam outcroppings to intercept fugitive emissions. It is expected that CBM seep project activities would likewise be subjected to these additional requirements and therefore this is a barrier to implementation.
4. V
ariable volumes and methane concentration – CBM seeps are a relatively new phenomenon and the mechanics and causes of CBM seeps are not well understood. As a result of this, developing mitigation projects may rely on resource assessments that are highly uncertain and which show variable resource volumes and methane concentrations. CMB seeps are thought to be caused by down-dip CBM drilling and CBM seeps observed at the ground level could be a function of many down dip wells and the seepage rates and methane concentrations are difficult to predict as a result. A high uncertainty around the methane resource availability therefore will result in highly uncertain project economics and will be a difficult investment to justify.
Barriers due to prevailing practice
The Southern Ute fugitive CBM capture and use project is the First-of-its-Kind in this region and the world. The US Energy Information Administration’s Natural Gas Navigator reports that Colorado and New Mexico produced 914 billion cubic feet of natural gas from coalbed methane resources during 20074, which is equivalent to 3.7% of the gross natural gas withdrawals from all sources during that year. Additionally, there are nearly 80,000 active natural gas producing wells between these two states. The San Juan basin, where the project is located, is the leading CBM producing basin in the United States, almost doubling the production of the second largest producing region. Yet, until the SUIT project, no other effort was made to intercept and utilize this well-known fugitive emission source. The SUIT project is the First-of-its-Kind in that it is the first known commercial project to collect gas from CBM methane seeps and utilize the gas for energy generation. The SUIT project began commercial operations in December of 2008, and the VCS project start date was 01 January, 2009. Since the successful implementation of the SUIT project, a second project is known to have been developed. The Colorado Oil and Gas Conservation Commission (COGCC) implemented and funded a pilot project to mitigate fugitive methane emissions at two other locations on the Fruitland coal seam outcropping. That project uses ground level vapor barrier gas collection systems and generates electricity by burning gas in micro-turbines. The project equipment was installed in April of 2009 and the electrical energy generation plant startup took place during June, 2009, after the start of the SUIT project Determining an actual market adoption rate for techniques to capture and destroy methane from CBM seeps is not possible because the extent to which these fugitive emissions occur has not been characterized or estimated. However, the total gas recovered by the SUIT and the COGCC projects collectively would represent approximately 0.015% of the total 914 BCF of gas produced each year in
4 Accessed on March 31, 2011 at: http://www.eia.doe.gov/dnav/ng/ng_enr_cbm_a_EPG0_r52_Bcf_a.htm
SUIT Westside Fugitive CBM Capture & Use Project
v3.0
16
the region. Given that there are only two known project activities of this type, the market adoption rate is essentially 0%. The potential for the project to sell carbon offsets is critical to SUGF being able overcome the barriers to implementation as discussed. Registering the project with the VCS adds environmental credibility for the project which helps to overcome barriers related to environmental risk and liability while the carbon credit revenue stream will offset the otherwise poor financial performance.
Collectively, these barriers apply to all baseline scenarios which involved the interception and removal of methane, namely baseline scenarios (ii) to (vii). The only baseline scenario impeded by these barriers is scenario (i) in which up-dip migrating CBM is not intercepted or treated but left to continue being released to the atmosphere.
2.5 Additionality
The SUIT project follows VM0014 and the “Combined tool to identify the baseline scenario and demonstration of additionality” V 3.0 has been applied. This project has been evaluated against the associated tests for additionality that ensure the project reduces anthropogenic GHG emissions to a level above and beyond what would have occurred in the absence of the project activity, i.e., the project baseline. SUIT has applied the following procedure, as set forth in the aforementioned tool. Step 1: This step is ignored per VM0014 Step 2: Barrier Analysis Sub-step 2a: Identify barriers that would prevent the implementation of the proposed project activity. Refer to Barrier Analysis in the section 2.4 above. Sub-Step 2b: The non-financial investment barriers and the prevailing practice barrier apply to all of the alternatives which involve capture of fugitive CBM (baseline scenarios (ii) through (vii)), but do not apply to baseline scenario (i). Investment barriers do not apply to baseline scenario (i) because this scenario requires none. Technological barriers do not apply to scenario (i) since it does not requires use of any technology or equipment. Prevailing practice barriers do not apply to scenario (i) because continued release of CBM by coal seam outcroppings is the prevailing practice.
Step 3: Investment Analysis
An investment analysis is presented following the CDM guidelines on Investment Analysis from Annex 5 of the Executive Board Report. The Southern Ute Indian Tribe –Growth Fund considers investments that yield a 15% or greater rate of return (ROR) on equity after 10 years. However, for purposes of the investment analysis a benchmark of 17.08% is used. This value represents the 2007 average discount rate for non-integrated oil and gas producers in the United States as computed by the Texas Comptroller’s Property Tax Division (PTD)5. The investment analysis spreadsheet shows the 10 year IRR for return on equity for the project of (-2%) using base case assumptions and presents sensitivity analysis for variations in the base case sales price and production volumes of natural gas at (± 10%) of base case values. The investment analysis conducted before project implementation shows that the project is unlikely to be financially attractive. 5 Accessed at: http://www.window.state.tx.us/taxinfo/proptax/drs08/drs08.pdf
SUIT Westside Fugitive CBM Capture & Use Project
v3.0
17
Table 5 below shows the project IRR sensitivity to gross gas production volumes and sales price of natural gas delivered to pipelines.
Table 5: Project IRR with sensitivity to gas production volumes and sales price Gas Selling Price ($/MCF) Gross Production volume (MCFD)-
The project’s operating costs are highly dependent on the cost of CO2 removal, so the sensitivity to the raw gas initial Btu content (indirectly a function of CO2) is also presented in Table 6.
Table 6: Project IRR with sensitivity to raw gas Btu content and sales price Gas Selling Price ($/MCF)
Raw Gas HHV (Btu/scf)
6.24 6.93 7.62
556 -37.5% -15.7% -6.8%
618 -10.1% -2.0% 4.4%
679 0.5% 7.2% 13.0%
The investment analysis shows that the project is unlikely to be financially attractive in the absence of revenue from the sale of VCUs. Inclusion of VCU sales revenue helps to overcome many of the barriers to implementation and to improve the financial attractiveness of the project. At a VCU sales prices representative of 2007 averages for coal mine methane and the projects utilizing the VCS standard the project would show good economic returns with optimistic gas prices and VCU credit prices. The revenue from sales of VCUs makes this project finically viable.
Table 7: Project IRR with sensitivity to VCU sales and gas price Gas Spot Price ($/MCF)
VCU Price ($/tCO2e)
6.24 6.93 7.62
3 -1.7% 4.6% 10.1%
6 4.9% 10.4% 15.3%
9 10.6% 15.5% 20.1%
Step 4: Common Practice Analysis As outlined above, the prevention of methane emissions at coal seam outcroppings is not practiced at all in the United States. There are numerous reasons for this, including 1) methane emission rates are small in comparison to the underground resource that operators seek to extract thus making recovery uneconomical, 2) emissions from point source locations deep within the coal seam are dispersed and dilute by the time they migrate up-dip to the ground surface making recovery un-economical and requiring large well fields to recovery relatively low volumes, 3) most operators likely are unaware that fugitive emissions result from CBM operations because emission arise far from their principal operations and there is little evidence linking them to CBM extraction. This conclusion is supported by data collected and analyzed by the EPA in reference to various practices carried out at conventional CBM operations. Overall, with a market penetration rate of far less than 5%, methane collection and utilization from coal seam outcroppings is a relatively new area of business for the mining industry that still faces prohibitive cost and risk barriers. The potential to capitalize on the benefits associated with a market for GHG emission reductions helps to make the realization of migrating CBM recovery significantly more viable.
SUIT Westside Fugitive CBM Capture & Use Project
v3.0
18
The only realistic and credible baseline scenario which is not impacted by the barriers to implementation is scenario (i) in which the fugitive CBM is not intercepted and utilized. The proposed project activity is not likely to be financially attractive as demonstrated by the investment analysis and the project is therefore additional.
2.6 Methodology Deviations
There are no deviations from the methodology. An initial version of this PD did reference a methodology deviation pertaining to the regularity of the sampling of the captured gas methane concentration. Prior to the validation site visit, it was not clear how regularly a methane concentration sample was taken on the captured methane stream. During the site visit, the operations and maintenance staff explained the sampling procedure and confirm that regular gas samples are taken, approximately every 10 minutes, and that these samples are stored in a gas cylinder which is emptied and analyzed once monthly. Upon confirmation that the gas methane concentration is sampled more frequently than once daily, it is established that there are no methodology deviations.
3 QUANTIFICATION OF GHG EMISSION REDUCTIONS AND REMOVALS
3.1 Baseline Emissions
Baseline emissions are given by the following equation:
yUSE,yMR,yMD,y BEBEBEBE �� (1)
Where: BEy = Baseline emissions in year y (t CO2e/yr) BEMD,y = Baseline emissions from destruction of methane in the baseline scenario
in year y (t CO2e/yr) BEMR,y = Baseline emissions from release of methane into the atmosphere in year y
that is avoided by the project activity (t CO2e/yr) BEUSE,y = Baseline emissions from the production of power, heat or supply to the
gas grid replaced by the project activity in year y (t CO2e/yr)
Methane destruction in the baseline
Depending on the project type, methane destruction may already be occurring in the baseline in flares, flameless oxidation units or for the production of heat and/or power.
� � ¦uu� i
iBL,NMHCCH4MD CMCEFrCEFBE (2)
With:
CH4NMHC/PCPCr (3)
Where: BEMD,y = Baseline emissions from destruction of methane in the baseline scenario in
year y (t CO2e/yr) CEFCH4 = Carbon emission factor for combusted methane (2.75 t CO2/ t CH4) CEFNMHC = Carbon emission factor for combusted non-methane hydrocarbons. This
SUIT Westside Fugitive CBM Capture & Use Project
v3.0
19
parameter should be obtained through periodical analysis of captured methane (t CO2/ t NMHC)
CMBL,i = Captured methane that is destroyed by use i in the baseline (t CH4) r = Relative proportion of NMHC compared to methane PCCH4 = Concentration (in mass) of methane in extracted gas (%), measured on wet
basis PCNMHC = NMHC concentration (in mass) in extracted gas (%) measured on wet
basis
Release of methane into the atmosphere
Fugitive methane emissions generated at down-dip traditional coal bed methane operations are freely flowing gases which migrate up-dip and are emitted at coal seam outcroppings at the ground surface. Intercepted fugitive coal bed methane is not gas that is stored in an underground reservoir or adsorbed in the coal seam below the wells. Because the gas captured by these interception systems is freely flowing up the coal seam, the effect of applying vacuum pressure to the wellhead will increase the volume of free flowing gas that can be evacuated by each well, thus increasing the methane interception rate and decreasing fugitive emissions at the outcropping. Since vacuum pumps do not act to liberate adsorbed methane or drain underground gas reservoirs, but rather act to increase the area of drainage for each interception well, all of the methane captured during a given monitoring period can be said to have been emitted at the outcropping in the absence of the project activity during the same monitoring period.
For the reasons discussed above, baseline emissions of methane for each monitoring period are determined using the volume of captured methane from the interception well system. Project proponents are required to submit documented evidence that coal bed methane gas seeps are present up-dip of where gas interception systems are placed.
This evidence may take either of the following forms:
x Arial LIDAR mappings showing the coal outcropping, the location of the proposed gas interception system and ground level methane concentration at the outcropping
x Field surveys of the coal seam outcropping located up-dip of the interception systems using a methane flux chamber to establish ground level methane flux in mol/m2-day
Figure 4: Cross section showing how gas interception system wells can be placed between CBM operations and the coal outcroppings where fugitive emissions occur in order to capture methane before it reaches the surface. Fugitive methane emitted at the surface can originate both from within the seam above the ground water level as well as from the main part of the CBM field below the ground water level
SUIT Westside Fugitive CBM Capture & Use Project
v3.0
20
The interception system will only capture a portion of the fugitive methane emitted at the outcroppings (X CH4), as illustrated by Figure 5. The volume of gas captured by the system will be considered the baseline emissions (Y CH4) and fugitive methane eluding capture (X-Y CH4) is excluded from the project boundary, since this would be emitted in both the baseline and project cases. The figure also shows how methane flows from down-dip to up-dip before being emitted at the outcroppings. The down-dip traditional CBM extraction wells are excluded from the project boundary. Traditional CBM extraction wells and systems are ineligible as these systems act to free adsorbed methane from the coal seam and do not prevent fugitive methane emissions. Figure 5: Schematic illustrating the change in fugitive emissions at the coal seam outcropping resulting from methane capture by the gas interception systems, in this case, vertical wells.
Down-dip
Up-dip
X CH4
Surface outcropping
Coalbed seam
Down-dip
Up-dip
(X-Y) CH4
Surface outcropping
Coalbed seam
Gas Interception
Wells
Y CH4 to destruction
CBM interception wells or surface membranes will intercept and capture methane flowing up the coal seam to the outcropping or capture membrane at the outcropping in the absence of an imparted vacuum. However, the use of vacuum pumps will aid these wells by increasing their drainage area in the seam. Interception wells spaced laterally across the upward slowing coal seam will ideally capture methane flowing across the lateral line. This is illustrated in Figure 6.
SUIT Westside Fugitive CBM Capture & Use Project
v3.0
21
Figure 6: Schematic, on the left, showing vertical gas interception wells placed in the flow of fugitive migrating CBM gas intercepting some of the gas. On the right, vacuum pressure is applied to the wells and increases each well’s ability to drain gas horizontally across the seam, effectively allowing it to capture a larger share of the fugitive methane.
Direction of methane
flowing up dip to the
outcropping
Down dip
CBM wells
Coal seam outcropping
Down dip
CBM wells
Coal seam outcropping
Interception
wells
Baseline emissions from methane release to the atmosphere are calculated by subtracting methane which is captured and used in the baseline scenario from the methane which is captured and used by the project activity for each use. There is no capture of fugitive methane in the baseline, so this term drops out of the equation. Table 8 shows the ex ante projection of baseline emissions from methane released from the coal seam. Each use of captured methane is reported in units of million Btu (MMBtu) of gas gross heat content, which contains some non-methane species. Most of the gas is cleaned and delivered to the gas transmission pipeline for injection. However, some of the gas is used to generate mechanical power at the gas compression station (CS) and the gas treating plant (TP), as shown in Table 8. This is converted to tonnes of methane (tCH4) using a conversion factor derived from gas compositional analysis ex ante of 0.019 tCH4/MMBtu.
(4)
Where: BEMR = Baseline emissions from release of methane into the atmosphere that is
avoided by the project activity (t CO2e) CMPJ,i,y = Captured methane that is destroyed by use i of the project activity in year y
(tCH4) CMBL,i = Captured methane that would have been destroyed by use i in the baseline
Methane recovered from coal bed outcropping seeps can be used for a variety of purposes: to generate electricity or heat on-site, as a vehicle fuel, or as supply to a natural gas pipeline (gas grid). The SUIT project will reduce the emissions that would otherwise have resulted from the consumption of the pipeline natural gas replaced by the project, so the electricity and heat generation terms drop out of equation 5. The efficiency of gas treatment / processing is accounted for in that recovered methane used for mechanical energy generation is included in BEMR above. So this term is neglected from equation 6.
GASHEATELECUSE EFGASEFHEATEFGENBE u�u�u (5)
Where: BEUSE = Baseline emissions from the production of power and / or heat or from
destruction following injection into gas grids replaced by the project activity (t CO2e/yr)
GEN = Electricity generated by project activity (MWh) EFELEC = Emission factor of electricity (grid, captive or a combination) replaced by
project (t CO2/MWh) HEAT = Heat generated by project activity (GJ) EFHEAT = Emission factor of heat production replaced by project activity
(t CO2/GJ) GAS = Gas delivered to the gas grid (GJ) EFGAS = Emission factor for gas grid fuel replaced by the project activity
(t CO2/GJ)
Gas grid emission factor
Using an emission factor from the EPA Climate Leaders Technical Guidance for combustion of natural gas, EFgas,y is found to be 53.06 kgCO2/MMBtu. The gas delivered to the gas grid is equal to the captured methane sent to pipeline from Table 8 above.
Table 9: Ex ante projection of emissions from natural gas use in the Baseline Crediting Year GAS,Y (MMBtu) BEUSE (tCO2e)
Project emissions are defined by the following equation:
(6) Where:
PEy = Project emissions in year y (t CO2e) PEME,y = Project emissions in year y from energy use to capture and use methane (t CO2e) PEMD,y = Project emissions in year y from methane destroyed (t CO2e) PEUM,y = Project emissions in year y from un-combusted methane (t CO2e)
Combustion emissions from additional energy required for methane capture and use
Emissions from the additional energy used for the capture, transport, compression and use or destruction of methane are included as project emissions. These are quantified as follows:
Where: PEME = Project emissions from energy use to capture and use or destroy
methane (t CO2/yr) CONSELEC,PJ = Additional electricity consumption for capture and use or destruction of
methane, if any (MWh)6 CEFELEC = Carbon emissions factor of electricity used by the process equipment
(t CO2/MWh) CONSHEAT,PJ = Additional heat consumption for capture and use or destruction of
methane, if any (GJ) CEFHEAT = Carbon emissions factor of heat used by the process equipment
(t CO2/GJ) CONSFossFuel,PJ = Additional fossil fuel consumption for capture and use or destruction of
methane, if any (GJ) CEFFossFuel = Carbon emissions factor of fossil fuel used by the process equipment
(t CO2/GJ) The project uses fossil fuel in the form of coalbed methane purchased from Red Willow and grid electricity purchased from La Plata Electric Association. The fuel gas is piped to the SUIT project from a coalbed methane field nearby. Gas compositional analysis has been conducted ex ante to determine a carbon emission factor for this energy source.
6 For example, electricity may be required to run pumps, motors, compressors, and gas clean-up equipment
SUIT Westside Fugitive CBM Capture & Use Project
v3.0
24
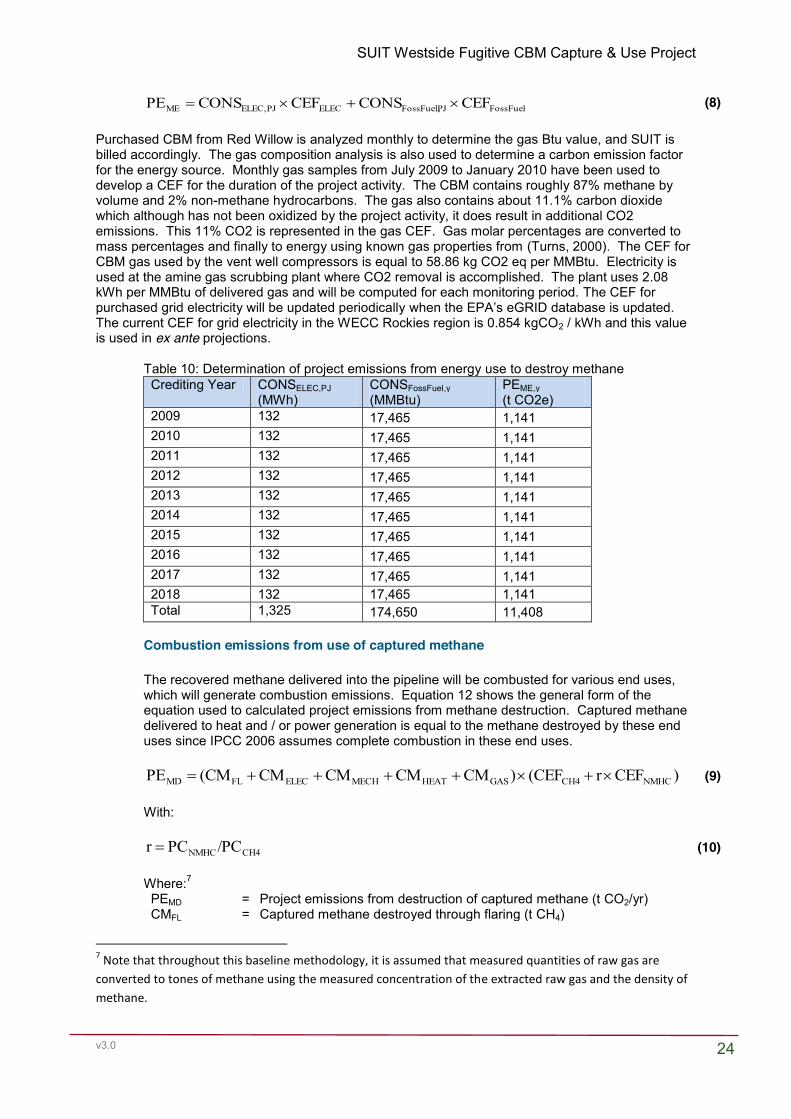
FossFuelPJFossFuel,ELECPJELEC,ME CEFCONSCEFCONSPE u�u (8) Purchased CBM from Red Willow is analyzed monthly to determine the gas Btu value, and SUIT is billed accordingly. The gas composition analysis is also used to determine a carbon emission factor for the energy source. Monthly gas samples from July 2009 to January 2010 have been used to develop a CEF for the duration of the project activity. The CBM contains roughly 87% methane by volume and 2% non-methane hydrocarbons. The gas also contains about 11.1% carbon dioxide which although has not been oxidized by the project activity, it does result in additional CO2 emissions. This 11% CO2 is represented in the gas CEF. Gas molar percentages are converted to mass percentages and finally to energy using known gas properties from (Turns, 2000). The CEF for CBM gas used by the vent well compressors is equal to 58.86 kg CO2 eq per MMBtu. Electricity is used at the amine gas scrubbing plant where CO2 removal is accomplished. The plant uses 2.08 kWh per MMBtu of delivered gas and will be computed for each monitoring period. The CEF for purchased grid electricity will be updated periodically when the EPA’s eGRID database is updated. The current CEF for grid electricity in the WECC Rockies region is 0.854 kgCO2 / kWh and this value is used in ex ante projections.
Table 10: Determination of project emissions from energy use to destroy methane Crediting Year CONSELEC,PJ
The recovered methane delivered into the pipeline will be combusted for various end uses, which will generate combustion emissions. Equation 12 shows the general form of the equation used to calculated project emissions from methane destruction. Captured methane delivered to heat and / or power generation is equal to the methane destroyed by these end uses since IPCC 2006 assumes complete combustion in these end uses.
Where:7 PEMD = Project emissions from destruction of captured methane (t CO2/yr) CMFL = Captured methane destroyed through flaring (t CH4)
7 Note that throughout this baseline methodology, it is assumed that measured quantities of raw gas are
converted to tones of methane using the measured concentration of the extracted raw gas and the density of
methane.
SUIT Westside Fugitive CBM Capture & Use Project
v3.0
25
CMELEC = Captured methane destroyed through electrical power generation (t CH4) CMMECH = Captured methane destroyed through mechanical power generation
(t CH4) CMHEAT = Captured methane delivered to heat generation (t CH4) CMGAS = Captured methane destroyed after being supplied to natural gas grid
(t CH4) CEFCH4 = Carbon emissions factor for combusted methane (2.75 t CO2/ t CH4) CEFNMHC = Carbon emissions factor for combusted non methane hydrocarbons (the
concentration varies and, therefore, to be obtained through periodical analysis of captured methane) (t CO2/ t NMHC)
r = Relative proportion of NMHC compared to methane PCCH4 = Concentration (volume) of methane in extracted gas (%), measured on dry
basis PCNMHC = NMHC concentration (volume) in extracted gas (%) measured on dry basis
The project uses captured methane to generate mechanical power and for gas grid injection, thus equation 12 is simplified to just include the MECH and GAS terms. Mechanical power generation includes operating compressors at the compressor station and at the gas treating plant. The carbon emission factor for the non-methane hydrocarbon content of captured methane is assessed annually using gas compositional analysis with a gas chromatograph. Testing conducted during the first two years of project operation show that NMHC content of raw gas is roughly 0.1% by volume. This corresponds to a NMHC content in final pipeline-quality product gas (following CO2 removal) of 0.2% by volume. Since this is well below the 1% threshold, combustion of NMHCs in captured methane is neglected for ex ante calculations. However, this will be assessed on an annual basis and will be included if NMHCs should increase to over 1% of the final product gas volume. The total mass of captured methane (tCH4) is converted again using a value of 0.019 tCH4/MMBtu of gas gross energy content. Then the CEF of 2.75 tCO2/tCH4 is multiplied by the total captured methane to produce the emissions from methane destruction by the project. CMMECH shows the sum of methane used for compressors at the compressor station and the gas treatment plant.
Table 11: Project emissions from methane destruction during the crediting period Crediting Year CMMECH
3.4 Summary of GHG Emission Reductions and Removals
The equation for emission reductions,
SUIT Westside Fugitive CBM Capture & Use Project
v3.0
26
(11) can be rewritten for the SUIT project as
(12) The following table summarizes the pre-project estimation of these various parameters, as detailed above, and of the resulting emission reductions.
Source of data: The EPA’s eGRID database, values for the WECC Rockies sub-region will be used. This will be updated periodically when eGRID is updated.
Value applied: For ex ante projections the grid emission factor is 0.854 tCO2 / MWh
Justification of choice of data or description of measurement methods and procedures applied:
eGRID should be used in the United States per VM0014
Any comment: Updated periodically when eGRID database is updated
SUIT Westside Fugitive CBM Capture & Use Project
v3.0
27
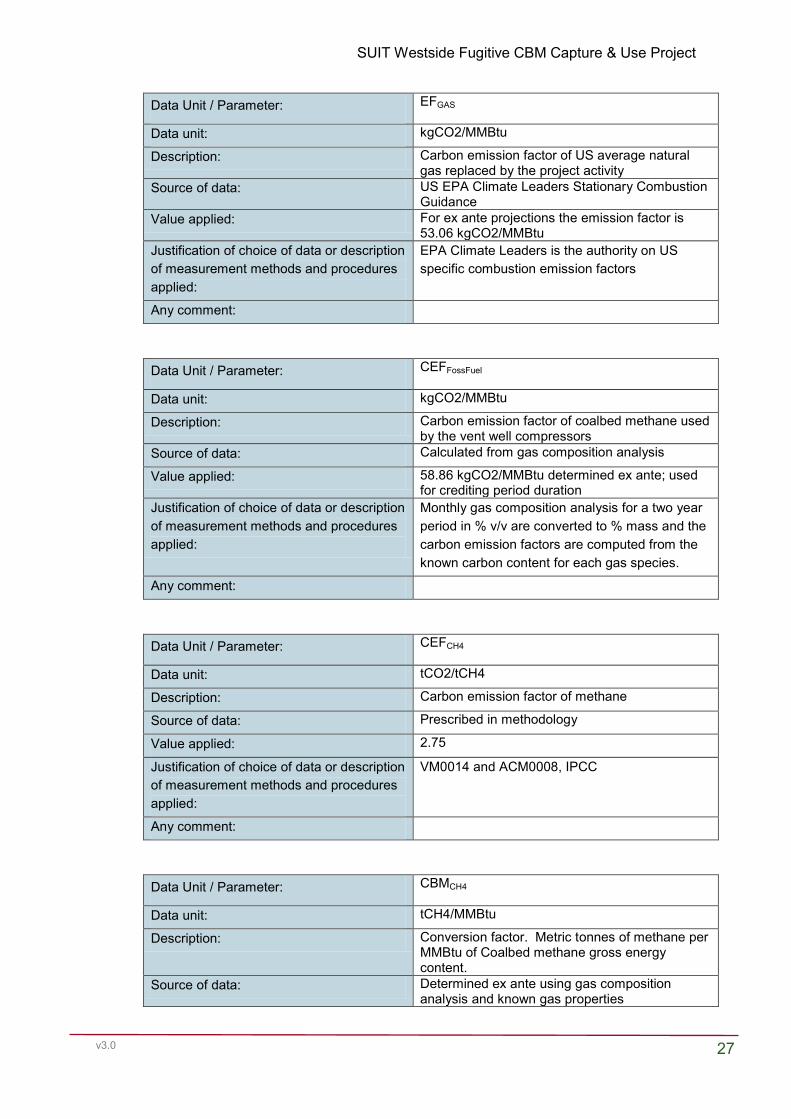
Data Unit / Parameter: EFGAS
Data unit: kgCO2/MMBtu
Description: Carbon emission factor of US average natural gas replaced by the project activity
Source of data: US EPA Climate Leaders Stationary Combustion Guidance
Value applied: For ex ante projections the emission factor is 53.06 kgCO2/MMBtu
Justification of choice of data or description of measurement methods and procedures applied:
EPA Climate Leaders is the authority on US specific combustion emission factors
Any comment:
Data Unit / Parameter: CEFFossFuel
Data unit: kgCO2/MMBtu
Description: Carbon emission factor of coalbed methane used by the vent well compressors
Source of data: Calculated from gas composition analysis
Value applied: 58.86 kgCO2/MMBtu determined ex ante; used for crediting period duration
Justification of choice of data or description of measurement methods and procedures applied:
Monthly gas composition analysis for a two year period in % v/v are converted to % mass and the carbon emission factors are computed from the known carbon content for each gas species.
Any comment:
Data Unit / Parameter: CEFCH4
Data unit: tCO2/tCH4
Description: Carbon emission factor of methane
Source of data: Prescribed in methodology
Value applied: 2.75
Justification of choice of data or description of measurement methods and procedures applied:
VM0014 and ACM0008, IPCC
Any comment:
Data Unit / Parameter: CBMCH4
Data unit: tCH4/MMBtu
Description: Conversion factor. Metric tonnes of methane per MMBtu of Coalbed methane gross energy content.
Source of data: Determined ex ante using gas composition analysis and known gas properties
SUIT Westside Fugitive CBM Capture & Use Project
v3.0
28
Value applied: 0.019 tCH4/MMBtu of CBM
Justification of choice of data or description of measurement methods and procedures applied:
Any comment: Reflects 24 months of averaged data
4.2 Data and Parameters Monitored
Data Unit / Parameter: PC,CH4,CDP
Data unit: % wet (v/v) Description: Concentration of methane in the CBM delivered
and sold to Red Willow at the central delivery point (CDP).
Source of data: Portable gas chromatograph used at sample point located at the CDP, near flow meter # 0410501
Description of measurement methods and procedures to be applied:
Gas samples are taken at regular intervals using a PGI International gas interceptor. The machine automatically takes a small gas sample approximately each 10 minutes and stores the sample in a 300 cc bottle. Each month, a Red Willow field technician will empty the gas cylinder and run a composite sample through a portable gas chromatograph. Using this approach, the GC analysis is performed once monthly, but is representative of nearly continuous monitoring since the gas cylinder contains 4500 samples spaced at regular 10 minute intervals for a 31 day period. The portable gas chromatograph takes monthly readings and the data is downloaded to a computer in the office after each sample is taken.
Frequency of monitoring/recording: Sampling is performed every 29 minutes and 46 seconds, but data captured and recorded monthly.
Value monitored: 58% Monitoring equipment: A PGI International Gas Sampler with model
number PF3MP and serial number 032516. An Agilent Technologies 3000 Micro Gas Chromatograph, various serial numbers.
QA/QC procedures to be applied: Red Willow field technicians calibrate portable gas chromatographs on a daily basis. Calibration is performed using a standard gas cylinder. GC’s are baked-out weekly to remove water build-up and each unit is inspected monthly.
Calculation method: N/A
SUIT Westside Fugitive CBM Capture & Use Project
v3.0
29
Any comment:
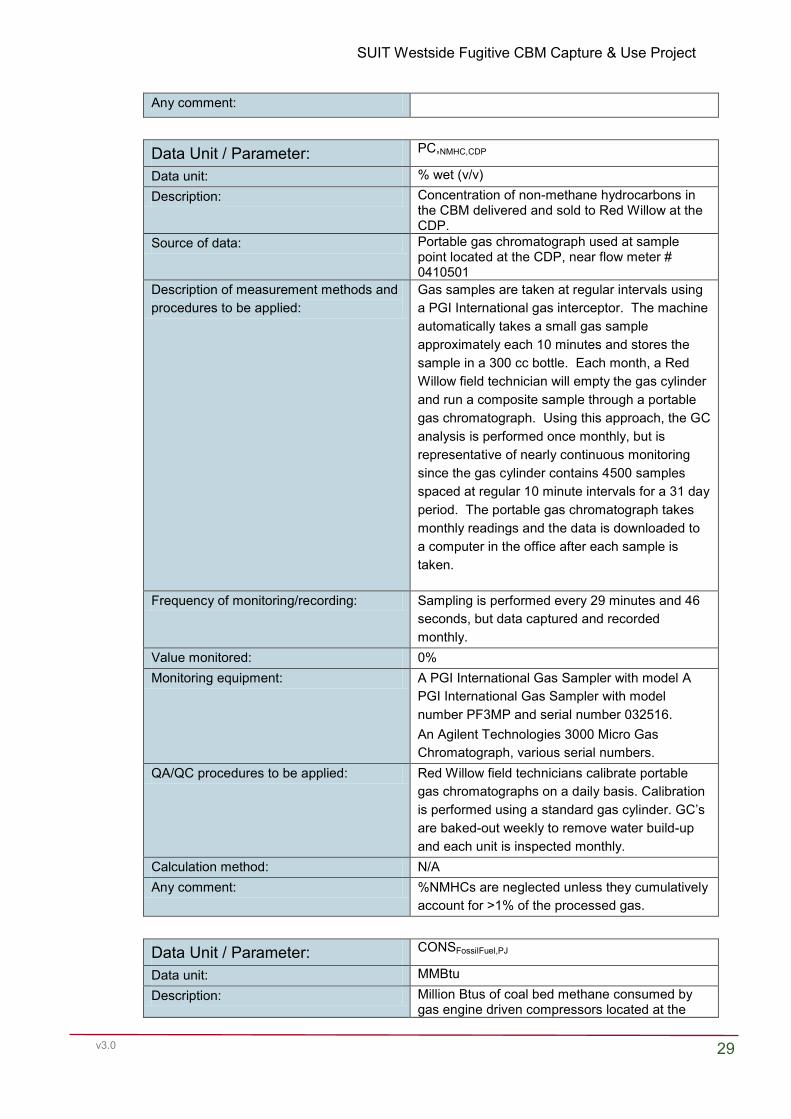
Data Unit / Parameter: PC,NMHC,CDP
Data unit: % wet (v/v) Description: Concentration of non-methane hydrocarbons in
the CBM delivered and sold to Red Willow at the CDP.
Source of data: Portable gas chromatograph used at sample point located at the CDP, near flow meter # 0410501
Description of measurement methods and procedures to be applied:
Gas samples are taken at regular intervals using a PGI International gas interceptor. The machine automatically takes a small gas sample approximately each 10 minutes and stores the sample in a 300 cc bottle. Each month, a Red Willow field technician will empty the gas cylinder and run a composite sample through a portable gas chromatograph. Using this approach, the GC analysis is performed once monthly, but is representative of nearly continuous monitoring since the gas cylinder contains 4500 samples spaced at regular 10 minute intervals for a 31 day period. The portable gas chromatograph takes monthly readings and the data is downloaded to a computer in the office after each sample is taken.
Frequency of monitoring/recording: Sampling is performed every 29 minutes and 46 seconds, but data captured and recorded monthly.
Value monitored: 0% Monitoring equipment: A PGI International Gas Sampler with model A
PGI International Gas Sampler with model number PF3MP and serial number 032516. An Agilent Technologies 3000 Micro Gas Chromatograph, various serial numbers.
QA/QC procedures to be applied: Red Willow field technicians calibrate portable gas chromatographs on a daily basis. Calibration is performed using a standard gas cylinder. GC’s are baked-out weekly to remove water build-up and each unit is inspected monthly.
Calculation method: N/A Any comment: %NMHCs are neglected unless they cumulatively
account for >1% of the processed gas.
Data Unit / Parameter: CONSFossilFuel,PJ
Data unit: MMBtu Description: Million Btus of coal bed methane consumed by
gas engine driven compressors located at the
SUIT Westside Fugitive CBM Capture & Use Project
v3.0
30
vent wellheads and the CDP. Source of data: Monthly Red Willow gas sales invoices, wellhead
compressor fuel use reported as “Vent Gas Fuel Charge” on invoice.
Description of measurement methods and procedures to be applied:
CBM consumption is metered with a flow meter located near the CDP and maintained by Red Willow Gathering Company. Monthly totals appear on gas sales invoices.
Frequency of monitoring/recording: Continuous monitoring and recording of data Value monitored: 41,512 Monitoring equipment: The gas flow rates are determined using a Daniel
orifice type flow meter with a static pressure range of 500 psi and a differential pressure range of 250 psi, a meter tube diameter of 2.067 inches and an orifice diameter of 0.5 inches. A Fisher recorder, with serial number 16984801 is used to meter and record the gas flow rates. The gas flow meter has been assigned the system number 0400501 by Red Willow.
QA/QC procedures to be applied: Gas flow meters are calibrated four times annually by Red Willow field technicians and monthly gas composition is determined using portable gas chromatographs which are calibrated daily. All data is stored on-site at Red Willow offices in Durango, and is remotely backed up.
Calculation method: Gas Btu content determined from volumetric consumption and gas composition using Flow Calc software.
Any comment: Four measuring equipment inspection and calibration reports have been provided to DNV for inspections occurring over the monitoring period.
SUIT Westside Fugitive CBM Capture & Use Project
v3.0
31
Data Unit / Parameter: CMMECH,CS,PJ
Data unit: MMBtu Description: Million Btu of coal bed methane used by engine
driven compressors at the Red Cedar Coyote Gulch Compression station.
Source of data: Monthly Red Willow gas sales invoices, compressor fuel allocation reported as “Coyote Compressor Fuel” on invoice.
Description of measurement methods and procedures to be applied:
CBM consumption is metered with a flow meter located at the compressor station and maintained by Red Willow Gathering Company. Monthly totals appear on gas sales invoices.
Frequency of monitoring/recording: Continuous monitoring and recording of data Value monitored: 16,921 Monitoring equipment: An orifice type flow meter measures flow rates,
with a Fisher FloBoss recorder / monitor with serial number 17957472. Red Willow assigns the number 0269901 to this station.
QA/QC procedures to be applied: Gas flow meters are calibrated four times annually by Red Willow field technicians and monthly gas composition is determined using portable gas chromatographs which are calibrated daily. All data is stored on-site at Red Willow offices in Durango, and is remotely backed up.
Calculation method: Gas Btu content determined from volumetric consumption and gas composition using Flow Calc software.
Any comment: Gas consumption apportioned to the fugitive CBM is prorated by Red Willow.
Data Unit / Parameter: CMMECH,TP,PJ
Data unit: MMBtu Description: Million Btus of coal bed methane used in engine
driven compressors, process heating equipment, and reboilers located at the Red Willow Coyote Gulch Treating Plant.
Source of data: Monthly Red Willow gas sales invoices, fuel use allocation is 5.5% of CBM delivered to the CDP
Description of measurement methods and procedures to be applied:
CBM consumption is metered with a flow meter located at the treating plant and maintained by Red Willow Gathering Company and prorated to the project on a Btu basis. Monthly totals appear on gas sales invoices.
Frequency of monitoring/recording: Continuous monitoring and recording of data Value monitored: 8,796 Monitoring equipment: various; maintained by another party QA/QC procedures to be applied: Gas flow meters are calibrated four times
annually by Red Willow field technicians and monthly gas composition is determined using portable gas chromatographs which are
SUIT Westside Fugitive CBM Capture & Use Project
v3.0
32
calibrated daily. All data is stored on-site at Red Willow offices in Durango, and is remotely backed up.
Calculation method: Gas Btu content determined from volumetric consumption and gas composition using Flow Calc software.
Any comment: Gas consumption apportioned to the fugitive CBM is prorated by Red Willow.
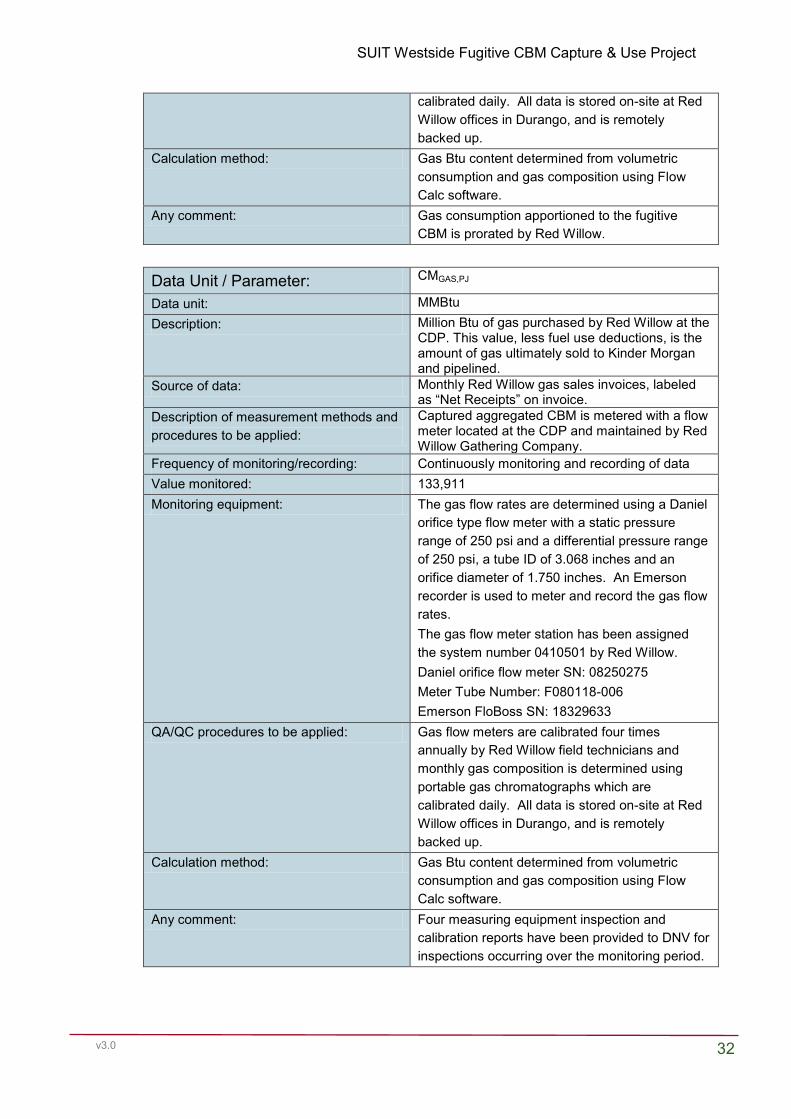
Data Unit / Parameter: CMGAS,PJ
Data unit: MMBtu Description: Million Btu of gas purchased by Red Willow at the
CDP. This value, less fuel use deductions, is the amount of gas ultimately sold to Kinder Morgan and pipelined.
Source of data: Monthly Red Willow gas sales invoices, labeled as “Net Receipts” on invoice.
Description of measurement methods and procedures to be applied:
Captured aggregated CBM is metered with a flow meter located at the CDP and maintained by Red Willow Gathering Company.
Frequency of monitoring/recording: Continuously monitoring and recording of data Value monitored: 133,911 Monitoring equipment: The gas flow rates are determined using a Daniel
orifice type flow meter with a static pressure range of 250 psi and a differential pressure range of 250 psi, a tube ID of 3.068 inches and an orifice diameter of 1.750 inches. An Emerson recorder is used to meter and record the gas flow rates. The gas flow meter station has been assigned the system number 0410501 by Red Willow. Daniel orifice flow meter SN: 08250275 Meter Tube Number: F080118-006 Emerson FloBoss SN: 18329633
QA/QC procedures to be applied: Gas flow meters are calibrated four times annually by Red Willow field technicians and monthly gas composition is determined using portable gas chromatographs which are calibrated daily. All data is stored on-site at Red Willow offices in Durango, and is remotely backed up.
Calculation method: Gas Btu content determined from volumetric consumption and gas composition using Flow Calc software.
Any comment: Four measuring equipment inspection and calibration reports have been provided to DNV for inspections occurring over the monitoring period.
SUIT Westside Fugitive CBM Capture & Use Project
v3.0
33
Data Unit / Parameter: CEFNMHC
Data unit: tCO2/tNMHC Description: Carbon emission factor for non-methane
hydrocarbons contained in the product gas Source of data: Computed from annual average gas composition
and known gas properties Description of measurement methods and procedures to be applied:
Frequency of monitoring/recording: Calculated monthly using gas composition analysis
Value monitored: 2.97 Monitoring equipment: QA/QC procedures to be applied: Calculation method: Gas mole percentages are converted to mass
percentages and finally to energy using known gas properties
Any comment: Total % NMHC is less than 1%, so this is not used in ex ante calculations
Data Unit / Parameter: CONSELEC,PJ,Specific
Data unit: kWh/MMBtu
Description: Specific consumption of electricity by equipment used to treat CBM to pipeline quality natural gas.
Source of data: Calculated from total gas production and total electricity purchase invoices, over the reporting period
Description of measurement method and procedures to be applied:
Electricity will be metered by the La Plata Electric Association electric meters located on-site and monthly invoices with kWh totals are sent to Red Willow.
Frequency of monitoring/recording: Consumption is monitored continuously and recorded monthly
Value applied: 2.08
Monitoring equipment: Electric meters located at the Coyote Gulch treating plant
QA/QC procedures to be applied: Electric invoices are received monthly by Red Willow and are stored electronically.
Calculation Method: Total electricity consumed during each month of the reporting period divided by total energy of gas delivered during each month of the reporting period.
Any comment:
Data Unit / Parameter: GASVW011,y
Data unit: MMBtu Description: Million Btu of gas produced by the Cinder Buttes
#4 well (well ID: VW011) in year y. This well is not part of the project boundary and needs to be
SUIT Westside Fugitive CBM Capture & Use Project
v3.0
34
excluded from calculations of project and baseline emissions.
Source of data: Monthly reports issued by Red Willow Description of measurement methods and procedures to be applied:
Gas flow rates are metered with a V-Cone differential pressure flow meter. Gas composition analysis is used to determine Btu content, and the product of these two values is reported in MMBtu per month.
Frequency of monitoring/recording: Flow rates are measured continuously and gas composition is analysed quarterly.
Value monitored: 7,309 Monitoring equipment: The gas flow rates are determined using
McCrometer VCone flow meter and differential pressure recorder manufactured by Kim Ray. The accuracy of the VCone flow meter is ±0.5% of the reading value. The flow meter is installed in a pipe with ID of 1.939 inches and a 1.551 inch diameter VCone. The device is tested and calibrated to measure a static pressure range of 500 psia and a differential pressure range of 150 psia. The gas flow meter station has been assigned the system number VW011 by Red Willow.
QA/QC procedures to be applied: Flow meter calibration and gas composition analysis is performed two to three times annually by Red Willow field technicians. Portable gas chromatographs are used and these are calibrated regularly. All data is stored on-site at Red Willow offices in Durango, and is remotely backed up.
Calculation method: Gas Btu content data and reports are determined from volumetric consumption and gas composition using Flow Calc software.
Any comment:
4.3 Description of the Monitoring Plan
4.3.1 Roles and responsibilities
Monitored data at the project site are analyzed and summarized monthly. Two field operations companies are responsible for data monitoring and quality control and assurance. Red Willow Gathering &Treating Company provides maintenance support and operates the interceptor well system, the CDP and the gas upgrading facility. Red Cedar Production Company operates the gas compression station. SUIT receives monthly gas purchase invoices from Red Willow which summarize gross production and sales, captured CBM gas which is consumed onsite for mechanical energy generation, and CBM fossil fuel purchases from Red Willow. Additionally, Red Willow is responsible for maintaining and calibrating all data acquisition and storage equipment including gas flow meters and gas chromatographs.
SUIT Westside Fugitive CBM Capture & Use Project
v3.0
35
A consultant to SUIT, WSP Environment & Energy, will be responsible for aggregating and managing monitoring data necessary to calculate project emission reductions according to the monitoring plan outlined in the Project Description. WSP will also prepare monitoring reports and assist with project validation and verification. SUIT staff will be responsible for summarizing and supplying WSP with the methane concentration data on a weighted monthly average basis. Additionally, SUIT will be responsible for supplying WSP with electronic copies of gas sales invoices and electricity purchase invoices. 4.3.2 Data Collection / Monitoring Equipment
A flow meter located at the central delivery point (CDP) meters the volume of captured fugitive CBM which is collected and supplied to Red Willow for processing and ultimately to Kinder Morgan. A portable gas chromatograph is used to determine the composition of gas sampled from the line. The gas is sampled on regular intervals (each 10 minutes) and stored in a gas cylinder which is emptied and analyzed using the portable GC once each month. The reading is performed monthly, but the gas samples are taken on a nearly continuous basis. Together with continuous volumetric flow rate data, the gas composition analysis results are used to establish the gas Btu content. Monthly totals appear on gas sales invoices. The CDP represents the point of sale from SUIT to Red Willow but not the point of sale to the final gas buyer, Kinder Morgan. Gas processing downstream of the CDP is tracked and included in the project boundary. The PC hard drives will store data for the entire duration of the project and an additional 2 years thereafter. The PC can be accessed and data can be downloaded remotely by SUIT staff. The SUIT project also purchases CBM from Red Willow to operate the wellhead compressors and process equipment at the CDP. This fuel gas is metered at a location near the CDP before the stream is split and sent to both locations. Again, a portable GC samples the stream to determine the gas composition on a monthly basis. These data are used to determine the Btus purchased by the project. Gas flow meters are calibrated four times per year according to a company procedure. A copy of a gas flow meter calibration record is provided along with this PD. Gas composition analysis is conducted monthly using portable gas chromatographs at various locations. Portable GCs are calibrated each day prior to use by Red Willow field technicians according to a company procedure which uses a standard gas cylinder. A copy of a GC calibration record is provided along with this PD. Downstream of the point of sale, Red Willow& Red Cedar both use captured coalbed methane pulled directly off of the product stream to operate mechanical energy generation equipment such as engine driven compressors and process heaters. Energy used to operate these equipment are prorated to the quantity of natural gas produced by the interceptor well project and are reported as MMBtu deductions on the sales gas invoices received by SUIT. The difference between gross gas sent to the CDP and these deductions represent the net production quantity being injected into the natural gas pipeline. All gas sales invoices will be kept by SUIT for 2 years following the end of the project activity. The same procedure as described above is used here to determine the gas flow rate and composition used to develop Btu energy consumption values.
Fossil Fuel Consumption
Coalbed methane is purchased by the project from Red Cedar and is piped to the interceptor wellhead compressors and used to evacuate fugitive methane from the seam. Red Willow reports monthly gas purchase quantities on the sales gas invoices that SUIT receives. In addition, Red Willow provides a gas composition analysis for the CBM fuel gas combusted by the compressors. This is used to determine the MMBtu quantity of fuel gas sold to the project. This is also used by the project to develop a carbon emission factor for the gas which is determined ex ante and used throughout the project crediting period. Red Willow is responsible for maintaining the accuracy and
SUIT Westside Fugitive CBM Capture & Use Project
v3.0
36
integrity of gas flow meters and the gas chromatograph which are used. All gas sales invoices will be kept by SUIT for 2 years following the end of the project activity.
Electricity Consumption
Electric power is supplied to the Red Willow Coyote Gulch Gas Treating Plant by La Plata Electric Association (LPEA), a Rural Electric Cooperative. Monthly electricity purchase invoices are tracked by Red Willow and are pro-rated to the quantity of gas produced by the interceptor well project. These data are not reported on gas sales invoices, but are provided separately by Red Willow staff to the project. LPEA is responsible for maintaining the accuracy of electric meters located on-site. All electricity purchase invoices will be kept by Red Willow for 2 years following the end of the project activity. The specific consumption of electricity (kWh/MMBtu of gas sold) has been determined ex ante using 24 months of actual data and is used for the duration of the project. This factor will be calculated using actual electricity purchase invoices and gas sales quantities going forward for each monitoring period.
4.3.3 Title and reference of the VCS methodology (which includes the monitoring requirements) applied to the project activity and explanation of methodology choices:
The same document used to determine the emission reduction potential of the project is also used for the monitoring methodology. This methodology is the Verified Carbon Standard VM0014 Version 1 – “Interception and destruction of fugitive methane from Coal bed Methane (CBM) seeps” 4.3.4 3.2 Monitoring, including estimation, modeling, measurement or
calculation approaches:
Monitoring at SUIT is required to establish the volumes of methane which are injected into the natural gas pipeline. This volume of injected methane defines the gross volume of methane emissions prevented from escaping to the atmosphere. Flow meters and a gas chromatograph take measurements of the total flow of gas being pipeline injected as well as the concentration of methane by volume. The monthly sales volumes in million Btu of gas (MMBtu) are available from gas sales invoices and are used for emission reduction calculations. Electricity and fossil fuel consumption required by the project to compress and treat gas are available from sales invoices and utility invoices. SUGF and its partners Red Willow Gathering Company and Red Cedar Production Company are responsible for all field operations and data collection and management. Table 13 and Figure 7 illustrate the location of unit operations and monitoring equipment used by the project. See section 3.4 for additional details.
Table 13: Data Collection and Monitoring Location Function Monitoring & Reporting of Data Interception Wells & Collection system
There are a total of up to 16 wellheads used in the project, each with a gas engine driven compressor and a gas flow meter. These wells intercept methane from the seam, and the collection system aggregates gas from the various wells.
Coalbed methane (“Vent Gas Fuel”) is purchased from Red Willow and delivered to engine driven wellhead compressors. Quantities of CBM gas combusted by the compressors are reported in gas purchasing invoices as “Vent Well Fuel Charge”. Gas composition analysis of CBM fuel gas combusted is provided along with invoices, this is used to calculate CEFFOSSFUEL.
Central Delivery Point (CDP)
The CDP meters the total gas flow rate captured by the interceptor well system, and is the point of custody transfer to Red Cedar. A
Flow meter and GC record data to a plant computer. Gas composition analysis is used to determine NMHC content and BTU value. Flow meter used to establish volumes sold to Red Willow.
SUIT Westside Fugitive CBM Capture & Use Project
v3.0
37
gas interceptor takes gas samples every 30 minutes and stores them in a gas cylinder. A portable gas chromatograph takes monthly gas samples from the cylinder to determine gas composition and Btu value.
A second flow meter located near the CDP is installed on the pipeline which supplies the wellhead compressors (from above) with CBM fuel. The same process is used to establish Btu value.
Red Willow Coyote Gulch Compressor Station
Dehydration and pressurization of gas prior to gas treatment. Here CDP gas from the interceptor project is blended with CBM captured from surrounding operations.
Quantities of captured methane used for mechanical energy generation are reported in gas purchasing invoices as “Coyote Compressor Fuel”.
Red Cedar Coyote Gulch Treating Plant
Gas upgrading for pipeline injection; includes H2S removal, CO2 removal by amine scrubbers
Quantities of captured methane used for mechanical energy generation are reported at 5.5% of CDP gas in the gas sales invoices. Electricity used to treat gas is reported in LPEA purchase invoices. Net gas delivered to the pipeline is equal to the gross gas sold at CDP less gas used to generate mechanical energy at the compressor station and the treating plant.
PR
OJE
CT D
ES
CR
IPTIO
N: VC
S Version 3 v3.0
38
Figure 7: Project Boundary and M
onitoring Locations
PROJECT DESCRIPTION: VCS Version 3
v3.0 39
5 ENVIRONMENTAL IMPACT
The biggest environmental impact from the project will be emissions of criteria air pollutants. Equipment located at the project site including the vent well compressors, the Coyote Gulch Compression Station and the Coyote Gulch Processing Plant, will all generate combustion emissions. The processing plant is a major source of emissions for nitrogen oxides (NOx), volatile organic compounds (VOCs), carbon monoxide (CO) and hazardous air pollutants (HAPs). However, the impact of the processing plant is not attributed to this project alone; it processes gas from other producing wells near the site. In fact, only 0.1% of the product gas treated by this facility arises from the vent well project. Thus, the local air quality impact is not significantly increased by this project activity. The property hosting the interceptor wells is privately owned by the Southern Ute Indian Tribe. The interceptor wellheads occupy a total of approximately 877 acres. However, very little land transformation has been required. The dirt access roads which are in place have a minimal impact on the surroundings. Furthermore, with the exception of the gas collection system and the compressor, much of this equipment was already in place prior to the project activity, as it was repurposed from a water level monitoring well system. Additionally, the gas gathering system has been placed above ground to avoid disturbing the underlying soil. The plant at which the collected methane gas is scrubbed and transported to the nearby existing natural gas pipeline is located on a 9 acre parcel of land. In total, the equipment for the SUIT project occupies a minimal amount of space on the property and does not interfere with any existing or planned land uses.
6 STAKEHOLDER COMMENTS
No stakeholder consultation was conducted during the development stages of this project, but the project was presented to and approved by the Southern Ute Indian Tribe decision makers.