Page 1
ORIGINAL ARTICLE
Suitability assessment of deep groundwater for drinkingand irrigation use in the Djeffara aquifers (Northern Gabes,south-eastern Tunisia)
Mohsen Ben Alaya • Salwa Saidi • Thouraya Zemni •
Fouad Zargouni
Received: 5 December 2011 / Accepted: 12 August 2013 / Published online: 3 September 2013
� The Author(s) 2013. This article is published with open access at Springerlink.com
Abstract The multilayered Djeffara aquifer system,
south-eastern Tunisia, has been intensively used as a pri-
mary source to meet the growing needs of the various
sectors (drinking, agricultural and industrial purposes). The
analysis of groundwater chemical characteristics provides
much important information useful in water resources
management. Detailed knowledge of the geochemical
evolution of groundwater and assessing the water quality
status for special use are the main objective of any water
monitoring study. An attempt has been made for the first
time in this region to characterize aquifer behavior and
appreciate the quality and/or the suitability of groundwater
for drinking and irrigation purposes. In order to attend this
objective, a total of 54 groundwater samples were collected
and analyzed during January 2008 for the major cations
(sodium, calcium, magnesium and potassium), anions
(chloride, sulfate, bicarbonate), trace elements (boron,
strontium and fluoride), and physicochemical parameters
(temperature, pH, total dissolved salts and electrical con-
ductivity). The evolution of chemical composition of
groundwater from recharge areas to discharge areas is
characterized by increasing sodium, chloride and sulfate
contents as a result of leaching of evaporite rock. In this
study, three distinct chemical trends in groundwater were
identified. The major reactions responsible for the chemical
evolution of groundwater in the investigated area fall into
three categories: (1) calcite precipitation, (2) gypsum and
halite dissolution, and (3) ion exchange. Based on the
physicochemical analyses, irrigation quality parameters
such as sodium absorption ratio (SAR), percentage of
sodium, residual sodium carbonate, residual sodium
bicarbonate, and permeability index (PI) were calculated.
In addition, groundwater quality maps were elabortaed
using the geographic information system to delineate spa-
tial variation in physico-chemical characteristics of the
groundwater samples. The integration of various dataset
indicates that the groundwater of the Djeffara aquifers of
the northern Gabes is generally very hard, brackish and
high to very high saline and alkaline in nature. The water
suitability for drinking and irrigation purposes was evalu-
ated by comparing the values of different water quality
parameters with World Health Organization (WHO)
guideline values for drinking water. Piper trilinear diagram
was constructed to identify groundwater groups where the
relative major anionic and cationic concentrations are
expressed in percentage of the milliequivalent per liter
(meq/l), and it was demonstrated that the majority of the
samples belongs to SO4–Cl–Ca–Na, Cl–SO4–Na–Ca and
Na–Cl hydrochemical facies. As a whole, all the analyzed
waters from this groundwater have revealed that this water
is unsuitable for drinking purposes when comparing to the
drinking water standards. Salinity, high electric conduc-
tivity, sodium adsorption ratio and sodium percentages
indicate that most of the groundwater samples are inap-
propriate for irrigation. The SAR vary from medium (S2)
to very high (S4) sodicity. Therefore, the water of the
Djeffara aquifers of the northern Gabes is dominantly
of the C4–S2 class representing 61.23 % of the total
wells followed by C4–S3 and C4–S4 classes at 27.27 and
11.5 % of the wells, respectively. Based on the US Salinity
M. B. Alaya (&) � T. Zemni � F. Zargouni
Faculty of Mathematical, Physical and Natural Sciences
of Tunis, Department of Geology, Laboratory of Geomatic
and Applied Geology, University of Tunis El Manar,
2092 Tunis El Manar II, Tunisia
e-mail: [email protected]
S. Saidi
National School of Engineering of Sfax (ENIS), Water,
Energy and Environment Laboratory (LR3E),
University of Sfax, 3038 Sfax, Tunisia
123
Environ Earth Sci (2014) 71:3387–3421
DOI 10.1007/s12665-013-2729-9
Page 2
Classification, most of the groundwater is unsuitable for
irrigation due to its high salt content, unless certain mea-
sures for salinity control are undertaken.
Keywords Physico-chemical analysis �Hydrogeochemistry � Drinking and irrigation utility �Djeffara aquifers � Tunisia
Introduction
Nowadays, fresh water resources are becoming more and
more limited with increasing demand in the world. Thus,
understanding the hydrochemical characteristics and water
quality is becoming critical for groundwater planning and
management, to ensure sustainable safe use of the resour-
ces for drinking, agricultural and industrial purposes.
Groundwater resources of the Mediterranean coastal plains
in the southern bank of the basin (Middle East and North
Africa) show a qualitative and quantitative deterioration
through time (Custodio and Bruggeman 1987; Edmunds
et al. 2003) resulting from climatic constraints (semi-arid
climate and low rainfall amount) and anthropological
activities (limited resources, pumping higher rates than the
present recharge, largely increased for urban, domestic
supply and multiplication of the diffuse sources of pollu-
tion). Therefore, it is necessary to subject the water to
routine quality analyses to assess its suitability for human
consumption. The groundwater chemistry could have
important information on the suitability of the groundwater
for domestic, industrial and agricultural purposes, and its
contamination has been recognized as one of the most
serious problems in the world (Adams et al. 2001; Jalali
2007, 2009, Djabri et al. 2007; Wen et al. 2008; Giridharan
et al. 2008; Khazaei et al. 2006; Tayfur et al. 2008; Anku
et al. 2009; Trabelsi et al. 2009, 2011; Rouabhia et al.
2009; Fehdi et al. 2009). Groundwater chemistry depends
on a number of factors such as general geology, degree of
chemical weathering of the various rock types, quality of
recharge water, and inputs from sources other than water–
rock interaction. Such factors and their interactions result
in a complex groundwater quality (Domenico and Sch-
wartz 1990; Edmunds et al. 2003; Risacher et al. 2003;
Guler and Thyne 2004; Vengosh et al. 2005; Boughriba
et al. 2006; Ayenew et al. 2008; Giridharan et al. 2008;
Han et al. 2009; Trabelsi et al. 2009, 2011). In Tunisia and
other similar parts worldwide, common studies have been
carried out to assess the geochemical characteristics of
groundwater (Subba Rao et al. 1998; Graniel et al. 1999;
Umar and Sami Ahmad 2000; Guler et al. 2002; Guler and
Thyne 2004; Elango et al. 2003; Krishnakumar 2004; Je-
evanandam et al. 2006; Ravikumar et al. 2009, 2010;
Aghazadeh and Mogaddam 2011; Hamzaoui-Azaza et al.
2011, 2012; Ketata et al. 2011). The development of
groundwater resources in these arid and semi-arid regions
is a sensitive issue, and careful management is required to
avoid water-quality degradation (Al-Bassam and Al-Ru-
mikhani 2003; Al-Shaibani 2008; Dassi et al. 2005; Dassi
2010; Trabelsi et al. 2005, 2007).
In Tunisia, the gradient of average annual rainfall
decreases from north to south from approximately 1,300 to
\200 mm. In fact, in the northern Tunisia, freshwater of
dams are used for agricultural and domestic needs, while in
southern Tunisia, surface waters are limited and water
resources are based on groundwater of variable quality. As
part of Southern Tunisia, the Gabes-north region has a
semi-arid climate with very irregular rainfall, which makes
the groundwater resources quite fragile.
The Djeffara aquifers of the northern Gabes are well
known by their groundwater potential and their artesian
conditions. Recently, confining pressure was dramatically
reduced due to overexploitation in agricultural and indus-
trial purposes. This region has major difficulties in man-
aging its water resources, which are in decline, especially
since, for the last decades, the scarcity of groundwater.
This work represents a first attempt for the establishment
of a comprehensive study in the area. It also intends to
characterize the main factors and mechanisms controlling
the chemistry and to assess the quality of groundwater with
references to its suitability to drinking and irrigation.
Further, water quality parameters were compared with the
international standards (WHO 1996a, b, 2004) and to
Wilcox (1955) and US Salinity (Richards 1954) diagrams
were also prepared for the study of irrigation water quality.
Description of the study area
The deep Djeffara aquifers of the northern Gabes are
located in south-eastern Tunisia and have an extension of
1,000 km2 comprising 36 km along the coast and are
positioned approximately between the longitudes UTM
X1 = 550,000 and X2 = 610,000 and latitudes UTM
Y1 = 3740,000 and Y2 = 3780,000. The study area is
limited by Zemlet El Beıdha Mountain in the north,
Mediterranean Sea coast in the east, El Hamma faults to the
west. The southern limit consists in Jebel Raguba, Jebel
Monncef and Jebel Sidi Saleh (Fig. 1a). As representing a
part of the Djeffara coastal plain of Tunisia, the region has
undergone an arid to semi-arid climate changes marked by
seasonal contrasting climatic variables. Also the area is
influenced by dry/hot and humid air masses coming
respectively from the desert and from the Mediterranean
Sea (Kallel 2003). The rainfall average is approximately
180 mm/year. However, the monthly average temperature
ranges between 12 �C in winter (January) and 28 �C in
3388 Environ Earth Sci (2014) 71:3387–3421
123
Page 3
Fig. 1 a Geologic map of the study area (after Abbes et al. 1986 and Ghanmi et al. 1984) and b schematic hydrogeological cross section in the
studied area along the transect AA0 (position marked in geological map)
Environ Earth Sci (2014) 71:3387–3421 3389
123
Page 4
summer (August), and the average annual temperature is
20 �C. The precipitation period in a typical year varies
between October and March with the dry period extending
from April to September. The potential evapotranspiration
estimated by Thornthwaite method is very high
(2,800 mm/year) and largely exceeds the rainfall. This
situation makes the groundwater resources quite delicate.
The wadis of Gabes region have an intermittent flow
regime, because the dry season is typically very long
(6–8 months/year). The main wadis in the north Gabes are
the El Hamma wadi, El Melah wadi, Gabes wadi and El
Akarit wadi, which receive many important flow tributar-
ies, in particular from the Dahar, Er Ragouba, Monncef and
Dissa mountains in the south of the study area and the
Koudiat El Hmmeımet and Zemlet Beıdha mountains in the
north. Surface water resources are insufficient for current
domestic, industrial and agricultural needs of the region
and therefore the groundwater constitutes the main water
resource in southern Tunisia.
The Djeffara plain hosts a large number of wells with
depths varying from 200 to 550 m. Most of these wells,
which tap the multilayered confined aquifer of Gabes-
north, contain dolomites and limestones of the Turonian
and Lower Senonian, and fine to gravel grained sandstones
of the Miocene. Some of the hydraulic deep wells are used
for drinking purposes (7 %), only few for chemical
industry (9 %), and approximately 84 % of the water is
used for irrigation. Consequently, groundwater constitutes
the main water resource in southern Tunisia. In 2008, the
total water extraction in this aquifer is estimated by the
local water authorities in Hamma–Chennchou and northern
Gabes is 18 and 50 million m3/year (Fig. 2a, b), respec-
tively (DGRE 2008). These exploitation rates, which are
required to meet the increasing demands of the current
agricultural practices, exceed the natural replenishment
(30.5 Mm3/year, OSS 2003) of these basins and had led to
depletion of the groundwater resources and degradation of
their quality. The conditions in this aquifer system were
originally artesian with numerous springs occurring across
the plain (Fig. 2c, d). Actually, 96 of deep wells were
drilled to meet the rapid growing demand for water. This
over-pumping of the Djeffara aquifers has resulted in
water-level declines ranging from 0.25 to 1 m/year during
the past three decades (Abidi 2004).
Geological and hydrogeological settings
A representative west–east cross section of the study area is
shown in Fig. 1b. The regional geology has been discussed
by several authors (Busson 1970; Abdeljaouad 1983;
Bouaziz 1995; Abbes et al. 1986). From a geological point
of view (Fig. 3), the investigated area is characterized by
outcrops ranging from the Lower Cretaceous to Quaternary
units and by lateral lithostratigraphic variations, with an
unconformity from Palaeocene to Oligocene. The catch-
ment area consists of limestone, dolomite, gypsum, halite,
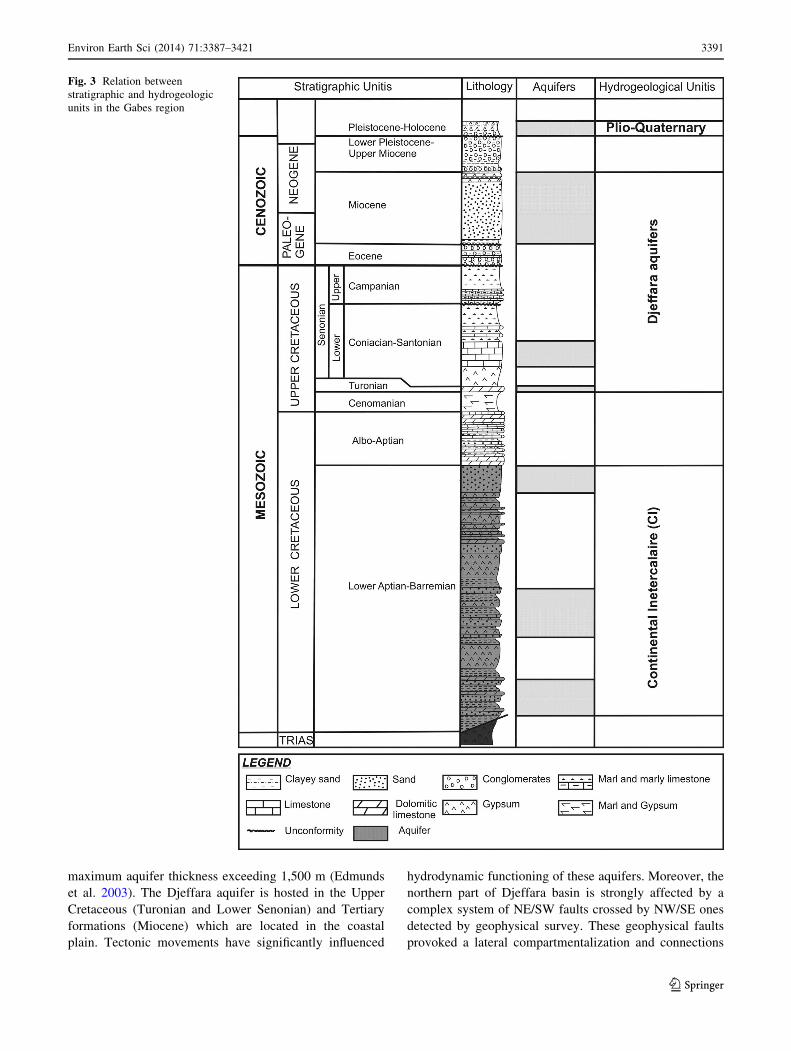
clayey sand and conglomerates (Fig. 3).
The relation between stratigraphic and hydrogeologic
units is presented in Fig. 3. As shown in Figs. 1b and 3, the
CI aquifer is situated within the continental formations of
the Lower Cretaceous (Neocomian, Barremian, Aptian and
Albian) which is located to the west of the study region.
The aquifer is formed by a complex succession of clastic
sediments, differentiated into several units of detrital sed-
iments and separated by clay-rich strata, with the
Fig. 2 a, b Parts of exploitation
with pumping and artesianism
(wells and springs) and c,
d exploitation rates evolution of
the Djeffara aquifers in El
Hamma–Chennchou and
northern Gabes (1950–2008)
3390 Environ Earth Sci (2014) 71:3387–3421
123
Page 5
maximum aquifer thickness exceeding 1,500 m (Edmunds
et al. 2003). The Djeffara aquifer is hosted in the Upper
Cretaceous (Turonian and Lower Senonian) and Tertiary
formations (Miocene) which are located in the coastal
plain. Tectonic movements have significantly influenced
hydrodynamic functioning of these aquifers. Moreover, the
northern part of Djeffara basin is strongly affected by a
complex system of NE/SW faults crossed by NW/SE ones
detected by geophysical survey. These geophysical faults
provoked a lateral compartmentalization and connections
Fig. 3 Relation between
stratigraphic and hydrogeologic
units in the Gabes region
Environ Earth Sci (2014) 71:3387–3421 3391
123
Page 6
between different aquiferous horizons. This is the case in
the El Hamma–Chennchou where a hydraulic continuity
between the Continental Intercalaire and the Djeffara
aquifers has been recognized.
In the northern part of the basin (Djeffara of northern
Gabes and El Hamma–Chennchou), Cretaceous and ter-
tiary formations are characterized by lateral variation in
depths and thickness. Moreover, in Zemlet el Beıda
Mountain, Cenomanian and Turonian deposits are missing
(Fig. 1a). Stratigraphic gaps in these areas reflect several
factors such as the irregularity of the paleotopography,
eustatic movements and tectonic instabilities (Castany
1954; Bouaziz 1995).
The Djeffara aquifer system is characterized by large
changes in facies both in the vertical and lateral directions,
and thickness of water-bearing horizons. In the north of
Gabes, Djeffara waters are mainly hosted in the Miocene
continental deposits with clays and sandy intercalation
produced after the post-Cretaceous erosion (Bouaziz 1995;
Benton et al. 2000). The thickness of these sand deposits
increases from east (30 m) to west ([80 m). They are
characterized by coarse and fine grain size. Permeability of the
Miocene horizon ranges from 2 9 10-5 to 3 9 10-4 m/s,
while transmissivities obtained from pumping tests ranges
from 3 to 33.8 9 10-3 m2/s (Mekrazi 1975).
The principal aquifer of Gabes is hosted in the Senonian
horizon represented by two stratigraphic units. The first one
constitutes a fractured limestone horizon with a thickness
of approximately 200 m, and the second is formed by marl and
gypsum characterized by variable thickness up to 500 m.
These water-bearing formations are strongly fissured, with
the transmissivity ranging from 0.9 to 345 9 10-3 m2/s
(Mamou 1990).
The Turonian carbonates constitute the principal aquifer
formation in Hamma–Chennchou region. The aquifer
consists of dolomites and fissured limestones, whose
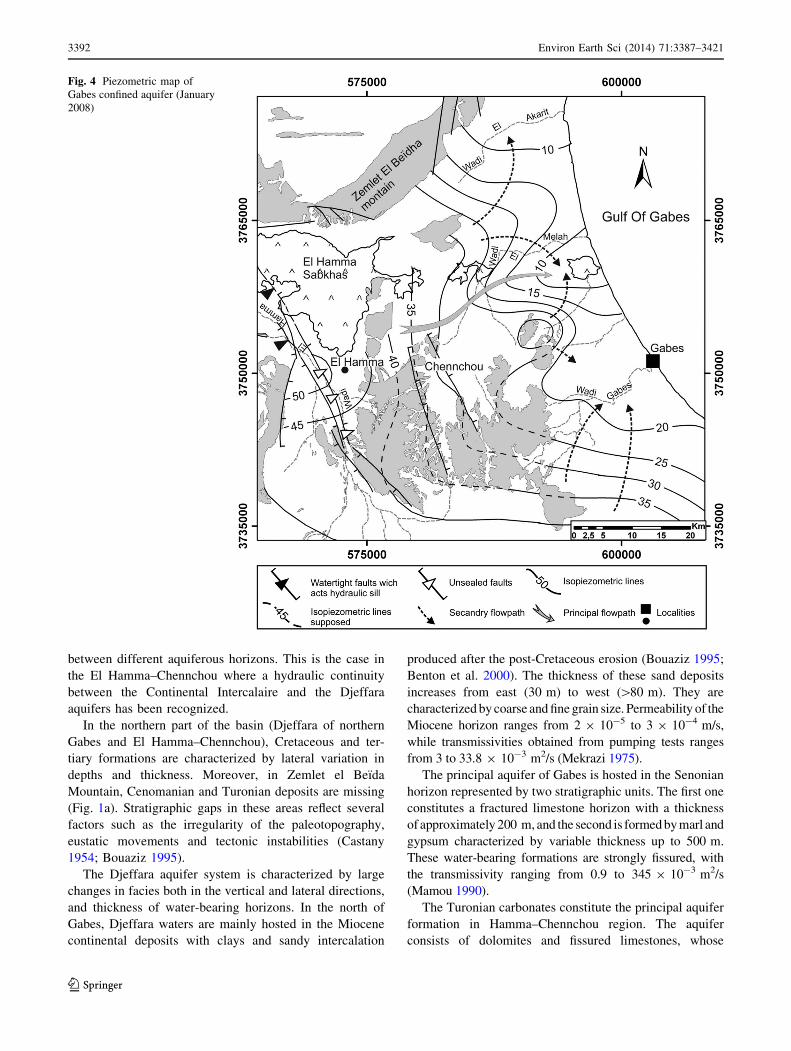
Fig. 4 Piezometric map of
Gabes confined aquifer (January
2008)
3392 Environ Earth Sci (2014) 71:3387–3421
123
Page 7
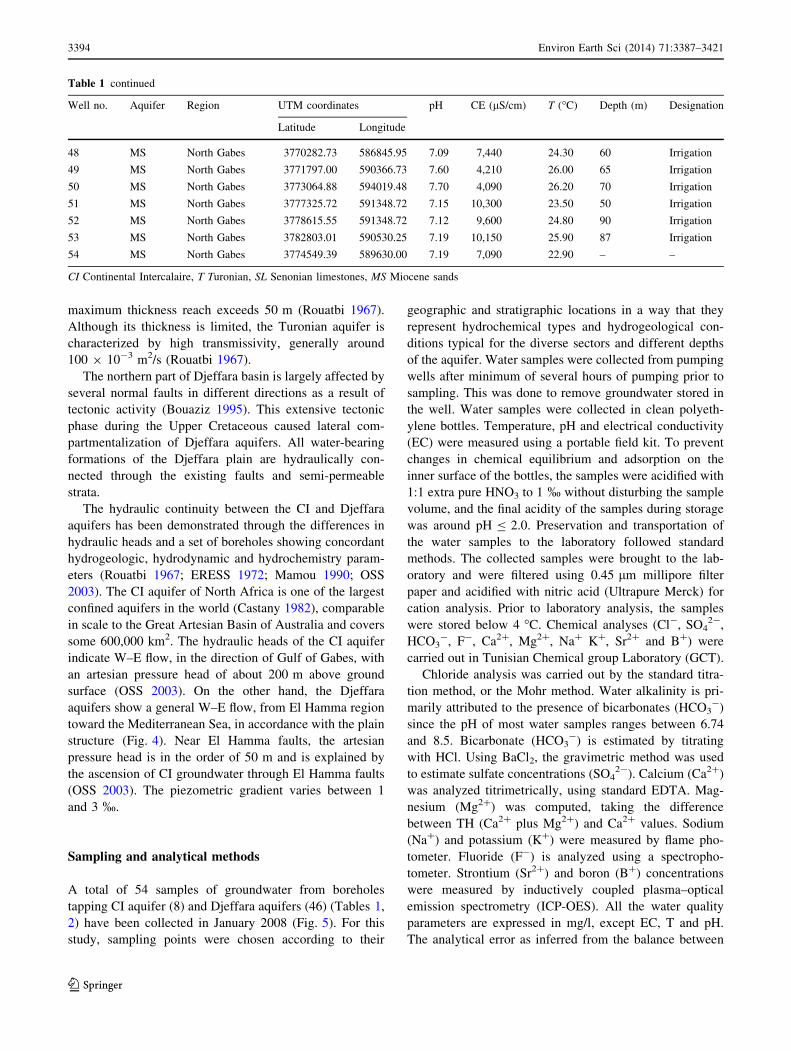
Table 1 Physicochemical parameters of groundwater
Well no. Aquifer Region UTM coordinates pH CE (lS/cm) T (�C) Depth (m) Designation
Latitude Longitude
1 CI Chott El Fejej 3753294.31 558921.54 7.46 3,680 57.30 744 Drinking
2 CI Chott El Fejej 3750547.02 558439.24 7.70 3,750 64.20 856 Drinking
3 CI Chott El Fejej 3750999.02 557636.00 7.76 4,500 57.70 862 Drinking
4 CI Chott El Fejej 3749981.98 563686.23 7.76 4,450 65 791 Drinking
5 CI Chott El Fejej 3752232.87 564503.26 7.74 4,420 64.50 757 Drinking
6 CI Chott El Fejej 3750365.60 553031.00 8.07 4,090 62.00 1,395 Irrigation
7 CI El Hamma 3751526.87 576907.74 8.40 6,250 62.00 1,306 Irrigation
8 CI North Gabes 3757330.31 590198.00 8.5 10,500 62 1,922 Irrigation
9 T El Hamma 3742494.83 570400.17 8.30 5,700 62.00 171 Irrigation
10 T El Hamma 3746146.72 572058.74 6.74 5,870 65.20 516.75 Irrigation
11 SL El Hamma 3751210.37 574246.21 7.43 6,770 29.40 44.8 Irrigation
12 SL El Hamma 3747174.46 574888.63 7.21 5,430 62.00 90 Irrigation
13 SL El Hamma 3749806.95 574086.00 7.08 6,940 40.70 135 Drinking
14 SL Chennchou 3751557.22 580569.24 7.14 5,150 56.70 48 Irrigation
15 SL Chennchou 3750565.69 581326.73 7.05 6,660 35.70 40 Irrigation
16 SL Chennchou 3750787.86 582396.00 7.19 5,230 45.00 42 Irrigation
17 SL Chennchou 3749412.25 586331.11 7.27 6,610 30.50 40 Irrigation
18 SL Sabkhet Melah 3759054.41 588710.01 7.29 8,320 24.90 44.4 Irrigation
19 SL Sabkhet Melah 3757451.11 586454.70 7.29 13,648 23.80 88 Irrigation
20 SL Sabkhet Melah 3755712.92 586206.30 7.71 6,620 24.60 45 Irrigation
21 SL Sabkhet Melah 3755692.99 584191.86 7.80 7,290 26.30 77 Irrigation
22 SL North Gabes 3749488.90 590381.77 7.80 7,700 26.30 272 Irrigation
23 SL North Gabes 3746378.00 602068.28 7.18 6,130 35.10 137 Irrigation
24 SL North Gabes 3743905.33 588721.59 7.24 8,060 33.40 168 Irrigation
25 SL North Gabes 3747483.05 596280.31 7.22 7,210 28.10 49 Irrigation
26 SL North Gabes 3744396.27 602974.85 7.20 6,500 25.60 138 Drinking
27 SL North Gabes 3748336.62 599884.46 7.10 6,590 33.50 117 Irrigation
28 SL North Gabes 3749642.03 599723.81 7.23 3,783 25.80 105 Irrigation
29 SL North Gabes 3751014.70 597835.92 7.16 7,240 29.80 88.28 Drinking
30 SL North Gabes 37550789.25 600268.17 7.07 5,830 32.60 120 Irrigation
31 SL North Gabes 3750268.22 596697.71 7.20 4,700 18 71 Irrigation
32 SL North Gabes 3754762.17 596343.34 7.21 5,800 28.70 67.5 Irrigation
33 SL North Gabes 7558154.18 595854.71 7.42 6870 25.60 87 Irrigation
34 SL North Gabes 3757792.95 594204.71 7.41 6,040 25.10 56 Irrigation
35 MS North Gabes 3758160.74 597328.62 7.38 5,000 24.30 80 Irrigation
36 MS North Gabes 3754967.07 598536.64 7.18 4,750 28.90 76 Irrigation
37 MS North Gabes 3758062.08 591527.87 7.45 5,650 24.30 57.07 Irrigation
38 MS North Gabes 3761018.25 589086.73 7.18 6,270 21.00 65 Irrigation
39 MS North Gabes 3761922.63 589712.00 7.38 5,740 23.30 80 Irrigation
40 MS North Gabes 3764775.09 593482.27 7.21 7,210 23.60 150 Irrigation
41 MS North Gabes 3762655.31 592265.07 7.14 7,610 24.00 81.5 Irrigation
42 MS North Gabes 3762655.31 592265.07 7.43 7,140 24.80 65 Irrigation
43 MS North Gabes 3764165.57 595220.69 7.12 5,600 24.00 65 Irrigation
44 MS North Gabes 3766599.17 595488.41 7.29 5,560 22.90 80 Irrigation
45 MS North Gabes 3761800.90 585356.28 7.10 5,100 23.00 60 Irrigation
46 MS North Gabes 3768185.11 590834.63 7.36 5,900 25.20 52.2 Irrigation
47 MS North Gabes 3769367.35 586238.15 7.13 9,600 24.40 50 Irrigation
Environ Earth Sci (2014) 71:3387–3421 3393
123
Page 8
maximum thickness reach exceeds 50 m (Rouatbi 1967).
Although its thickness is limited, the Turonian aquifer is
characterized by high transmissivity, generally around
100 9 10-3 m2/s (Rouatbi 1967).
The northern part of Djeffara basin is largely affected by
several normal faults in different directions as a result of
tectonic activity (Bouaziz 1995). This extensive tectonic
phase during the Upper Cretaceous caused lateral com-
partmentalization of Djeffara aquifers. All water-bearing
formations of the Djeffara plain are hydraulically con-
nected through the existing faults and semi-permeable
strata.
The hydraulic continuity between the CI and Djeffara
aquifers has been demonstrated through the differences in
hydraulic heads and a set of boreholes showing concordant
hydrogeologic, hydrodynamic and hydrochemistry param-
eters (Rouatbi 1967; ERESS 1972; Mamou 1990; OSS
2003). The CI aquifer of North Africa is one of the largest
confined aquifers in the world (Castany 1982), comparable
in scale to the Great Artesian Basin of Australia and covers
some 600,000 km2. The hydraulic heads of the CI aquifer
indicate W–E flow, in the direction of Gulf of Gabes, with
an artesian pressure head of about 200 m above ground
surface (OSS 2003). On the other hand, the Djeffara
aquifers show a general W–E flow, from El Hamma region
toward the Mediterranean Sea, in accordance with the plain
structure (Fig. 4). Near El Hamma faults, the artesian
pressure head is in the order of 50 m and is explained by
the ascension of CI groundwater through El Hamma faults
(OSS 2003). The piezometric gradient varies between 1
and 3 %.
Sampling and analytical methods
A total of 54 samples of groundwater from boreholes
tapping CI aquifer (8) and Djeffara aquifers (46) (Tables 1,
2) have been collected in January 2008 (Fig. 5). For this
study, sampling points were chosen according to their
geographic and stratigraphic locations in a way that they
represent hydrochemical types and hydrogeological con-
ditions typical for the diverse sectors and different depths
of the aquifer. Water samples were collected from pumping
wells after minimum of several hours of pumping prior to
sampling. This was done to remove groundwater stored in
the well. Water samples were collected in clean polyeth-
ylene bottles. Temperature, pH and electrical conductivity
(EC) were measured using a portable field kit. To prevent
changes in chemical equilibrium and adsorption on the
inner surface of the bottles, the samples were acidified with
1:1 extra pure HNO3 to 1 % without disturbing the sample
volume, and the final acidity of the samples during storage
was around pH B 2.0. Preservation and transportation of
the water samples to the laboratory followed standard
methods. The collected samples were brought to the lab-
oratory and were filtered using 0.45 lm millipore filter
paper and acidified with nitric acid (Ultrapure Merck) for
cation analysis. Prior to laboratory analysis, the samples
were stored below 4 �C. Chemical analyses (Cl-, SO42-,
HCO3-, F-, Ca2?, Mg2?, Na? K?, Sr2? and B?) were
carried out in Tunisian Chemical group Laboratory (GCT).
Chloride analysis was carried out by the standard titra-
tion method, or the Mohr method. Water alkalinity is pri-
marily attributed to the presence of bicarbonates (HCO3-)
since the pH of most water samples ranges between 6.74
and 8.5. Bicarbonate (HCO3-) is estimated by titrating
with HCl. Using BaCl2, the gravimetric method was used
to estimate sulfate concentrations (SO42-). Calcium (Ca2?)
was analyzed titrimetrically, using standard EDTA. Mag-
nesium (Mg2?) was computed, taking the difference
between TH (Ca2? plus Mg2?) and Ca2? values. Sodium
(Na?) and potassium (K?) were measured by flame pho-
tometer. Fluoride (F-) is analyzed using a spectropho-
tometer. Strontium (Sr2?) and boron (B?) concentrations
were measured by inductively coupled plasma–optical
emission spectrometry (ICP-OES). All the water quality
parameters are expressed in mg/l, except EC, T and pH.
The analytical error as inferred from the balance between
Table 1 continued
Well no. Aquifer Region UTM coordinates pH CE (lS/cm) T (�C) Depth (m) Designation
Latitude Longitude
48 MS North Gabes 3770282.73 586845.95 7.09 7,440 24.30 60 Irrigation
49 MS North Gabes 3771797.00 590366.73 7.60 4,210 26.00 65 Irrigation
50 MS North Gabes 3773064.88 594019.48 7.70 4,090 26.20 70 Irrigation
51 MS North Gabes 3777325.72 591348.72 7.15 10,300 23.50 50 Irrigation
52 MS North Gabes 3778615.55 591348.72 7.12 9,600 24.80 90 Irrigation
53 MS North Gabes 3782803.01 590530.25 7.19 10,150 25.90 87 Irrigation
54 MS North Gabes 3774549.39 589630.00 7.19 7,090 22.90 – –
CI Continental Intercalaire, T Turonian, SL Senonian limestones, MS Miocene sands
3394 Environ Earth Sci (2014) 71:3387–3421
123
Page 9
Ta
ble
2C
hem
ical
and
irri
gat
ion
wat
erq
ual
ity
par
amet
ers
of
the
anal
yze
dg
rou
nd
wat
ersa
mp
les
Wel
l
no
.
TD
S
(mg
/l)
Cl-
(mg
/l)
SO
42-
(mg
/l)
HC
O3-
(mg
/l)
Ca2
?
(mg
/l)
Mg
2?
(mg
/l)
Na?
(mg
/l)
K?
(mg
/l)
F (mg
/)
B (mg
/l)
Sr2
?
(mg
/l)
Sr2
?/C
a2?
(%)
Gro
up
TH
(mg
/l)
SA
R%
Na
(%)
RS
BC
(meq
/l)
RS
C
(meq
/l)
PI
(%)
12
,94
08
39
92
59
23
60
70
54
04
30
.96
0.3
24
5.0
8G
RI
1,1
86
.97
6.8
25
0.8
6-
16
.46
-2
2.2
25
1.1
8
22
,76
06
46
1,0
60
12
23
60
72
41
03
40
.57
0.3
45
.08
GR
I1
,19
5.2
05
.16
43
.88
-1
5.9
6-
21
.89
45
.20
33
,18
06
65
1,2
96
11
64
28
74
47
24
10
.83
0.4
95
5.3
4G
RI
1,3
73
.23
5.5
44
3.9
8-
19
.46
-2
5.5
44
4.7
0
43
,30
09
81
1,1
21
12
24
00
74
54
04
50
.56
0.5
24
4.5
7G
RI
1,3
03
.31
6.5
14
8.5
7-
17
.96
-2
4.0
54
9.1
4
53
,00
18
15
1,0
64
11
03
76
70
52
04
30
.57
0.4
34
4.8
7G
RI
1,2
26
.92
6.4
64
9.1
3-
16
.96
-2
2.7
24
9.6
9
62
,73
67
20
1,0
26
98
35
27
74
68
42
0.5
50
.34
45
.20
GR
I1
,19
5.8
05
.89
47
.24
-1
5.9
6-
22
.29
47
.72
73
,60
01
,09
91
,23
41
40
48
06
96
80
70
0.5
90
.65
65
.72
GR
I1
,48
2.5
07
.68
51
.38
-2
1.6
6-
27
.33
51
.00
87
,75
02
,41
41
,99
21
89
48
49
62
,04
76
8–
––
–G
RI
1,6
03
.59
22
.23
73
.89
-2
1.0
5-
28
.95
73
.94
93
,10
06
41
1,4
76
13
44
08
65
58
56
80
.59
0.4
45
5.6
1G
RI
1,2
86
.25
7.0
95
1.3
5-
18
.16
-2
3.5
15
0.9
4
10
3,1
20
86
01
,04
31
40
40
08
24
95
68
0.7
20
.44
55
.72
GR
I1
,33
6.2
35
.89
46
.51
-1
7.6
6-
24
.41
46
.14
11
4,2
80
1,3
94
1,2
70
17
14
60
98
72
07
41
.41
.45
8.3
28
.27
GR
II1
,55
1.8
97
.95
51
.66
-2
0.1
5-
28
.21
51
.39
12
3,2
40
88
31
,13
21
34
38
87
94
97
68
0.5
70
.42
55
.89
GR
I1
,29
3.9
26
.01
47
.40
-1
7.1
6-
23
.67
46
.96
13
3,5
95
97
51
,20
81
53
50
08
45
85
76
0.6
10
.57
65
.49
GR
I1
,59
4.1
66
.37
46
.18
-2
2.4
4-
29
.35
45
.64
14
3,1
00
84
91
,05
71
34
38
48
64
87
68
0.6
70
.52
55
.96
GR
I1
,31
2.7
45
.85
46
.57
-1
6.9
6-
24
.04
46
.13
15
4,3
70
1,3
38
1,4
54
15
35
96
13
25
72
36
2.1
0.7
6.5
4.9
9G
RI
2,0
31
.39
5.5
23
8.8
3-
27
.23
-3
8.0
93
9.8
6
16
3,4
90
63
31
,35
01
53
42
88
44
85
32
0.7
80
.67
7.4
8G
RII
1,4
14
.38
5.6
14
3.6
4-
18
.85
-2
5.7
64
5.2
0
17
3,6
00
87
01
,26
01
53
42
88
65
60
34
0.7
50
.67
7.4
8G
RII
1,4
22
.61
6.4
64
6.9
8-
18
.85
-2
5.9
34
8.3
5
18
5,1
76
2,2
75
2,2
73
18
37
02
34
58
80
80
2.1
21
29
.60
GR
III
3,1
72
.57
6.7
93
8.8
3-
32
.03
-6
0.4
23
8.5
7
19
10
,10
03
,64
72
,35
01
46
46
02
50
2,5
30
21
52
.32
.12
39
.92
GR
III
2,1
77
.37
23
.58
72
.61
-2
0.5
6-
41
.13
70
.20
20
3,8
68
1,3
75
1,4
39
17
15
16
15
06
20
40
21
.95
5.5
0G
RI
1,9
05
.70
6.1
84
2.3
3-
22
.95
-3
5.2
94
3.3
5
21
4,2
48
1,5
15
1,6
10
79
57
61
52
67
37
02
.11
.71
29
.53
GR
III
2,0
63
.75
6.4
44
2.9
2-
27
.45
-3
9.9
64
2.0
7
22
3,3
56
66
71
,39
21
46
44
01
06
43
02
81
.10
.78
8.3
2G
RII
1,5
34
.87
4.7
73
8.7
3-
19
.56
-2
8.2
94
0.4
3
23
2,8
44
52
51
,26
01
52
37
21
10
40
02
61
.20
.65
8.4
1G
RII
1,3
81
.53
4.6
83
9.5
2-
16
.07
-2
5.1
24
1.5
5
24
3,5
80
82
31
,37
11
28
40
01
03
49
54
00
.81
0.8
78
.01
GR
II1
,42
2.6
55
.71
44
.20
-1
7.8
6-
26
.34
45
.08
25
3,0
48
67
41
,12
51
46
32
01
51
42
52
40
.97
0.7
57
.14
GR
II1
,42
0.4
14
.90
40
.19
-1
3.5
7-
26
.00
42
.18
26
2,8
00
55
31
,15
91
52
29
61
20
46
03
11
.20
.65
7.7
2G
RII
1,2
32
.91
5.7
04
5.7
4-
12
.28
-2
2.1
54
7.5
1
27
2,7
36
53
91
,22
91
58
30
81
22
43
22
81
.20
.65
7.4
3G
RII
1,2
71
.11
5.2
74
3.4
0-
12
.78
-2
2.8
24
5.4
3
28
3,0
16
57
51
,29
21
65
33
61
27
42
83
11
.20
.66
8.1
7G
RII
1,3
61
.60
5.0
44
1.6
0-
14
.06
-2
4.5
14
3.4
6
29
3,1
60
63
91
,38
01
46
34
01
27
44
82
81
.10
.57
68
.07
GR
II1
,37
1.5
95
.26
42
.40
-1
4.5
7-
25
.02
44
.18
30
3,0
68
56
81
,36
71
52
34
01
25
41
22
01
0.6
68
.07
GR
II1
,36
3.3
64
.85
40
.32
-1
4.4
7-
24
.76
42
.68
31
3,0
82
61
01
,30
51
46
32
01
10
40
02
81
.90
.65
7.1
5G
RII
1,2
51
.69
4.9
24
1.9
6-
13
.57
-2
2.6
34
3.9
3
32
3,2
88
69
51
,31
11
52
36
41
22
45
03
41
.80
.76
7.5
4G
RII
1,4
10
.94
5.2
14
1.9
9-
15
.67
-2
5.7
14
3.4
9
33
4,1
12
1,0
08
1,5
27
14
64
48
13
96
68
41
1.7
0.9
88
.17
GR
II1
,69
0.6
47
.07
47
.08
-1
9.9
6-
31
.40
47
.90
34
3,5
60
85
21
,45
21
40
36
01
44
56
03
61
.20
.77
8.8
9G
RII
I1
,49
1.4
86
.31
45
.85
-1
5.6
7-
27
.52
46
.97
35
3,2
76
68
81
,30
01
46
36
81
15
49
62
71
.90
.55
6.2
2G
RI
1,3
92
.12
5.7
84
4.4
2-
15
.97
-2
5.4
34
6.1
6
Environ Earth Sci (2014) 71:3387–3421 3395
123
Page 10
Ta
ble
2co
nti
nu
ed
Wel
l
no
.
TD
S
(mg
/l)
Cl-
(mg
/l)
SO
42-
(mg
/l)
HC
O3-
(mg
/l)
Ca2
?
(mg
/l)
Mg
2?
(mg
/l)
Na?
(mg
/l)
K?
(mg
/l)
F (mg
/)
B (mg
/l)
Sr2
?
(mg
/l)
Sr2
?/C
a2?
(%)
Gro
up
TH
(mg
/l)
SA
R%
Na
(%)
RS
BC
(meq
/l)
RS
C
(meq
/l)
PI
(%)
36
2,9
98
67
41
,20
61
65
36
09
64
33
24
1.6
0.6
56
.35
GR
I1
,29
3.9
65
.24
42
.89
-1
5.2
6-
23
.16
45
.20
37
3,5
48
78
11
,49
01
46
36
01
15
51
03
41
.30
.77
8.8
9G
RII
I1
,37
2.1
55
.99
45
.64
-1
5.5
7-
25
.03
47
.02
38
3,6
40
92
31
,30
61
71
42
01
08
60
04
21
.20
.77
7.6
2G
RII
1,4
93
.16
6.7
54
7.6
2-
18
.15
-2
7.0
44
8.7
2
39
3,3
94
81
61
,32
51
53
38
09
84
93
38
1.2
0.6
78
.43
GR
II1
,35
2.1
35
.83
45
.30
-1
6.4
5-
24
.52
46
.59
40
4,1
20
1,1
36
1,4
00
15
34
20
14
47
50
39
1.3
0.6
77
.62
GR
II1
,64
1.3
08
.05
50
.58
-1
8.4
5-
30
.30
51
.50
41
4,4
00
1,2
50
1,4
94
15
34
64
12
08
60
41
1.3
0.8
98
.87
GR
III
1,6
52
.41
9.2
05
3.7
7-
20
.65
-3
0.5
25
4.5
5
42
4,1
08
1,0
65
1,5
73
15
34
40
12
56
90
31
1.7
0.9
99
.80
GR
III
1,6
13
.06
7.4
74
8.8
4-
19
.45
-2
9.7
35
0.1
2
43
3,3
12
71
01
,40
01
71
36
01
15
44
32
41
.70
.76
7.6
2G
RII
1,3
72
.15
5.2
04
2.0
0-
15
.16
-2
4.6
24
4.2
7
44
3,1
76
63
91
,42
11
71
35
61
15
41
52
31
.60
.74
.97
6.3
9G
RI
1,3
62
.16
4.8
94
0.6
1-
14
.96
-2
4.4
24
3.0
1
45
5,4
40
1,0
30
1,0
50
17
33
92
11
54
50
28
2.3
2.2
6.4
87
.56
GR
II1
,45
2.0
55
.14
41
.11
-1
7.3
3-
26
.79
42
.73
46
3,3
30
78
41
,10
01
53
30
01
67
47
05
02
.11
.65
6.0
2G
RI
1,4
36
.31
5.3
94
3.0
3-
12
.46
-2
6.2
04
3.6
9
47
5,6
15
1,9
80
1,7
50
15
46
12
15
51
,04
92
72
.32
.11
39
.91
GR
III
2,1
65
.99
9.8
05
1.6
7-
28
.34
-4
1.1
05
2.5
7
48
4,6
88
1,7
50
1,6
98
15
36
80
15
07
62
24
2.1
1.5
12
9.4
6G
RII
I2
,31
5.2
16
.89
42
.16
-3
1.4
2-
43
.77
43
.39
49
3,0
16
1,7
81
1,2
39
13
4.2
60
41
46
65
01
42
.84
2.3
5.2
37
.87
GR
II2
,10
8.9
86
.16
40
.43
-2
7.9
4-
39
.95
42
.03
50
3,1
20
67
41
,18
81
46
.43
16
15
84
39
12
1.1
41
5.9
38
.58
GR
II1
,43
9.2
25
.03
40
.26
-1
3.3
7-
26
.37
42
.85
51
5,7
35
1,9
06
1,6
90
15
35
12
20
61
,17
04
62
.41
.31
08
.93
GR
III
2,1
26
.15
11
.04
55
.04
-2
3.0
4-
39
.99
55
.49
52
5,4
45
1,7
02
1,7
25
16
54
76
21
11
,03
83
32
.51
.39
.59
.12
GR
III
2,0
56
.84
9.9
55
2.7
8-
21
.05
-3
8.4
15
3.7
2
53
5,3
82
1,6
68
1,7
31
15
34
76
21
61
,01
62
82
.31
.41
09
.65
GR
III
2,0
77
.41
9.6
95
1.9
4-
21
.24
-3
9.0
25
2.9
6
54
4,1
88
1,0
65
1,5
73
15
94
16
15
46
90
23
1.6
0.7
88
.80
GR
III
1,6
72
.46
7.3
44
7.7
7-
18
.15
-3
0.8
24
9.3
9
%N
ap
erce
nt
sod
ium
,S
AR
sod
ium
abso
rpti
on
rati
o,
RS
BC
resi
du
also
diu
mb
icar
bo
nat
e,R
SC
resi
du
also
diu
mca
rbo
nat
e,P
Ip
erm
eab
ilit
yin
dex
3396 Environ Earth Sci (2014) 71:3387–3421
123
Page 11
cations (Ca2?, Mg2?, Na?, K?, Sr2? and B?) and anions
(HCO3-, Cl-, SO4
-2 and F-) is observed to be within the
stipulated limit of ±5 % (Mandel and Shiftan 1981).
Table 1 presents the groundwater characteristics data for
sampling campaign during January 2008. Each parameter
was compared to the standard desirable limit of that
parameter stipulated for drinking water as prescribed by the
WHO (1996a, b, 2004) for drinking and public health
purposes.
The total hardness (TH) in ppm (Todd 1980; Hem 1985;
Ragunath 1987) was determined by the following Eq. 1:
TH ¼ 2:497 Ca2þ þ 4:115 Mg2þ ð1Þ
where the concentrations of Ca2? and Mg2? are repre-
sented in mg/l.
The development and maintenance of successful irri-
gation projects not only supply irrigation water to the land
but also control salt and alkali in the soil (Haritash et al.
2008). Salinity and indexes such as sodium absorption ratio
(SAR), sodium percentage (%Na), residual sodium
carbonate (RSC), residual sodium bicarbonate (RSBC) and
permeability index (PI) are important parameters for
determining the suitability of groundwater for agricultural
uses (Srinivasa Gowd 2005; Raju 2007). The sodium
adsorption ratio (SAR) values were calculated for each
well by the following equation given by Richards (1954):
SAR ¼ Na=½ðCaþMgÞ=2�1=2 ð2Þ
where the concentrations are expressed in meq/l.
The sodium percentage (%Na) was calculated using the
formula given below (Todd and Mays 2005):
%Na ¼ ðNaþ þ KþÞ � 100=ðCa2þ þMg2þ þ Naþ þ KþÞð3Þ
where all ionic concentrations are expressed in meq/l.
The RSC index is calculated by the following equation
(Ragunath 1987):
RSC ¼ ðCO2�3 þ HCO�3 Þ � ðCa2þ þMg2þÞ ð4Þ
where concentrations are reported in meq/l.
Fig. 5 Sampling wells’ network
Environ Earth Sci (2014) 71:3387–3421 3397
123
Page 12
The RSBC, as defined by Gupta and Gupta (1987), is
calculated by the following equation.
RSBC ¼ ðHCO�3 � Ca2þÞ ð5Þ
where concentrations are expressed in meq/l.
The permeability index (PI), as defined by Doneen
(1964) and Ragunath (1987), is calculated by the following
equation:
Fig. 6 Iso-concentration maps showing spatial variation in a temperature (�C), b pH, c electrical conductivity (lS/cm), d total dissolved salts
(mg/l) and e total hardness in the deep Djeffara aquifers
3398 Environ Earth Sci (2014) 71:3387–3421
123
Page 13
PI ¼ [([Naþ� þ ½HCO�3 �1=2Þ� � 100=ðNaþ þ Ca2þ
þMg2þ þ KþÞ ð6Þ
where all the ions are expressed in meq/l.
Results and discussion
In situ measurements interpretation
The groundwater samples belonging to the CI system are
characterized by elevated temperatures that range between
57.3 and 65 �C (Table 1) indicating that the water in these
wells is derived from the main horizons of the CI forma-
tions, as indicated in the cross section shown in Fig. 1b,
without any significant leakage from the overlaying strata.
The temperature of the Djeffara groundwater is widely
varying, from 18 to 65.20 �C, independently of the bore-
hole depth. The water temperature is higher (between 35
and 65 �C) in the tectonic zones of El Hamma and Chen-
nchou regions, which points to some inflow of groundwater
from the CI aquifer through the existing normal faults
(Fig. 6a). The lowest values of temperature (lower than
35 �C), probably due to the influence of the atmosphere,
characterize the shallowest wells (Table 1).
The values of pH of the CI groundwater samples range
from 7.46 to 8.5 with an average of 7.92. However, in the
Djeffara aquifers, pH values range from 6.74 to 8.3
(Fig. 6b; Table 1) with an average of 7.29. This shows that
the groundwater of the study area is generally neutral.
According to the WHO (2004), the range of desirable pH
values of water prescribed for drinking purposes is 6.5–9.2.
There are no water samples with pH values outside of the
desirable ranges.
The measured conductivity of CI groundwater samples
ranges from 3,680 to 10,500 lS/cm (Table 1), while the
corresponding values for the Djeffara aquifers vary
between 3,783 and 13,648 lS/cm (Fig. 6c). The large
variation in EC is mainly attributed to geochemical pro-
cesses prevailing in this region. The spatial distributions of
the EC, the TDS and major ions over the study area are
somewhat similar. They show an increase from the
mountainous regions (recharge areas) toward Sabkhas area.
The highest values were measured in the Miocene sands in
the northern part of Gabes region and in the Senonian
limestone of the El Hamma region and Ouedref-El Metouia
Graben. These high conductivity measurements are corre-
lated with the high total mineralization which varies largely
between 2,800 and 10,100 mg/l.
The total dissolved solid (TDS) of the Continental In-
tercalaire groundwater ranges from 2,760 to 7,750 and
2,736 to 10,100 mg/l in Djeffara aquifers (Fig. 6d;
Table 1). In Djeffara aquifers, this variation conforms
partially with the main groundwater flow directions, indi-
cating that the groundwater salinity is someway controlled
by the residence time in the aquifer. Indeed, in the El
Hamma region, high salinities (TDS higher than 4,000 mg/
l) appear near El Hamma sebkha which relatively disturbs
the evolution of the mineralization in the direction of the
groundwater flow. This sudden increase of groundwater
salinity suggests an influence of the high saline waters
originating from El Hamma sabkhas. The increase of
salinity (TDS exceeds 5,000 mg/l) in some points located
in Ouedref-El Metouia and the El Meıda grabens is due to
the influence of highly saline waters originating from El
Hamma and Melah-M’Khcherma sebkhas and interaction
with evaporitic formations outcrops in Koudiat El
Hmmeımet and Zemlet El Beıdha mountain.
The high salinity of Miocene sand aquifer in the north of
Gabes increases through time (Mamou 1990). This can be
explained by the high groundwater extraction rates leading
to the formation of depression cone, which facilitates the
leakage of saline water from local shallow saline drainage
aquifer formed by return flow irrigation. The lowest values
of salinity are measured in the Djeffara aquifers of the
south part of the study area. This low salinity value (lower
than 3,500 mg/l) reveals the dilution of the groundwater by
the recharge coming from the fissured carbonate formation
outcrops between El Hamma and Gabes.
The TDS in water is represented by the weight of resi-
due left when a water sample has evaporated to dryness
(Bahar and Reza 2009). The analytical results have been
evaluated to ascertain the suitability of groundwater of the
study area for drinking, by comparing with the specifica-
tions of TDS set to the standard guideline values as rec-
ommended by the WHO (1993). According to WHO
specification, water containing \500 mg/l of dissolved
solids is suitable for domestic use. Water containing more
than 1,500 mg/l is maximum permissible (Table 3). Water
containing more than 1,500 mg/l of dissolved solids is
likely to contain enough of certain constituents to cause
noticeable taste or make the water undesirable or unsuit-
able for drinking. Based on this classification, all ground
water samples exceed the maximum allowable limits and
thus indicate the unsuitability of water for drinking pur-
poses (Table 3).
To ascertain the suitability of groundwater for any
purposes, it is essential to classify the groundwater
depending on their hydrochemical properties based on their
TDS values (Davis and DeWiest 1966; Freeze and Cherry
1979), which are presented in Table 4. According to Freeze
and Cherry (1979), the groundwater of the area is of
brackish water type for all samples of CI groundwater and
for 97.83 % of Djeffara aquifers, except for one sample
from Djeffara aquifers that represents saline water type.
Davis and DeWiest (1966) have also classified
Environ Earth Sci (2014) 71:3387–3421 3399
123
Page 14
groundwater on the basis of TDS such as values up to
500 mg/l render the water desirable for drinking, whereas
values ranging from 500 to 1,000 mg/l render the water
permissible for drinking. Hence, classification of the
groundwater of the study area based on TDS (Davis and
DeWiest 1966) has been presented in Table 4. Based on
this classification, all groundwater samples exceed the
permissible limit for drinking.
The hardness values range from 1,187 to 1,603.59 mg/l
with an average of 1,427.29 mg/l in the CI groundwater
and from 1,233 to 3,173 mg/l with an average of 1,600 mg/
l in the Djeffara aquifers (Fig. 6e; Table 5). Cation con-
centrations and ratios can trace water–rock interaction
processes, such as mineral weathering and cation exchange
(Han et al. 2009). In determining the suitability of
groundwater for domestic and industrial purposes, some
chemical analyses are made. The presence of carbonates
and bicarbonates indicates temporary hardness; sulfates
and chlorides of calcium and magnesium indicate perma-
nent hardness. Temporary hardness is due to the presence
of bicarbonates of calcium and magnesium and can be
removed by boiling, whereas permanent hardness is
attributed to other salts such as sulfate and chloride salts,
which cannot be removed by boiling. Despite all these
problems, hard water is not considered to be a health
hazard. However, water hardness of more than 200 mg/l
causes noticeable taste or makes the water undesirable or
unsuitable for drinking and scale formation (ACF 1996).
Water hardness has no known adverse effects; however, it
causes more consumption of detergents at the time of
cleaning, and some evidences indicate its role in heart
disease (Schroeder 1960).
The classification of groundwater based on total hard-
ness (Sawyer and McMcartly 1967) shows that all of the
groundwater samples fall in the very hard water category
(Table 6). The maximum allowable limit of TH for
drinking is 500 mg/l and the most desirable limit is
100 mg/l as per the WHO international standard. In CI
groundwater and Djeffara aquifers, 100 % of samples
exceed permissible limit (Table 6). Groundwater exceed-
ing the limit of 300 mg/l is considered to be very hard
(Sawyer and McMcartly 1967). In our study, the classifi-
cation of groundwater based on TH shows that all of the
groundwater samples fall in the very hard water category
(Table 6). Indeed, hardness values of all samples derived
from the CI groundwater and Djeffara aquifers were found
to be above the specified safe limit and cannot be used for
domestic proposes because it coagulates soap lather. Also,
waters are characterized by high concentrations of calcium,
magnesium, sulfate and chloride. Hydrogenocarbonate
anions are at a limited concentration which is, however,
sufficient for the formation of large quantifies of scale:
40–50 tons per year for each well (Rosset et al. 1999).
Major elements geochemistry
In Djeffara aquifers, concentration of sodium and chloride
varies, respectively, between 432 and 2,530, and 539 and
3,647 mg/l, during the considered period (Table 5). The
concentration of sodium and chloride varies, respectively,
between 410 and 2,074, and 646 and 2,414 mg/l in the CI
groundwater. Na? has different roles in the human body. It
plays an important role in the function of the nervous system,
membrane system, and excretory system (Ketata et al. 2011).
According to the WHO guidelines, the maximum admissible
limit for drinking water is 200 mg/l. In the study area, all
groundwater samples exceed the maximum permissible limit
for drinking water (Table 3). The chloride ion concentration
in groundwater of the study area exceeds the maximum per-
missible limit for drinking water of 600 mg/l (Table 3) in
almost all samples collected from CI groundwater and
Djeffara aquifers. For both Na? and Cl-, the highest con-
centration levels characterize the wells situated to the north
part (11, 18, 19, 20, 21, 47, 48, 49, 51, 52 and 53) of the
Djeffara aquifers, whereas the lowest ones characterize the
wells situated to the south part (23, 26, 27, 28, 30 and 31). The
spatial distribution of chloride and sodium concentrations
illustrates a similar evolution as the salinity; they both
decrease in the direction of the groundwater flow (Fig. 7a, b).
Chloride and sodium are influenced by the contributions of
water of the CI groundwater in El Hamma–Chennchou region
(Na? and Cl- concentrations can reach, respectively, 680 and
1,099) and intrusion of salt water from sabkhas.
Ca2? concentration ranged between 300 and 702 mg/l in
Djeffara aquifers (Table 5). It varied from 352 to 702 mg/l
in CI groundwater. Such concentrations of calcium have no
hazardous effect on human health. Knowing that the
maximum permissible limit of calcium concentration set by
the WHO for drinking water was specified as 200 mg/l
(Table 3), it is observed that all of CI groundwater and
Djeffara aquifer samples showed higher Ca2? concentra-
tion than the permissible limit. The most elevated values
were measured in wells 15, 18, 20, 21, 47, 48 and 49, F8,
while the lowest levels were recorded in the well 26. The
spatial distribution of calcium concentrations (Fig. 7c)
decreased in the direction of groundwater flow, confirming
the dominant influence of the infiltration waters charged in
calcium (by change of the chalky and gypseous formations
of Cretaceous). Calcium concentration is also influenced by
the contribution of water of the CI groundwater in Ham-
ma–Chennchou region (Ca2? concentration vary between
352 and 480 m) and intrusion of salt water from sabkhas.
Magnesium concentration was found to be in the range
of 65–345 and 69–96 mg/l for the studied samples col-
lected from the Djeffara aquifers and CI groundwater,
respectively (Table 5). In the Djeffara aquifers, 20 % of
the samples exceeded the permissible limit of 150 mg/l,
3400 Environ Earth Sci (2014) 71:3387–3421
123
Page 15
while all the CI groundwater samples showed a magnesium
concentration within the permissible limit for drinking
water (Table 3). The higher values were recorded for wells
18, 19, 20, 21, 46, 47, 48, 49, 50, 51, 52, 53 and 45,
whereas the lower ones were recorded for wells 9, 10, 12,
13 and 16. The spatial distribution of Mg2? correlates with
the distribution of Ca2?, decreasing in the direction of the
groundwater’s flow (Fig. 7d). Calcium and magnesium
ions present in groundwater are particularly derived from
leaching of limestone, dolomites, gypsum and anhydrites,
whereas the calcium ions are also derived from cation
exchange process (Garrels 1976; Haritash et al. 2008).
The carbonate and bicarbonate concentrations in
groundwater are derived from carbonate weathering as well
as dissolution of carbonic acid in the aquifers (Jeevanan-
dam et al. 2006; Kumar et al. 2009). The contents in
HCO3- of the Djeffara aquifers of the northern Gabes vary
from 79 to 183 mg/l (Table 5), with a maximum recorded
for wells 18 and 45. It varied from 92 to 189 mg/l in the CI
groundwater. As per the WHO guidelines, all samples
show a bicarbonate concentration within the permissible
limit of 240 mg/l for drinking water (Table 3, WHO 2004).
Maps representing spatial distribution for bicarbonates
concentrations (Fig. 7e) show a significant similar
Table 3 Groundwater samples of the study area exceeding the permissible limits prescribed by WHO (1996a, b, 2004) for drinking purposes
Water quality
parameter
WHO (2004) Number of samples
exceeding PL
Samples exceeding
PL (%)
Undesirable
effects
Desirable
limit (DL)
Maximum
permissible
limit (PL)
CI
groundwater
Djeffara
aquifer
CI
groundwater
Djeffara
aquifer
pH 7–8.5 9 – – – – Taste
CE (lS/cm) 500 1,500 5 5 100 100 Gastrointestinal irritation
TDS (mg/l) 500 1,500 5 5 100 100 Gastrointestinal irritation
TH (mg/l) 100 500 5 5 100 100 Scale formation
Cl- (mg/l) 200 600 5 5 100 100 Salty taste
SO42- (mg/l) 200 400 5 5 100 100 Laxative effects
HCO3- (mg/l) 240 – – – – –
Ca2? (mg/l) 75 200 5 5 100 100 Encrustations in water
structure
Mg2? (mg/l) 50 150 – 1 – 20 Scale formation
Na? (mg/l) – 200 5 5 100 100 Scale formation
K? (mg/l) – 12 5 5 100 100 Bitter taste
F- (mg/l) – 1.5 – 1 – 20 Dental fluorosis
B? (mg/l) – 0.5 1 5 20 100 –
Sr2? (mg/l) – 0.5 5 5 100 100 –
Table 4 Groundwater classification based on TDS (Davis and DeWiest 1966 and Freeze and Cherry 1979)
TDS (mg/l) Classification Number of samples Percentage of samples
CI groundwater Djeffara aquifers CI groundwater Djeffara aquifers
Davis and DeWiest (1966)
500 Desirable for drinking – – – –
500–1,000 Permissible for drinking – – – –
1,000–3,000 Useful for irrigation 3 4 37.5 8.7
\3,000 Unfit for drinking and irrigation 5 42 62.5 91.3
Freeze and Cherry (1979)
\1,000 Fresh water type – – – –
1,000–10,000 Brackish water type 8 45 100 97.83
10,000–100,000 Saline water type – 1 – 2.17
[100,000 Brine water type
Environ Earth Sci (2014) 71:3387–3421 3401
123
Page 16
evolution as Ca2? with a reduction of the contents in the
direction of the groundwater’s flow.
Concentrations of K are relatively low compared to the
concentrations of other cations, with values varying
between 12 and 215 mg/l (Table 5). It varied from 34 to
70 mg/l in the CI groundwater. As per the WHO guide-
lines, all the CI groundwater and Djeffara aquifer samples
exceed this permissible limit of 12 mg/l (Table 3). The
highest concentrations have been recorded for boreholes 18
and 19. The maps elaborated here (Fig. 7) show that the
concentration of potassuim are simular to those of salinity,
chloride, sodium and calcium. Low concentrations of
potassium in these waters would originate from alteration
of the silicates which have low solubility rates. Potassium
Table 5 Statistical summary of drinking water quality parameters determined in 10 groundwater samples of CI and Djeffara aquifers
Aquifer Minimum Mean Maximum Standard deviation
Parameters Units CI Djeffara CI Djeffara CI Djeffara CI Djeffara
(a) Drinking water
pH 7.46 7.06 7.68 7.18 7.76 7.36 0.12 0.11
CE lS/cm 3,680 5,900 4,160 6,776 4,500 7,240 407.98 555.09
TDS mg/l 2,760 2,840 3,036.2 3,409 3,300 4,120 210.38 482.73
T �C 57.30 23.60 61.72 30.56 64.90 40.70 3.86 6.87
Cl- mg/l 646 539 789.2 814.6 981 1,136 137.72 243.28
SO42- mg/l 925 1,100 1,093.2 1,263.4 1,296 1,400 134.3 125.70
HCO3- mg/l 92 146 112.4 152.6 122 158 12.44 4.27
Ca2? mg/l 360 300 384.8 373.6 428 500 29.17 85.11
Mg2? mg/l 70 84 72 128.8 74 167 2 30.60
Na? mg/l 410 432 496.4 537 540 750 55.72 133.33
K? mg/l 34 28 41.2 44.2 45 76 4.26 19.98
F mg/l 0.56 0.61 0.7 1.26 0.96 2.10 0.18 0.53
B mg/l 0.3 0.57 0.41 0.78 0.52 1.6 0.09 0.45
Sr mg/l 4 4.57 4.2 5.8 5 7 0.44 0.83
Sr2?/Ca2 % 4.57 5.49 4.99 6.98 5.34 8.07 0.28 1.15
TH mg/l 1,187 1,233 1,245.43 1,455.3 1,373.2 1,641.3 79.05 166.32
(b) Irrigation water
pH 8.07 6.74 8.32 7.41 8.5 8.5 0.22 0,267
CE lS/cm 4,090 3,783 4,946.67 6,771.54 10,500 13,648 3,261. 3 1,909.45
TDS mg/l 2,736 2,736 4,695.33 4,097.79 7,750 10,100 2,680.46 1,296.58
T �C 62 18 62 33.63 62 65.2 – 11,47
Cl- mg/l 720 525 1,411 1,151.56 2,414 3,647 889 615,78
SO42- mg/l 1,026 1,026 1,417.33 1,438.37 1,992 2,350 508.42 276,69
HCO3- mg/l 98 79 142.33 151.30 189 189 14.03 16,99
Ca2? mg/l 352 308 438.66 434.44 484 702 45.54 98,27
Mg2? mg/l 69 65 80.66 128.18 96 345 13.86 51,56
Na? mg/l 680 400 1,065 711.2 2,047 2,530 857 361,79
K? mg/l 42 12 60 43.86 70 215 15.62 32,59
F mg/l 0.55 0.34 0.57 1.45 0.59 2.84 – 0,6
B mg/l 0.34 0.42 0.495 0.94 0.65 2.3 – 0,56
Sr2? mg/l 4 4.97 5 7.35 6 23 – 3,35
Sr2?/Ca2? % 5.20 4.99 5.46 7.89 5.72 9.92 – 1,34
TH mg/l 1,195.8 1,233 1,427.29 1,600 1,603.59 3,173 209.42 400,53
SAR – 5.89 4.68 11.93 7.60 22.23 23.58 8.96 3,112
%Na % 47.24 38.73 57.50 47.23 73.89 73.89 14.32 6,22
RSBC meq/l -21.66 -32.03 -19.56 -19.23 -15.96 -12.78 3.13 4,93
RSC meq/l -28.95 -60.42 -26.19 -29.78 -22.29 -22.29 3.47 7,99
PI % 47.72 38.57 57.55 48.20 73.94 73.94 14. 28 5,59
3402 Environ Earth Sci (2014) 71:3387–3421
123
Page 17
distribution is influenced by the chemical composition of
the waters of infiltration and the waters from the CI
groundwater, and intrusion of salt water from sabkhas.
The sulfate concentration of the waters in the Djeffara
aquifers of the northern Gabes varied between 1,043 and
2,350 mg/l (Table 5). It varied from 925 to 1,992 mg/l in
CI groundwater. Sulfate is unstable if it exceeds the max-
imum permissible limit of 400 mg/l (Table 3) and causes a
laxative effect on humans, together with excess of mag-
nesium in groundwater (Kumar et al. 2007; Arumugam and
Elangovan 2009). This may result in gastrointestinal irri-
tation in the human system. In the study area, all ground-
water samples exceed the maximum permissible limit for
drinking water (Table 3). The highest concentrations were
measured for wells 18, 19, 21, 47, 48, 51, 52 and 53, while
the lowest values are characteristic of wells 10, 14, 45 and
46. Spatial distribution maps show the same evolution with
salinity (Fig. 7g). Since sulfates are the dominant anions,
they control, along with Na?, Ca2? and Cl-, the saline load
of the waters of the Djeffara aquifers.
Water types
The method of geochemical graphic represented by Piper
diagram (Piper 1944) has been widely used in groundwater
studies to characterize a large number of water chemical
data. Piper trilinear diagram was constructed using scien-
tific software to display the relative concentrations of the
different ions from individual water samples from the study
area. This diagram reveals similarities and differences
among groundwater samples because those with similar
qualities will tend to plot together as groups (Todd and
Mays 2005).
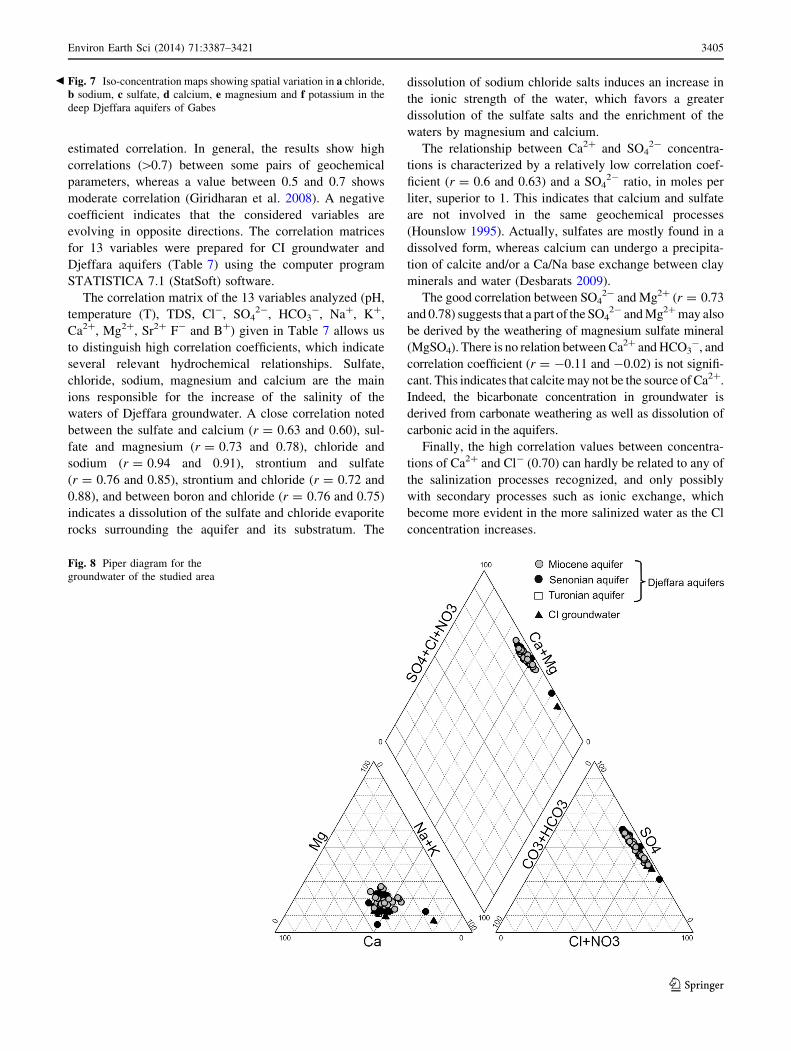
The Piper diagram (Fig. 8) shows similarity in major
cation proportions in the Djeffara aquifers, intermediate
between Na? and Ca2? content. Results of chemical
analyses indicate enrichment in SO42- relative to Cl-,
except of groundwater samples from Senonian limestones
and Miocene sands in Ouedref-El Metouia and El Meıda
grabens, respectively, which are depleted in SO42- with
respect to Cl- ions. Consequently, a Piper diagram shows
that the water facies, in Djeffara aquifers, gradually chan-
ges from the Na–Ca–SO4–Cl type to the Na–Cl–SO4 type
along the flow lines, i.e., from west to east of the study
area.
The Na–Ca–SO4–Cl type (corresponding to wells 9, 10,
14, 16, 22, 23, 24, 25, 26, 27, 28, 29, 30 and 31) occurs
mainly in El Hamma–Chennchou and in the South-eastern
part of the study area. The composition of this type is due
to the mixtures of the two end members: CI water (average
TDS = 3,500 mg/l) and recent recharge water (corre-
sponding to wells 23, 26 and 27; TDS \ 3,000 mg/l) from
the recharge area toward El Hamma and Gabes (Mamou
1990; Trabelsi et al. 2009, 2011).
The Na–Ca–Cl–SO4 and Na–Cl type (which corre-
sponds to wells 11, 18, 19, 20, 21, 47, 48, 49, 51, 52 and
53) waters are highly mineralized and are more influenced
by the chemistry of the rocks with which the waters is
contact. This high salinity level is explained by salt water
intrusion from sabkhas and leakage with underlying aquifer
with evaporite dissolution during fluxes ascent for high
salinity.
Groundwater mineralization processes
In order to highlight different mechanisms that contribute
to groundwater mineralization, principal components
analysis (PCA) has been applied to physicochemical
parameters corresponding to sampling made in January
2008. The chemical composition of the groundwater is
characterized by major cations and anions such as Ca, Mg,
Na, K, Cl, SO4, HCO3, Sr, B and F. The correlation matrix
of physicochemical parameters is reported in Table 7.
Cation concentrations and ratios can trace water–rock
interaction processes, such as mineral weathering, cation
exchange and anthropogenic input in the groundwater
system (Han et al. 2009; Chan 2001).
A correlation analysis is a bivariate method, which
simply exhibits how well one variable predicts the other. In
this study, the relationship between various elements has
been studied using the Spearman rank coefficient, which is
based on the ranking of the data and not on their absolute
values (Kurumbein and Graybill 1965; Kumar et al. 2006,
2007, 2009). The numerical level of the relationships rep-
resented by the coefficient of correlation varies between -
1 and ?1 according to the statistical significance of the
Table 6 Groundwater
classification based on TH
(Sawyer and McMcartly 1967)
Total hardness (TH)
as CaCO3 (mg/l)
Type of water Number of samples Percentage of samples
CI
groundwater
Djeffara
aquifers
CI
groundwater
Djeffara
aquifers
75 Soft – – – –
75–150 Moderately high – – – –
150–300 Hard – – – –
300 Very hard 8 46 100 100
Environ Earth Sci (2014) 71:3387–3421 3403
123
Page 18
3404 Environ Earth Sci (2014) 71:3387–3421
123
Page 19
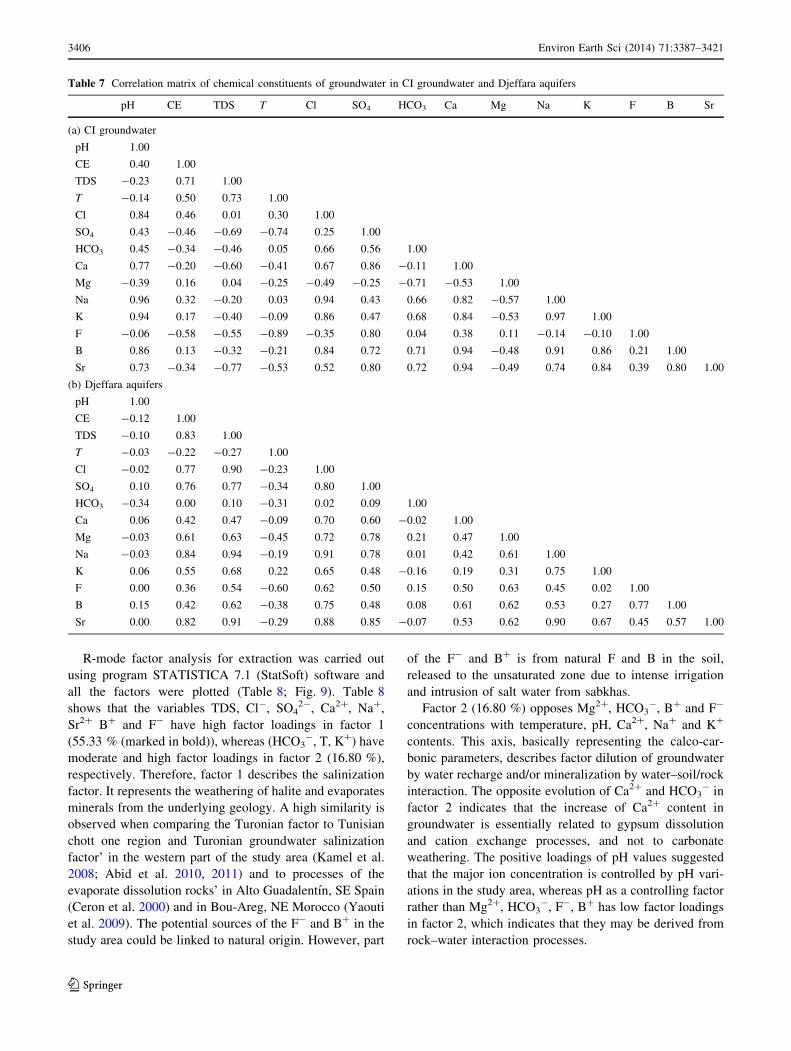
estimated correlation. In general, the results show high
correlations ([0.7) between some pairs of geochemical
parameters, whereas a value between 0.5 and 0.7 shows
moderate correlation (Giridharan et al. 2008). A negative
coefficient indicates that the considered variables are
evolving in opposite directions. The correlation matrices
for 13 variables were prepared for CI groundwater and
Djeffara aquifers (Table 7) using the computer program
STATISTICA 7.1 (StatSoft) software.
The correlation matrix of the 13 variables analyzed (pH,
temperature (T), TDS, Cl-, SO42-, HCO3
-, Na?, K?,
Ca2?, Mg2?, Sr2? F- and B?) given in Table 7 allows us
to distinguish high correlation coefficients, which indicate
several relevant hydrochemical relationships. Sulfate,
chloride, sodium, magnesium and calcium are the main
ions responsible for the increase of the salinity of the
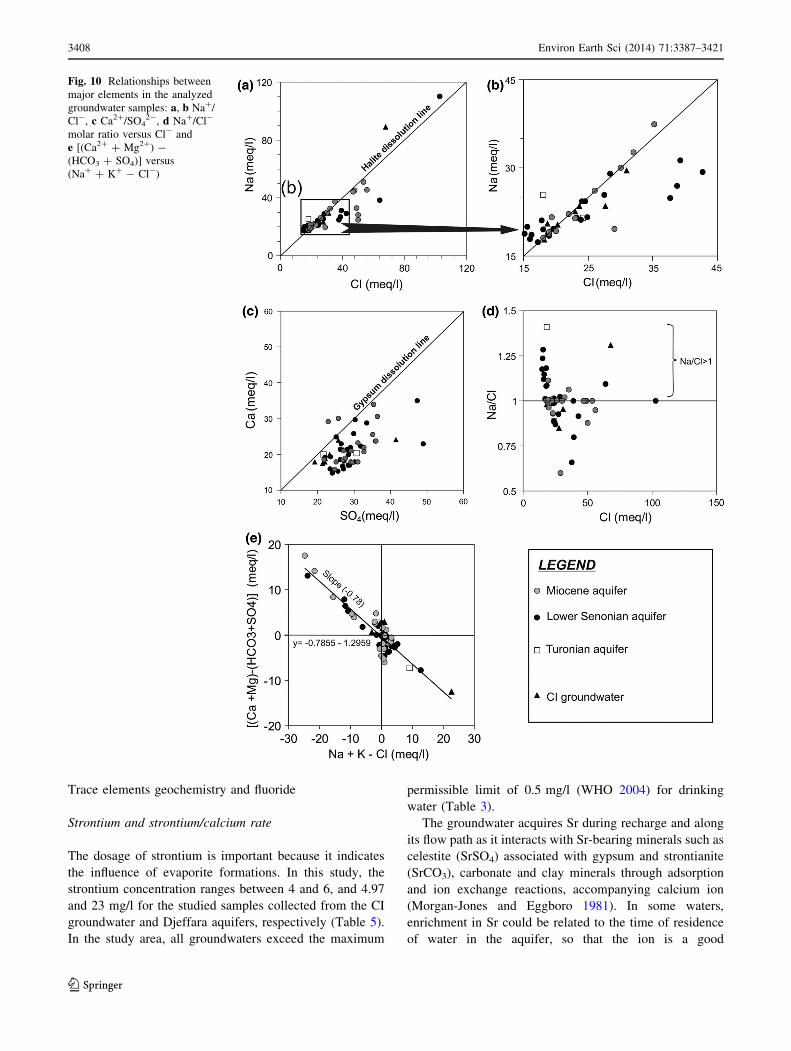
waters of Djeffara groundwater. A close correlation noted
between the sulfate and calcium (r = 0.63 and 0.60), sul-
fate and magnesium (r = 0.73 and 0.78), chloride and
sodium (r = 0.94 and 0.91), strontium and sulfate
(r = 0.76 and 0.85), strontium and chloride (r = 0.72 and
0.88), and between boron and chloride (r = 0.76 and 0.75)
indicates a dissolution of the sulfate and chloride evaporite
rocks surrounding the aquifer and its substratum. The
dissolution of sodium chloride salts induces an increase in
the ionic strength of the water, which favors a greater
dissolution of the sulfate salts and the enrichment of the
waters by magnesium and calcium.
The relationship between Ca2? and SO42- concentra-
tions is characterized by a relatively low correlation coef-
ficient (r = 0.6 and 0.63) and a SO42- ratio, in moles per
liter, superior to 1. This indicates that calcium and sulfate
are not involved in the same geochemical processes
(Hounslow 1995). Actually, sulfates are mostly found in a
dissolved form, whereas calcium can undergo a precipita-
tion of calcite and/or a Ca/Na base exchange between clay
minerals and water (Desbarats 2009).
The good correlation between SO42- and Mg2? (r = 0.73
and 0.78) suggests that a part of the SO42- and Mg2? may also
be derived by the weathering of magnesium sulfate mineral
(MgSO4). There is no relation between Ca2? and HCO3-, and
correlation coefficient (r = -0.11 and -0.02) is not signifi-
cant. This indicates that calcite may not be the source of Ca2?.
Indeed, the bicarbonate concentration in groundwater is
derived from carbonate weathering as well as dissolution of
carbonic acid in the aquifers.
Finally, the high correlation values between concentra-
tions of Ca2? and Cl- (0.70) can hardly be related to any of
the salinization processes recognized, and only possibly
with secondary processes such as ionic exchange, which
become more evident in the more salinized water as the Cl
concentration increases.
Fig. 8 Piper diagram for the
groundwater of the studied area
Fig. 7 Iso-concentration maps showing spatial variation in a chloride,
b sodium, c sulfate, d calcium, e magnesium and f potassium in the
deep Djeffara aquifers of Gabes
b
Environ Earth Sci (2014) 71:3387–3421 3405
123
Page 20
R-mode factor analysis for extraction was carried out
using program STATISTICA 7.1 (StatSoft) software and
all the factors were plotted (Table 8; Fig. 9). Table 8
shows that the variables TDS, Cl-, SO42-, Ca2?, Na?,
Sr2? B? and F- have high factor loadings in factor 1
(55.33 % (marked in bold)), whereas (HCO3-, T, K?) have
moderate and high factor loadings in factor 2 (16.80 %),
respectively. Therefore, factor 1 describes the salinization
factor. It represents the weathering of halite and evaporates
minerals from the underlying geology. A high similarity is
observed when comparing the Turonian factor to Tunisian
chott one region and Turonian groundwater salinization
factor’ in the western part of the study area (Kamel et al.
2008; Abid et al. 2010, 2011) and to processes of the
evaporate dissolution rocks’ in Alto Guadalentın, SE Spain
(Ceron et al. 2000) and in Bou-Areg, NE Morocco (Yaouti
et al. 2009). The potential sources of the F- and B? in the
study area could be linked to natural origin. However, part
of the F- and B? is from natural F and B in the soil,
released to the unsaturated zone due to intense irrigation
and intrusion of salt water from sabkhas.
Factor 2 (16.80 %) opposes Mg2?, HCO3-, B? and F-
concentrations with temperature, pH, Ca2?, Na? and K?
contents. This axis, basically representing the calco-car-
bonic parameters, describes factor dilution of groundwater
by water recharge and/or mineralization by water–soil/rock
interaction. The opposite evolution of Ca2? and HCO3- in
factor 2 indicates that the increase of Ca2? content in
groundwater is essentially related to gypsum dissolution
and cation exchange processes, and not to carbonate
weathering. The positive loadings of pH values suggested
that the major ion concentration is controlled by pH vari-
ations in the study area, whereas pH as a controlling factor
rather than Mg2?, HCO3-, F-, B? has low factor loadings
in factor 2, which indicates that they may be derived from
rock–water interaction processes.
Table 7 Correlation matrix of chemical constituents of groundwater in CI groundwater and Djeffara aquifers
pH CE TDS T Cl SO4 HCO3 Ca Mg Na K F B Sr
(a) CI groundwater
pH 1.00
CE 0.40 1.00
TDS -0.23 0.71 1.00
T -0.14 0.50 0.73 1.00
Cl 0.84 0.46 0.01 0.30 1.00
SO4 0.43 -0.46 -0.69 -0.74 0.25 1.00
HCO3 0.45 -0.34 -0.46 0.05 0.66 0.56 1.00
Ca 0.77 -0.20 -0.60 -0.41 0.67 0.86 -0.11 1.00
Mg -0.39 0.16 0.04 -0.25 -0.49 -0.25 -0.71 -0.53 1.00
Na 0.96 0.32 -0.20 0.03 0.94 0.43 0.66 0.82 -0.57 1.00
K 0.94 0.17 -0.40 -0.09 0.86 0.47 0.68 0.84 -0.53 0.97 1.00
F -0.06 -0.58 -0.55 -0.89 -0.35 0.80 0.04 0.38 0.11 -0.14 -0.10 1.00
B 0.86 0.13 -0.32 -0.21 0.84 0.72 0.71 0.94 -0.48 0.91 0.86 0.21 1.00
Sr 0.73 -0.34 -0.77 -0.53 0.52 0.80 0.72 0.94 -0.49 0.74 0.84 0.39 0.80 1.00
(b) Djeffara aquifers
pH 1.00
CE -0.12 1.00
TDS -0.10 0.83 1.00
T -0.03 -0.22 -0.27 1.00
Cl -0.02 0.77 0.90 -0.23 1.00
SO4 0.10 0.76 0.77 -0.34 0.80 1.00
HCO3 -0.34 0.00 0.10 -0.31 0.02 0.09 1.00
Ca 0.06 0.42 0.47 -0.09 0.70 0.60 -0.02 1.00
Mg -0.03 0.61 0.63 -0.45 0.72 0.78 0.21 0.47 1.00
Na -0.03 0.84 0.94 -0.19 0.91 0.78 0.01 0.42 0.61 1.00
K 0.06 0.55 0.68 0.22 0.65 0.48 -0.16 0.19 0.31 0.75 1.00
F 0.00 0.36 0.54 -0.60 0.62 0.50 0.15 0.50 0.63 0.45 0.02 1.00
B 0.15 0.42 0.62 -0.38 0.75 0.48 0.08 0.61 0.62 0.53 0.27 0.77 1.00
Sr 0.00 0.82 0.91 -0.29 0.88 0.85 -0.07 0.53 0.62 0.90 0.67 0.45 0.57 1.00
3406 Environ Earth Sci (2014) 71:3387–3421
123
Page 21
Several bivariate diagrams of major elements are used to
precisely determine the origins of the referred ions and the
processes that control their concentrations in groundwaters.
The plots of Na? versus Cl- and Ca2? versus SO42-
content (Fig. 10a–c) are shown. The Na?–Cl- relationship
has often been used to identify mechanisms responsible for
the origin of water salinity in arid and semi-arid regions
(Magaritz et al. 1981; Dixon and Chiswell 1992; Sami
1992; Guendouz et al. 2002; Jalali 2009). The relationship
between these two ions shows that the majority of points
cluster along the halite dissolution line (line of slope 1,
Fig. 10a, b). Observed depletion in Cl- content relative to
Na? concentration in some samples probably reflects the
cation exchange reactions leading to adsorption of Ca2? on
clay minerals and simultaneous releasing of Na? ions.
Those samples in which Na?/Cl- molar ratios are higher
than 1 (Fig. 10d) also show a deficit in Ca2? with respect to
SO42- ions (samples located above the line of slope 1,
Fig. 10c). This remains in good agreement with a Ca2?–
Na? cation exchange theory leading to a softening of water
(Hidalgo et al. 1995).
On the other hand, the SO42- versus Ca2? plot
(Fig. 10c) shows a more pronounced loss of Ca2? with
respect to SO42-. This may be the result of calcite pre-
cipitation controlled by gypsum dissolution which tends to
maintain saturation or oversaturation with respect to cal-
cium bearing minerals.
In some samples, a relative depletion of Na? with
respect to Cl- is noted (Fig. 10a, b). This probably reflects
the cation exchange process where Ca2? is removed from
the aquifer exchangers and replaced by Na?. The referred
cation exchange is confirmed through the relation charac-
terized by a slope of -1 traced by the position of the
samples (Garcia et al. 2001). In the absence of this
exchange, all analytical points should lie close to the origin
(McLean et al. 2000). Figure 10e shows the scatter plot for
the relationship, which is characterized by a negative slope
(-0.78), suggesting that cation exchange is probably a
factor in the Djeffara aquifers. Likewise, 31 % of the
samples plot within the negative ordinate and positive
abscissa zone. This implies that Na? and K? are enriched
relative to Ca2? and Mg2? in most of the aquifers. Thus,
the cation exchange sites preferentially adsorb Ca2? and
Mg2? and discharge Na? and K? (direct cationic
exchange). However, 43 % of samples plot within the
positive ordinate and negative abscissa zone. Thus, the
cation exchange sites preferentially adsorb Na? and K?
and discharge Ca2? and Mg2? (reverse cationic exchange).
The rest of the samples (26 %) lie close to the origin
(absence of cationic exchange).
Figure 11 shows the saturation indices of halite, gypsum,
calcite and dolomite, calculated using WATEQ-F computer
code (Plummer et al. 1976), as a function of (Na? ? Cl-),
(Ca2? ? SO42-), (Ca2? ? Mg2? ? HCO3
-) and (Ca2?
? HCO3-), respectively. Results of these calculations
indicate that the water evolves from a state close to under-
saturated with respect to gypsum and halite (Fig. 11a, b) and
saturation with respect to calcite and dolomite toward an
oversaturation (Fig. 11c, d). Once the system is saturated in
calcite, the hydrochemical evolution is affected by the dis-
solution of gypsum. Interaction between groundwater and
the gypsum layer would lead to the dissolution of gypsum
(Qiyan and Baoping 2002). Common-ion effects tend to
increase calcite deposition to keep the balance of calcite
dissolution.
Table 8 Loading for varimax rotated factor matrix of two factors
explaining 72.13 % of the total variance for groundwater system
aquifer
Variable Varifactors
Factor 1 Factor 2
T 0.52 0.72
pH 0.24 0.58
Ca -0.64 0.09
Mg -0.83 -0.25
Na -0.87 0.36
K -0.53 0.67
Cl -0.93 0.26
SO4 -0.89 0.04
HCO3 -0.34 -0.69
Sr -0.92 0.19
F -0.73 -0.45
B -0.78 -0.15
TDS -0.93 0.19
Eigenvalues 7.75 2.35
% Total variance 55.33 16.80
% Cumulative variance 55.33 72.13
Fig. 9 Representation of the principal components of the variables
measured in field samples
Environ Earth Sci (2014) 71:3387–3421 3407
123
Page 22
Trace elements geochemistry and fluoride
Strontium and strontium/calcium rate
The dosage of strontium is important because it indicates
the influence of evaporite formations. In this study, the
strontium concentration ranges between 4 and 6, and 4.97
and 23 mg/l for the studied samples collected from the CI
groundwater and Djeffara aquifers, respectively (Table 5).
In the study area, all groundwaters exceed the maximum
permissible limit of 0.5 mg/l (WHO 2004) for drinking
water (Table 3).
The groundwater acquires Sr during recharge and along
its flow path as it interacts with Sr-bearing minerals such as
celestite (SrSO4) associated with gypsum and strontianite
(SrCO3), carbonate and clay minerals through adsorption
and ion exchange reactions, accompanying calcium ion
(Morgan-Jones and Eggboro 1981). In some waters,
enrichment in Sr could be related to the time of residence
of water in the aquifer, so that the ion is a good
Fig. 10 Relationships between
major elements in the analyzed
groundwater samples: a, b Na?/
Cl-, c Ca2?/SO42-, d Na?/Cl-
molar ratio versus Cl- and
e [(Ca2? ? Mg2?) -
(HCO3 ? SO4)] versus
(Na? ? K? - Cl-)
3408 Environ Earth Sci (2014) 71:3387–3421
123
Page 23
environmental tracer (Brondi et al. 1983). Molar concen-
tration ratio Sr2?/Ca2? is characteristic of evaporitic water
if it is higher than 1 % (Meybeck 1984). Besides, as each
evaporitic set has its own Sr2?/Ca2? ratio value, Sr2? and
Ca2? contents of water that dissolve an evaporitic forma-
tion would enable an identification of underground flow
and a determination of their origin (Hsissou et al. 1996).
Strontium concentrations are relatively high in Djeffara
aquifers, with values varying between 4.97 and 23 mg/l
(Fig. 12a). Thanks to the ratio, different evaporitic origins
can be distinguished (Fig. 13):
In the zone of hydraulic sill in Hamma and Chennchou,
the Sr2?/Ca2? ratio (GRI) varies from 4.97 to 6.5 %,
strontium varies from 4 to 6.5 mg/l, and SO42- contents
range between 1,043 and 1,476 mg/l. In this area, the
mixing process is mainly through the vertical leakage of
the deep Lower Cretaceous groundwater (Sr2?/
Ca2? = 5 %) replenishing the shallow Djeffara aquifers.
In this area, there are some evaporitic layers in Jebel Aziza
and Jebel Ragouba outcropping Cretaceous (Lower Creta-
ceous, Cenomanian and Lower Senonian).
In the eastern part of Chennchou and in coastal plain, the
well waters (GRII) are characterized by a Sr2?/Ca2? ratio
which varies between 6.5 and 8.75 %, strontium varies
between 6 and 8.32 mg/l and sulfates range between 1,050
and 1,400 mg/l. The high concentration of sulfates and
strontium and Sr2?/Ca2? ratio indicate that it is due to the
leaching of Lower Cretaceous evaporites levels and marly
gypsum of Lower Senonian which act as substratum of
sandy Miocene aquifer and limestone of Lower Senonian
aquifer, respectively.
In the northern part of study area, waters (GRIII) show
the highest Sr2?/Ca2? ratios (8.5–9.90), Sr2? contents
varying between 7 and 23 mg/l and SO42- contents ranging
from 1,452 to 2,350 mg/l, are mainly located close to El
Hamma and Melah-M’Khacherma sabkhas. These waters
are distinct from the previous ones. In this zone, the salinity
may have several origins: intrusion of saline water from El
Hamma and Melah-M’khacherma sabkhas and dissolution
of the evaporite formations of Lower Cretaceous and
Lower Senonian which act as substratums of sandy Mio-
cene aquifer and limestone of Lower Senonian aquifer,
Fig. 11 Relationships between
saturation indices and major
elements in the analyzed
groundwater samples: a IS
(Halite)/(Na? ? Cl-), b IS
(gypsum)/Ca2? ? SO42-, c IS
(dolomite)/
Ca2? ? Mg2? ? HCO3- and
d IS (calcite)/Ca2? ? HCO3-
Environ Earth Sci (2014) 71:3387–3421 3409
123
Page 24
respectively in El Meıda and in Ouedref-El Metouia
grabens.
Boron
Boron provides additional information on the groundwater
evolution (Edmunds et al. 2003). High concentrations of
boron sometimes occur in groundwater by anthropogenic
activities (Gimenez and Morell 1992) and interaction with
evaporate levels (Rose et al. 2000; Sanchez-Martos et al.
2002; Hebrard et al. 2006).
The boron concentrations of the waters in the Djeffara
aquifers vary between 0.42 and 2.3 mg/l (Table 5). In the
study area, almost all CI groundwater samples show a
boron concentration within the permissible limit for
drinking, whereas all groundwater from Djeffara aquifers
exceeds this limit (Table 3). The spatial distribution maps
of the boron concentration are similar to those of salinity
and chloride (Fig. 12b).
The boron values are higher near El Hamma and Melah-
M’Khacherma Sabkhas (wells 11, 18, 19, 20, 21, 45, 46,
47, 48, 49, 50, 51, 52 and 53). An increase in B? and Cl-,
simultaneously, in waters in the Ouedref Metouia and
Meıda grabens provides a good indicator for different ori-
gins of dissolved elements and water contributions as the
area of the El Hamma and Melah-M’khacherma Sabkhas.
The increase of boron concentration observed near Koudiat
Fig. 12 Iso-concentration maps showing spatial variation in a strontium, b boron and c fluoride
Fig. 13 Relationships between Sr2?/Ca2? molar ratio and SO42- in
the analyzed groundwater samples
3410 Environ Earth Sci (2014) 71:3387–3421
123
Page 25
El Hmmeımet in some wells (wells 45, 46, 47, 48, 49, 50,
51, 52 and 53) may be related to the thickness of the
aquifer, or the lithological character of the formations in
the recharge area. The B? is probably from the evaporitic
rocks leaching of the Mio-Pliocene and Quaternary for-
mations outcropping in Koudiat El Hmmeımet. In fact, this
part of B? is from natural B in the soil, released to the
unsaturated zone due to intense cultivation in recharge area
of sandy aquifer. The other samples reflecting boron
released from evaporites or syn-depositional clay minerals
are characterized by low TDS values (2,736–3,581 mg/l),
relatively low concentrations of boron (0.42–0.9 mg/l) and
Cl (525–860 mg/l), and high concentrations of SO4
(1,125–1,527 mg/l) and Na? (400–668 mg/l).
Fluoride
Fluoride is one of the main trace elements in groundwater,
which generally occurs as a natural constituent. In fact,
fluoride related to groundwater has been studied inten-
sively during the past decades (Roberston 1986, Zhaoli
et al. 1989; Travi and Faye 1992; Hitchon 1995; Subba
Rao 2003; Coetsiers et al. 2008). These studies show that
fluoride is the result of water–rock interaction and
leaching from minerals in various aquifers with different
lithologies. Bedrocks containing fluoride minerals are
generally responsible for high concentration of fluoride in
groundwater (Handa 1975; Wenzel and Blum 1992;
Bardsen et al. 1996). Subba Rao (2003) found that high
fluoride concentrations in India are related to the evapo-
transpiration, long-term contact of waters in the weath-
ered zone by virtue of its low hydraulic conductivity and
stagnation of water in the aquifer zone caused by intrusive
bodies, intensive and long-term irrigation, and heavy use
of fertilizers.
During January 2008, the concentration of fluoride in the
Djeffara groundwater varies between 0.57 and 2.84 mg/l
(Table 5). The presence of low concentration of fluoride in
majority of wells for drinking water in the study area is of
minor concern, as all the samples are found to have a
fluoride concentration within the permissible limit of
1.5 mg/l for drinking water (Table 3, WHO 2004), except
one sample (sample No. 46).
The spatial distribution of fluorine (Fig. 12c) shows that
the highest concentration levels characterize the wells
located in the northern part of the study area (wells 18, 19,
21, 45, 46, 47, 48, 49, 50, 51, 52, 53), where intense cul-
tivation is applied in the recharge area of sandy aquifer.
These contents decrease in the direction of groundwater
flow. Fluorine may essentially be from a natural origin.
Limestone (chalky) and marly gypsum formations can
contain significant quantities of fluorine which can be lib-
erated by the water–rock interaction. However, a part of the
F- is from natural F in the soil, released to the unsaturated
zone due to intense cultivation.
Irrigation purpose
Quality of groundwater is of paramount importance for
irrigation in arid and semi-arid regions. Crop cultivation
mainly depends on groundwater supply for irrigation in
several arid and semi-arid areas in the world, e.g. in
Tunisia. In fact, the suitability of groundwater for irrigation
depends on the effects of constituent minerals of water on
both the plant and soil. Excessive amounts of dissolved
ions in irrigation water affect plants and agricultural soil,
thus reducing the productivity (Ravikumar et al. 2010). The
high salt content in irrigation water causes an increase in
soil solution osmotic pressure. The chemical composition
is directly affecting either the growth of plants and disrupts
their metabolism. Also, it affects soil structure, perme-
ability and aeration which indirectly affect plant growth.
The important chemical constituents that affect the suit-
ability of water for irrigation are the total concentration of
dissolved salts, concentration of other elements that may be
toxic to plants, relative proportion of bicarbonate to cal-
cium, magnesium and relative proportion of sodium to
calcium (Haritash et al. 2008). Water quality problems in
irrigation include salinity and alkalinity. The important
chemical constituents that affect the suitability of water for
irrigation (Table 9) can be utilized to verify the suitability
as follows:
• Salinity and indexes such as SAR (Eq. 1).
• Sodium hazard expressed as percent sodium of total
cations (%Na, Eq. 2).
• Bicarbonate hazard or (HCO3) concentration as related
to the concentration of calcium and magnesium such as
RSC (Eq. 3) and RSBC (Eq. 4).
• Boron hazard (concentration of boron or other ele-
ments) that may be toxic.
• Permeability index (PI, Eq. 5).
Electrical conductivity
Electrical conductivity is a good measure of salinity hazard
to crops as it reflects the TDS in groundwater. The primary
effect of high EC water on crop productivity is the inca-
pability of the plant to compete with ions in the soil
solution for water. The higher EC, the less water is avail-
able to plants (Tank and Chandel 2009). The US Salinity
Laboratory (1954) classified ground waters on the basis of
electrical conductivity (Table 9). The EC classification
indicates that 33.3 % of CI groundwater and 14.64 % of
Djeffara aquifers are doubtful for irrigation; and for CI
groundwater and Djeffara aquifers, respectively, 66.7 and
Environ Earth Sci (2014) 71:3387–3421 3411
123
Page 26
85.36 % of collected samples are unsuitable for irrigation.
This indicates leaching and dissolution of salts in deep
Djeffara aquifer of Gabes.
Total dissolved solids (TDS)
To ascertain the suitability of groundwater for any pur-
poses, the TDS should be below 500 mg/l (Catroll 1962;
Freeze and Cherry 1979). Based on Freeze and Cherry
(1979), all groundwater samples collected from the CI
groundwater and 97.83 % of those collected from the
Djeffara aquifers are brackish in nature, except one sample
from the Djeffara aquifers showing saline water type
indicating high dissolved load in water (Table 4). Based on
Davis and DeWiest (1966) classification (Table 4), 37.5 %
of groundwater samples collected from the CI groundwater
Table 9 Suitability of groundwater for irrigation based on several classifications
Quality of parameters Range Classification Number of samples Percentage of samples
CI
groundwater
Djeffara
aquifers
CI
groundwater
Djeffara
aquifers
Based on EC (lS/cm) after Wilcox (1955) \250 Excellent – – – –
250–750 Good – – – –
750–2,250 Permissible – – – –
2,250–5,000 Doubtful 1 6 33.3 14.64
[5,000 Unsuitable 2 35 66.7 85.36
Based on Cl- (meq/l) after
Stuyfzand (1989)
\0.14 Extremely fresh – – – –
0.14–0.85 Very fresh – – – –
0.85–4.23 Fresh – – – –
4.23–8.46 Fresh brackish – – – –
8.46–28.21 Brackish 1 24 33.3 58.53
28.21–282.06 Brackish–salt 2 17 66.7 41.47
282.06–564.13 Salt – – – –
[564.13 Hypersaline – – – –
Based on RSC after Richards (1954) \1.25 Good 3 41 100 100
1.25–2.5 Doubtful – – – –
[2.5 Unsuitable – – – –
Based on percent sodium (%Na)
after Wilcox (1955)
0–20 Excellent – – – –
20–40 Good – 4 – 9.75
40–60 Permissible 2 36 66.7 87.8
60–80 Doubtful 1 1 33.3 2.45
Based on alkalinity hazard (SAR)
after Richards (1954)
\10 Low (excellent) 2 39 66.7 95.12
10–18 Medium (good) – 1 – 2.44
18–26 High (doubtful/fair poor) 1 1 33.3 2.44
[26 Very high – – – –
Based on boron (mg/l) after McCarthy and Ellery (1994)
Semi-sensitive crops \0.33 Excellent – – – –
0.33–0.67 Good 3 14 100 34.15
0.67–1 Permissible – 15 – 36.6
1–1.25 Doubtful – – – –
[1.25 Unsuitable – 12 – 29.25
Semi-tolerant and tolerant crops \0.67 Excellent 3 14 100 34.1
0.67–1.33 Good – 17 – 41.5
1.33–2.0 Permissible – 6 – 14.7
2.0–2.5 Doubtful – 4 9.70
Based on permeability index
Ragunath (1987)
\75 Safe – – – –
25–75 Moderate 2 41 100 100
[25 Unsafe – – – –
3412 Environ Earth Sci (2014) 71:3387–3421
123
Page 27
and 8.7 % of those collected from the Djeffara aquifers one
can be used for irrigation purpose. High TDS in most of the
groundwater clearly indicate the unsuitability of ground-
water for irrigation purposes.
Total hardness (TH)
Hard water is a potential problem since the calcium and
magnesium can combine with bicarbonate to form insolu-
ble calcium and magnesium carbonate salts. These salts
can affect media pH and reduce the amount of sodium
available to a plant (Robbins 2010). According to United
States Department of Agriculture method (USDA) speci-
fication of TH, up to 200 mg/l is the upper limit for water
irrigation. The high TH values (Table 4) reveal that all the
sampling sites are unsuitable for irrigation.
Chloride classification
Stuyfzand (1989) classified water on the basis of Cl- ion
concentration into eight divisions as shown in Table 9.
Based on this classification, the groundwater of the area is
of brackish water type for 33.3 % of the CI groundwater
and for 58.53 % of the Djeffara aquifers. The rest of the
samples represent brackish–salt water type.
Sodium adsorption ratio (SAR)
High concentration of sodium in water produces harmful
effects changing soil properties and reducing soil perme-
ability (Kelley 1951; Domenico and Schwartz 1990; Todd
and Mays 2005). Thus, sodium concentration is essential to
classify the water for irrigation purposes. SAR is an
important parameter for determining the suitability of
groundwater for irrigation because it is a measure of alkali/
sodium hazard to crops (Subramani et al. 2005). Indeed, it
indicates the degree of which irrigation water tends to enter
cation exchange reactions in soil. Sodium replacing adsorbed
calcium and magnesium is a hazard causing damage to the soil
structure, making it compact and impervious (Raju 2007).
Based on SAR classification (Richards 1954), it is
observed that 66.7 % of groundwater samples collected
from CI groundwater and 95.12 % of those collected from
the Djeffara aquifers fall into the category of waters
excellent for irrigation purposes in almost all soils
(Table 9, Eq. 2). Therefore, the SAR value implies that
most of the groundwater is suitable for irrigation. The
spatial distribution maps of SAR values in groundwater is
presented in Fig. 14a for the Djeffara aquifers. A more
detailed analysis for the suitability of water for irrigation
can be made by plotting the SAR and electrical conduc-
tivity (Fig. 15) data on the US Salinity Laboratory (USSL)
diagram (Richards 1954).
Based on salinity hazard, the types of water can be
classified as C1, C2, C3, C4 and as S1, S2, S3, or S4 based
on sodium hazard. The significance and interpretation of
quality ratings on the USSL diagram is summarized as: (1)
Low salinity hazard class (C1) can be used for irrigation of
most crops and the majority of soils. However, some
leaching is required, but this occurs under normal irrigation
practices except in soils of extremely low permeability. (2)
Medium salinity hazard class (C2) can be used if a mod-
erate amount of leaching occurs. (3) High salinity hazard
class (C3) is satisfactory for plants having moderate salt
tolerance, on soils of moderate permeability with leaching.
(4) High salinity hazard class (C4), (5) extremely high
salinity water (C5) and (6) water where the salinity hazard
is in excess (C6) cannot be used in soils with restricted
drainage. Even with adequate drainage, special management
for salinity control is required, and crops with good salt tol-
erance should be selected. Such areas need special attention as
far as irrigation is concerned (Ravikumar et al. 2010).
Low sodium water (S1) can be used for irrigation on
almost all soils with little danger of developing harmful
levels of exchangeable Na? (Ketata et al. 2011). Medium
sodium water (S2) presents an appreciable sodium hazard
in certain fine-textured soils, especially poorly leached
soils (Subba Rao 2006). Waters belonging to this class are
classified as excellent for irrigation and can be used safely
on coarse-textured or organic soils having good perme-
ability and may be used to irrigate salt-tolerant and semi-
tolerant crops under favorable drainage conditions. High
sodium waters (S3) are usually doubtful/fair poor for irri-
gation and cannot be used on clayey soils of low perme-
ability. Waters belonging to this class may produce harmful
levels of exchange sodium in most soils and will require
special soils management such as good drainage and
leaching and addition of organic matter. Very high sodium
water (S4) is usually unsuitable for irrigation, except at low
and perhaps medium salinity (Haritash et al. 2008).
USSL diagram
The USDA classification for salinity (C) and sodicity
hazards (S) in the Djeffara aquifers is shown in Table 10
and Fig. 15. All of the wells fall within the very high
salinity hazard zone, which shows a substantial amount of
the total dissolved salts in the water. Following the USDA
classification system, the water from all groundwater
samples fall in the salinity class C4, including all three
sodicity classes. On the other hand, nearly 95 % of the
wells have SAR values below 15, which is of a medium
quality for irrigation waters. The percentage of sodium is
not very high in the groundwater throughout the CI
groundwater and Djeffara aquifers, but the overall salt
contents are very high. The combined EC/SAR
Environ Earth Sci (2014) 71:3387–3421 3413
123
Page 28
classification locates the Gabes water in the C4S2, C4S3
and C4S4 classes with 61.13, 27.27 and 11.5 % of the
wells, respectively. Such water is rated as highly and very
highly saline for irrigation, i.e., not suitable for irrigating
most crops except the tolerant ones. Special measures to
control the salinity hazard are needed, including leaching
and adequate drainage. The sodicity hazard is of less
magnitude, with water from 61.23 % of the wells in the S2
Fig. 14 Iso-concentration maps showing spatial variation in a sodium adsorption ratio, b percent sodium, c carbonate residual sodium
bicarbonate, d residual sodium, e permeability index in the deep Djeffara aquifers of Gabes
3414 Environ Earth Sci (2014) 71:3387–3421
123
Page 29
class, 27.27 % in the S3 class and 11.5 % in the S4 class.
All water from wells may cause infiltration problems,
especially with heavy textured and poorly drained salts.
Water from about 61.23 % of the wells corresponds to
medium sodium water (S2) that may be of an appreciable
sodium hazard in finely textured soils with a high cation
exchange capacity. This water could be used for coarsely
textured soils with good permeability. Water from 38.77 %
of the wells corresponds to water with a high sodium
content that produces harmful levels of exchangeable
sodium in most soils and requires special soil amendments.
From this classification, it is clear that the groundwater in
the Djeffara aquifers is unfit for irrigation.
Percent sodium (%Na)
Sodium content is usually expressed in terms of percentage
of sodium or soluble-sodium percentage (%Na). The per-
cent sodium is calculated by methods of Wilcox (1948) by
Eq. (3). This method has been used to classify and
understand the basic character of the chemical composition
of groundwater. Indeed, the suitability of groundwater for
irrigation depends on the mineralization of water and its
effect on plants and soil.
Based on the percentage of Na as per Wilcox
(Table 11), 66.7 % of CI groundwater is within the per-
missible, whereas 33.3 % is doubtful for irrigation. In the
Djeffara aquifers, 9.75 % of samples are good for irriga-
tion, 87.8 % is within permissible limit, whereas 2.45 % is
doubtful for irrigation. Spatial variation of percentage of
sodium is shown in Fig. 14b for the Djeffara aquifers. The
high percentage of Na in most of the groundwater indicates
its unsuitability for irrigation.
Wilcox (1948) proposed a method for rating irrigation
waters, based on percentage of sodium and electrical
conductivity. The significance and interpretation of quality
ratings based on Wilcox (1948) diagram can be summa-
rized as follows: (1) excellent to good, (2) good to per-
missible, (3) permissible to doubtful, (4) doubtful to
unsuitable and unsuitable. Data of the groundwater samples
of the studied area are summarized in Table 9 and show
that all samples of the Djeffara aquifers fall above the
unsuitable categories indicating their unsuitability for irri-
gation. Indeed, this method is not applicable for the water
of Djeffara aquifers. The norms proposed by Wilcox
(1948) appear very severe for the Djeffara groundwater of
the northern Gabes. When the concentration of Na? is high
in irrigation water, sodium tends to be absorbed by clay
particles, displacing Mg2? and Ca2? ions. This exchange
process of Na? in water for Ca2? and Mg2? in soil reduces
the permeability and eventually results in soil with poor
internal drainage (Subramani et al. 2005; Kumar et al.
2007, Ravikumar et al. 2009). Hence, air and water cir-
culation are restricted during wet conditions and such soil
Fig. 15 Plots of calculated values of SAR and EC of groundwater
samples (after Richards 1954; January 2008)
Table 10 Salinity and alkalinity hazard of irrigation water in US salinity diagram
Classification Type of water Number of samples Percentage of samples Percentage of samples
CI
groundwater
Djeffara
aquifers
CI
groundwater
Djeffara
aquifers
CI groundwater &
Djeffara aquifers
C4S4 SAR very high
EC very high
1 4 33.33 9.75 5 (11.5 %)
C4S3 SAR very high
EC very high
1 11 33.33 26.83 12 (27.27 %)
C4S2 SAR medium
EC very high
1 26 33.33 63.42 27 (61.23 %)
Environ Earth Sci (2014) 71:3387–3421 3415
123
Page 30
is usually hard when dry (Collins and Jenkins 1996; Salesh
et al. 1999).
The morphological study of soils by Hatira et al. (2007)
showed the predominance of fine sand and silt conferring
very important filtering capacity. In this study, all studied
profiles are filled by gypsum. Indeed, concentrations of
gypsum ranged between 2 and 61 %. Also, carbonate of
calcium is present in all studied soils with an average value
of 5.5 %, and more than 10 %. In fact, the soil features are
presently dominated by the evolution of salinization and
water-saturation processes either partially or totally
affecting the soil profile. The visible salt deposits and soil
salinization processes are generated by the salinity of water
irrigation. These processes are strongly influenced by the
weak soil leaching mechanisms, on the one hand, and the
poor drainage schemes, on the other hand.
Residual sodium carbonate
In addition to the SAR and %Na, the excess sum of car-
bonate and bicarbonate in groundwater over the sum of
calcium and magnesium also influences the suitability of
groundwater for irrigation. The RSC was calculated to
determine the hazard effects of carbonate and bicarbonate
on the quality of groundwater for agricultural and irrigation
purposes (Eaton 1950). The excess sum of carbonate
(CO32-) and bicarbonate (HCO3
-) in groundwater over the
sum of calcium (Ca2?) and magnesium (Mg2?) also
influences the suitability of groundwater for irrigation
because in waters having high concentration of bicarbonate
(HCO3-), there is a tendency for calcium and magnesium
to precipitate as the water in the soil becomes more con-
centrated. An excess quantity of sodium bicarbonate and
carbonate is considered to be detrimental to the physical
properties of soils, as it causes dissolution of organic matter
in the soil, which in turn leaves a black stain on the soil
surface on drying (Ravikumar et al. 2010). Therefore, land
irrigated with such water becomes infertile owing to
deposition of sodium carbonate (Eaton 1950).
According to the US Department of Agriculture, waters
having [2.5 (meq/l) RSC are unsuitable for irrigation,
1.25–2.5 are marginal and \1.25 are safe waters. The
increase of RSC in groundwater is significantly harmful for
plant growth (Krishna Kumar et al. 2009). The ground-
water in the study area is classified on the basis of RSC,
and the results are presented in Table 9 for the CI
groundwater and Djeffara aquifers (Fig. 14c). The calcu-
lated values (Ragunath 1987, Eq. 4) reveal that all the
sampling sites are good for irrigation purpose.
Residual sodium bicarbonate
Gupta and Gupta (1987) classified water on the basis of
‘‘RSBC’’. RSBC was calculated for each well by Eq. (5)
given by Gupta and Gupta (1987) and classified as satisfactory
(\5 meq/l), marginal (5–10 meq/l) and unsatisfactory
([10 meq/l). The calculated values (Ragunath 1987; Gupta
and Gupta 1987, Eq. 5) of ‘‘RSBC’’ are presented in Table 5b
for the CI groundwater and Djeffara aquifers.
The RSBC of CI groundwater ranged from -21.66 to
-15.96 meq/l with an average value of -19.56 meq/l and
the corresponding values in Djeffara aquifers (Fig. 14d)
ranged from -32.03 to -12.78 meq/l with an average
-19.23 meq/l (Table 5b). According to the RSBC values,
all groundwater samples collected were found to be satis-
factory (\5 meq/l) according to the criteria set by Gupta
and Gupta (1987). The RSBC values are\5 meq/l and are
therefore considered safe for irrigation purposes.
Boron
Scofield (1936) and McCarthy and Ellery (1994) proposed
a table of permissible boron limits to assess water quality
using five class (1–5) and three levels of crop tolerance
(sensitive, semi-tolerant and tolerant). The proposed limits
of boron concentration in irrigation water and the total
number of groundwater samples of the study area repre-
senting the boron classes are presented in Table 9. Based
on this classification, it is observed that all of groundwater
samples collected from the CI groundwater and 14 samples
(34.15 %) of those collected from the Djeffara aquifers are
found to be excellent for tolerant and semi-tolerant crops
based on boron concentration. However, 15 samples
(36.6 %) and 12 samples (29.25 %) were found to be
permissible and unsuitable for semi-sensitive crops. Three
samples from CI groundwater and 14 samples (34.41 %)
Table 11 Classification of
groundwater (Wilcox)Classification Number of samples Percentage of samples
CI groundwater Djeffara aquifers CI groundwater Djeffara aquifers
Excellent to good – – – –
Good to permissible – – – –
Permissible to doubtful – – – –
Doubtful to unsuitable – – – –
Unsuitable 3 41 100 100
3416 Environ Earth Sci (2014) 71:3387–3421
123
Page 31
from Djeffara aquifers were found to be excellent for semi-
sensitive and tolerant crops. The remaining samples reveal
that 17 samples (41.5 %) were found to be good, and 6
samples (14.7 %) belongs to the permissible category, and
4 samples (9.70 %) fall in the doubtful category for semi-
sensitive and tolerant crops.
Permeability index (PI)
The permeability index also indicates whether groundwater
is suitable for irrigation. The soil permeability is affected
by the long-term use of irrigation water as influenced by
Na?, Ca2?, Mg2? and HCO3- contents of the soil. Doneen
(1964) and Ragunath (1987) used a criterion for assessing
the suitability of water for irrigation based on permeability
index and accordingly, water can be classified as class I, II
and III. Class I and II water are categorized as good for
irrigation with 75 % or more of maximum permeability.
Class III water is unsuitable with 25 % of maximum
permeability.
The PI of CI groundwater ranges from 47.72 to 73.94 %
with an average value of 57.55 % and the corresponding
values (Table 5b) in Djeffara aquifers ranged from 38.57 to
73.94 % with an average of 48.20 % (Table 5b; Fig. 14e).
According to the permeability index values, all of
groundwater samples comes under class II (Table 9), sug-
gesting the suitability of groundwater for irrigation. The
calculated values reveal that all the sampling sites are good
for irrigation purpose.
Conclusion
The Djeffara aquifer system is one of the most important
groundwater resources in Tunisia. It is the main water
source for the local population and agriculture needs.
Therefore, deciphering the mechanisms responsible for
observed chemistry and assessing the water quality in this
system, pursued in the framework of this study, are of great
practical importance. Simultaneous analysis of both major
and trace elements allowed better understanding of the
hydrodynamic functioning and assessing the water quality
in the Djeffara aquifer system. The Piezometric map
(Fig. 4) and the geochemical data (Tables 1, 2) point to the
significant role of carbonate and sandy outcrops of the
Cretaceous and Miocene, respectively, located in the
southern and northern parts of study area in local recharge
of this aquifer system. Stratigraphic, tectonic and hydraulic
conditions seem to be important factors controlling the
geochemical evolution of groundwater in the study area.
The principal changes in chemical composition of Djeffara
aquifer system result from mixing with CI water of deeper
circulation. Closer analysis of available chemical data
reveals the importance of dissolution/precipitation pro-
cesses as well as cation exchange reactions in evolution of
groundwater chemistry. In general, mineralization of
groundwater increases along the flow path from El Hamma
region toward the sabkhas and Mediterranean Sea. The
Na?/Cl- molar ratio suggests that the dissolution of halite
in evaporites within the Miocene and Cretaceous sequences
is the main source of these ions in groundwater. The values
of this ratio, [1, observed in some of the wells may indi-
cate the occurrence of cation exchange reaction releasing
Na? into the water with simultaneous removal of Ca2?.
The existence of such exchange is confirmed by the bal-
ance between the excess of (Na? ? K?) over the Cl- ions
and excess of (Ca2? ? Mg2?) over the (HCO3- ? SO4
2-)
anions (Fig. 10e). Chemical data indicate also the impor-
tance of gypsum dissolution as a factor controlling
groundwater chemistry. The source of the salinity as shown
from the Sr2?/Ca2? ratios is mainly derived from evapo-
ritic formations of Cretaceous, except in the Ouedref
Metouia/El Meıda graben where the influence of both the
salt water from sabkhas and water leaching evaporitic
formations of Cretaceous is evident. What is more, the
molar ratio Sr2?/Ca2? allows the distinguishing of the
different evaporitic influences in this region.
The spatial distribution of fluoride and boron shows that
highest concentration of these elements characterizes the
waters of the northern part of study area, with a reduction
in the flow direction. Fluorine and boron may essentially
come from a natural origin. Limestone, marly formations
and gypsum can contain significant quantities of fluorine
and boron which can be released by water–rock interaction.
With limited supply by the recent infiltration waters, the
increased exploitation of wells can lead to further deteri-
oration of the quality of groundwater resources available
for the population in this area.
Assessment of water samples according to exceeding the
permissible limits prescribed by WHO for drinking pur-
poses indicated that groundwater in study area is chemi-
cally unsuitable for drinking uses. High TH and TDS at a
number of subareas clearly indicate the unsuitability of
groundwater for drinking and irrigation purposes. There-
fore, the water of these wells must be desalinised before
use for drinking.
The suitability of groundwater for irrigation was eval-
uated based on the irrigation quality parameters like boron,
SAR, %Na, RSC, RSBC, and permeability index. Among
these parameters, boron and SAR imply that the water
samples fall in excellent to permissible, excellent to
doubtful, excellent to good for irrigation purpose. RSC and
RSBC values specify that water samples belong to good
classes. The high EC value and percentage of Na in most of
the groundwater indicate its unsuitability for irrigation.
However, permeability index recommends that the water
Environ Earth Sci (2014) 71:3387–3421 3417
123
Page 32
samples from the Djeffara aquifers, belonging to class 2,
are suitable for irrigation. According to the US Salinity
Classification, in deep Djeffara aquifers of the northern
Gabes, 56.52 % fall in the C4–S2 category, 32.61 % fall in
the C4–S3 category and 10.87 % fall in the C4–S4 cate-
gory, indicating high salinity/high sodium and medium
salinity/high sodium type and there is a need for better
drainage to overcome salinity problems. From this classi-
fication, it is clear that the groundwater in the Djeffara
aquifers is unfit for irrigation. Water that is not suitable
based on the above classification may be suitable in well-
drained soils.
The following remedial measures can be helpful (Subba
Rao 2003) in the Gabes-north region: (1) drip irrigation
should be preferred over traditional irrigation practices,
such as flooding to prevent weathering and leaching and
also to reduce water consumption and evaporation; (2)
application of calcium chlorite, gypsum and organic man-
ures to cause de-alkalization and deflocculation, and to
produce more permeable soil supporting plant expansion;
(3) cultivation of sodium salt-tolerant crops and (4) using
judicious fertilizers to obtain higher crop yields should be
based on crop requirements and soil characteristics.
Groundwater quality in the study area reaches alarming
situation so that stringent monitoring and control measures
are necessary to ensure sustainable safe use for the
resource. In this strategy, Tunisia is involved in a series of
geological, hydrogeological and hydrochemical investiga-
tions that will provide technical support for developing
policies to help preserve groundwater availability and
protect water quality, also, assess the origins and the evo-
lution of salinity in the water.
Finally, based on this studies, recommendations have
been made to the local authorities to adopt conjunctive use
of surface water with groundwater to stringently monitor
and control low groundwater quality regions to ensure
sustainable safe use of the resource.
Open Access This article is distributed under the terms of the
Creative Commons Attribution License which permits any use, dis-
tribution, and reproduction in any medium, provided the original
author(s) and the source are credited.
References
Abbes C, Abdeljouad S, Ben Ouezdou H, Zargouni F (1986) Carte.
geologique d’El Hamma a 1:100 000. Feuille n�74, Office
National des Mines, Tunis
Abdeljaouad S (1983) Etude sedimentologique et structure de la
partie est de la chaine nord des Chotts. These de Doctorat. Univ.
de Tunis El Manar. Tunisie
Abid K, Trabelsi R, Zouari K, Abidi B (2010) Caracterisation
hydrogeochimique de la nappe du Continental Intercalaire (sud
tunisien). Hydrol Sci J 54(3):526–536
Abid K, Zouari K, Dulinski M, Chkir N, Abidi B (2011) Hydrologic
and geologic factors controlling groundwater geochemistry in
the Turonian aquifer (southern Tunisia). Hydrogeol J
19:415–427
Abidi B (2004) Caracteristiques hydrodynamiques et geochimiques
de la Djeffara de Gabes. DGRE 2004
ACF (Action Contre la Faim) (1996) La qualite et les analyses d’eau.
ACF, France
Adams S, Titus R, Pietersen K, Tredoux G, Harris C (2001)
Hydrochemical characteristics of aquifers near Sutherland in the
Western Karoo, South Africa. Hydrogeol J 241:91–103
Aghazadeh N, Mogaddam AA (2011) Investigation of hydrochemical
characteristics of groundwater in the Harzandat aquifer, North-
west of Iran. Environ Monit Assess 176:183–195
Al-Bassam AM, Al-Rumikhani YA (2003) Integrated hydrochemical
method of water quality assessment for irrigation in arid areas:
application to the Jilh aquifer, Saudi Arabia. J Afr Earth Sc
36:345–356
Al-Shaibani AM (2008) Hydrogeology and hydrochemistry of a
shallow alluvial aquifer, western Saudi Arabia. Hydrogeol J
16:155–165
Anku YS, Banoeng-Yakubo AEB, Daniel AE, Asiedu K, Sandow A,
Yidana EM (2009) Water quality analysis of groundwater in
crystalline basement rocks, Northern Ghana. Environ Geol
58(5):989–997
Arumugam K, Elangovan K (2009) Hydrochemical characteristics
and groundwater quality assessment in Tirupur Region, Coim-
batore District, Tamil Nadu, India. Environ Geol 58:1509–1520
Ayenew T, Demlie M, Wohnlich S (2008) Hydrogeological frame-
work and occurrence of groundwater in the Ethiopian aquifers.
J Afr Earth Sc 52(3):97–113
Bahar MM, Reza MS (2009) Hydrochemical characteristics and
quality assessment of shallow groundwater in a coastal area of
Southwest Bangladesh. Environ Earth Sci. doi:10.1007/s12665-
009-0427-4
Bardsen A, Bjorvatn K, Selvig KA (1996) Variability in fluoride
content of subsurface water reservoirs. Acta Odontol Scand
54:343–347
Benton MJ, Bouaziz S, Buffetaut E, Martill D, Ouaja M, Soussi M,
Trueman C (2000) Dinosaurs and other fossil vertebrates from
fluvial deposits in the lower cretaceous of Southern Tunisia.
Palaeolgeogr Palaeoclimatol Palaeoecol 157:227–246
Bouaziz S (1995) Etude de la tectonique cassante dans la plateforme
et l’Atlas Sahariens (Tunisie Meridionale): evolution des paleo-
champs de contraintes et implications geodynamiques. These de
Doctorat. Univ. de Tunis El Manar. Tunisie
Boughriba M, Melloul A, Zarhloule Y, Ouardi A (2006) Extension
spatiale de la salinisation des ressources en eau et modele
conceptuel des sources sale0es dans la plaine des Triffa (Maroc
nord-oriental). CR Geosci 338(11):768–744
Brondi M, Fidelibus MD, Gragnani R, Tulipano L (1983) Hydro-
chemical study and distribution of some trace elements in the
most important coastal springs and groundwater of the Apulian
Region (Southern Italy). Geol Appl Idrogeol XVII(II):65–80
Busson G (1970) Le Mesozoıque saharien, tomes 1 et 2. Centre
National de Recherche Scientifique, Paris
Custodio E, Bruggeman GA (1987) Groundwater problems in coastal
areas. UNESCO. Studies and reports in hydrology
Castany G (1954) L’accident sud tunisien et ses relations avec
l’accident sud-atlasique. C R Acad Sci 238:1–184
Castany G (1982) Bassin se0dimentaire du Sahara septentrional
(Algerie-Tunisie)-Aquiferes du Continental intercalaire et du
Complexe Terminal. Bulletin Bureau Recherches Geologiques
Minieres (BRGM). Serie 2.3. 127–147
Catroll D (1962) Rain water as a chemical agent of geological
process: a view. USGS Water Supply 1533:18–20
3418 Environ Earth Sci (2014) 71:3387–3421
123
Page 33
Ceron JC, Jimenez-Espinosa R, Pulido-Bosch A (2000) Numerical
analysis of hydrogeochemical data: a case study (Alto Guada-
lentoan, southeast Spain). Appl Geochem 15:1053–1067
Chan HJ (2001) Effect of land use and urbanization on hydrochem-
istry and contamination of groundwater from Taejon area,
Korea. J Hydrol (Amsterdam) 253:194–210. doi:10.1016/
S00221694(01)00481-4
Coetsiers M, Kilonzo F, Walraevens K (2008) Hydrochemistry and
source of high fluoride in groundwater of the Nairobi area,
Kenya. Hydrol Sci J 53(6):1230–1240
Collins R, Jenkins A (1996) The impact of agricultural land use on
stream chemistry in the middle Hills of Himalaya, Nepal.
J Hydrol 185(71):86
Dassi L (2010) Use of chloride mass balance and tritium data for
estimation of groundwater recharge and renewal rate in an
unconfined aquifer from North Africa: a case study from Tunisia.
Environ Earth Sci 60(4):861–871
Dassi L, Zouari K, Peter Seiler K, Faye S, Kamel S (2005) Flow
exchange between the deep and shallow groundwaters in the
Sbeitla synclinal basin (Tunisia): An isotopic approach. Environ
Geol 47(4):501–511
Davis SN, DeWiest RJ (1966) Hydrogeology. Wiley, New York
Desbarats AJ (2009) On elevated fluoride and boron concentrations in
groundwaters associated with the Lake Saint-Martin Impact
Structure, Manitoba. Appl Geochem 24:915–927. doi:10.1016/j.
apgeochem.2009.02.016
DGRE (Direction Generale des Ressources en Eau) (2008). Annuaires
d’exploitation de la nappe profonde 1950–2008. Ministere de
l’Agriculture, Tunis
Dixon W, Chiswell B (1992) The use of hydrochemical sections to
identify recharge areas and saline intrusions in alluvial aquifers,
southeast Queensland, Australia. Hydrogeol J 130:299–338
Djabri L, Rouabhia A, Hani A, Lamouroux Ch, Pulido-Bosch A
(2007) Origin of water salinity in a lake and coastal aquifer
system. Environ Geol 54(3):565–573
Domenico PA, Schwartz FW (1990) Physical and chemical hydro-
geology. Wiley, New York, pp 410–420
Doneen LD (1964) Notes on water quality in agriculture. Published as
a water science and engineering paper, 4001, Department of
water science and engineering, University of California
Eaton FM (1950) Significance of carbonates in irrigation waters. Soil
Sci 39:123–133
Edmunds WM, Guendouz A, Mamou A, Moulla A, Shand P, Zouari
K (2003) Groundwater evolution in the Continental Intercalaire
aquifer of southern Algeria and Tunisia: trace element and
isotopic indicators. Appl Geochem 18:805–822
Elango L, Kannan R, Senthil K (2003) Major ion chemistry and
identification of hydrogeochemical processes of groundwater in
a part of Kancheepuram District, Tamil Nadu, India. Environ
Geol 10(4):157–166
ERESS (1972) Etude des ressources en eau du Sahara Septentrional.
UNESCO, Paris
Fehdi Ch, Aek Rouabhia, Baali F, Boudoukha A (2009) The
hydrogeochemical characterization of Morsott-El Aouinet aqui-
fer, Northeastern Algeria. Environ Geol 58(7):1611–1620
Freeze RA, Cherry JA (1979) Groundwater. Printice-Hall, New Jersey
Garcia MG, Del Hidalgo M, Blesa MA (2001) Geochemistry of
groundwater in the alluvial plain of Tucuman province Argen-
tina. Hydrogeol J 9(6):597–610
Garrels RM (1976) A survey of low temperature water mineral
relations. In: Interpretation of environmental isotope and
hydrogeochemical data in groundwater hydrology: Vienna,
International Atomic Energy Agency, pp 65–84
Ghanmi M, Potfaj M, Ben Youssef M, Zargouni F (1984) Carte
geologique d’Oglet Mertaba a 1:100 000. Feuille no. 82. Office
nationale des mines. Tunisie
Gimenez E, Morell I (1992) Utilisacio del boro como indicatoro de
contaminacion en la Plana de Castellon. Hidrogeologica y
Recursos Hidraulicos XVI(IV):285–292
Giridharan L, Venugopal T, Jayaprakash M (2008) Evaluation of the
seasonal variation on the geochemical parameters and quality
assessment of the groundwater in the proximity of River Cooum,
Chennai, India. Environ Monit Assess 143:161–178
Graniel CE, Morris LB, Carrillo Rivera JJ (1999) Effect of
urbanization on groundwater resources of Merida, Yucatan, Mex-
ico. Environ Geol 37(4):303–312. doi:10.1007/s002540050388
Guendouz A, Moulla AS, Edmunds WM, Zouari K, Shand P, Mamou
A (2002) Hydrogeochemical and isotopic evolution of water in
the Complex Terminal aquifer in the Algerian Sahara. Engi-
neering Sciences Faculty, Blida, Algeria, pp 483–495
Guler C, Thyne GD (2004) Hydrologic and geologic factors
controlling surface and groundwater chemistry in Indian
Wells—Owens Valley area, southeastern California, USA.
Hydrogeol J 285:177–198
Guler C, Thyne GD, McCray JE, Turner AK (2002) Evaluation of
graphical and multivariate statistical methods for classification
of water chemistry data. Hydrogeol J 10:455–474
Gupta SK, Gupta IC (1987) Management of saline soils and water.
Oxford and IBM Publ. Co, New Delhi
Hamzaoui-Azaza F, Ketata M, Bouhlila R, Gueddari M, Ribeiro L
(2011) Hydrogeochemical characteristics and assessment of
drinking water quality in Zeus–Koutine aquifer, southeastern
Tunisia. Environ Monit Assess 174:283–298
Hamzaoui-Azaza F, Ameur M, Bouhlila R, Gueddari M (2012)
Geochemical characterization of groundwater in a Miocene Aqui-
fer, Southeastern Tunisia. Environ Eng Geosci 18(2):159–174
Han D, Liang X, Jin M, Currell MJ, Han Y, Song X (2009)
Hydrogeochemical indicators of groundwater flow systems in the
Yangwu River Alluvial Fan, Xinzhou Basin, Shanxi, China.
Environ Manage 44:243–255
Handa BK (1975) Geochemistry and genesis of fluoride containing
groundwater in India. Groundwater 13(3):275–281
Haritash AK, Kaushik CP, Kaushik A, Kansal A, Kumar YA (2008)
Suitability assessment of groundwater for drinking, irrigation
and industrial use in some North Indian villages. Environ Monit
Assess 145:397–406
Hatira A, Baccar L, Grira M, Gallali T (2007) Analyse de sensibilite
du systeme oasien et mesures de sauvegarde de l’oasis de
Metouia (Tunisie). Rev Sci Eau 20(1):59–69
Hebrard O, Pistre S, Cheynet N, Dazy J, Batiot-Guilhe C, Seidel JL
(2006) Origine des eaux des emergences karstiques chlorurees
du Languedoc-Roussillon. C R Geosci 338(2006):703–710
Hem JD (1985) Study and interpretation of the chemical character-
istics of natural water. USGS, Water Supply paper no. 2254,
pp 117–120, 264
Hidalgo MC, Cruz-Sanjulian J, Sanroma A (1995) Evolucion geoquı-
mica de las aguas subterraneas en una cuenca sedimentaria (acuıfero
de Baza-Caniles, Granada, Espana). Tierra Tecnol 20:39–48
Hitchon B (1995) Fluoride in formation waters. Alberta Basin,
Canada. Appl Geochem 10:357–367
Hounslow AW (1995) Water quality data: analysis and interpretation.
CRC/Lewis, Washington
Hsissou Y, Chauve P, Mania J, Mangin A, Bakalowicz M, Gaiz A
(1996) Caracte’risation des eaux de l’aquife‘re turonien du
bassin du Tadla (Maroc) par le rapport des concentrations
molaires Sr2?/Ca2?. Hydrogeol J 183:445–451
Jalali M (2007) Salinization of groundwater in arid and semiarid
zones: An example from Tajarak, western Iran. Environ Geol
52(6):1133–1149
Jalali M (2009) Geochemistry characterization of groundwater in an
agricultural area of Razan, Hamadan, Iran. Environ Geol
56:1479–1488
Environ Earth Sci (2014) 71:3387–3421 3419
123
Page 34
Jeevanandam M, Kannan R, Srinivasalu S, Rammohan V (2006)
Hydrogeochemistry and groundwater quality assessment of
lower part of the Ponnaiyar River Basin, Cuddalore district,
South India. Environ Monit Assess 132(1):263–274. doi:10.
1007/s10661-006-9532-y
Kallel R (2003) Hydrologie de la Jeffara tunisienne. Rapport interne.
CRDA de Gabes
Kamel S, Younes H, Chkir N, Zouari K (2008) Geochemical and
isotopic investigation of the aquifer system in the Djerid–
Nefzoua basin, southern Tunisia. Environ Geol 49:59–170
Kelley WP (1951) Alkali soils: their formation properties and
reclamations. Reinhold, New York
Ketata M, Hamzaoui F, Gueddari M, Bouhlila R, Ribeiro L (2011)
Hydrochemical and statistical study of groundwaters in Gabes
south deep aquifer (southeastern Tunisia). J Phys Chem Earth
36:187–196
Khazaei E, Stednick JD, Sanford WE, Warner JW (2006) Hydro-
chemical changes over time in the Zahedan aquifer, Iran.
Environ Monit Assess 114:123–143
Krishna Kumar S, Rammohan V, Dajkumar Sahayam J, Jeevanandam
M (2009) Assessment of groundwater quality and hydrogeo-
chemistry of Manimuktha River basin, Tamil Nadu, India.
Environ Monit Assess 159:341–351
Krishnakumar S (2004) Quality characterization and geochemical
characteristics of lower Gadilum River Basin, Tamil Nadu,
India. Dissertation, University of Madras
Kumar M, Ramanathan AL, Rao MS, Kumar B (2006) Identification
and evaluation of hydrogeochemical processes in the ground-
water environment of Delhi, India. Environ Geol 50:1025–1039
Kumar M, Kumari K, Ramanathan AL, Saxena R (2007) A
comparative evaluation of groundwater suitability for irrigation
and drinking purposes in two intensively cultivated districts of
Punjab, India. Environ Geol 5(553):574
Kumar M, Kumari K, Singh UK, Ramanathan AL (2009) Hydrog-
eochemical processes in the groundwater environment of
Muktsar, Punjab: conventional graphical and multivariate statis-
tical approach. Environ Geol 57:873–884
Kurumbein WC, Graybill FA (1965) An introduction to statistical
models in geology. McGraw-Hill, New York
Magaritz M, Nadler A, Koyumdjisky H, Dan N (1981) The use of Na/
Cl ratio to trace solute sources in a semiarid zone. Water Resour
Res 17:602–608
Mamou A (1990) Caracteristiques, Evaluation, Gestion des ressources
en eau du Sud Tunisien. PhD thesis, University of Paris South,
Paris
Mandel S, Shiftan ZL (1981) Groundwater resources investigation
and development. Academic Press Inc, New York
McCarthy TS, Ellery WN (1994) The effect of vegetation on soil and
ground water chemistry and hydrology of islands in the seasonal
swamps of the Okavango Fan, Botswana, Botswana. Hydrogeol J
154:169–193
McLean W, Jankowski J, Lavitt N et al (2000) Groundwater quality
and sustainability in an alluvial aquifer, Australia. In: Sililo O
(ed) Groundwater, past achievement and future challenges.
Balkema, Rotterdam, pp 567–573
Mekrazi AF (1975) Contribution a l’etude geologique et hydroge-
ologique de la region de Gabes Nord. PhD thesis, University of
Bordeaux, France
Meybeck M (1984) Les fleuves et le cycle geochimique des elements.
Etat Thesis, Univ Paris VI
Morgan-Jones M, Eggboro MD (1981) The hydrogeochemical of the
Jurassic limestones in Gloucestershire, England. Q J Eng Geol
(London) 14:25–29
OSS (Observatoire Sahara et Sahel) (2003) Systeme aquifere du
Sahara septentrional: gestion commune d’un bassin trans-
frontiere. Review article. OSS, Tunisia
Piper AM (1944) A graphical interpretation of water analysis. Trans
Am Geophys Union 25:914–928
Plummer LN, Jones BF, Truesdell AH (1976) WATEQF, a Fortan IV
version of WATEQ, a computer program for calculating
chemical equilibrium of natural waters. US Geol Surv Water
Resour Invest 76:13
Qiyan F, Baoping H (2002) Hydrogeochemical simulation of water-
rock interaction under water flood recovery in Renqiu Oilfield,
Hebei Province, China. Chin J Geochem 21:156–162
Ragunath HM (1987) Groundwater, 2nd edn. Wiley Eastern Ltd.,
New Delhi
Raju NJ (2007) Hydrogeochemical parameters for assessment of
groundwater quality in the upper Gunjanaeru River basin,
Cuddapah District, Andhra Pradesh, South India. Environ Geol
52:1067–1074
Ravikumar P, Venkatesharaju K, Somashekar RK (2009) Major ion
chemistry and hydrochemical studies of groundwater of Banga-
lore South Taluk, India. Environ Monit Assess 163:643–653
Ravikumar P, Somashekar RK, Angami M (2010) Hydrochemistry
and evaluation of groundwater suitability for irrigation and
drinking purposes in the Markandeya River basin, Belgaum
District, Karnataka State, India. Environ Monit Assess
173(1–4):459–487
Richards LA (1954) Diagnostics and improvement of saline and
alkaline soils. U.S. Dept. of Agriculture hand book no. 60. U.S.
Salinity Laboratory, Washington, DC
Risacher F, Alonso H, Salazar C (2003) The origin of brines and salts
in Chilean salars: a hydrochemical review. Earth Sci Rev
63:249–293
Robbins J (2010) Irrigation water for greenhouses and nurseries. U.S.
Dept. of Agriculture, and County Governments Cooperating no.
6061. Agriculture and Natural Resources, University of Arkan-
sas, Division of Agriculture
Rose EF, Chaussidon M, France-Lanord C (2000) Fractionation of
boron isotopes during erosion processes: the example of
Himalayan rivers. Geochim Cosmochim Acta 64:397–408
Rosset R, Douville S, Ben Amor M, Walha K (1999) L’inhibition de
l’entartrage par les eaux geothermales du sud tunisien. Etude sur
site. Rev Sci Eau 12(4):753–764
Rouabhia A, Baali F, Fehdi Ch, Kherici N, Djabri L (2009)
Hydrochemical and isotopic investigation of a sandstone aquifer
groundwater in a semiarid region, El Ma El Abiod, Algeria.
Environ Geol 57(8):1699–1705
Rouatbi R (1967) Contribution a l’etude hydrogeologique du Karst en
terre de Gabes Sud. PhD thesis, Montpellier
Salesh A, Al-Ruwaih F, Shehata M (1999) Hydrogeochemical
processes operating within the main aquifers of Kuwait. J Arid
Environ 42:195–209
Sami K (1992) Recharge mechanisms and geochemical processes in a
semi-arid sedimentary basin, Eastern Cape, South Africa.
Hydrogeol J 139:27–48
Sanchez-Martos F, Pulido-Bosch A, Molina-Sanchez L, Vallejos-
Izquierdo A (2002) Identification of the origin of salinization in
groundwater using minor ions (lower Andarax, southeast Spain).
Sci Total Environ 297:43–58
Sawyer GN, McMcartly DL (1967) Chemistry of sanitary engineers,
2nd edn. McGraw Hill, New York
Schroeder HA (1960) Relations between hardness of water and death
rates from certain chronic and degenerative diseases in the
United States. J Chronic Dis 12:586–591
Scofield CS (1936). The salinity of irrigation water. Annual Report,
Smithsonian Institute, pp 275–287
Srinivasa Gowd S (2005) Assessment of groundwater quality for
drinking and irrigation purpose: a case study of Peddavanka
watershed, Anantapur District, Andhra Pradesh, India. Environ
Geol 48:702–712
3420 Environ Earth Sci (2014) 71:3387–3421
123
Page 35
Stuyfzand PJ (1989) Nonpoint source of trace element in potable
groundwater in Netherland. In: Proceedings of the 18th TWSA
Water Working, Testing and Research Institute. KIWA,
Nieuwegein
Subba Rao N (2003) Groundwater quality: focus on fluoride
concentration in rural parts of Guntur District, Andhra Pradesh,
India. Hydrol Sci J 48:835–847
Subba Rao N (2006) Seasonal variation of groundwater quality in a
part of Guntur district, Andhra Pradesh, India. Environ Geol
49:413–429
Subba Rao N, Gurunadha Rao VVS, Gupta CP (1998) Groundwater
pollution due to discharge of industrial effluents in Venkatapu-
ram area, Visakhapatnam, Andhra Pradesh, India. Environ Geol
33(4):289–294
Subramani T, Elango L, Damodarasamy SR (2005) Groundwater
quality and its suitability for drinking and agricultural use
Chithar River Basin, Tamil Nadu, India. Environ Geol
47:1099–1110
Tank DK, Chandel CPS (2009) A hydrochemical elucidation of the
groundwater composition under domestic and irrigated land in
Jaipur city. Environ Monit Assess. doi:10.1007/s10661-009-
0985-7
Tayfur G, Kirer T, Baba A (2008) Groundwater quality and
hydrogeochemical properties of Torbali Region, Izmir, Turkey.
Environ Monit Assess 146:157–169
Todd DK (1980) Groundwater hydrology, 2nd edn. Wiley, New York
Todd DK, Mays LW (2005) Groundwater hydrology, 3rd edn. Wiley,
New York
Trabelsi R, Zaıri M, Smida H, Ben Dhia H (2005) Salinisation des
nappes cotieres: cas de la nappe nord du Sahel de Sfax, Tunisie.
C R Acad Sci 337(5):515–524
Trabelsi R, Zairi Z, Ben Dhia H (2007) Groundwater salinization of
the Sfax superficial aquifer, Tunisia. Hydrogeol J 15(7):
1341–1355
Trabelsi R, Kacem A, Zouari K, Rozanski K (2009) Quantifying
regional groundwater flow between Continental Intercalaire and
Djeffara aquifers in southern Tunisia using isotope methods.
Environ Geol 58(1):171–183
Trabelsi R, Abid K, Zouari K (2011) Geochemistry processes of the
Djeffara palaeogroundwater (Southeastern Tunisia). Quat Int
3:1–13
Travi Y, Faye A (1992) Fluoride in Paleocene aquifers in Sengal. An
example of the contamination of a confined aquifer by its roof
zone, aggravated by intensive exploitation. In: Proceedings of
XXIII IAH Congress on Aquifer Overexploitation of Canary
Islands and Spain, pp 171–174
Umar R, Sami Ahmad M (2000) Groundwater quality in part of
Central Ganga Basin, India. Environ Geol 39(6):673–678.
doi:10.1007/s002540050480
Vengosh A, Kloppmann W, Marie A, Livshitz Y, Gutierrez A, Banna
M, Guerrot C, Pankratov I, Ranan H (2005) Sources of salinity
and boron in the Gaza Strip: natural contaminant flow in the
southern Mediterranean Coastal aquifer. Water Resour Res
41:W01013. doi:10.1029/2004WR003344
Wen XH, Wu AEY, Andwu AEJ (2008) Hydrochemical character-
istics of groundwater in the Zhangye Basin, northwestern China.
Environ Geol 55(8):1713–1724
Wenzel WW, Blum WEH (1992) Fluoride speciation and mobility in
fluoride contaminated soil and minerals. J Soil Sci 153:357–364
WHO (1993) Guidelines for drinking water quality, recommenda-
tions, vol 1, 2nd edn. WHO, Geneva
WHO (1996) Water quality monitoring: a practical guide to the
design and implementation of freshwater quality studies and
monitoring programmes. E&FN Spon, London
WHO (2004) Guidelines for drinking water quality: training pack.
WHO, Geneva
Wilcox LV (1948) The quality of water for irrigation uses. U.S. Dept.
Agri. Tech. Bull. 962. USDA, Washington, DC
Wilcox LV (1955) Classification and use of irrigation waters. USDA,
Circular 969, Washington, DC
World Health Organization (WHO) (1996) Guidelines for drinking
water quality. Health criteria and other supporting information,
vol 2, 2nd edn. WHO, Geneva
Yaouti FEl, Mandour AEl, Khattach D, Benavente J, Kaufmann O
(2009) Salinization processes in the unconfined aquifer of Bou-
Areg (NE Morocco): a geostatistical, geochemical, and tomo-
graphic study. Appl Geochem 24:16–31
Zhaoli S, Mi Z, Minggao T (1989) The characteristics of fluoride in
groundwater of north China and significance of fluorite–water
interaction to fluorine transportation. In: Proceedings of 6th
international symposium on water rock interaction, Malvern (UK
Balkema), pp 801–804
Environ Earth Sci (2014) 71:3387–3421 3421
123