Electoral Choice and Popular Control of Public Policy: The Case of the 1966 House Elections Author(s): John L. Sullivan and Robert E. O'Connor Reviewed work(s): Source: The American Political Science Review, Vol. 66, No. 4 (Dec., 1972), pp. 1256-1268 Published by: American Political Science Association Stable URL: http://www.jstor.org/stable/1957178 . Accessed: 29/01/2013 01:40 Your use of the JSTOR archive indicates your acceptance of the Terms & Conditions of Use, available at . http://www.jstor.org/page/info/about/policies/terms.jsp . JSTOR is a not-for-profit service that helps scholars, researchers, and students discover, use, and build upon a wide range of content in a trusted digital archive. We use information technology and tools to increase productivity and facilitate new forms of scholarship. For more information about JSTOR, please contact [email protected]. . American Political Science Association is collaborating with JSTOR to digitize, preserve and extend access to The American Political Science Review. http://www.jstor.org This content downloaded on Tue, 29 Jan 2013 01:40:13 AM All use subject to JSTOR Terms and Conditions
Transcript
Electoral Choice and Popular Control of Public Policy: The Case of the 1966 House ElectionsAuthor(s): John L. Sullivan and Robert E. O'ConnorReviewed work(s):Source: The American Political Science Review, Vol. 66, No. 4 (Dec., 1972), pp. 1256-1268Published by: American Political Science AssociationStable URL: http://www.jstor.org/stable/1957178 .
Accessed: 29/01/2013 01:40
Your use of the JSTOR archive indicates your acceptance of the Terms & Conditions of Use, available at .http://www.jstor.org/page/info/about/policies/terms.jsp
.JSTOR is a not-for-profit service that helps scholars, researchers, and students discover, use, and build upon a wide range ofcontent in a trusted digital archive. We use information technology and tools to increase productivity and facilitate new formsof scholarship. For more information about JSTOR, please contact [email protected].
.
American Political Science Association is collaborating with JSTOR to digitize, preserve and extend access toThe American Political Science Review.
http://www.jstor.org
This content downloaded on Tue, 29 Jan 2013 01:40:13 AMAll use subject to JSTOR Terms and Conditions
Electoral Choice and Popular Control of Public Policy: The Case of the 1966 House Elections*
JOHN L. SULLIVAN Indiana Universitv
ROBERT E. O'CONNOR Pennsylvania State L(,zi esiity
Democratic Theory and Electoral Choice Recent democratic theorists define democ-
racy procedurally, providing lists of necessary and sufficient conditions for a democratic sys- tem. They require a free press, free and open elections, universal suffrage, one-person one- vote; they require that candidates or parties with the most votes must win, that minorities must be allowed equal opportunity to become majorities, and so on. Certainly this description fits such theorists as Dahl,1 Downs,2 and Mayo,3 all of whom feel that the basic meaning of democracy is deciding who shall govern. Typi- cal is the following definition of democracy: "One test of an electoral system is the extent to which it is democratic, that is, the extent to which everyone is permitted to participate in the choice (of rulers) ."4
It is argued that since the size and complex- ity of modern nations have made direct popular control of policies impossible, the best test of democracy is popular selection of decision mak- ers. According to this criterion, we have in the
* This paper could not have been written without the assistance of several individuals. Milton C. Cum- mings and Donald R. Matthews helped us obtain the data. A special debt is owed to 1. A. Lewis, Manager of NBC News, Election Unit. He allowed us access to the data and provided us with technical assistance. The data were originally collected by Congressional Quar- terly for NBC News. Financial assistance was provided by the National Science Foundation and the National Institute of Mental Health. The first-named author would like to express his gratitude to the Psychology and Politics Program of Yale University and to NIMH for time and financial assistance in the form of a Postdoctoral Fellowship.
Robert Dahl, A Preface to Democratic Theory (Chicago: Univ. of Chicago Press, 1956), chapters 3 and 5.
2 Anthony Downs. An Economic Theory of Demnoc- racy (New York: Harper, 1957), pp. 23-24.
Henry B. Mayo, An Introduction to Democratic Theory (New York: Oxford University Press, 1960), chapter 4.
'Walter Berns, "A Critique of Berelson, Lazarsfeld, and McPhee's Voting," in Public Opinion and Public Police: Models of Political Linkage, ed. Norman R. Luttbeg (Homewood, Illinois: Dorsey, 1968), p. 32.
United States in the 1970s an approximation to democracy, since there is considerable popular choice of leaders in a large majority of con- gressional districts, senate races, and in all presidential elections.
Is this the highest level of democracy? Logi- cally, we can imagine a higher level in which the people would control both the leaders and the policies. Popular control of leaders is not necessarily popular control of policies. If popu- lar control of, for example, legislative policies exists, then the legislator's voting behavior is consistent with the attitudes of his constituents. If this relationship between congressmen's vot- ing behavior and constituency opinion were to hold for every district, laws (legislative out- puts) would closely reflect public opinion. This is what we mean by popular control of legisla- tive outputs.
We have asserted that popular control of leaders exists. Does popular control of policy also exist? Miller and Stokes found correlations between constituency attitudes and the roll-call behavior of representatives of approximately -0.09 in the policy area of foreign affairs, 0.30 in social and economic welfare, and 0.60 in civil rights., It appears that in at least one, and perhaps two, major policy areas, the relation- ship is weak enough to argue that constituency control does not exist.
Political scientists have made considerable effort to explain the absence of a strong linkage between constituency attitudes and public pol- icy.' Generally this effort has focused upon two necessary conditions for a strong linkage: first, that voters perceive the issue positions of the candidates, and second, that voters cast their ballots on issue grounds. Popular control of
Warren E. Miller and Donald E. Stokes, "Con- stituency Influence in Congress," American Political Science Review, 57 (March, 1963), 49.
'See, for example, Philip E. Converse, "The Nature of Belief Systems in Mass Publics," Ideology and Discontent, ed. David Apter (New York: Free Press, 1964), pp. 206-261, and Luttbeg, Public Opinion and Public Policy.
1256
This content downloaded on Tue, 29 Jan 2013 01:40:13 AMAll use subject to JSTOR Terms and Conditions
1972 Electoral Choice and Popular Control of Public Policy 1257
policies is dependent upon these two condi- tions.
Popular control of policies is also dependent upon two other conditions which have been ne- glected by political scientists. These conditions are: third, that opposing candidates (for the same office) differ attitudinally on the issues, and fourth, that the winners vote in accordance with their pre-election attitudes.`
Although it has been demonstrated that there are real differences in the voting behavior of congressmen from the two major parties,9
... any ideological differences (or similarities) be- tween Democratic and Republican challengers could be quite deceptive from the viewpoint of al- ternatives presented the electorate in specific dis- tricts. It is possible that noninc Umbents are more like their incumbent opponents in most districts while pairs of congressional candidates differ from district to district.'0
This third condition-that opposing candidates for the same elective office must differ in their attitudes toward the issues is an essential component of any realistic linkage model of the political system of the United States."
The fourth condition, that winners vote in accordance with their pre-election attitudes, also is essential for popular control of policies. If voters prefer the more conservative candi- date but if, once elected, he behaves as his more liberal opponent would have, the elector- ate has been deceived in its efforts to exercise control of policies.
What we have referred to as the third and fourth conditions should be the first conditions examined by political scientists. If the third and fourth conditions are false, nonrealization of the two well-researched conditions of the link- ige process is not surprising. If many candi- lates do not differ appreciably from one an- other, or if the winners fail to vote in Congress on the basis of their pre-election attitudes, there is little reason for voters to become familiarized with the issue positions of the candidates or to
An exception to this statement is found in Jeff Fishel, "Party, Ideology, and the Congressional Chal- lenger," American Political Science Review, 63 (De- cember, 1969), 1213-1232.
'John L. Sullivan, "Linkage Models of the, Po- litical System," Public Opinion and Political Attitudes: A Reader, ed. Alan R. Wilcox, forthcoming.
'See, among others, David B. Truman, The Con- gressional Party (New York: Wiley, 1959); Julius Turner, Party and Constituency: Pressures on Congress (Baltimore: The Johns Hopkins University Press, 1951); and Duncan MacRae, Dimensions of Congres- nional Voting (Berkeley: University of California Press, 1958).
"Fishel, p. 1221. "Sullivan, Part V.
vote on the basis of these issue positions. " If the conditions of choice and of winners voting their expressed positions are not met, elections may still perform valuable functions,', but they cannot permit a strong linkage between public opinion and public policy.
This paper examines the two neglected con- ditions of the linkage process in an effort to evaluate an alternative explanation (other than voter apathy and ignorance) of why the linkage between public policy and constituency atti- tudes appears to be so weak.
Data The data consist of attitudinal measures for
all candidates for the House of Representatives in 1966. For all nonincumbents the data consist of answers to a questionnaire, while for all in- cumbents the data consist of both past roll-call behavior and responses to the questionnaire. The questions asked and the roll calls employed fall in three general areas: foreign affairs, civil rights, and domestic programs. The questions focus upon issues that were considered both substantively important and likely to be voted upon by the 90th Congress.'4
Each of the eight items of the questionnaire received a score of one (liberal response), two (moderate response) or three (conservative re- sponse). The items scale across issues and can be combined into an overall liberalism-conserv- atism scale vis-a-vis public policy. The candi- dates' scores vary from eight (liberal on all eight items) to twenty-four (conservative on all eight items).
One condition for linkage involves candi- dates' attitudinal differences toward public pol- icy for each congressional district. Candidate differences are obtained by subtracting the score of a given candidate from that of his op- ponent in each district. On this measure the
1 2The individual voter cannot arrive at this conclu- sion unless he has first familiarized himself with the issue positions of the candidates and the later roll-call behavior of the winners. We know that the possession of this information is the exception rather than the rule. If, however, a district (or an entire political sys- tem) has in the recent past offered little choice, it may become part of the collective attitude of the citizenry that all attempts to gather this type of information are wasted.
`Richard Rose and Harve Mossawir, "Voting and Elections: A Functional Analysis," Political Studies, 15 (June, 1967), 173-201.
"See Appendix A for the questionnaire, roll calls, and scaling. Congressional Quar-terly was able to ob- tain a 100 per cent response rate by making ample use of telephone followups. In several cases, aides an- swered the questions, but presumably they gave the same answers the candidate would have given. If the incumbent was absent for a roll call, he was asked how he would have voted had he been present.
This content downloaded on Tue, 29 Jan 2013 01:40:13 AMAll use subject to JSTOR Terms and Conditions
1258 The American Political Science Review Vol. 66
minimum score possible is zero, meaning that the candidates do not differ on this liberalism- conservatism continuum; the maximum is six- teen, meaning that a conservative on every is- sue faces a liberal on every issue.
The other condition of linkage examined in this study is that winners vote in a manner con- sistent with pre-election attitudes. For this we compare the roll-call behavior of the winners of the 1966 election with our pre-election mea- sures. 15
Choice Table I evinces the magnitude of differences
between candidates' attitude scores within dis- tricts. The modal category is represented by a score of zero. This finding reflects the fact that 57 Congressmen faced no opposition in the general election. If we focus momentarily only on contested seats, the median score rises to eight, the mean score to seven, and the modal category to nine.",
The distribution of Table I is based on dif- ferences on the overall liberalism-conservatism scale. The analysis presented in Appendix A makes it clear that it is possible for two candi- dates to have the same score on this scale, yet arrive at them by giving somewhat different re- sponses. We think it important then to show (Table 2) the sum of the absolute differences, question by question. The average amount of choice, when choice is conceptualized as differ- ences in response to eight individual questions, rather than as differences in overall liberalism- conservatism, rises from a mean of 5.9 to a mean of 6.5. Because the individual questions are highly scalable, the difference between these distributions is slight. That is to say, those who are more liberal on one set of issues also tend to be more liberal on other sets of issues.
One is faced with the problem of determin-
'5 The roll calls for the 90th Congress are presented in Appendix B. If the representative was absent but announced for or against, we accepted this announce- ment as indicating how he would have voted had he been present. If there was no information available, we coded his response as a moderate one, except where otherwise noted (Table 7).
"'One complicating factor is the amount of choice offered in the primary elections. The available evi- dence, however, suggests that issues only weakly define primary elections. See V. 0. Key, Jr., Southern Politics (New York: Knopf, 1949), pp. 105, 117, 142. The evidence further suggests that the amount of choice offered in primary elections in safe districts is not great. For example, Julius Turner, "Primary Elections as the Alternative to Party Competition in 'Safe' Districts," Journal of Politics, 15 (May, 1953), 197-210, found that, between the years 1944-1950, only half the pri- maries in safe districts were even contested. No doubt the candidates differed only marginally on the issues in at least some of the contested primaries.
Table 1. Intradistrict Differences in House Candidates' Attitudes (Liberalism-Conservatism Scale)
ing how much choice is sufficient to satisfy the third linkage condition. Does the election offer the electorate a chance to affect policy outputs in a significant manner? Our approach to the problem is to examine aggregate differences among the candidates. This determines whether or not the election of one aggregate set of can- didates over another set would have made any differences in the balance of power in Con- gress. Would the most liberal Congress which could have been elected, in the aggregate, be quite different from the most conservative Con- gress which might have been chosen?
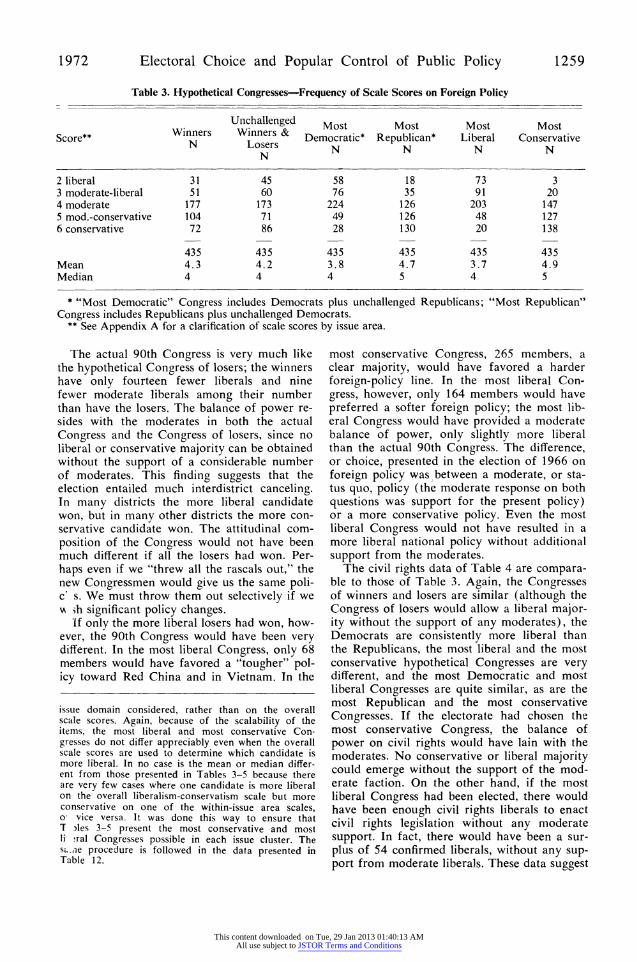
Table 3 presents the attitude distributions of five hypothetical Congresses and of the real 90th Congress on the foreign policy questions. The most liberal and most conservative hypo- thetical Congresses are composed of the candi- dates having the lower or higher score, respec- tively, for each district on the foreign policy at- titude scale.17
I In each case, the most liberal and most conserva- tive Congresses are based on the scores within the
Table 2. Intradistrict Differences in House Candidates' Attitudes (Absolute Differences)
* "Most Democratic" Congress includes Democrats plus unchallenged Republicans; "Most Republican" Congress includes Republicans plus unchallenged Democrats.
** See Appendix A for a clarification of scale scores by issue area.
The actual 90th Congress is very much like the hypothetical Congress of losers; the winners have only fourteen fewer liberals and nine fewer moderate liberals among their number than have the losers. The balance of power re- sides with the moderates in both the actual Congress and the Congress of losers, since no liberal or conservative majority can be obtained without the support of a considerable number of moderates. This finding suggests that the election entailed much interdistrict canceling. In many districts the more liberal candidate won, but in many other districts the more con- servative candidate won. The attitudinal com- position of the Congress would not have been much different if all the losers had won. Per- haps even if we "threw all the rascals out," the new Congressmen would give us the same poli- c s. We must throw them out selectively if we M ih significant policy changes.
If only the more liberal losers had won, how- ever, the 90th Congress would have been very different. In the most liberal Congress, only 68 members would have favored a "tougher" pol- icy toward Red China and in Vietnam. In the
issue domain considered, rather than on the overall scale scores. Again, because of the scalability of the items, the most liberal and most conservative Con- gresses do not differ appreciably even when the overall scale scores are used to determine which candidate is more liberal. In no case is the mean or median differ- ent from those presented in Tables 3-5 because there are very few cases where one candidate is more liberal on the overall liberalism-conservatism scale but more conservative on one of the within-issue area scales, o vice versa. It was done this way to ensure that T )les 3-5 present the most conservative and most li ral Congresses possible in each issue cluster. The sLae procedure is followed in the data presented in Table 12.
most conservative Congress, 265 members, a clear majority, would have favored a harder foreign-policy line. In the most liberal Con- gress, however, only 164 members would have preferred a softer foreign policy; the most lib- eral Congress would have provided a moderate balance of power, only slightly more liberal than the actual 90th Congress. The difference, or choice, presented in the election of 1966 on foreign policy was between a moderate, or sta- tus quo, policy (the moderate response on both questions was support for the present policy) or a more conservative policy. Even the most liberal Congress would not have resulted in a more liberal national policy without additional support from the moderates.
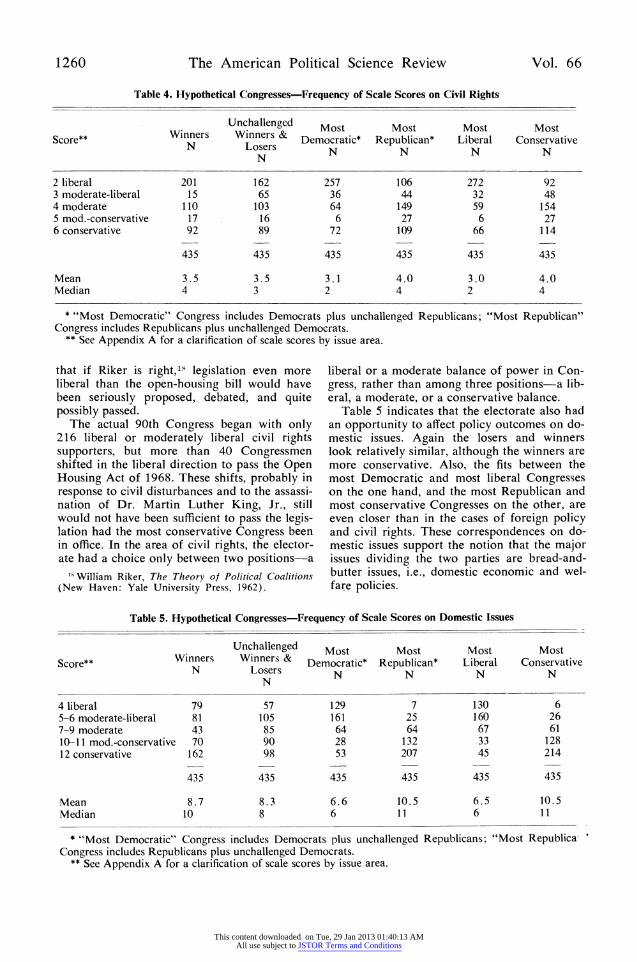
The civil rights data of Table 4 are compara- ble to those of Table 3. Again, the Congresses of winners and losers are similar (although the Congress of losers would allow a liberal major- ity without the support of any moderates), the Democrats are consistently more liberal than the Republicans, the most liberal and the most conservative hypothetical Congresses are very different, and the most Democratic and most liberal Congresses are quite similar, as are the most Republican and the most conservative Congresses. If the electorate had chosen the most conservative Congress, the balance of power on civil rights would have lain with the moderates. No conservative or liberal majority could emerge without the support of the mod- erate faction. On the other hand, if the most liberal Congress had been elected, there would have been enough civil rights liberals to enact civil rights legislation without any moderate support. In fact, there would have been a sur- plus of 54 confirmed liberals, without any sup- port from moderate liberals. These data suggest
This content downloaded on Tue, 29 Jan 2013 01:40:13 AMAll use subject to JSTOR Terms and Conditions
* "Most Democratic" Congress includes Democrats plus unchallenged Republicans; "Most Republican" Congress includes Republicans plus unchallenged Democrats.
** See Appendix A for a clarification of scale scores by issue area.
that if Riker is right,18 legislation even more liberal than the open-housing bill would have been seriously proposed, debated, and quite possibly passed.
The actual 90th Congress began with only 216 liberal or moderately liberal civil rights supporters, but more than 40 Congressmen shifted in the liberal direction to pass the Open Housing Act of 1968. These shifts, probably in response to civil disturbances and to the assassi- nation of Dr. Martin Luther King, Jr., still would not have been sufficient to pass the legis- lation had the most conservative Congress been in office. In the area of civil rights, the elector- ate had a choice only between two positions-a
"SWilliam Riker, The Theory of Political Coalitions (New Haven: Yale University Press, 1962).
liberal or a moderate balance of power in Con- gress, rather than among three positions-a lib- eral, a moderate, or a conservative balance.
Table 5 indicates that the electorate also had an opportunity to affect policy outcomes on do- mestic issues. Again the losers and winners look relatively similar, although the winners are more conservative. Also, the fits between the most Democratic and most liberal Congresses on the one hand, and the most Republican and most conservative Congresses on the other, are even closer than in the cases of foreign policy and civil rights. These correspondences on do- mestic issues support the notion that the major issues dividing the two parties are bread-and- butter issues, i.e., domestic economic and wel- fare policies.
Table 5. Hypothetical Congresses-Frequency of Scale Scores on Domestic Issues
Unchallenged Most Most Most Most
Score** Winners Winners & Democratic* Republican* Liberal Conservative N Losers N N N N N
Mean 8.7 8.3 6.6 10.5 6.5 10.5 Median 10 8 6 11 6 11
*"Most Democratic" Congress includes Democrats plus unchallenged Republicans; "Most Republica, Congress includes Republicans plus unchallenged Democrats.
** See Appendix A for a clarification of scale scores by issue area.
This content downloaded on Tue, 29 Jan 2013 01:40:13 AMAll use subject to JSTOR Terms and Conditions
1972 Electoral Choice and Popular Control of Public Policy 1261
If the most liberal Congress had been elected, there would have been only 78 conser- vatives or moderate conservatives, while 290 members would have favored most of the lib- eral items of social legislation. If the liberals had been able to obtain the support of slightly more than half of the moderate liberals, a clear liberal majority would have resulted. On the other hand, if the most conservative Congress had been elected, there would have been only 32 liberals or moderate liberals, leading to a clear conservative majority with the support of only a small number of the 128 moderate con- servatives. The median domestic scale score for the most liberal Congress is 6 (toward the mod- erate end of the moderate-liberal category); for the most conservative Congress it is 11 (toward the conservative end of the moderate-conserva- tive category). This is a meaningful difference because different electoral outcomes imply ma- jority support for different policies.
Attitudes and Behavior We have been talking about attitudes toward
public policy. It must be emphasized, however, that our measures for nonincumbents consist entirely of responses to a questionnaire and represent what are conventionally referred to as verbal attitudes, while our measures for incum- bents consist partially of actual roll-call behav- ior. The questionnaire asked the nonincum- bents if they supported certain programs which had been voted on in the previous Congress. As a result, the attitude-behavior distinction should be at a minimum, but it would be risky to as- sume, without a thorough empirical examina- tion, that the questionnaire data and the roll- call data are comparable.'9
The general question of the relationship be- tween verbal attitudes and overt behavior has never been adequately resolved. In a review of more than 32 studies, Wicker concluded: Taken as a whole, these studies suggest that it is considerably more likely that attitudes will be un- related or only slightly related to overt behaviors than that attitudes will be closely related to ac- tions. Product-moment correlation coefficients re- lating the two kinds of responses are rarely above .30, and often are near zero.20
1' Miller and Stokes, "Constituency Influence in Con- gress," p. 48, report correlations between the true opinion of Congressmen (as measured by a question- naire) and their roll-call behavior of 0.75 among those who felt their attitudes were expressed in their roll calls, but only 0.04 among those who felt that they were not.
"'Allan W. Wicker, "Attitudes versus Actions: The Relationship of Verbal and Overt Behavioral Responses to Attitude Objects," Journal of Social Issues, 25 (Autumn, 1969), 65.
Taken at face value, this conclusion does seem to resolve the problem: there is no predictable relationship. Yet under the appropriate condi- tions, he implies, there ought to be a strong positive relationship. Wicker goes on to inven- tory the kinds of factors--personal and situa- tional-that determine the strength of the rela- tionship between verbal attitudes and overt be- havior. Personal factors include other attitudes relevant to the observed behavior: competing motives; verbal, intellectual, and social abilities; and activity levels. Situational factors include the degree of privacy, normative prescriptions of behavior, alternative behaviors available, specificity of attitude objects, unforeseen events, and consequences of the act, expected or actual.21 Without attempting a complete enumeration, we will suggest the effects of some of these variables in the present research.
The fact that we are comparing actual be- havior with behavioral intentions of high speci- ficity, rather than with general attitudes toward the attitude object in question, enhances the re- lationship between the two different types of measurements. For example, competing mo- tives in this case could easily include the con- flict between attitude toward civil rights and the desire to get re-elected. If questioned about his attitude toward civil rights, a representative may have indicated a positive response yet voted against a civil rights bill because he felt that his constituency opposed it and would not re-elect him if he voted for it. This conflict should be lessened because the questionnaire did not ask the challengers whether or not they favored civil rights, but, rather whether they would have supported (voted for) a particular civil rights bill. Presumably, they considered these conflicting motives in the same manner they would have if actually faced with the be- havioral decision. Undoubtedly there is slip- page, since some candidates may not have been aware of all the conflicting motives they would encounter if they actually had to make a behav- ioral decision. The point is that the slippage should be minimal as compared to less behav- iorally specific attitudes.
Or consider activity level. The attitude-be- havior relationship is hypothesized to be con- siderably stronger for the active as opposed to the more apathetic individual. Certainly the candidates in the 1966 congressional elections were sufficiently active to produce a strong re- lationship between attitude and behavior vis-a- vis the major issues of the day.
It seems, therefore, that although the ques- tionnaire and roll-call data are not isomorphic,
"Wicker, pp. 67-74.
This content downloaded on Tue, 29 Jan 2013 01:40:13 AMAll use subject to JSTOR Terms and Conditions
they ought to be directly comparable. We can examine this congruence empirically, at least indirectly, in the form of predictive validity. If both sets of pre-election data predict subse- quent roll-call behavior with equal accuracy, we can feel secure about comparability. Thus the examination of the relationship between pre-election data and postelection roll-call be- havior serves two functions. It allows us to ex- amine and judge the comparability of the two types of pre-election data, and it allows us to determine the validity of the fourth linkage condition, i.e., that the pre-election differences between candidates are the basis of post- election roll-call differences.
In order to examine this relationship empiri- cally, additional data were collected from the
Congressional Quarterly Almanac, 1968. These data are the roll-call votes of all winners of the 1966 Congressional elections on the same is- sues which constitute our pre-election data.22
Table 6 illustrates the relationship between the nonincumbents' pre-election attitudes and subsequent roll-call behavior on selected domes-
2' There were no roll calls comparable to the foreign affairs, labor, or voting rights items of the pre-election scale. Therefore, in the tables that follow, these items have been dropped from the initial measures. The in- cluded roll calls are listed in Appendix B. It should also be noted that the foreign affairs data are ques- tionnaire responses for both incumbents and nonin- cumbents (see Appendix A). Therefore, although we cannot examine the linkage condition in foreign affairs, the methodological question of comparability does not arise.
Table 7. Relationship Between Scale Positions on Pre-Election and Postelection Roll-Call Behavior: Incumbents, Domestic Issues
* Among the 356 incumbent winners, there were no postelection data for four: both Younger (R-Calif.) and Fogarty (D-R.T.) had died, Powell (D-N.Y.) was excluded from the House, and McCormack (D-Mass.), as Speaker, did not vote.
This content downloaded on Tue, 29 Jan 2013 01:40:13 AMAll use subject to JSTOR Terms and Conditions
1972 Electoral Choice and Popular Control of Public Policy 1263
tic issues. Table 7 illustrates the relationship be- tween the incumbents' roll-call behavior before the election and their postelection behavior on the same issues.23 The relationship is very strong for the incumbents, while it is moder- ately strong for the nonincumbents. This differ- ence requires a note of caution regarding the assumption of strict comparability of the ques- tionnaire and pre-election roll-call data, at least on domestic welfare issues. But clearly the rela- tionship, when compared with Wicker's dismal conclusion, is considerably stronger than his upper limit of .30.
Generally the winners voted as our pre- election scores indicated they would. Among
23 Gamma is stronger than Sommer's d, because it ignores all ties. It considers only the concordant and discordant pairs, while Somer's d, is penalized for every case in which the dependent variable varies but the independent variable does not vary. The actual theoretical relationships of Tables 7-10 are probably overestimated by the strength of gamma because if two cases are tied on one variable but not on the other, they ought not to be ignored unless the theory predicts that this should happen. This is not the case here. Conversely, Somer's d probably underestimates the relationship because some of the cases which lower Somer's dy, cases which differ on the dependent vari- able but not on the independent variable, do so because of measurement error. Two nonincumbents whose pre- election scores are 8 on domestic issues might be ex- pected to differ in postelection behavior because the intermediate option is not so easily taken on roll calls as it is on questionnaires, and their reasons for hedging on one issue in the pre-election questionnaire may be quite different, leading to a different postelection roll- call decision. Somer's d~., is included, however, to illus- trate the range of values obtained, depending on the method of handling ties. Somer's d, was selected over den, which is reduced by cases which vary on the in- dependent but not the dependent variable, because of the nature of the two different kinds of measurement. The questionnaire allowed more options than a roll -all, in that abstention on a roll call is more difficult than selecting the intermediate option on a question- iaire. Therefore, the situation of variation on the in- dependent variable coupled with ties on the dependent variable is slightly more likely to occur than is variation on the dependent variable coupled with ties on the independent variable.
Table 8. Actual Congress, Frequency of Postelection Roll-Call Scores, Domestic Issues
Table 9. Relationship Between Scale Scores on Pre- Election Attitudes and Postelection Roll-Call Behavior: Nonincumbents, Open Housing
Pre-election Attitude Scale Scores 1 2 3 Totals
Postelection 1 15 7 7 29 Roll-Call 2 0 0 1 1
Scale Scores 3 4 6 39 49
Totals 19 13 47 79
gamma= .80 Somer's dxy=.58
the nonincumbents, there are 11 winners whose postelection score is two or more points more liberal than their pre-election scores. There are 9 whose postelection scores are two or more points more conservative than their pre-election scores. The figures for incumbents are 88 more liberal and 16 more conservative, illustrating a shift in the liberal direction. This shift was strong enough to cause slippage between the representation some voters might be expected to believe they would get and what they actu- ally received on domestic legislation, but it was not sufficient to alter the moderate-conservative balance of power predicted on the basis of pre- election scores, as evidenced by Table 8. (Com- pare Table 8 to the winners column of Table 5.) Therefore, although individual voters may have been misled, the aggregate effect of such crossovers was not extensive enough to affect domestic policy. We may thus conclude that on domestic welfare issues the data support both the methodological contention that the pre- election data are comparable, and the substan- tive and theoretical contention that the pre- election candidate differences lead to postelec- tion policy differences.
Table 10. Relationship Between Scale Scores on Pre- Election and Postelection Roll-Call Behavior:
Incumbents, Open Housing
Pre-election Roll-Call Scale Scores 1 2 3 Totals
Postelection 1 169 3 25 197 Roll-Call 2 3 1 5 9
Scale Scores 3 9 0 137 146
Totals 181 4 167 352
gamma= .97 Somer's dy =.78
This content downloaded on Tue, 29 Jan 2013 01:40:13 AMAll use subject to JSTOR Terms and Conditions
1264 The American Political Science Review Vol. 66
Table 11. Actual Congress, Frequency of Postelection Roll-Call Scores, Civil Rights
Score N
1 liberal 226 2 moderate 10 3 conservative 195
431
Mean 1.9 Median I
Tables 9 and 10 present the relationships be- tween pre-election and postelection measures on open housing for nonincumbents and in- cumbents, respectively. Again, the measures of association for the incumbents are higher, al- though they are also very high for the nonin- cumbents. This finding indicates a very strong link between attitudes and behavior, and com- parability of the pre-election measures in the area of civil rights. The inferences about civil rights policy in the section on hypothetical Congresses seem to be supported. Generalizing the strength of the attitude-behavior relation- ship to those nonincumbents who lost, one can readily see that they would have voted as their attitudes indicated they would.
Unlike the shifts on domestic welfare, the shifts on civil rights were sufficient to affect policy. Fifteen nonincumbents shifted in the liberal direction, ten in the conservative direc- tion; the figures for the incumbents are 33 vs. 12. As Table 11 illustrates, this shift resulted in a balance of power favoring the liberals (i.e., the bill passed). When compared to the balance of power predicted before the election (winners column and marginal, Table 4; pre-election at- titudes, Tables 9 and 10) this change represents a shift from the moderate position. A shift on civil rights was to be expected, as this was a roll-call vote with only abstention representing a middle alternative. Therefore we have the paradoxical situation in which pre-election atti- tude is a better predictor of roll-call behavior on civil rights than on domestic welfare issues, yet the fewer civil rights crossovers result in a new balance of power. This result is entirely due to the precarious balance of power on civil rights issues, plus the events, such as the assas- sination of Dr. Martin Luther King, which in- fluenced the passage of the Open Housing Act of 1968.
Summary and Discussion This paper essentially presents three simple
findings: (1) that the electorate in the aggre- gate was offered a substantively significant choice in the Congressional election of 1966, (2) that winning candidates in that election generally voted as their pre-election issue posi- tions predicted, and (3) that the Democratic candidates were almost invariably more liberal than their intradistrict Republican competitors.
These simple empirical findings have broad implications for democratic theory. Concerning the linkage question, the data suggest that the relatively weak linkage between public opinion and policy outputs is neither a result of the party system's failure to provide choices on is- sue positions nor of the system's providing oral choices later ignored in roll-call behavior. The voters could have established a strong overall linkage.
The findings also fuel the discussion about voter rationality. In all three cases, the most liberal Congress is very similar to the Congress composed of Democrats and unchallenged Re- publicans. Similarly, the most conservative Congress resembles the most Republican Con- gress. Only 19 of the Republican candidates were more liberal than their Democratic oppo- nents on the overall scale, even though they may have been more liberal than many Demo- cratic candidates in other districts. This finding has interesting implications in light of studies which have bemoaned the electorate's suppos- edly limited awareness of public affairs and the limited extent of policy-oriented voting. If a voter in 1966 wanted to vote conservatively, he only had to know that the Republican party is generally more conservative than the Demo- cratic party in order to cast his ballot correctly in light of his values. If our findings may be generalized to other elections, party may be said to provide a valid cue for the policy-ori- ented voter who does not have a thorough awareness of the issues or the policy positions of the candidates.
If informational costs for policy-oriented voters are so low, why did Miller and Stokes fail to find strong linkages between public opin- ion and public policy? Perhaps one answer lies in the way rationality has been defined, namely in terms of a liberal-conservative scale on na- tional issues. Although we have found that Congressional candidates' attitudes do scale un- idimensionally along a liberal-conservative di- mension, there is little evidence that mass atti- tudes fall along the same continuum. This sug- gests not that mass attitudes are in some way irrational but that candidates' attitudes are tc some extent inconsistent with the attitudes ot many voters. For example, a voter may be
This content downloaded on Tue, 29 Jan 2013 01:40:13 AMAll use subject to JSTOR Terms and Conditions
1972 Electoral Choice and Popular Control of Public Policy 1265
hawkish, anti-civil rights, and a proponent of liberal domestic programs. He may have to choose between a Democrat who is more lib- eral than his opponent in all three cases, and a Republican who is more conservative in all three policy areas. By our scale, this citizen has a wide choice. But the choice is not easy, for he must choose on the one hand to support civil rights policies and foreign policies that he really opposes, or on the other to help defeat domestic programs he supports. Either way this voter's ability to help forge a linkage between public opinion and public policy is limited.
To reiterate: We have examined choice only in terms of a liberal-conservative dimension, not in terms of whatever dimensions seem most relevant to individual voters. There is evidence which suggests that from the voters' own points of reference, their behavior is quite rational.24 The crux of the matter is that even though the electorate is presented with a choice in elite at- titudes, elite attitudes seem to be ordered along a different dimension than are mass attitudes.25 Therefore the linkage must of necessity be weak on some issues whether voters are issue- oriented or not.26
Another factor weakening the linkage be- tween public opinion and public policy is the large number of safe districts where the chal- lenger has no realistic chance of winning.27 Us-
21 Michael J. Shapiro, "Rational Political Man: A Synthesis of Economic and Social-Psychological Per- spectives," American Political Science Review, 63 (December, 1969), 1106-1119.
"Steven R. Brown and Richard W. Taylor, "Ob- jectivity and Subjectivity in Concept Formation: Prob- lems of Perspective, Partition, and Frames of Refer- ence," paper delivered at the sixty-sixth annual meeting of the American Political Science Association, Los Angeles, California, September, 1970.
21 Miller and Stokes, p. 50, report correlations be- tween constituency majority and congressional roll-call votes of 0.4, and between district majority and nonin- cumbent candidate attitudes of -0.4, in the social wel- fare policy domain. This suggests that within the con- fines of the amount and kind of choice presented, the masses are indeed selecting those elites whose attitudes are most congruent with their own. The fact that the congruency is not higher may be due primarily to the differing attitudinal structures of elites and nonelites.
I7lf the electorate votes primarily on the basis of party identification and if these identifications are un- evenly distributed within a large percentage of dis- tricts, the result is a lack of intradistrict competition. If this uneven distribution of identifications reflects an equally uneven distribution of opinions and prefer- ences on issues, then linkage could occur without a choice of candidates who differ in their issue positions. Therefore the optimal amount of choice in each dis- trict would depend on its internal distribution of opinion. Since data of this nature are not available, this analysis has focused on the systemic, rather than dis- trict, consequences of choice. From this framework, the more choice, the greater the opportunity for the elec- torate as a whole to exercise control over policy.
ing the criterion that if more than 55 per cent of the vote goes to the winner, the district is noncompetitive, we found that only 73 of the 435 districts both were competitive and offered a policy choice. To quote Turner, "The alterna- tive candidates must have nearly equal chances of success in the election, or else the voter is not presented with realistic alternatives."" As our data clearly show, the opportunity to affect policy outcomes via the electoral process cer- tainly existed in 1966. To verify this linkage condition in no way vitiates the somewhat dif- ferent but related point that the probability that the electoral process would affect policy in 1966 was somewhat lower.
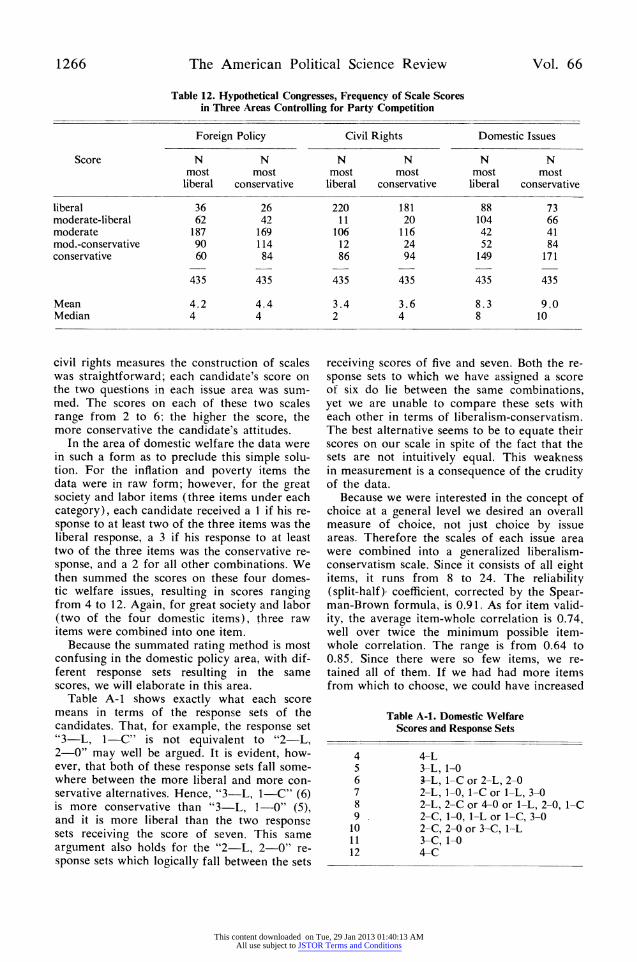
To illustrate this point, the most liberal and most conservative Congresses were recomputed in all three issue clusters, assuming that a non- competitive district offered a choice of zero re- gardless of how much the competing candidates may have differed. The results are presented in Table 12.
This makes it clear that although the "outer limits" of choice in the election were sufficient to verify the linkage condition in question, the realities of party competition narrowed these limits considerably. Realistically, the most the election meant was the difference between a lib- eral vs. moderate balance of power on civil rights and a mdderate-conservative vs. moder- ate balance of power on domestic issues. Re- gardless of the outcome of the election, given the large number of relatively safe districts, the balance of power had to reside with the moder- ates on foreign policy.29 This finding merely serves to clarify the nature of our analysis. We have not found that the 1966 election signifi- cantly affected public policy. Rather we have found that the opportunity for it to affect pol- icy was present, and that this opportunity is all that is necessary to provide a means of policy control for the electorate.
tions of which position was the liberal position on any given issue, we coded the candidates' policy positions as 1 = liberal, 2 = other or, in some cases, moderate, and 3 = conservative. Then three scales were constructed in the gen- eral areas of foreign affairs, civil rights and domestic welfare. For the foreign affairs and
"Turner, "Primary Elections," p. 198. 29In all three issue clusters, the actual Congress re-
sembles the most conservative Congress probable, given the existence of a large number of safe districts. To the extent that it makes sense to label an election a liberal or a conservative victory, the 1966 House elec- tion was a conservative victory.
This content downloaded on Tue, 29 Jan 2013 01:40:13 AMAll use subject to JSTOR Terms and Conditions
civil rights measures the construction of scales was straightforward; each candidate's score on the two questions in each issue area was sum- med. The scores on each of these two scales range from 2 to 6; the higher the score, the more conservative the candidate's attitudes.
In the area of domestic welfare the data were in such a form as to preclude this simple solu- tion. For the inflation and poverty items the data were in raw form; however, for the great society and labor items (three items under each category), each candidate received a 1 if his re- sponse to at least two of the three items was the liberal response, a 3 if his response to at least two of the three items was the conservative re- sponse, and a 2 for all other combinations. We then summed the scores on these four domes- tic welfare issues, resulting in scores ranging from 4 to 12. Again, for great society and labor (two of the four domestic items), three raw items were combined into one item.
Because the summated rating method is most confusing in the domestic policy area, with dif- ferent response sets resulting in the same scores, we will elaborate in this area.
Table A-1 shows exactly what each score means in terms of the response sets of the candidates. That, for example, the response set "3-L, 1-C" is not equivalent to "2-L, 2-0" may well be argued. It is evident, how- ever, that both of these response sets fall some- where between the more liberal and more con- servative alternatives. Hence, "3-L, 1-C" (6) is more conservative than "3-L, 1--O" (5), and it is more liberal than the two response sets receiving the score of seven. This same argument also holds for the "2-L, 2-0" re- sponse sets which logically fall between the sets
receiving scores of five and seven. Both the re- sponse sets to which we have assigned a score of six do lie between the same combinations, yet we are unable to compare these sets with each other in terms of liberalism-conservatism. The best alternative seems to be to equate their scores on our scale in spite of the fact that the sets are not intuitively equal. This weakness in measurement is a consequence of the crudity of the data.
Because we were interested in the concept of choice at a general level we desired an overall measure of choice, not just choice by issue areas. Therefore the scales of each issue area were combined into a generalized liberalism- conservatism scale. Since it consists of all eight items, it runs from 8 to 24. The reliability (split-half)- coefficient, corrected by the Spear- man-Brown formula, is 0.91. As for item valid- ity, the average item-whole correlation is 0.74, well over twice the minimum possible item- whole correlation. The range is from 0.64 to 0.85. Since there were so few items, we re- tained all of them. If we had had more items from which to choose, we could have increased
Table A-1. Domestic Welfare Scores and Response Sets
4 4-L 5 3-L, 1-0 6 3-L, 1-C or 2-L, 2-0 7 2-L, 1-0, 1-C or 1-L, 3-0 8 2-L, 2-C or 4-0 or 1-L, 2-0, 1-C 9 2-C, 1-0, 1-L or 1-C, 3-0
10 2-C, 2-0 or 3-C, 1-L 11 3-C, 1-0 12 4-C
This content downloaded on Tue, 29 Jan 2013 01:40:13 AMAll use subject to JSTOR Terms and Conditions
1972 Electoral Choice and Popular Control of Public Policy 1267
the average item-whole correlation by throwing out the less valid items. In view of this fact, plus the past failure of items to scale across is- sue areas, the magnitude of these validity and reliability coefficients is surprising.
Variation in the amount of choice per dis- trict could possibly be a function of the ex- tremeness of the responses. If the incumbent in a district is either extremely liberal or ex- tremely conservative, there is a chance for that district to have a very high degree of choice. On the other hand, if the incumbent is a mod- erate, there is no opportunity for an extremely high amount of choice. But since the correla- tion between extremity of scale position and choice is only 0.06, this explanation of varia- tion in choice is vitiated.
Text of Questionnaire Items and Roll Calls I. Foreign Affairs A. VIET NAM: In regard to U.S. involvement in
the war in Viet Nam, which position is closest to your own? (Asked of all candidates.) 1. More emphasis on peace talks, increased
steps toward de-escalation of the conflict and eventual accommodation with the Viet Cong.
2. The basic course which the U.S. has fol- lowed.
3. More decisive military action by the U.S. to meet Communist aggression and achieve victory in the war.
B. RED CHINA: Below are three general courses of possible U.S. policy on Red China. Please check the one which corresponds most closely with your own position. (Asked of all candidates.) 1. Reduced isolation of Red China with such
steps as U.S. recognition, admission to the United Nations, and increased trade.
2. A middle course close to existing U.S. policy. 3. Stricter military and economic confinement
of Red China.
II. Civil Rights A. VOTING RIGHTS: Would you have supported the
1965 Voting Rights Act? (Asked of challengers only.) 1. Yes 2. Other 3. No.
Incumbents: H.R. 6400, Voting Rights Act. Passed July 9, 1965, 333-85. Vote of mem- ber on final passage. 1. Yea (or paired yea or otherwise made in-
tentions known) 2. Absent 3. Nay (or paired nay or otherwise made in-
tentions known)
B. OPEN HOUSING: Would you have supported the modified version of President Johnson's proposal to prohibit discrimination in the sale or rental of real estate, as reported for House consideration in July, 1966? (Asked of challengers only.)
1. Yes 2. Other 3. No
Incumbents: H.R. 14765, Civil Rights Act. De- feated August 9, 1966, 190-222. Vote of mem- ber on motion to delete Title IV (open hous- ing).
1. Nay 2. Absent 3. Yea
III. Domestic Welfare A. INFLATION: If inflationary pressures from the
Viet Nam war absolutely require corrective federal action, would you: (Asked of incum- bents and challengers.)
1. Oppose cuts in domestic spending as an anti-inflationary measure.
2. Other 3. Support cuts in domestic spending as an
anti-inflation measure.
B. POVERTY: Do you favor major cuts in expendi- tures for President Johnson's "war on poverty"? (Asked of challengers only.)
1. Oppose cuts 2. Other 3. Favor cuts
Incumbents: H.R. 15111, Equal Opportunity Amendments. Defeated September 29, 1966, 156-208. Vote of member on motion to strike the enacting clause (thereby killing the bill).
1. Nay 2. Absent 3. Yea
C. GREAT SOCIETY: a. Rent Supplements: What is your position on
the Johnson Administration's program of rent supplements for low income families? (Asked of challengers only.)
1. Favor 2. Other 3. Oppose
Incumbents: H.R. 14921, Supplemental Ap- propriations. Passed May. 10, 1966, 192- 188. Vote of member on amendment to provide $20 million in rent supplement contractual authority. 1. Yea 2. Absent. 3. Nay
b) Teacher Corps: Do you support the fed- erally financed Teacher Corps to improve school education in slums and other im- poverished areas, proposed by the Johnson Administration and first authorized in 1965? (Asked of challengers only.)
1. Support 2. Other 3. Oppose
Incumbents: H.R. 9567, Higher Education Act of 1965. Defeated October 20, 1965, 152-226. Vote of member on motion to send the bill back to conference with in- structions to delete the Teacher Corps. 1. Nay 2. Absent 3. Oppose
c) Demonstration Cities: Do you favor the Johnson Administration proposal for $2.4 billion for a six-year program of federal aid to major cities to help them eliminate ur- ban blight? (Asked of challengers only.) 1. Favor 2. Other 3. Oppose
This content downloaded on Tue, 29 Jan 2013 01:40:13 AMAll use subject to JSTOR Terms and Conditions
1268 The American Political Science Review Vol. 66
Incumbents: S. 3708, Demonstration Cities and Metropolitan Development Act of 1966. Passed October 20, 1966, 178-141. Vote of member on passage of the bill au- thorizing "demonstration city" grants for community renewal. 1. Yea 2.- Absent 3. Nay
D. LABOR
a) Taft-Hartley: Do you favor repeal of Sec- tion 14(b) of the Taft-Hartley Law, which permits state "right-to-work" laws? (Asked of challengers only.) 1. Favor 2. Other 3. Oppose
Incumbents: H.R. 77, Repeal of 14(b). Passed July 28, 1965, 22f-203. Vote of member on final passage. 1. Yea 2. Absent 3. Nay
b) Minimum wage: Do you favor the John- son Administration proposal to extend mini- mum wage laws to millions of additional workers and increase the minimum wage to $1.60 by the end of the decade? 1. Favor 2. Other 3. Oppose
Incumbents: H.R. 13712, Minimum Wage Amendments. Passed May 26, 1966, 205- 194. Vote of member on amendment to de- lay for one additional year, until February 1, 1969, the second stage of the minimum wage increase from $1.40 to $1.60 an hour for workers covered under existing law. 1. Nay 2. Absent 3. Yea
c) Unemployment Compensation: Do you fa- vor the proposals of the Johnson Adminis- tration, backed by organized labor, to es- tablish federal standards for unemployment compensation benefits the states must pay, and to widen coverage of the program? (Asked of all candidates. The bill referred to, H.R. 8282, did not survive to the roll- call stage.) 1. Favor 2. Other 3. Oppose
Appendix B: Postelection Measurements The roll calls listed below were utilized in
our measurement of the postelection behavior of the 1966 Congressional winners. The three domestic welfare measures-the inflation item, the poverty item, and the great society items (scored the same way as the pre-election great society items)-were combined into a scale running from 3 to 9. The average item-whole correlation is .92, well above the minimum pos- sible.
I. Civil Rights: H.R. 2516, Open Housing Act. Passed April 10, 1968. Vote of member on motion to order the previous question on H.R. 1100, thereby bringing the measure to a vote with no opportunity to alter the language and -in effect-expressing the House's desire to accept the Senate's open housing and other amendments without change.
1. Yea (or paired yea or otherwise made inten- tions known)
2. Absent 3. Nay (or paired nay or otherwise made inten-
tions known)
II. Domestic Welfare A. INFLATION: H.R. 888, Continuing Appropria-
tions. Passed October 18, 1967, 238-164. Vote of member on amendment continuing expendi- ture authority for government agencies whose appropriations bill had not passed Congress; providing that no government agency could spend more in fiscal 1968 than it spent in fiscal 1967, with a few exceptions. 1. Nay 2. Absent 3. Yea
B. POVERTY: S. 2388, Antipoverty bill. Passed November 15, 1967, 221-190. Vote of member on motion to recommit the bill with instruc- tions to reduce the fiscal 1968 authorization by $460 million. 1. Nay 2. Absent 3. Yea
C. GREAT SOCIETY: a) Rent Supplements: H.R. 9960, Independent
Offices and Department of Housing and Urban Development Appropriations Act. Passed May 17, 1967, 232-171. Vote of member on amendment to delete language permitting the government to sign 40-year contracts with private nonprofit housing sponsors to pay an additional $10 million a year in rent supplements for low income families. 1. Nay 2. Absent 3. Yea
b) Teacher Corps: H.R. 10943, Teacher Edu- cation. Defeated June 27, 1967, 146-257. Vote of member on motion to recommit the bill with instructions to strike the teacher corps provisions. 1. Nay 2. Absent 3. Yea
c) Demonstration Cities: H.R. 9960, Supple- mental Appropriations. Defeated May 17, 1967, 193-213. Vote of member on mo- tion to recommit the bill to the House Ap- propriations Committee with instructions to delete $75 million for urban renewal in model city project areas and $150 million for other model city grants. 1. Nay 2. Absent 3. Yea
This content downloaded on Tue, 29 Jan 2013 01:40:13 AMAll use subject to JSTOR Terms and Conditions