UNITED STATES TARIFF COMMISSION SUMMARIES OF TRADE AND TARIFF INFORMATION Prepared in Terms of the Tariff Schedules of the United States (TSUS) Schedule 5 Nonmetallic Minerals and Products (In 5 volumes) Volume 1 Cement, Concrete, Lime, Gypsum, Stone, Mica, Graphite, Asbestos, Abrasives, and Products Thereof TC Publication 2 9 3 Washington, D. C. 1969
Transcript
UNITED STATES TARIFF COMMISSION
SUMMARIES OF TRADE AND TARIFF
INFORMATION
Prepared in Terms of the Tariff Schedules of the United States (TSUS)
Schedule 5
Nonmetallic Minerals and Products (In 5 volumes)
Volume 1
Cement, Concrete, Lime, Gypsum, Stone, Mica, Graphite, Asbestos, Abrasives, and
Products Thereof
TC Publication 2 9 3 Washington, D. C.
1969
SUMMARIES OF TRADE AND TARIFF INFORMATION BY SCHEDULES
Schedule 1 - Animal and Vegetable Products (In 14 volumes) ·
Schedule 2 - Wood and Paper; Printed Matter (In 5 volumes)
Schedule 3 - Textile Fibers and Textile Products (In 6 volumes)
Schedule 4 - Chemicals and Related Products (In 12 volumes)
Schedule 5 - Nonmetallic Minerals and Products (In 5 volumes)
St!heduJ~ 6 ,., Metals and Metal Products (lri 11 volumes)
~~l1~t}u1~ "I - S~.ci:fi~d Products; Miscellaneous and None-numerated Products (In 8 volumes)
~ch~dule 8 - Spt:cial Clas[~ification Provisions (In 1 volume)
2 - Gems, Gemstones, Industrial Diamonds, Clays, Fluorspar, Talc, and Miscellaneous Nonmetallic Minerals and Products Thereof
3 - Refractories; Ceramic Construction, Household, and Industrial Articles
4 "' Pressed and Blown Glassware 5 - Flat Glass and Products; and Other Glass Products Used
Primarily in Construction
FOR.F:WORD
In an address delivered in Boston on May 18, 1917, Frank W. Taussig, dlst.inguished .fj rst chaj rman of the Tariff Commission, delineated the respons:ibility of the newly established Commission to operate as a source of objective, factual information on tarlffs and trade. Ile stated that the Comrrd ssion was alre::i.dy preparing a catalog of tar:i ff informat:lon--
designed to have on hand, in compact and simple form, all available data on the growth, development, and location of industries affected by the tariff, on the extent of domestic productioD, on the extent of imports, on the conditions of competition between domestic .and foreign products.
The flrst such report was issued in 1920. Subsequently three series of summaries of tariff lnformation on commodities were published--in 1921, 1929, an~ l948-50. The current series, entitled Summaries of Trade and Tariff Information, presents the information in terms of the tariff items provided for in the eight tariff schedules of the Tariff Schedules of the United States (TSUS), which on August 31, 1963, replaced the 16 schedules of the Tariff Act of 1930.
Through its professional staff of commodity specialists, economists, lawyers, statisticians, and accountants, the Commission follows the movement of thousands of articles in international commodity trade and during the years of its existence has built up a .reservoir of · knowledge and understanding not only with respect to imports but also regarding products and their uses, techniques of manufacturing and processing, commercial practices, and markets. Accordingly, the Commission believes that the current series of summaries, when completed, will be the most comprehensive publication of its kind and will present benchmark information that will serve many interest::;. This. project, although encyclopedic, attempts to conform with Chairman Taussig 1 s admonition to be "exhaustive in inquiry, and at the same time brief and discriminating in statement."
This series is being published in 62 volumes of summaries, each volume to be issued as soon as completed. Although the order of publication may not follow the numerical sequence of the items in the TSUS, all items are to be covered. As far as practicable, each volume reflects the most recent developments affecting U.S. foreign trade in the commodities included.
iii
SUMMAlUES OF 'l'RADE AND 'l'ARH'F INIPORMA'rION
SCHEDULE 5
Volume 1
C 0 N 'l' E N T S
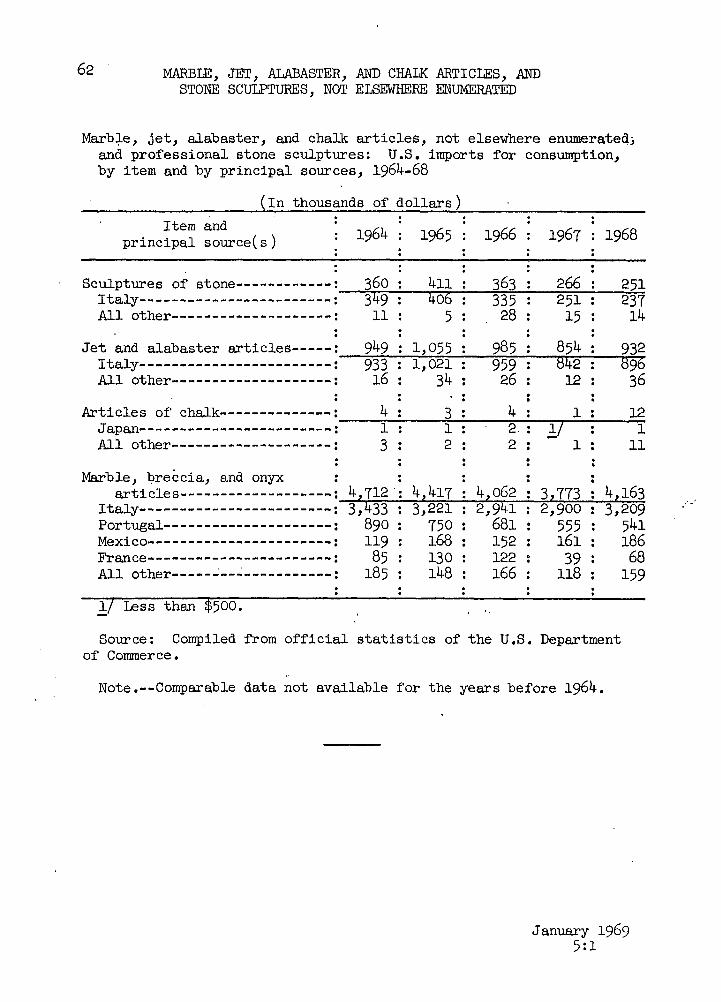
Foreword----------------------------------------------------------- iii Introduction------------------------------------------------------- 1 Hydraulic cement and cement clinker-------------------------------- 5 Concrete mixes and articles of concrete---------------------------- 17 Lime--------------------------------------------------------------- 25 Gypsum rock and gypsum plaster------------------------------------- 31 Articles of plaster of Paris--------------------------------------- 39 Sand and gravel---------------------------------------------------- 45 Crushed or ground stone-------------------------------------------- 53 Marble, jet, alabastet, and chalk articles, and stone sculptures
not elsewhere enumerated-----~----------------~------------------ 59 Stone, crude, and not suitable for use as monumental, paving, or
building stone--------------------------·------------------------- 63 Monumental, paving, and building stone----------------------------- 69 Articles of stone, not elsewhere enumerated------------------------ 85 Quartzite-------------------------------------------------------~-- 89 Slate, and articles of slate-------------------------~------------- 93 Mica, not manufactured, and mica film and splittings--------------- 97 Waste and scrap mica-----------------------------------~----------- 107 Mica, cut or stamped to dimensions, shape, or form----------------- 113 Mica, ground or pulverized----------------------------------------- 121 Built-up mica and articles of mica, not elsewhere enumerated------- 127 Carbon and graphite products--------------------------------------- 133 Graphite, natural-------------------------------------------------- 143 Calcined petroleum and coal coke not suitable for fuel------------- 151 Carbon or graphite crucibles--------------------------------------- 155 Asbestos, not manufactured----------------------------------------- 159 Asbestos textile products------------------------------------------ 167 Articles in part of asbestos and hydraulic cement------------------ 173 Asbestos articles-------------------------------------------------- 181 Burrstones, whetstones, hones, oilstones, and solid natural
stone wheels----------------------------------------------------- 185 Pumice and articles of pumice-------------------------------------- 189 Abrasives, natural and artificial---------------------------------- 199
v
vi CONTENTS
Coated abrasives-----------------------------'."'--------------------- 211 Abrasive wheels and other abrasive articles, not elsewhere
Appendix A. Tariff Schedules of the United States: General headnotes and rules of interpretation, and excerpts relating to the items included in this volume------- A 1
Appendix B. Value of U.S. imports for consumption, by TSUS items included in the individual summaries of this volume, total and from the 3 principal suppliers, 1967------- B 1
Appendix C. Value of U.S. imports for consumption, by TSUS items included in the individual summaries of this volume, total and from the 3 principal suppliers, 1968------- C 1
This volume, identified as volume 5:1, is one of a series ·of five· volumes on the nonmetallic minerals and products classified under schedule 5 of the Tariff Schedules of the United States (TSUS). Schedule 5 is divided into three parts, and this volume is one of two volumes that deal with the nonmetallic' minerals and products classified in part 1 of schedule 5.
. This volume comprises 31 summaries covering all nonmetallic minerals and products classif.iable under subparts A, B, c, D, E, F, and G of part 1 of schedule 5, as well as carbon or graphite crucibles (item 531.33) classifiable under subpart A of part 2 of schedule 5. The complete list of these nonmetallic minerals and products is included in appendix A to this volume.
" Subpart A covers hydraulic cements, concrete mixes, and concrete products. In 1968, N.S. imports of hydraulic cements were valued at about $17.5 million, and imports of concrete· mixes and articles of concrete, at $1.4 million; these imports are small compared with total domestic consumption in that year, amounting to $1.3 billion and $2.4 billion, respectively. Most of the imports of concrete articles consisted of terrazzo tile and cement tile, collectively termed 11 concrete tile, 11 which is less than 1. 25 inches in thickness •.
Subpart B covers lime, gypsum rock, gypsum plaster, and articles, not specially provided for, of plaster of Paris. Of these, only imports of gypsum rock are important; the value of annual imports of gypsum rock ranges from $10 million to $15 million, compared with an annual domestic output valued at about $35 million. Imported gypsum rock is used at plants producing gypsum products in or near populous areas on the Atlantic, gulf, and Pacific coasts; virtually all of these plants were so located with the expectation of using imported gypsum rock. This subpart does not cover gypsum or plaster building boards and lath (see part 3 of schedule 2).
Subpart C covers stone and stone products, with certain excep~ tions, as follows: Limestone to be used in the manufacture of fertilizer; articles of concrete in which stone chips or particles are used as aggregate; certain abrasives and abrasive stones; precious and semiprecious stones; talc, soapstone, or Cornwall stone; and certain articles provided for in schedule 7. Total imports in 1968 of products covered by this subpart were valued at $26 million; the largest share of these imports consisted of marble and marble articles, mainly from Italy, with smaller amounts of slate articles from Italy, crushed stone from Canada, and miscellaneous stone products mainly from Italy, Canada, and Portugal. The value of domestic production of stone and stone products exceeds $1 billion annually.
February 1969 5:1
2 INTRODUCTION
Subpart D covers natural and synthetic mica and mica products, including ground mica. The principal import items in this subpart are mica splittings, split block mica, and cut or stamped mica. India and Brazil are the major sources of these iterrs. With the exception of waste and scrap and ground mica, the United States is dependent on imports for its supply of mica.
Subpart E covers artificial and natural graphite, calcined petroleum and coal coke, carbon or graphite electrodes and lighting carbons, carbon or graphite crucibles, and articles, not specially provided for, of carbon or graphite. By far the largest import item in this subpart is carbon or graphite electrodes for electric furnaces or electrolytic purposes; imports of such electrodes, largely from Japan, were valued at more than $7 million in 1968, and constituted possibly 10 to 15 percent of total consumption.
Subpart F covers asbestos and asbestos products, with the exception of asbestos-containing footwear, headwear, gloves, laminated or reinforced plastics, and certain other articles provided for in schedule 7. Of the 81 million dollars' worth of imports in 1968 under this subpart, nearly 73 million dollars• worth consisted of asbestos fiber of di!ferent types and grades; 90 percent of the value of the imported asbestos fiber was accounted for by Canada, and most of the remainder, by the Republic of South Africa. Production of asbestos fiber in the United States has more than doubled in the past 5 years and now has an annual value of about $11 million. Moderate amounts of asbestos textiles, asbestos cement articles, and other asbestos products also were imported.
Subpart G covers pumice and certain other crude minerals (whether or not such minerals are of abrasive quality) cqmm9nly used for making abrasives and abrasive articles, certa.in minerals and artificial abrasives in forms suitable for use as abrasives or for abrasive purposes, coated abrasives, abrasive wheels, and other articles used for abrasive purposes. This subpart excludes the following: Sand, and crushed or powdered glass, unless made up into abrasive articles; natural or synthetic diamond dust or powder; cosmetics and other toilet pr_eparations; soap and synthetic detergents; wheels or other abrasive articles mounted in frameworks or machines; dental burrs; and tools to which abrasives have been applied but which have other functioning or working elements such as cutting teeth, edges, grooves, and flutes. As used in this subpart, the term "pumice" includes both pumice and pumicite, and the term "wheels" embraces rotary cutters, disks, and other circular bodies designed to rotate on a central axis.
By far the major part of the imports classifiable under subpart G consist of the artificial abrasive materials aluminum oxide and silicon carbide in the crude state; most of this material comes from Canada, where it is produced largely by U.S. firms or subsidiaries thereof.
February 1969 5:1
INTRODUCTION 3
In addition to about 31 million dollars' worth of crude aluminum oxide and silicon carbide, or substantially all of those materials consumed in the United States, about 3 million dollars' worth of ground or refined aluminum oxide and silicon carbide was imported in 1968. Other abrasive products imported in moderate amounts include coated abrasives and abrasive wheels. Some pumice is imported for abrasive use, but most imported pumice is used as an aggregat~ in concrete products.
The United States exports small to moderate quantities of some of the materials and products classifiable under the several subparts covered in this volume, principally calcined petroleum coke, various stone products, portland cement, coated abrasives, various asbestos products, and abrasive wheels.
The TSUSA (1969), pertinent sections of which are reproduced in appendix A to this volume, shows the concessions granted by the United States in the .. ta.riff negotiations concluded on June 30, 1967, commonly referred to as the Kennedy Round. Under the Trade Expansion Act of 1962 (76 Stat. 872), most U.S. concessions involving reductions in duty are to be placed in effect in five stages.· The first stage became effective on January 1, 1968, the second on January 1, 1969, and subsequent stages will go into effect at annual intervals. In 1967 the imports of the products included in this volume on which concessions were granted were valued at about $69 million and were dutiable at rates which averaged about 8.7 percent ad valorem. If ~he duties on these 1967 imports had been assessed on the basis of the final stage rates rather than the 1967 rates, the comparable average ad valorem rate would have been 3,9 percent; in other words, the total amount of the duty would have been reduced by about 55 percent. (The overall reduction .exceeds the usual 50 percent principally because the duties on two important items, standard portland cement and lime, will be completely eliminated.) In 1968 the imports of the products included in this volume on which concessions had been granted were valued at $75 million and were dutiable at rates which averaged about 7,5 percent ad valorem,
Note.--For the statutory description, see the Tariff Schedules of the United States Annotated ( '.rSUSA-1969).
U.S. trade position
5
. Although the United States is on a net import basis with respect to hydraulic cement, total imports (valued at about $16 million a year during 1966-68) generally supply between 1 percent and 2 percent of total consumption.
Description and uses
Hydraulic cement is a finely ground mineral bonding agent. When water is added to it, a chemical reaction occurs which causes the growth of numerous interlocking mineral crystals, resulting in a stonelike product called concrete, which is resistant to disintegration in water or under ordinary conditions of impact and abrasion. In the preparation of most hydraulic cements, a properly proportioned natural or prepared mixture of limestone, clay, silica, and other ra~ materials is burned in a rotary or vertical kiln. The kiln product, in the form of balls or lumps known as clinker, is pulverized along with a small amount of gypsum to obtain the final product.
There are four major kinds of hydraulic cement--portland (includ-, ing white, nonstaining cement), natural, puzzolan, and masonry cement. Not included in this summary are such hydraulic materials as lime and gypsum plasters and o:xychloride cements, all of which are provided for elsewhere in the TSUS. Portland cement has accounted for about 95 percent of domestic production and for virtually all imports in recent years.
The Federal Government and the American Society for Testing arid Materials recognize five types of portland cement. Type I (also called standard or general use) accounts for the great bulk of the portland cement used in construction work because it is the cheapest and most widely available cement having the qualities and.properties necessary for that type of application. Moreover, Type I is a hit;i)lly standardized product that varies little either from pla.rlt to plant or from country to country because of the close chemical and process control used in its manufacture. Hence, domestic and imported Type I portland cements Ill8iY be used interchangeably. Each of the other types is especially suited for certain purposes; for instance, Type III is
January 1969 5:1
6 HYDRAULIC CEMENT AND CEMENT CLINKER
used where high early strength of product is required, and Type IV is used where the product must have good resistance to sulfate solutions.
White, nonstaining portland cement is not a type of cement; it us~ally possesses the principal ~roperties of Type I or Type III cement ·and is distinguishable only by its white color; it is a premium-priced specialty which is utilized in decorative structural concrete applications where concrete of either extremely white or uniformly pigmented color is specified.
Hydraulic cement is mixed with water and gravel and/or sand or other aggregate to produce concrete for the construction of highw~s, buildings, dams, bridges, and water systems. (See summary on concrete mixes and articles of concrete, items 511.21 to 511.71). Steel, asphalt, or other materials ~ be used rather than concrete in some applications; concrete made from portland or other hydraulic cements, however, has certain advantages as a building material from the standpoint of economy, general availability, adaptability or flexibility in use, and product performance. Frequently, hydraulic cement concrete ~ be only partly replaced by other materials which a.re used in the same project. For example, an asphalt road surface ~ be laid on a concrete bed, or a cl~ brick house ~ require a concrete foundation as well as masonry cement mortar to bond the bricks.
January 1969 5:1
HYDRAULIC CEMENT AND CEMENT CLINKER
u.s. tariff treatment
'.rhe column 1 (trade-agreement) rates o:f duty applicable to imports (see general headnote 3 in the TSUSA-1969) are as follows:
TSUS item
511.11
511.14
Commodity
Hydraulic cement and cement clinker:
White, nonstaining portland cement.
: '
Rate prior to Jan. 1, 1968
3¢ per 100 lbs.: including weight of containers
Other---------~---: 2.25¢ per: 100 lbs.: including weight of containers
U.S. concession granted in 1964-67 trade conference
(Kennedy Round)
Second stage, :Final stage, effective : effective
Jan. 1, 1969 :Jan. 1, 1972
2¢ per 100 . lbs., in
cluding weight of containers
1.3¢ per 100 lbs., in- · eluding weight of containers
1¢ per 100 lbs., including w_eight of containers
Free
The tabulation above shows the column l rates of duty in effect prior to January 1, 1968; these rates had remained unchanged under the TSUS from August 31, 1963, through 1967. Also shown are the. second and final stages of the annual rate modifications resulting from concessions granted by the United States in the Kennedy Round of trade negotiations concluded on June 30, 1967, under the General Agreement on Tariffs and Trade. These concessions, which amount to reduction of 66 2/3 percent and 100 percent, respectively, on items 511.11 and 511.14, are being put.into effect in five annual stages {see pertinent sections of the TSUSA-1969, reproduced in appendix A, for the staged rates).
Based on imports in 1968, the average ad valorem equivalent of the 1968 rate of duty on item 511.11 was 2.0 percent; that on item 511.14 was 2.6 percent. Although the specific rate of duty on white cement was 54 percent higher than the rate on other hydraulic cements
January 1969 5:1
7
8 HYDRAULIC CEMENT .AND CEMENT CLINKER
and cement clinker, the ad valorem equivalent of the.former rate was lower than that of the latter because white cement usually costs nearly twice as much as standard cement and three times as much as cement clinker.
In the period 1958-65, domestic cement producers filed with the U.S. Treasury Department, under the Antidumping Act of 1921, as amended, a number of complaints in connection with imports of cement from various countries, including two or more separate complaints on imports from four separate countries. About two-thirds of these complaints were dismissed by the Treasury Department with no findings of sales at less than fair value. Seven complaints were referred to the U.S. Tariff Commission for determination of whether a domestic indus~ try ~as being, or was likely to be, injured, or was prevented from being established, by reason of the complained-of imports. The Commission made affirmative determinations of injury in four of these cases, whereupon in each case the Treasury Department issued a finding of dumping. A special dumping duty is assessed on "dumped" shipments entered on or after 120 d~s prior to the date on which the Treasury Department received the complaint regarding such dumping, unless the shipment was appraised prior the the dumping findings in which case a dumping duty is not applicable.
U.S. consumption
Except in time of war, U.S. consumption of portland and other hydraulic cements i~ governed largely by the volume of construction, which, in turn, tends to reflect the country's general prosperity. Annual u.s. consumption of hydraulic cements increased each year from the end of World War II to 1956, amounting in tbat.year to about 327 million barrels. After a few yea.:r-s of high-level but irregualr consumption, the upward trend was resumed. Consumption increased in each successive year from 1960 to 1966; in the latter year, a record 403 million barrels of cement, valued at a record $1.3 billion, was consumed (table 1). Consumption in 1967, however, was about 2 percent less than in 1966.
Compared with the consumption (domestic shipments plus imports) of standard portland cement, that of white portland cement has been small, as is shown in the following tabulation for the years 1962-67:
January 1969 5:1
HYDRAULIC CEMENT AND CEMENT CLINKER
Apparent u.s. consumption of white portland cement
Consumption of white portland cement, which accounts for less than 1 percent of annual U.S. consumption of all hydraulic cements, is centered in Florida, California, and Texas.
U.S. producers
Early in 1968, 56 firms and their affiliates and subsidiaries were operating 188 portland cement plants in the United States and Puerto Rico. On hundred and two of these plants, accounting for about 59 percent of the capacity, were in continental United States east of the Mississippi River; 82 plants, accounting for about 39 percent of the capacity, were in continental United States west of the Mississippi River; and four plants, accounting for about 2 percent of the capacity, were in Puerto Rico and Hawaii.
Early in 1968 the annual capacity of the 188 portland cement plants was slightly more than 500 million barrels. In recent years, approximately three-fourths of the capacity of the portland cement industry has been used.
9
Five of the 56 U.S. producers of portland cement produc_e white portland cement in six plants having a total annual capacity of about 3.0 million barrels; two of these plants are in Pennsylvania, two in Texas, and one each in Florida and California. In 1967 these white portland cement plants produced at the rate of approximately 90 percent of their reported annual capacity.
About two-thirds of the 188 plants producing portland cement early in 1968 also produced masonry cement, while a few firms that did not produce portland cement'bought it for use in the manufacture of masonry cement. An additional three plants produced natural and puzzolan cements, bringing to between 190 and 200 the number of plants producing hydraulic cements in the United States. No data are available on the capacity for producing masonry, natural, and puzzolan cements.
JanuaQ" 1969 ):1
10 HYDRAULIC CE:tvIBNT AND CEMENT CLINKER
Historically, most firms producing hydraulic cement have had few, or no, .other important financial interest or products. Beginning in the 1950's, however, a number of hydraulic cement companies--particularly comparatively small one- and two-plant firms--have merged with large, diversified producers of building and related products. In the early 1960 1 s, a trend toward,vertical integration began with the acquisition of aggregate and ready-mix concrete producing facilities by cement manufacturers. Conversely, a few important producers of .concrete erected their own cement plants.
Approximately 35,000 production and related workers were employed in the production of hydraulic cements in 1967. Only a few hundred of these workers were employed in the production of white portland cement. Because of the trend to automation, the number of workers employed in the manufacture of hydraulic cements has not increased in recent years proportionally with the total plant capacity or the output of the cement industry.
In 1968, u.s. producers of portland cement ranged in size from firms operating single small plants having an annual capacity of less thari 1 million barrP.ls to large concerns owning from five to 18 plants, with a total annual capacity of 10 million to 40 million barrels. Although the 10 largest portland cement producers controlled about 55 percent of the total productive capacity, their plants were scattered throughout the United States, and each plant generally competed for sales with several other plants in the same area.
Because of their substantial weight in relation to their value, standard portland·ceinent and similar hydraulic cements can be transported economically for only short distances. Competition, therefore, is localized in a great number of small market are~s. Conversely, the considerably higher priced white, nonstaining portland cement can be moved economically over much greater distances.
U.S. production
U.S. production of hydraulic cement was larger in each suc'cessive year from 1945 through 1956, when about 326 million barrels, valued at about $1 billion, was produced. In the five years following, 1957-61, the annual U.S. :production of hydraulic cements fluctuated from year to year but averaged about the same in terms of quantity, as the amount produced in 1956, although somewhat higher in terms of value. The upward trend of production was resumed in 1962 and continued through 1966, when more than 397 million barrels, valued at slightly more than $1.25 billion, was produced (table 1). Production in 1967 was about 2 percent lower than in 1966.
January 1969 5:1
HYDRAULIC CEMrn'r A.."'ID CEMrn'r CLINKER 11
Production of white portland cement has never exceeded 1 percent of total hydraulic cement production. From 1958 to 1965, however, output of white portland cement grew at a more rapid rate than that of other hydraulic cements as a group. In 1967 about 2.1 million barrels of white portland cement, valued at about $14 million, was produced, compared with some 1.5 million barrels in 1960.
U.S., exports
Beginning in 1961, U.S .. exports increased in each successive year through 1966, amounting in the latter year to almost 1.1 million barrels, valued at about $4.8 million (table 1). Annual exports in 1967-68 were slightly under 1 million barrels.
Exports of cement in 1967 consisted largely of standard and special hydraulic cements shipped to Canada, the French West Indies, the Leeward and Windward Islands, Nigeria, the Bahamas, Mexico, and various other countries and areas throughout the world (table 2).
Until the early 1950's, U.S. exports of white cement to countries in the Western Hemisphere accounted for a considerable part of domestic exports of all cements. Exports of this product declined steadily in the 1950's. According to information received from domestic producers, exports of white cement were negligible in the period 1962-68, as were exports of cement clinker.
U.S. imports
By 1955 the U.S. cement industry was having difficulty in meeting domestic demand; as a result, U.S. imports in that year increased to 5.2 million barrels, valued at $14.4 million; in terms of quantity., these imports were equivalent to about 1.8 percent of domestic shipments in that year.
In 1956-62, annual imports generally remained steady at about the 1955 level. Thereafter, in 1963-68, imports fluctuated appreciably, ranging from a low of 3.6 million barrels in 1964 to a record 7.9 million barrels, valued at $17.5 million, in 1968. Nevertheless, the 1968 imports accounted for only about 2 percent of domestic consumption.
In 1965-68 the Bahamas, Canada, Norway, and Colombia were the principal foreign suppliers of standard cement and cement clinker to the United States; these four countries furnished virtually all ofthe imports of such cement in 1968 (table 3). From time to· time, large quantities have entered from Israel, Poland, the Dominican Republic, Sweden, West Germany, Belgium, and Portugal.
Januanr 1969 ::>-=l
12 HYDRAULIC CEMENT AND CEMENT CLINKER
In the middle 1950's, nru.ch of the imported cement entered areas of chronic shortages, especially southern Florida. After that, imports entered other coastal areas (viz, the New York City metropolitan area, Bridgeport, and Providence). Canadian cement was shipped across Lake Ontario and distributed in the Rochester and Rome areas of upstate New York. In 1967 about 35 percent of the imports of hydraulic cements and cement clinker entered Florida, 34 percent entered New York State, 9 percent entered Puerto Rico, 8 percent entered Virginia, and 6 percent entered Connecticut. Because of high transportation charges, very little imported cement is consumed at points far removed from the seaboard. Thus, direct import competition is encountered aJmost entirely by domestic concerns which ordinarily ship cement to markets near the seaboard or other border points.
U.S. imports of white, nonstaining portland cement were very small during several years both before and after World War II, but they increased greatly in the middle 1950's owing chiefly to the large demand for this variety in Florida. Imports advanced from 46,ooo barrels, valued at $240,000, in 1953 to 448,ooo barrels, valued at $2.7 million, in 1957. From 1958 to 1965, annual imports were in the range of 250,000 to 329,000 barrels and accounted for 12 to 20 percent of the white cement used in the United States. The decline in imports which began ·in 1964 continued through 1967; in the latter year 186,ooo barrels were imported (table 4). Imports in 1968, however, were somewhat higher than in 1967. Somewhat less than half of the imports of white portland cement now come from Belgium; the remainder are supplied largely by Japan, Denmark, Colombia, and Mexico.
Imports of cement clinker were negligible until 1955, when localized shortages of kiln capacity, in comparison with grinding capacity, in certain coastal areas resulted in the importation of 467,000 barrels in 1955 and 483,000 barrels in 1956. Since 1956, cement clinker has been imported irregularly, usually to supplement inadequate kiln capacity at certain plants. In recent years, standard cement clinker has been imported for finishing in Maine, Michigan, New York, Alaska, and Illinois, and white cement clink.er, for finishing in Pennsylvania. Total imports of clinker declined from about 648,ooo barrels in· 1966 to 152,000 barrels in 1968.
January 1969 5:1
HYDRAULIC CEMENT AND CEMENT CLINKER 13
Table 1.--Hydraulic cement and cement clinker: U.S. production, imports for consumption, exports of domestic merchandise, and apparent consumption, 1962-68
(Quantity in thousands of barrels of 376 pounds; value in thousands of dollars)
Ratio
Produc- Apparent (percent); of'
Year Imports Exports imports to tion 1./ consumption apparent consumption
1/ Does not include clinker, an intermediate product. E./ Not available.
Source: Production compiled from official statistics of the U.S. Bureau of Mines; imports and exports compiled from official statis-tics of the U.S. Department of Commerce.
JanUB.!'Y" 1969 5:1
14 HYDRAULIC CEMENT AND CEMENT CLINKER
Table 2.--Hydraulic cement and cement clinker: U.S. exports of domestic merchandise, by principal markets, 1962-68
Note.--For the statutory description, see the Tariff Schedules of the United States Annotated (TSUSA-1969).
U.S. trade position
17
The United States is on a moderate net export basis with respect to concrete mixes and a moderate net import basis with respect to articles of concrete as a group. Imports supply more than half of U.S. consumption of concrete floor and wall tiles, whereas imports of other concret~ articles are negligible.
Description and uses
Concrete is an important construction material for highways, buildings, dams, bridges, and water systems. For most of these structures, the concrete struc.tural component is produced on the construc-t ion site either from hydraulic cement (see summary on item 511.11), aggregate (such as sand, gravel, and crushed stone),'and water, or from concrete mixes such as wet ready-mixed concrete and packaged mixtures of hydraulic cement and sand or other aggregate, as well as from wet or dry mixtures of aggregate and asphalt, tar, or other cementitious binder of mineral ·Origin.
(Prior to December 7, 1965, the TSUS provided for binding materials which included resins; headnote l(b) to part lA of schedule 5 of the TSUS, however, was amended by Public Law 89-241 to include only "cementing materials of mineral origin".)
About half of the concrete used in the United States is readymixed, i.e., the cement, aggregate, and water are charged into separate compartments of the mixer truck which is to transport the material to the job site and the separate ingredients are blended during the latter part of the haul, so that on arrival at the site the wet concrete mix is ready to pour into the prepared forms. Both the basic ingredients used in ready-mixed concrete and the product itself are heavy and of comparatively low value; this factor effectively prevents ready-mixed concrete from moving in any appreciable volume in international commerce.
The packaged dry mixtures c~ cement and aggregate are used mainly by householders for repair work and other small jobs. Such
January 1969 5:1
18 CONCRETE MIXES AND ARTICLES OF CONCRETE
mixtures probably account for less than 1 percent of the concrete poured in the United States.
The principal concrete articles not generally produced at construction sites are essentially of hydraulic cement mixed with water and an aggregate (stone chips or slices ·and/or sand); such articles include floor and wall tiles, roofing tiles, mantels, friezes, blocks, slabs, panels, planks, poles, pipes, and drainage tiles. Except for floor and wall tiles, most of the articles are so heavy, bulky, and low-valued that transportation charges restrict sales to localities close to producing plants. The term "tiles" for the purpose of this summary (see headnote l(c) to part lA of schedule 5 of the TSUS) does not include any article 1.25 inches or more in thickness. In determining whether the articles are ,in chief value of concrete, the value of the reinforcing media, such as steel bars arid reinforcing wires, is disregarded.
Concrete floor and wall tiles, which comprise nearly all of the imports considered in this summary, are usually rectangular (most of them square) and are less than 1.25 inches in thickness. The two principal· types of concrete floor and wall tiles are 11 terrazzo 11 and "cement." .Terrazzo tiles are those in which stone chips or slices
·are used for decorative purposes; such tile must be ground on the top surface to level and polish the chips ·or slices. Cement tiles are those in which sand, cement, and pigment are used; such tiles usually are not ground on the top surface. Either type may be ground on the back surface to permit accurate placement on thin adhesive beds instead of on thicke~ hydraulic mortar beds.
January 1969 5:1
CONCRETE MIXES AND ARTICLES OF CONCRETE 19
U.S. tariff treatment
The column 1 (trade-agreement) rates of duty applicable to imports (see general headnote 3 in TSUSA-1969) are as follows:
TSUS item
511.21
511.25
511.3h:
511.41
511.51
511.61
511. 71
Commodity
Concrete mixes, whether wet or dry:
Rate prior to
Jan. 1, 1968
Hydraulic cement 5% ad concrete. : , val.
Other-------------: 15% ad val.
Articles, including terrazzo, of concrete, with or without reinforcement:
Tiles: Floor and wall
tiles. Other tiles,
including roo;fing tiles. :
Articles, not specially provided for:
Of concrete floor and wall tiles, including terrazzo.
Other: Not deco-
21% ad val.
26% ad val.
12. 5% ad val.
rated- - -- - - - : 15% ad val.
Decorated-----: 27% ad val.
U.S. concession granted in 1964-67 trade conference
(Kennedy Round) Second stage, Final stage,
effective effective Jan. 1, 1969 Jan. 1, 1972
3% ad val.
12% ad val.
20.5% ad val.
10% ad val.
12% ad val.
21. 5% ad val.
Free
7.5% ad val.
13% ad val.
6%_ ad val.
7.5% ad val.
13.5% ad val.
!/ Duty status not affected by the 1964-67 trade conference.
The tabulation above shows the column 1 rates of duty in effect prior to January 1, 1968; these rates had remained unchanged under
January 1969 5:1
20 CONCRETE MIXES AND ARTICLES OF CONCRETE
the TSUS from August 31, 1963, through 1967. Also shown (except for item 511.31) are the second and final stages of the annual rate modifications resulting from concessions granted by the United States in the Kennedy Round of trade negotiations concluded on June 30, 1967, under the General Agreement on Tariffs and Trade. These concessions, which amount to reductions of about 50 percent (except for item 511.21), are being put into effect in five annual stages (see pertinent sections of the TSUSA-1969, reproduced in appendix A, for the staged rates). The duty on hydraulic cement concrete (item 511.21) will be reduced to a. free rate in the final stage. The United States did not grant a. concession on concrete floor and wall tiles (item 511.31) at the 1964-67 trade conference.
Comment
Concrete mixes.--In 1966 about 4,550 establishments in the United States produced ready-mixed concrete for sale·to builders and householders. Most of the producers were small and conducted highly localized operations because of the nature of their product and its low value-to-weight ratio. The value of U.S. shipments of readymixed concrete amounted to an estimated $2.4 billion in 1966. Except for a few shipments across the borders of Canada. and Mexico, there were no U.S. exports or imports of ready-mixed concrete.
Several ready-mix firms and others produce packaged dry cementaggregate mixtures. These mixtures, which are low in value relative to their weight, are usually sold within the general area of their manufacture, and both exports and imports of such mixtures are negligible.
Concrete floor and wall tiles.--It is believed that annual consumption of concrete floor and wall tiles in the mid-1960's, which was moderately lower than that in the 1950's, amounted in terms of value, to approximately $2 million, of which about half was accounted for by imports. Exports are known to be negligible.
Many domestic plants producing concrete products have facilities which could be easily converted to the manufacture of concrete floor and wall tiles, but appreciable quantities are produced at probably not more than a dozen plants--mainly in Florida, Texas, and California. This product is usually only one of several concrete products manufactured in these plants. Generally speaking, it is uneconomical to fabricate these small, low-valued tiles in the United States unless there is a large local market for them; most producers of concrete products find it more profitable to cast· panels, blocks, slabs, and other large units.
Concrete floor and wall tiles--mostly floor tiles--have been
January 1969 5:1
CONCRETE MIXES AND ARTICLES OF CONCRETE 21
imported in moderate quantities for many years, but until 1955 the . value of U.S. imports seldom exceeded $100,000 in any one year. Beginning after 1954 (when they were valued at about $52,000), imports began a marked upward trend; between 1957 and 1963, they increased to more than $1 million a year, with almost all of the volume coming from Mexico, as shown in the following tabulation:
All Mexico All other
Year countries countries
Value : Unit Value Unit Value Unit
: value value value 1~000 :Cents per: 1,000 Cents per 1,000 Cents per
In addition to the dollar volume of the tiles shown in the table above, many shipments valued at less than $250 are known to be entered from Mexico; such shipments are not included in official statistics because they are entered informally. Taking :i.nto account such unreported shipments, the value of annual imports of concrete floor and wall tiles from Mexico in 1965-66 and again in 1968 was probably about $1.2 million to $1~4 million.
In recent years, two premium-priced kinds of concrete floor and wall tiles have comprised increasing proportions of the imports from Mexico; these tiles are either ground on their backs to uniform thickness, or else include large and comparatively expensive onyx or marble slices embedded therein, rather than the less expensive stone chips. Because of the weighting effect as to value of these higher priced imports, the average unit value of all concrete floor and wall tiles imported from Mexico has increased substantially in the past few years. For tiles similar in quality and composition to those entered in earlier years, however, prices for the Mexican products were at · least as low in 1968 as in the early 1960's.
Moderate quantities of terrazzo concrete floor and wall tiles are imported from Italy, while small quantities are supplied by the United Kingdom and two or three other countries (see accompanying table).
January 1969 5:1
22 CONCRETE MIXES AND AR'I'ICLES OF CONCRETE
All other concrete products.--u.s. production of the miscellaneous products covered in this summary is large, and U.S. imports, which are almost negligible, are far exceeded by exports. Statistics on exports of the concrete products covered herein are combined in export classes that include certain other concrete and cement manufactures. It is known, however, that in 1965-68 annual exports of concrete products covered by this summary amounted to $0.6 million to $1.2 million, about half of which was shipped to nearby points in Canada. Exports consisted in.major part of panels, poles, blocks, and similar articles.
January 1969 5:1
CONCRETE MIXES AND ARTICLES OF CONCRETE 23
Table.--Concrete mixes and articles of concrete: U.S. imports for consumption, by item and by principal sources, 1964-68
(In thousands of dollars)
Item and principal sources : 1964 : 1965 1966 1967 1968
Source: Compiled from official statistics of the U.S. Department of Commerce.
Note.--Comparable data not available (except for concrete floor and wall tiles) for the years before 1964.
January 1969 5:1
LIME
Cormnodity TSUS item
Lime------------------------- 512.11 - .14
Note. --For the statutory description, see the Tariff Sc.hedules of the United States Annotated (TSUSA-1969).
U.S. trade position
After 1960 the United States lost its longtime position as a net exporter of lime. In 1965 the United States imported approximately five times as much lime as it exported. After 1965, imports declined and exports increased, so that by 1968 imports and exports were about equal. Both imports and exports in 1968 were equivalent to substantially less than 1 percent of U.S. conswnption.
Description and uses
Quick.lime, the only commercially important lime covered by the "other" lime classification (item 512.14), results from the calcination (burning at moderate temperature) of limestone or dolomite rock. 1./ Hydrated lime (item 512.11) is prepared by adding enough water to quicklime to slake it, i.e., to convert its calcium oxide content to calcium hydroxide. Hydrated lime is more stable and safer and easier to handle than quicklime.
Regenerated lime is quicklime obtained by calcining byproduct calcium carbonate.formed in the production of paper by the sulfate and soda processes, in the production of calcium carbide, in water softening operations, and in certain other chemical processes. Quicklime and hydrated lime, which are interchangeable for some purposes, are widely used in metallurgy (such as a flux for_ steel,
25
in the beneficiation of uranium ores, in the densification of alumina sinter, and for the extraction of magnesium and ferrosilicon), in the chemical process industries (for manufacture of alkalies, calcium carbide, insecticides, fungicides, bleaches, and other products); ·in construction (as mortars, plasters, and stuccos); in agriculture (for neutralization of acidic soils); and for stabilization of road bases, purification of water, disposal of sewage and industrial wastes, and many other purposes.
1/ Dolomite rock that has been burned at high temperatures, i.e., dead-burned, is covered in a separate summary (TSUS items 531.0l to 531.04). Dead-burned dolomite is sometimes called refractory lime.
January 1969 5:1
26 LIME
u.s. tariff treatment
The column 1 (trade-agreement) rates of duty applicable to im- · ports (see general headnote 3 in the TSUSA-1969) are as follows:
TSUS item
512.11
512.14
Commodity
Lime:
Rate prior to
Jan. 1, 1968
Hydrated-------: 3¢ per 100 lbs., including weight of container
Other----------: 2.5¢ per 100 lbs., including weight of container
u.s. concession granted in 1964-67 trade conference
(Kennedy Round)
Second stage,: Final. stage, effective effective
Jan. 1, 1969 Jan. 1, 1972
1. 5¢ per 100 .. lbs., including weight of container
1.5¢ per 100 lbs., including weight of container
Free
Free
The tabulation above shows the column 1 rates of duty in effect prior to January 1, 1968; these rates had remained unchanged under the TSUS from August 31, 1963, through 1967. Also shown are the second and final. stages of the annual rate modifi~ations resulting from concessions granted by the United States in the Kennedy Round of trade negotiations concluded on June 30, 1967, under the General. Agreement on Tariffs and Trade. These concessions, which for both items result in the elimination of the duty, are being put into effect in five annual stages (see pertinent sections of the TSUSA-1969, reproduced in appendix A, for the staged rates).
The ad va1.orem equivalents of the 1968 rates, based on imports in 1968, were 1.7 percent for item 512.11 and 3.3 percent for item 512.14.
U.S. consumption and production
Because quicklime is a perishable product that generally nrust be used fairly soon after production and with U.S. imports and exports· of it, as well as of hydrated lime, being small relative to domestic output, UeS. production of each of these products in any one year approximates consumption.
January 1969 5:1
LIME 27
An industry source has estimated that the annual consumption of lime during the World War II period ranged from about 4 million to 5 million tons 1/ of open-market material and 3 million to 4 million tons of captive material, and that in the postwar period 1946-60 the trend of consumption was irregularly higher, particularly consumption of regenerated lime, the bulk of which is used captively.
Beginning with 1961, data on annual production are considered comparable with those on apparent annual consumption. Apparent annual consumption increased steadily from about 12 million tons in 1962 to about 16 million tons in 1967. Most of the increased consumption was supplied by growing output from commercial producers of open-market lime; in 1967, 62 percent of the total quantity consumed was supplied by open-market lime, whereas in 1962 it had supplied 54 percent.
Largely be·cause of the comparatively high consumption of fluxing lime in basic o:xygen steel converters, which are replacing openhearth furnaces in many steel mills, consumption of lime for steel fluxing tripled between 1962 and 1967, amounting in the ratter year to about 4.7 million tons. The lime used for ro~d stabilization has also increased markedly over the past several years, reaching a record of nearly 700,000 tons in 1967. It is believed that lime requirements for both of these uses will continue to increase substantially and more than compensate for some applications in which lime use is not growing or is even declining.
Consumption of lime by the building trades~-the principal users before about 1930--has not increased appreciably since the early 1950's, principal~y because of the competition from gypsum products and portland cement. Also, the consumption of lime in agriculture has declined in the past decade or so because of the widespread availability of cheaper soil-conditioning materials.
Production of lime increased steadily from 11.9 million tons in 1962 to 16.1 million tons in 1967. The stepping up of open-market output and the leveling off of captive production a.re shown in the following tabulation (in thousands of tons):
1/ In this summary the word "tons" means short tons, the domestic unit of quantity.
Janua:ry 1969 5:1
28 LIME
u.s. :producers
In 1967 about 195 U.S. plants manufactured quicklime and/or hydrated lime, or recovered regenerated lime; of these, about 105 produced lime for the open market only, 75 for captive use only, and 15 for both open-market and captive purposes. About half of the openmarket lime plants are operated by one- or two-plant firms; the remainder are owned by nru.ltiplant, geographically widespread companies, more particularly, by large, diversified producers of building materials or chemicals.
Lime for sale in the open market is produced in some 33 States and Puerto Rico, with production centered in Ohio, Michigan, Missouri, Pennsylvania, and Texas; these five States normally account for about 60 percent of the total u.s. output of open-market lime. Substantial quantities of open-market lime are also produced in New York, Alabama, Louisiana, Virginia, and California. In ordinary circumstances, lime is not shipped a:ny considerable distance becaus·e of the high cost of transportation relative to the value of the product and because lime plants are widely distributed in the United States.
Regenerated lime is produced in about 24 States, mainly in Florida, Louisiana, Washington, Alabama, Georgia, North Carolina, and South Carolina.
Data are not compiled regularly on the domestic capacity for producing lime. It is believed that open-market facilities had a capacity at the end of 1967 of at least 14 million tons and that facilities existed capable of regenerating and recovering about half that tonnage as byproducts from chemical processing operations. Furthermor~_ a number of new plants were being built and .several plant expansion programs were-being implemented.
U.S. exports
u.s. exports of lime have always been relatively low, altnough prior to 1961 they exceeded imports. After declining to about 17,000 tons in 1963, exports increased progressively in 4 .of the next 5 years, to 69, o.oo tons in 1968 ( see table).
Canada takes more than half of the total u.s. exports of lime, mainly special grades not produced in that country; most of the remainder are shipped to other countries in the Western Hemisphere and the Near East.
J anuasr 11969
LIME
U.S. imports
U.S. imports of lime have long been small, amounting to only about half of 1 percent of domestic consumption in 1968. Imports increased substantially after 1960, owing largely to shipment from a nearby U.S.-owned plant in Ontario into the Buffalo, N.Y., area
29
and from another Ontario plant into the Detroit, Michigan, area. Imports peaked at 216,000 tons in 1965, a.nd then declined sharply in the next thret• years (see table).
Historically, Canada has been al.most the sole source of U.S. imports of lime. For decades, until 1963, lime was imported from Canada into the State of Washington for use in the·pulp and paper industry. However, for the past few years, that industry has been supplied from a domestic plant, and imports into Washington have virtually ceased.
January 1969 5:1
30 LIME
Lime: u.s. production, imports for consumption, and exports of domestic merchandise, 1962-68
~/ Sold or used by producers; includes lime produced from limestone and dolomite rock, as well as regenerated lime obtained as a by•product from chemical.processes.
y Nearly all from Canada. }/ Not available. . '·
Source: Production compiled from official statistics of the U.S. Bureau of Mines; imports and exports compiled from official statistics of the u.s. Department of Commerce.
Note.--This table does not include dead burned dolomite (sometimes called refractory lime). ·
Note.--For the statutory description, see the Tariff Schedules of the United States Annotated (TSUSA-1969).
U.S. trade position
31
Approximately one-third of the gypsum rock not ground and not wholly or partly calcined that was consumed in the United States in recent years was imported. The United States has been a net exporter of ground or calcined gypsum and of gypsum plaster, although neither the exports nor the imports of such materials have been large.
Description and uses
Gypsum is a natural mineral consisting of hydrous calcium sulfate and small amounts of such impurities as anhydrite, silica, clay, and organic materials. Gypsum rock is by far the most important variety of gypsum from a commercial. standpoint; other mineralogical varieties of gypsum are alabaster, selenite, and satin spar. Gypsum rock is found in many countries; the leading producing countries are the United States, Canada, United Kingdom, the U.S.S.R., Spa.in, and Italy. Sizable quantities of broken or ground gypsum rock are used as a cement setting retarder, a conditioner for reducing soil acidity, a pigment, and as a filler or extender in various materials. Even greater quantities of gypsum rock are calcined for use in the manufacture of various products.
Calcined gypsum, sometimes called plaster of Paris, is produced by heating gypsum rock at a moderate temperature for a period of time sufficient to drive off 1-1/2 of its 2 molecules of water and form a dry, pulverulent material composed almost wholly of calcium sulfate hemihydrate. Calcined gypsum is further manufactured into either commercial plasters, sometimes called cements of gypsum, or prefabricated structural products such as wallboard, lath, or block (item 245.70), or religious statues, statuettes, and other articles (items 512.41 and 512.44). The term "cement of gypsum", as used in the TSUS (items 512.31 and 512.35) refers to cement in chief value of gypsum but containing other substances in addition to calcined gypsum.
Gypsum plasters are divided into two product lines: building plasters and industrial plasters. Building plasters are dry mixtures of a large proportion of ~alcined gypsum and small proportions of a
January 1969 5:1
32 GYPSUM ROCK AND GYPSUM PLASTER
set retarding agent and optionally a reinforcing fiber, expanded perlite or other aggregate, lime, and other additives. Industrial gypsum plasters are dry mixtures of calcined gypsum and chemical additives for regulating the viscosity, setting characteristics, product hardness, or other physical properties; these plasters seldom contain filler materials or reinforcing fibers.
Building plasters are widely used for forming surfaces on walls and ceilings. Sizable tonnages of industrial plasters are used in the polishing of plate glass, in molds for casting pottery and other articles, in dental plasters, for the setting of broken human limbs, and for casting into various decorative or utilitarian articles.
U.S. tariff treatment
The column 1 (trade-agreement) rates of duty applicable to imports (see general headnote 3 in the TSUSA-1969) are as follows:
TSUS .item
512.21
512.24
512.31
512.35
. Conunodity
Plaster rock or gypsum:
Not ground and not wholly or partly calcined.:
Ground, wholly or : partly calcined,: or both.
Cement of gypsum: Valued not over
$40 per ton. Valued over $40
per ton.
Rate prior to
Jan. 1, 1968
Free
$1.19 per ton
$10 per ton
$14 per ton
:'U.S. concession granted in 1964-67 trade conference
(Kennedy Round) Second stage, Final stage,
effective effective Jan. 1, 1969 Jan. 1, 1972
l:/
95¢ per tbn
$8 per ton
$11.20 per ton
!/
59¢ per ton
$5 per ton
$7 per ton
!/ Duty-free status not .affected by trade conference.
The tabµlation above shows the column 1 rates of duty in effect prior to January 1, 1968; these rates had remained unchanged under the TSUS from August 31, 1963, through 1967. Also shown are the second and final stages of the annual rate modifications resulting from concessions granted by the United States in the Kennedy Round of trade negotiations concluded on June 30, 1967, under the General Agreement on Tariffs and Trade. These concessions, which amount to reductions
January 1969 5:1
GYPSUM ROCK AND GYPSUM PI.ASTER 33
of about 50 percent on items 512.24 to 512.35, are being put into effect in five annual stages (see pertinent sections of the TSUSA-1969, reproduced in appendix A, for the staged rates). The duty free rate for the merchandise now provided for under item 512.21 was also free of duty under the Tariff Act of 1930 as originally enacted, and was bound under the GATT (paragraph 1743), effective January 1, 1948.
The ad valorem equivalent of the 1968 specific rate of duty on item 512.24, based on imports in 1968, was 2.1 percent. In recent years there have been no imports under either item 512.31 or 512.35; thus, ad valorem equivalents cannot be computed for these items.
U.S. consumption
Annual U.S. consumption of gypsum rock increased from about 15 million tons 1/ in 1962 to a record high of nearly 17 million tons in 1964. In theyears fol·lowing 1'964, consumption declined steadily falling below 14 million tons in 1967 (table 1). The decreasing consumption in recent years largely reflects a sizable decline in the construction of new houses and apartments.
About half of the gypsum rock consumed in the United States in recent years was calcined for use in the production of plasterboard and lath, while approximately one-fourth was calcined and manufactured into industrial and building plasters. 2/ The remainder was consumedin the uncalcined form. Consumption of-plasterboard and lath (covered in a. separate summary) has increased in recent years, whereas consumption of industrial and building plasters has declined (table 2). About 1.7 million tons of industrial and building plasters were consumed in 1967, in contrast with 3.0 million tons in 1959· The downward trend is due largely to the continuing shift from wet-wall construction (where wet plaster is applied directly to the wall) to dry-wall (plasterboard) construction; dry-wall construction is considerably lower in cost.
U.S. producers
In 1966 gypsum rock was produced in 81 mines situated in 20 States. Eleven gypsum mines were operated in California, eight each in Oklahoma and Texas, six in Colorado, and five each in Arizona,
1/ The term "tons" hereafter refers to short tons, the domestic unit of quantity.
2/ About 4 tons of gypsum rock are needed to produce 3 tons of gypsum plaster.
January 1969 5:1
34 GYPSUM ROCK AND GYPSUM PLASTER
Michigan, Iowa, and New York; the remainder were scattered throughout the United States. Six or eight large firms own most of the important domestic gypsum mines and gypsum products plants; most of these firms are diversified producers of building materials, including gypsum plaster, plasterboard, and lath. Several of these large firms also own foreign subsidiaries which mine gypsum rock abroad and supply it to the parent U.S. firms.
In 1966 calcined gypsum was produced in 78 plants, 1/ owned by about a dozen companies, in 31 States. Of these 78 plants, some 45 were situated a.t or nea.r the domestic mines supplying them while the remainder were in populous coastal areas and received their gypsum rock from foreign sources. Nearly every operator of a gypsum products plan~ owns its own gypsum mine either in the United States or abroad. Three companies own about 50 of the domestic gypsum products plants. In 1966 calcined gypsum was produced at nine plants in California, seven plants each in New York and Texas, and five in Iowa.
In recent yea.rs some of the large, multiplant firms have expanded their gypsum products operations oy building plants in sections of the country remote from their long-established gypsum products facilities. At present, at least five firms produce and sell gypsum plaster and plasterboard on a nationwide.scale.
No data are available on the U.S. capacity to produce gypsum rock, but it :i.s is known that gypsum product manufacturers loca.ted away from the ocean can readily produce all the gypsum rock they require. In view of the considerably lower level of consumption of gypsum plaster in recent years than-formerly and the recent erection of new plants in different parts of the country for producing gypsum plaster and gypsum board, there probably is a sizable excess of capacity for producing those products.
U.S. production
Annual U.S. production of gypsum rock increased steadily from about 6.6 million tons in 1949 to 10.7 million tons in 1955, declined moderately in the period J.956-58, and then increased to a peak of 10. 9 million tons in 1959. In 1962-67, annual output ranged from 9.4 million to 10. 7 million tons.. In 1966 the largest tonnages of gypsum rock were mined in California, Michigan, Iowas,·and Texas, in that order.
1/ Gypsum plaster was produced in each of these 78 plants, as well as-in some others which purchased calcined gypsum for formulation into plasters; usually industrial plasters.
January 1969 5:1
GYPSUM ROCK AND GYPSUM PLASTER 35
The record high production of gypsum plaster was also established in 1959, when about 3 million tons was produced. After 1959 the output of gypsum plasters declined each successive year, and in 1967 the production amount~d to only 1.7 million tons. In 1966 building plasters accounted for about 83 percent and industrial plasters for 17 percent of the output of gypsum plasters.
U.S. exports
Only small quantities of gypsum rock have been exported by the United Sta.tes. U.S. exports of gypsum plasters have also been negligible, amounting to less than 1 percent of domestic production (table 2). A large part of the exports of gypsum plasters went to Canada and Mexico and consisted mainly of industrial plasters which were not produced in the importing country.
U.S. imports
U.S. imports of gypsum rock increased from about 4.o million tons in 1958 to about 6.3 million tons in 1964; since then, they have been moderately lower (table 3). In 1968 Canada supplied approximately 78 percent of the total imports; Mexico,16 percent; Jamaica, 4 percent; and the Dominican Republic, 2 percent. Slightly more than one-third of U.S. consumption of gypsum rock was supplied by imports in each of· the years 1965-68, and probably also in the years immediately preceding.
No gypsum plaster was imported in 1962-68. Small quantities of a specially prepared calcined gypsum from the United Kingdom and a very finely ground gypsum rock from Canada, however, were imported regu~arly during those years.
January 1969 5:1
36 GYPSUM ROCK AND GYPSUM PLASTER
Table 1.--Gypsum rock, not ground a.nd not wholly or partly calcined: U. S •. product ion, imports for consumption, exports of domestic merchandise, and apparent consumption, 1962-68
{Quantity in thousands of short tons2 value in thousands of dollars)
Apparent Ratio Production . {percent) of
Year Imports Exports . !/ . consump- imports to . tion consumption
gypsum produced as a. by-product in·certain chemical processes. g/ Not a.vailable.
Sowce: Production comp;i.led from official statistics of the U.S. Bureau of Mines; imports and exports compiled from official statistics of the U.S. Depa.rtment of Commerce.
January 1969 5:1
GYPSUM ROCK AND GYPSUM PLASTER 37
Table 2.--Gypsum plaster and wholly or partly calcined or ground gypsum rock: U.S. production, imports for consumption, and exports of domestic merchandise, 1962-68
1/ Excludes calcined gypsum used by producers in the manufacture of plasterboard, lath, and other fabricated shapes.
2/ Imports consist almost entirely of calcined gypsum; therefore these data are not strictly comparable with production data.
3/ Substantially, but not completely, comparable with production data..
4/ Incorporates revision to eliminate error in official statistics. "'ii Not available. ·
Source: Production compiled from official statistics of the U.S. Bureau of Mines; imports and exports compiled from official statistics of the U.S. Department of Commerce, except as noted.
January 1969 5:1
GYPSUM ROCK AND GYPSUM PLASTER
Table 3.--Gypsum rock, not ground and not wholly or partly calcined: U.S. imports for consumption, by principal sources, 1962-68
Source: Compiled from official $tatistics of the· U.S. Department of Commerce.
January 1969 5:1
ARTICLES OF PLASTER OF PARIS
Commodity TSUS item
Articles of plaster of Paris-------- 512.41-.44
Note.--For the statutory description, see the Tariff Schedules of the United States Annotated (TSUSA-1969).
U.S. trade position
39
U.S. imports of plaster of Paris articles as a group have not been large, and exports have long been negligible. Imports of religious statues and statuettes, however, have accounted for an estimated 15 to 20 percent of U.S. consumption for many years.
Description and uses
Because of its low cost and excellent suitability for molding and casting, plaster of Paris (calcined gypsum) is widely used in making articles--often of intricate shape--which are not required to resist heat, wear, abrasion, or other destructive forces. These articles generally are cast or molded from a thick, aqueous slurry of calcined gypsum, with or without an accelerating reagent aria.other additives; sometimes, relatively large articles are cast around a wood or metal frame which provides needed rigidity. Most of these articles are used for decorative or religious purposes.
TSUS item 512.41 includes plaster of Paris statues, statuettes, and bas-reliefs, such as (1) figures, figurines, and certain other articles used for religious purposes, (2) figures used for display purposes, busts, and certain types of souvenirs, novelties, and copies of works of art, and (3) bas-reliefs used for architectural purposes. Item 512.44 includes anatomical mannequins, wall masks, plaques, lamp bases, and novelty articles of various kinds. Gypsum or plaster building boards and lath are discussed in the summary on item 245.70.
Articles of plaster of Paris g~nerally encounter competition from similar articles made from a wide variety of other materials (viz, plastics, glass, ceramics, wood, and metals). The selection of a religious article is often based on sentiment for a certain figure or symbol, or on a personal preference for a particular material (plaster of Paris being the most popular), rather than on price. For the other articles, price is generally the principal consideration, although a personal preference for a particular design or material may be a determining factor.
January 1969
5:1
40 ARTICLES OF PLASTER OF PARIS
U.S. tariff treatment
The column 1 (trade-agreement) rates of duty applicable to imports (see general headnote 3 in the TSUSA-1969) are as follows:
TSUS item
512.41:
512.44:
U.S. concession granted in Rate 1964-67 trade ~onference
Commodity prior to:__,. __ --~(K_e_n_n_e_d~y __ R_o~u_n_d~)----~ Jan. 1,: Second stage,: Final stage,
1968 effective effective
Articles, not specially provided for, of plaster of Paris, with or without reinforcement:
Statues, statuettes, 10% ad and bas-reliefs. val.
Other-----------------: 12% ad val.
Jan. 1, 1969 Jan. 1, 1972
8% ad val. -5% ad val.
9 .5% ad val. 6% ad val.
The tabulation above shows the c.olumn 1 rates of duty in effect prior to January 1, 1968; these rates had remained unchanged under the TSUS from August 31, 1963, through 1967. Also shown are the second and final stages of the annual rate modifications resulting from concessions granted by the United States in the Kennedy Round of trade negotiations concluded on June 30, 1967, under the General Agreement on Tariffs and Trade. These concessions, which amount to reductions of SO percent on both items, are being put into effect in five annual stages (see pertinent sections of the TSUSA-1969, reproduced in appen-dix A, for the staged rates). ·
U.S. consumption
Of the many different types of plaster of Paris articles in~luded in this summary the only type that has been of any considerable commercial importance is religious statues and statuettes (item 512.41). The value of total annual U.S. consumption (i.e., retail sales) of such articles has been estimated.to range from $2 million to $3 million. Most of these sales were made .at religious shrines and institutions in eastern and midwestern cities having sizable Catholic populations. The annual sales of these religious articles are believed to have been fairly stable in value during recent years.
The value of U.S. sales of bas-reliefs and the several other types of plaster of Paris articles is not known, but it has probably amounted to more than a million dollars a year since 1950. The largest single
January 1969 5:1
ARTICLES or PLASTER OF PARIS 41
item in this category, accounting for annual sales of perhaps $300,000, is believed to have been wall plaques, i.e., cast plaster of Paris pieces having decorative or artistic surface configurations and used, often in pairs, for decorating plastered or wood paneled walls. Because of cha~ging interior de~orating styles, sales of plaster-base bas-reliefs have declined to probably less than $100,000 a year. Since about 1960, perhaps $100,000 worth of plaster-base figures and busts used for display purposes have been sold each year.
U.S. producers and production
Religious statues and statuettes of plaster of Paris have been produced by some 20 to 30 small concerni situated mainly in the East and the Midwest. These U.S. producers have frequently supplemented their output of plaster-base religious statues and statuettes with similar imported plaster articles, and in addition, they have produced statues and miscellaneous articles from papier mache and other materials
The number and location of U.S. producers of plaster-base wall plaques, bas-reliefs, figures and busts used for display purposes, and other articles are not known. It is believed that producers of such articles are situated in cities throughout the United States and that plaster of Paris articles usually comprise only a part of the product lines of small companies.
No Government agency or other organization collects and reports separate statistics on the production of the gypsum plaster articles included in this sununary. The value of U.S. production of religious statues and statuettes of plaster of Paris has probably approximated $2 million a year since 1955. It is believed that the production of such articles has been steady or has increased only slightly in recent years. The value of production of the other plaster of Paris articles included in this summary has probably amounted to more than $1 million· a year since about 1950.
U.S. imports and exports
The value of annual U.S. imports of plaster of Paris statues, statuettes, and bas-reliefs averaged about $407,000 in the period 1962-68 with the.record $613,000 worth of such articles entering in 1967 (table 1). About g·o percent of the imports of these articles consisted of religious statues and statuettes, most of which were produced in Spain, Italy, or the United Kingdom. Several other European countries also supplied the religious statuary, the busts, and the basreliefs provided for under item 512.41.
January 1969 5:1
42 ARTICLES OF PLASTER OF PARIS
Annual U.S. imports of "other" articles of plaster of Paris (item 512.44) have been irregular and comparatively small (table 2); such imports consist principally of decorative articles for walls. For many years Italy was the principal single supplier; imports from that country have declined, however, and ·in some years Japan, West Germany, Canada, or Mexico has supplied larger amounts, in terms of value, than Italy. .
It is unlikely that U.S. exports of religious statues and statuettes of plaster of Paris were ever appreciable. Possibly some wa11· plaques and other decorative or utilitarian plaster-base articles have been exported in recent years to Canada.
January 1969 5:1
ARTICLES OF PLASTER OF PARIS 43
Table 1.--Plaster of Paris statues, statuettes, and bas-reliefs: U.S. imports for consumption, by principal sources, 1962-68
(In thousands of dollars) !/ Year Total : S . : I 1 : United pain ta y Kingdom
Source: Compiled from official statistics of the U.S. Department of Commerce.
January 1969 5:1
SAND AND GRAVEL
Commodity TSUS rrem
Sand and gravel----------------- 513.11, -.14
Note.--For the statutory description, see the Tariff Schedules of the United States Annotated (TSUSA-1969).
U.S. trade position
45
Annual U.S. consumption of sand and gravel during the period 1963-67 was valued at about $1 billion~ U.S. exports were three times as great as imports, but both were very small relative to domestic consumption.
Description and uses
This summary covers sand,.crude and manufactured, and gravel, and since these commodities are commingled in their principal applications, the two are discussed jointly here, except where noted otherwise. Ground nepheline syenite is provided for under item 522.43 and is not included in this summary.
The term 11 sand" is the size designation for very small particles of rock and usually refers to quartz (silica) sand, the most common type of natural sand. Sand is produced by the natural weathering of rocks and by the crushing and sizing operations of sand and gravel producers. Glass sand is sand (item 513.11) that has a minimum silica content of 95 percent and an iron oxide content of not more than 0.6 percent; such sand is used in large quantities as an ingredient in glass batches.
Gravel, like natural sand, is a product of rock weathering. It is composed of somewhat larger fragments than sand.
Virtually all of the sand and gravel deposits in the United States require washing, purification, and sizing to meet consumer requirements. Sand and gravel deposits are widely distributed in United States, and total reserves are very large.
the
Sand and gravel are used p~incipally in the manufacture of concrete for building construction and for paving. Large amounts are also used in bituminous paving, as fill material, as railroad ~a~~~~~2 and for a large number of industrial uses. Important uses of the higher-priced industrial sands are as an ingredient in glass and as a casting mold material in iron and steel foundries. Sand is also used in sand blasting, in glass grinding, and the manufacture of ceramics and abrasives.
January 1969 5:1
46 SAND AND GRAVEL
U.S. tariff treatment
The column 1 (trade-agreement) rates of duty applicable to imports (see general headnote 3 in the TSUSA-1969) are as follows:
TSUS item
513.11
513.14
Commodity
Sand, crude or manufactured, and gravel:
Sand containing by weight 95 percent or more of silica. and not more than o.6 percent of oxide of iron.
·other-------~-----:
Rate prior to
Jan. 1, 1968
50¢ per ton
Free
U.S. concessions granted in 1964-67 trade conference
(Kennedy Round) Second stage, Final stage,
effective effective Jan. 1, 1969 Jan. 1, 1972
40¢ per ton 25¢ per ton
!/ Duty-free status not affected by trade conference.
The tabulation above shows the column 1 rates of duty in effect prior to January 1, 1968; these rates had remained unchanged under the TSUS from August 31, 1963, through 1967. Also shown are the second and final stages of the annual rate•modifications resulting from a concession on item 513.11 granted by the United States in the Kennedy Round of trade negotiations concluded on June 30, 1967, under the General Agreement on Tariffs and Trade. This concession, which amounts to a reduction of 50 percent, is being put into effect in five annual stages (see pertinent sections of the TSUSA-1969, reproduced in appendix A, for the staged rates). No concession was granted in the Kennedy Round on item 513.14. The ad valorem equivalent of the 1968 rate of duty on item 513.11, based on imports in 1968 was 6.9 percent. The duty free rate on sand and gravel, derived from the · provisions of paragraphs 1719 and 1775 of the previous schedules, was bound under the GATT, effective January 1, 1948.
U.S. consumption
Apparent consumption of sand and gravel, which increased each successive year during 1962-66, continued the upward trend of the years immediately preceding that period, before declining·moderately
January 1969 5:1
SAND /\ND GRAVEL 47
in 1967. Guch consumption increased from 7'79 million tons, 1/ valued at $795 million, in 1962, · to 936 million tons, valued at $983 millio· 1,
in 1966 (table 1), representing an increase of 20 percent in tonnage and 29 percent in value. Of the 1966 tonnage, approximately 61 percent was gravel and 39 percent was sand.
Consumption of gravel during 1962-?6 averaged 530 mi.llion tons a year, which was 20 percent greater than the average for the preceding 5 years. Annual sand consumption averaged 336 million tons, 28 percent above the average for 1957-61.
Consumption of sand and gravel by the construction industry for paving and for building--uses which normally account for about 53 and 30 percent, respectively, of annual consumption--expanded steadily from 1962 to 1966, but declined slightly in 1967; the third largest use, as a fill material, declined after 1965 (table 2). The tonnage consumed in building and paving during 1962-66 averaged 724 million tons a year, 17 percent above the average for the preceding 5-year period.
Consumption of industrial sand in industrial molds and in glass making also has increased in the past few years (table 2). Annual U.S. consumption of molding sands averaged nearly 9 million tons during 1962-66, 41 percent above the corresponding average for 1957-61. Glass makers used an annual average of 8 million tons of sand in the period 1963-67, 23 percent more than the average used for the · same purpose in the preceding 5 years. Glass and molding sands normally account for about 70 percent of the annual consumption of industrial sands. The tonnage of sand required annually for the other applications was r~latively stable during 1962-66.
The principal products competing with sand and gravel in the major applications are crushed stone, slag, fly ash, and lightweight aggregates such as clay and shale.
U.S. production and producers
U.S. production of sand and gravel closely corresponds to consumption since little of these commodities are held in stock.
Every State reported production of sand and gravel during the period covered herein. During 1962-66, California produced the most sand and gravel, and large amounts were produced in Texas and
'J:./ In this summary, the term ''tons 11 refers to short tons.
January 1969 5:1
48 SAND AND GRAVEL
New York as well. of these products.
The Midwest area, however, was the principal source
There are two kinds of producers in the United States--commercial operators and Government-and-contractor. Commercial operators sell at least part of their output in the open market, whereas Government-andcontractor operators produce exclusively for use on Federal' State, and municipal projects. Commercial operators accounted for approximately 72 percent of the sand and gravel produced during 1962-66.
In 1967, production was reported from 6,315 commercial plants. About 72 percent of these plants each produced less than 100,000 tons annually, and together accounted for only about. 20 percent of domestic production in 1967. About 1 percent of the plants produced more than 1 million tons each and accounted for 12 percent of the 1967 output.
Operations ranged in size from one-man, portable roadside units to multiunit plants of large corporations associated with t11e construction industry.
U.S. exports and imports
Sand and gravel were not important items in international trade during 1962-68. Both U.S. import and export trade were mainly with Canada and, to a lesser extent, with Mexico and consisted principally of construction sand. U.S. exports normally were three times as great as imports, but imports (table 3) have been increasing at a greater rate than exports in recent years (table 1). Sand suitable for use in the manuf'acture of glass accounted for approximately 6 to 8 percent of the tonnage and about 14 percent of the value of annual imports. '
. l 1:11: liil'Y l '·)uLi
', :.!
SAND A.1\JD GRAVEL
Table 1.--Sand and gravel: U.S. production, imports for consumption, exports of domestic merchandise, and apparent consumption, 1962-68
Production Apparent Year Im- Ex- con.sump-. ports ports Sand Gravel · Total tion . .
Source: Production compiled from official statistics of the U.S. Bureau of Mines; imports and exports compiled from official statistics of the U.S. Department of Commerce.
January 1969 5:1
50 SAND AND GRAVEL
Table 2.--Construction sand and gravel and industrial sand: U.S. consumption, by principal uses, 1962-67
1/ Includes 31 thousand short tons, valued at 63 thousand dollars, from Belgium.
2/ Less than 500 short tons. 3/ Includes 18 thousand short tons, valued at 70 thousand dollars,
from Australia. 4/ Includes 43 thousand short tons, valued at 134 thousand dollars,
from .Australia.
Source: Compiled from official statistics of the U.S. Department of Conunerce.
January 1969 5:1
CRUSHED OR GROUND STONE
TSUS Connnodity item
CI1.lshed or ground stone: Marble, breccia, and onyx chips------------- 513.21 Slate-----------------=----------------------- 513.31 Limestone----------------------------------- 513.35-.36 Other--------------------------------------- 513.41
Note.--For the statutory description, see the Tariff Schedules of the United States Annotated (TSUSA-1969).
u.s. trade position
The United States is one of the largest producers and consumers of crushed or ground stone. U.S. imports and exports are negligible compared with ·consumption.
Description and uses
53
The term "crushed or ground stone" is used in this sunnnary to designate small fragments and particles of rocks usually produced in cl1.lshing and grinding plants and the chips and spalls produced as byproduct rock fragments in'the blasting and hammering of stones •. Not. included in this summary are: ground or pulverized limestone to be used in the manufacture of fertilizer (item 480.05); certain finely divided abrasives and abrasive stones provided for in part l(G) of schedule 5; diamond dust or powder (items 520.19 to 520.31); ground talc and soapstone.(item 523.33); and ground Cornwall stone (item 522.45).
Most crushed or ground stone is derived from limestone, basalt, and granite, but such diverse rock types as marble, breccia,.onyx, slate, sandstone, dolomite, and others are also used. Owing to its extremely low value-to-weight ratio, cl1.lshed or ground stone is normally shipped only very limited distances.
The principal uses for cl1.lshed or ground stone are as aggregate in concrete and as roadstone; it is also used in the manufacture of cement, in agriculture, in the production of lime, as railroad ballast, as a flux, and in many other applications. ~..arble, breccia, and onyx chips are used principally to impart color in terrazzo, a type of flooring composed mainly of stone chips and cement.
January 1969 5:1
54 CRUSHED OR GROUND STONE
U.S. tariff treatment
The column 1 (trade-agreement) rates of duty applicable to imports (see general headnote 3 in TSUSA-1969) are as follows:
TSUS item
513.21
513.31
513.35
513.36
513.41
Rate
Commodity :prior to:
U.S. concessions granted in 1964-67 trade conferences (Kennedy Round)
~---~------------------------~ : Jan. l,:s d t :Fi al t . 1968 . econ sage,. n sage,
Stone chips and spalls, and stone, crushed (otherwise than merely to facilitate shipment to the United States) or ground:
1./ Previously dutiable under TSUSA item 513.34, which item was deleted on January 1, 1968 (see second paragraph following).
'?} This rate is to become effective on January 1, 1970.
The tabulation above.shows the column 1 rates of duty in effect prior to January 1, 1968; these rates, except for items 513.35 and 513.36, had remained unchanged under the TSUS from August 31, 1963, through 1967. Also shown are the second and final stages of the an• nual rate modifications resulting from concessions granted by the United States in the Kennedy Round of trade negotiations concluded on June 30, 1967, under the General Agreement on Tariffs and Trade. These concessions, which amount to reductions of about 50 percent, are being put into effect in five annual stages (see pertinent sections of the TSUSA-1969, reproduced in appendix A, for the staged rates).
January 1969 5:1
CRUSHED OR GROUND STONE 55
Prior to January 1, 1968, the limestone now covered by TSUSA items 513.35 and 513.36 was provided for under item 513.34. The colunm 1 rate under previous item 513.34 was 20 cents per short ton from August 31, 1963 to December 31, 1965, 18 cents from January 1, 1966 to December 31, 1966, and 16 cents from January 1, 1967 to December 31, 1967 (see Presidential Proclamations 3694, 3818, and 3822).
Based on imports in 1968, the average ad valorem equivalent of the 1968 rate.of duty on item 513.36 was 6.5 percent.
U.So consumption and production
Apparent annual U.S. consumption of crushed stone rose from 594 million tons, 1/ valued at $850 million, in 1962 to 750 million tons, valued at $1,078 million, in 1966 (see table), then declined slightly in 1967. The rise in consumption was accounted for by the steadily increasing demand for limestone for use as aggregate in concrete, as roadstone, and in cement. Demand for crushed stone in other consuming industries generally rose slightly or remained stable. The principal commodities in competition with crushed stone were sand and gravel, certain kinds of slag, and lightweight aggregates.
U.S. production of crushed stone during 1962-66 increased steadily from 594 million tons,· valued at $853 million, in 1962 to 749 million tons, valued at $1,082 million, in 1966.(see table). In 1967, tonnage and value were each down about 3 percent from the 1966 records. Limestone accounts for about 75 percent, basalt and similar rocks for 10 percent, and granite for 8 percent of this tonnage. The remainder consists principallJ of marble, calcareous marl, and sandstone •.
Approximately 89 percent of the granite, as well as 88 percent of the basalt and 62 percent of the limestone, is sold or .used by prO-:.. ducers as aggregate in concrete and as roadstone. An additiqnal 18 percent of the limestone is sold or used by producers in the manufacture of cement.
During 1962-67, production was recorded in every State, with the Midwest being the major producing area. Pennsylvania, Illinois, and Ohio produced most of the crushed limestone, and New Jersey and Oregon produced most of the crushed basalt and related rocks. Georgia and North Carolina led in the production of crushed granite.
iJ In this summary the term "tons" refers to short tons.
January 1969 5:1
CRUSHED OR GROUND STONE
U.S. producers
U.S. producers of crushed stone were of two types: Commerr.ial operators, selling to anyone, and Government-and-contractor operators, which produced material for use only by Federal, State, and local government agencies. Some of the latter type of producers were Government agencies. Commercial operat'ors normally produce more than 90 percent of the annual output of crushed stone.
In 1967, the 3,338 commercial plants that produced crushed stone in the United States ranged in annual production from less than 25,000 tons to more than 900,000. The number of plants in selected size ranges, and the percentage of the total output accounted for by each of those size ranges, are shown in the following tabulation:
Annual production (short tons)
Not over 100,000------------------100, 000 - 500,000-----------------500,000 - 900,000-----------------0ver 900,000----------------------
Number of plants
1,815 1,219
170 134·
1967 production ·(percent of total)
7.5 44.9
17.2 30.4
The above tabulation shows that 54 percent of the plants accounted for only 7.5 percent of the total output, whereas 4 percent of the largest plants accounted for 30.4 percent.
U.S. exports and imports
Both U.S. exports and imports of crushed stone. were of negligible importance in national and internat'ional commerce'. ·The bulk of the foreign trade consisted of crushed limestone sent to or imported from Canada for use as a fluxing agent or in the manufacture of cement, and of marble, breccia, and onyx chips, imported chiefly from Italy.
January 1969 5:1
CRUSHED OR GROUND STONE 57
Stone chips and spalls, and stone, crushed or ground: u.s. production, imports for consumption~ exports of domestic merchandise, and apparent consumption, 1962-6~
:iJ Does not include imports reported in value only amounting to 1,039 thousand doliars in 1962 and 573 thousand dollars in 1963. ~ Not available.
Source: Production compiled from official statistics of the U.S. Bureau of Mines; imports and exports compiled from official statistics of the u.s. Department of Commerc.
January 1969 5:1
MAHBLE, JET, AIJ\BAS'.I'ER, AND CHALK M'rICDi.:f3, AND S'l'ONE SCUIJ:YI'URES, . NOT ELSEW!Ili:l1F. ENUM~RATED
TSUS
59
C~odity item
Stone articles and stone, not elsewhere •enumerated: Sculptures, professional, other than originals----- 513.51 Jet and alabaster articles------:------------------- 513 .9!~ Articles of chalk---------------------------------- 514.34 Marble, breccia, and onyx articles----------------- 514.81
·Note .--For the statutory description, see the Ta.riff Schedules of the United States Annotated ( TSUSA-1969).
U.S. trade position
U.S. produe!tion of these articles is believed to be substantially greater than imports, which in recent years have been declining slightly. Exports a.re believed to be negligible.
Description and uses
This summary primarily relates to professional sculptures which are not originals and unenumerated articles formed from reiatively · soft, workable, natural stone--primarily onyx, marble, jet, alabaster, and chalk.
Alabaster is a pure white or attractively colored, fine-grained, compact form of gypsum soft enough to be fashioned easily into lamp bases, book ends, paper weights, vases, urns, and other utilitarian and decorative articles. Much of the white alabaster used commercially is dyed or otherwise artifically colored.
Jet is a black variety of lignite which takes a high polish and is used for ornamental items.
The articles made of chalk, a soft, friable form of natural calcium carbonate, as provided for under item 514.34, comprise cubes, blocks, sticks, disks, and the like.
In the commercial sense, marble includes all calcareous rocks, capable of taking a polish. Marble may be classed in three groups. The first group, which is by far the most important, comprises marble resulting from the recrystallization of limestone; these are the common marbles of commerce and they vary greatly in colors and shades. The second group comprises the onyx marbles, which are essentially calcium carbonate and have a wax-like appearance. The third group is breccia marbles, composed of angular fragments of marble naturally
January 1969 5:1
60 MARBIB, JET, ALABASTER, AND CHAI.K ARTICIES, AND STONE SCULPI'URES, Nar ELSEWHERE ENUMERATED
cemented together with calcite. Statuary and a wide variety of utilitarian, decorative, and artistic articles are fashioned from marble.
The provision covering professional productions by sculptors (item 513.51) encompasses statuary and sculpture of natural stone by sculptors of recognized qualifications, which works are not original within the mean!ng of item 765.15. Item 513.51 (exclusive of the first 10 castings, replicas, or reproductions of a sculptor's original work) includes: copies of' traditional religious figures; copies of sculptures produced by other sculptors; and sculpted fountains or other utilitarian articles. l/
U.S. tariff treatment
The column 1 (trade-agreement) rates of duty applicable to imports (see general headnote 3 in the TSUSA-1969) are as follows:
TSUS item
513.51
513.94
514.81
U.S. concessions granted in 1964-67 trade conference
Commodity
. Hate . : pr :Lor to:---~( K_e_n.,...n_e_d_,y'--R,_,.o ..... un_d_,)'-----
Se cond stage,: Final stage, :Jan· l, effective effective
Stone statuary and sculptures, other than originals, the professional productions of sculptors: only.
Articles of alabaster, of jet, or of alabaster and jet, not specially provided for.
Articles of chalk, not specially provided for.
Marble, breccia, and onyx, and articli::s thereof, 11ot speeial-: ly prov:ided :!'01·.
1968
8% ad val.
17'~ ad val.
10% ad val.
Jan. 1, 1969
6% ad val.
Jan. 1, 1972
4% ad val.
13. 5% ad val.: 8. 5~0 ad val.
8% ad val. 5% ad val.
J.6. 511 ad val.: J 0. 5"/v ad val.
1/ Statuary aud sculptures may be i rnportcd w1de 1· certain conditions under the provj_::1ions of items '(65 .15, '(66 .20, '((i6 .25, (~'.)0.'70, 851.20, 862.10, and e62.20.
Januw·y 1969 ):1
MARBLE, JE'r, ALABASTER, AND CHAIK ARTICLES, AND S'.rONE SCfilP'rlJRES, NOT ELSEWHERE ENUMERA'l'ED
61
The tabulation above Ghows the column 1 rates of duty in effect prior to January 1, 1968; these rates had remained unchanged under the TSUS from-August 31, 1963, through 196T. Also shown are the second and final stages of the annual rate modifications resulting from concessions granted by the United States in the Kennedy Round of trade negotiations concluded on June 30, 1967, under the General Agreement on Tariffs and Trade. These concessions, which amount to reductions of 50 percent, are being put into effect in five annual stages (see pertinent sections of the TSUSA-1969, reproduced in appendix A, for the staged rates).
Comment
No data are available on U.S. production or consumption of any of the articles -covered in this summary, and information is so sketchy that not even reasonable estimates are possible. Articles covered here range from high-priced professional creations to low-priced, mass-produced novelties. The aggregate value of the consumption of novelty items probably far exceeds that of specialty and luxury items. It is believed that U.S. production of these articles as a whole (but not of stone sculptures) is considerably greater than imports, which currently have a value of about $5 million a year.
The imported stone sculptures classified here come almost solely from Italy, are generally more ornate than those produced in the United States, and have a reputation for superior craftsmanship.
Marble artic~es, also primarily from Italy, constitute about 75 percent of +,he imports covered by this summary in terms of value (see table). Imports consist principally of table tops, lamp bases, sculptures, door saddles and finished wainscoting for use in buildings, and innumerable novelty items. Competition between the imported and the domestic marble articles is limited principally to the door saddles and wainscoting.
Little or no naturally occurring chalk, jet, or alabaster of a type suitable for manufacturing articles is found in commercial quantities in the United States. Domestically produced chalk, jet, or alabaster articles would most likely be made from imported rough stone.
The value of U.S. exports is believed to be equivalent to only a small part of the value of imports.
January 1969 5:1
62 MARBLE!, JET, ALABASTER, AND CHALK .ARTICLES, AND STONE SCULPTURES, NOT ELSEWHERE ENUMERATED
Marb+e, jet, alabaster, and chalk articles, not elsewhere enumerated; and professional stone sculptures: U.S. imports for consumption, by item and by principal sources, 1964-68
Articles of chalk--------------: 4 3 4 l 12 Japan------------------------=-----l--~---l------~2-.~-l-7---------l All other--------------------: 3 2 2 l 11
Marble, ~reccia, and onyx articles-------------------:~4~,7~1~2,___~4,~4~1~7 ___ 4~,~0~6~2---3~,~7~7~3---4~,~l-6 __ 3
Source: Compiled from official statistics of the U.S. Department of Commerce.
Note.--Comparable data not available for the years before 1964.
January 1969 5:1
,·.1'
S'rGNE, CRUDE, AND NOT SUITABLE FOR USE AS MONUMENTAL, 6 3 PAVING, OR BUILDING STONE
Commodity
Stone, not suitable for monumental, paving, or building stones:
TSUS item
Granite, not manufactured--------------------------- 513.61 Limestone, crude------------------------------------ 514.11 Other, not manufactured and not ·elsewhere enumer-
Note.--For the statutory descrir>-t:l.on, see the 'l'a,tiff S~hedules of the United States Annotated (TSUSA-1969).
U.S. trade position
U.S. imports of crude stone not suitable for use as monumental, paving, or building stone have been declining steadily, in terms ot value, since 1962. Exports are believed to be negligible. Consumption, which is substantial, is supplied principally by domestic production.
Description and uses
The stone covered here, not suitable for use as monumental, paving, or building stone, consists almost wholly of large, heavy, irregularly shaped chunks; such material is usually termed "riprap" in the trade. Such stone includes granite, limestone other than that to be used in the manUfacture of fertilizer, sandstone, basalt, and other varieties except marble, breccia, onyx, quartzite, slate, and travertine; all of the latter varieties of stone, if in riprap form, are covered in other swnmaries in this volume. Jet, although previously used for jewelry and trinkets, ordinarily has no other uses than for fill, etc.
Stone riprap is used principally for river and harbor work, such as in spillwa\}'s of dams, for protection of shorelines and docks, and in other construction which must resist the force of currents, waves, and tides. Another use is as a fill material in roadways and embankments. For the purpose of this summary, the term "crude" is used to denote either "crude" or "not manufactured", as applicable.
December 1968 5:1
64 STONE, CRUDE, AND NOT SUITABLE FOR USE AS MONUMENTAL, PAVING, OR BUILDING STONE
U.S. tariff treatment
The column 1 (trade-agreement) rates of duty applicable to imports (see general headnote 3 in·the TSUSA-1969) are as follows:
TSUS item
513.61
513.91
514.11
515.41
Conunodity
Granite, not manufactured, and not: suitable for use : as monumental, paving, or build-:
· ing stone. Jet, not manufac
tured. Limestone, crude,
not suitable for use as monumental, paving, or building stone.
Stone, not manufactured, and not: suitable for use : as monumental, paving, or build-: ing stone.
Rate prior to Jan. 1, 1968
Free
Free
20¢ per short ton
Free
U.S. concessions granted in 1964-67 trade conference
(Kennedy Round)
Second stage, effective
Jan. 1, 1969
16¢ per short ton
Final stage, effective
Jan. 1, 1972
10¢ per short ton
1J Duty-free status not affected by trade conference. 2/ Duty-free status bound by trade conference, effective January 1,
1968.
The tabulation above shows the colunm 1 rates of duty in effect prior to January 1, 1968; ·these rates had remained unchanged under the TSUS from August 31, 1963, through 1967. Also shown ar·e the second and final stages of the annual rate modification resultirtg from a concession granted on item 514.11 by the United States in the Kennedy Round of trade negotiations concluded on June 30, 196'7, under the General Agreement on Tariff's and Trade. 1.I'his concession, which amounts to a reduction of 50 percent, is being put into effect in five annual stages (see pertinent sections of the TSUSA-1969, reproduced in appendix A, for the staged rates). The duty free status or
December 196f) 5:1
STONE, CRUDE, AND NOT SUITABLE FOR USE AS MONUMENTAL, 65 PAVING, OR BUILDJNG STONE
items 513.61 and 515.41 were not affected by the trade conference. The free rate for item 513.91 was bound in the Kennedy Round.
Based on imports in 1968, the average ad valorem equivalent of the 1968 rate of duty on item 514.11 was 5.6 percent.
Comment
Annual U.S. production and consumption of stone in crude form, not suitable for use as monumental, paving, or building stone, ranged from about 30 million to 40 million short tons during the period 1962-67 (table 1). Domestic production, which is usually incidental to the production of stone for other purposes, is scattered through at least 25 States, particularly coastal States and States located along the Mississippi River and its tributaries. This product.ion consists largely of granite and basalt, with relatively smaller quantities of limestone and other types, except jet; there is no known domestic production of jet of the ty:pe covered in this summary. These materials are all of low value, and transportation costs restrict their movement to short distances.
Exports are believed to be negligible.
During the period 1964-68, imports declined from· a high of 676,000 short tons in 1964 to a low of about 49,000 short tons in 1967 before increasing moderately in 1968 (table 2). Annual imports in this period averaged 337,000 short tons. Imports are almost all from Canada and Me~ico. Usual~, the bulk of the imports, in terms of quantity, consist of limestone. There have been no imports of jet in many years.
December 1968 5:1
66 STONE, CRUDE, AND NOT SUITABLE FOR USE AS MONUMENTAL, PAVING,. OR BUILDING STONE
Table 1.--Stone, crude, not elsewhere enumerated, which is not suitable for use as monumental, paving, or building stone: U.S. production and imports for consumption, 1962-68
Source: Production compiled from official sta~istics of the U.S. Bureau of Mines; imports compiled ·from official statistics of the U.S. Department of Cormnerce.
December 1968 5:1
STONE, CRUDE, AND NOT SUITABLE FOR USE AS MONUMENTAL, 67 PAVING, OR BUILDING S'IDNE
Table 2.--Stone, crude, not elsewhere enumerated, which is not suitable for use as monumental, paving, or building stone: U.S. imports for consumption, by variety, 1964-68
.Note.--For the statutory description, see the Tariff Schedules of the United States Annotated (TSUSA-1969).
u.s. trade position
u.s. production of monumental, paving, and building stone is large; annual sales usually amount to $85 million to $95 million. U.S. imports, valued'at $10 million to $13 million a year, are five to six times as large as exports.
Description and uses
The stone included in this summary is often used for monumental., paving, and building purposes, some varieties to a greater extent than others.~ For granite, limestone, and those stones not specially provided for by name in the TSUS, there are separate tariff provisions for the stone suitable for use as monumental, paving, or building stone and that whi~h is not suitable for such uses. A separate tariff provision (item 515.24) also covers "travertine, hewn, sawed, dressed, polished, or otherwise manufactured" which is "suitable for use as monumental, paving, or building stone". Travertine in the un-. manufactured state, however, is covered in a single tariff provision (item 515.21) without respect to its suitability or nonsuitability for use as monumental, paving or building stone. In accordance with its tariff classification, all unmanufactured travertine is covered in this summary. Likewise, no distinction is made in the tariff provisions relating to marble, breccia, and onyx based on suitability for use as monumental, paving, or building stone, and for that reason the marble, breccia, and onyx coming within the particular tariff descriptive provisions whether or not suitable for monumental, paving, or building uses are included i~ this summary. Although slate has some uses similar to those of the stones described above, the quarrying, processing, and major uses of slate are substantially unlike those of most monumental, paving, and building stone, and slate and articles thereof are covered in other summaries in this volume (see summaries covering items 515.11 to 515.14 and item 513.31). Quartzite is also covered in a separate summary.
February 1969 5:1
70 MONUMENT.AL, PAVING, .AND BUILDING STONE
The term "monumental, paving, or building stone", 1/ as applied to natural stone, generally refers to stone sold in blocks or slabs of specified shapes and usually of specified sizes, including roughhewn, sawed, cut or carved blocks for the foundation and walls of buildings, roofing and flooring slabs, cut and polished memorial stone, paving and curbing blocks, and some special products consisting wholly or mainly of slabs or blocks of stone, such as stone steps, sills, and tanks fabricated from pieces of stone. As applied to marble, the term "slabs" in items 514.61 to 514.65 means flat stone pieces, not over 2 inches thick, having a facial area of 4 square inches or more, whether or not cut to size or rubbed or polished on one or both surfaces, but with edges not beveled, rounded, or otherwise processed except to facilitate installation as tiling or veneering in building construction (headnote 2, part lC, schedule 5 of the TSUS).
It has been administratively determined that granite grave mark~ ers, tombstones, monuments, and memorials are classifiable as "pitched, lined, pointed, hewn, sawed, dressed, polished; or otherwise manufactured" granite suitable for use as monumental stone, under item 513.74 rather than as articles of granite under item 513.81 or 513.84 (T.D. 66-94(20)).· The marketing of granite grave markers, tombstones, and finished monuments, however, is closely associated with that of stone articles and monuments of other stone and is discussed in the sununary in this volume covering stone and articles of stone not elsewhere enumerated. Stone quarried by the wire-sawing method is considered to be sawed stone for tariff purposes; hand-chiseled edges are "hewn, sawed, dressed, polished, or otherwise manufactured." In determining whether stone is suit.able for use as monumental, paving, or building stone, various considerations are taken into account, including whether the stone is "capable of being squared" for such use, whether all four edges are polished (building stone ordinarily does not have all edges polished), and whether the edges have been beveled or rounded other than for the purpose of installation in building construction.
The principal mineralogical varieties of stone used for monumental, paving, and building purposes are these:
Granite, a crystalline igneous rock Marble, a metamorphosed and recrystallized· limestone Limestone, a consolidated sedimentary calcium carbonate Sandstone, a consolidated sand Travertine, a crystalline calcium carbonate deposited
out of the waters of springs.
1/ In this sununary the term ''shaped" is sometimes used in lieu of :imonumental, paving, and building.'.'
February 1969 5:1
MONUMENTAL, PAVING, AND BUILDING STONE 71
Basalt, diabase, diorite, serpentine, onyx, and breccia are aJ.so used to a limited extent.
The different mineraJ.ogicaJ. varieties of stone have distinguishing physical characteristics which enable experienced persons to identify them readily, frequently even with respect to State or country of origin. GeneraJ.ly speaking, granite.is noted for hardness and durability; marble and travertine, for distinctive colors and patterns; and limestone and sandstone, for durability and economy. Granite is used principally in block form for monumental purposes and in block and slab form in large public and commercial buildings; marble and travertine, in slab form for decorating interior and exterior surfaces and for making decorative utilitarian items, 1/ such as table tops; limestone in massive block form, for public and commercial buildings; and sandstone in slab form, as an exterior facing for private and public buildings.
Monumental, paving, and building stone is removed from quarries by various methods. Large quarry blocks are split from the ledges of rock mainly either by channeling and wedging or by drilling and broaching, or the blocks are cut free with wire saws or oxygen-kerosene jet flames. Large quarry blocks are usually cut into smaller sizes before removal to mills. In the mills, the blocks are cut to predetermined shapes and sizes by machines that saw, plane, joint, grind, turn, or flute.
Monumental, paving, or building stone is used for exterior and interior parts of buildings; in monuments, bridges, revetments, and foundations; as curbing, paving, and flagging; and for other architectural and engineering purposes. For economic reasons, the use of stone as a load-bearing structural unit has declined, and stone producers now specialize in the production of non-load-bearing, thin veneer slabs for both exterior and interior use.
The choice of a particular stone for a given use depends on many factors. Physical characteristics such as workability, strength, and durability are of paramount importance. The stone nrust have good resistance to weathering processes, fire, abrasion, and the chemical action of cleaning solutions. Other factors include the reputation of the stone and the dealer, and his ability to furnish sizable tonnages of uniform color, texture, and soundness. Esthetic qualities are also important in both exterior and interior stone used in buildings and monuments. Exterior stone, except veneer, usually need not be as attractive in color and texture as stone for interior use. Monumental stone must be free of flaws, have pleasing color and texture, and take and retain a high polish.
iJ Articles of marble are covered in a different summary in this volume; see summary on marble, jet, aJ.abaster, and chalk articles, and stone sculpture, not elsewhere enumeratedo
February 1969 5:1
72 MONUMENTAL; PAVING, A.'ND BUILDING STONE
Other materials, such as plain concrete, brick, stainless steel, aluminum, porcelain-enameled steel, plastics, ceramic veneers, glass, and exposed aggregate concretes are being used to an increasing extent rather than stone for architectural and engineering purposes.
UoSo tariff treatment
The column 1 (trade-agreement) rates of duty applicable to imports (see general headnote 3 in the TSUSA-1969) are as follows:
TSUS item
513.71
513.74
514.21
514.24
Commodity
:u.s. concession granted in ., Rate : 1964-67 trade conference
(Kennedy Round) :prior to:~~~~~~~~~~~~~
Granite, suitable for use as monumental, paving, or building stone:
Not pitched, not lined, not pointed, not hewn, not sawed,: not dressed, not polished~ and not otherwise manuf actured.
Limestone, suitable for use as monumental, paving, or building stone:
Not hewn, not sawed, not dressed, not polished, and not otherwise manuf actured.
Hewn, sawed, dressed, polished, or otherwise manufactured.
Jan. l,:Second stage, l968 : effective
: Final stage, : effective
1¢ per cu. ft.
i2.5°/o ad val.
2¢ per cu. ft.
21°/o ad val.
: Jan.· 1, 1969
Free 1.)
10°/o ad val.
1¢ per cu. ft.
: Jan. 1, 1972
6°/o ad val.
16.5% ad val.: 10.5°/o ad val.
See footnotes a.t end of tabulation February 1969 5:1
TSUS item
514. 51
514.54
514.57
514.61
514.65
515.21
515.24
MONUMENTAL, PAVING, AND BUILDING S'IDNE 73
·u.s. concession granted in : 1964-67 trade conference
Commodity Rate · (Kennedy Round)
:prior.to:
Marble, breccia, and onyx:
Marble, breccia, in block, rough or squared only.
Onyx, in block, rough or squared only.
Marble, breccia, or onyx, sawed or dressed, over 2 inches thick.
Slabs: Not rubbed arid not
polished in whole or in part.
Rubbed or polished in whole or in part.
Travertine, not hewn, not sawed, not dressed, not polished,: and not otherwise ' : manufactured.
Travertine, hewn, sawed:,: dressed, polished, or otherwise manufac• tured, and suitable for use as monumental,: paving, or building stone.
~~~~~~~~~~~~-
Jan. 1 ' =s d 1968 : econ s~age,
27.5¢ per· cu.· ft.
32.5¢ per cu. ft.
effective :Jan. 1, 1969
22¢ per cu. ft.
26¢ per cu. ft.
50¢ per: 40¢ per cu. cu. ft. ft.
.. 5.5% ad: 4% ad val. val.
7% ad 5.5% ad vai. val.
10.5¢ 8¢ per cu. per ft. cu. ft.
. :Final stage, : effective :Jan. lJ 1972
13.5¢ per cu. ft.
16¢ per cu. ft.
: 25¢ per cu. ft.
2. 5% ad val.
3.5% ad val.
5¢ per cu. ft.
21% ad 16.5% ad val.: 10.5% ad val. val.
February 1969 5:1
TSUS item
515.51
515.54
MONUMENTAL, PAVING, AND BUILDING STONE
Rate
=u.s. concession granted in 1964-67 trade conference
(Kennedy Round) Commodity :prior to:
------------------------------------~
Stone, not elsewhere provided for, suitable for use as mon-: umental, paving or building stone:
Not hewn, not sawed, not dressed, not polished, and not otherwise manufactured.
· Hewn, sc:.wed, dressed, polished, or otherwise manufactured.
Jan. l,:Second stage, 1968 : effective
:Jan. 1, 1969
2¢ per cu. ft.
1¢ per cu. ft. y
:Final stage, : effective =Jan. 1, 1972
1¢ per cu. ft. y
21% ad val.
16.5% ad val.: l0.5% ad val.
]J Full concession became effective on Jan. 1, 1968. g/ Final concession rate became effective Jan. 1, 1969.
The tabulation above shows the column 1 rates of duty in effect prior to January 1, ·1968; these rates had remained unchanged under the TSUS from August 31, 1963, through 1967. Also shown where applicable are the second and final stages of, the annual ra;te .. modifications resulting from concessions granted by the United States in the Kennedy Round of trade negotiations concluded on June 30, 1967, under the General Agreement on Tariffs and Trade. These concessions, which a.mount to reductions of about 50 percent on all items except item 513.71, are being put into effect in five annual stages (except for item 513.71, 514.21 and 515.51) (see pertinent sections of the .TSUSA-1969, reproduced in appendix A, for the staged rates). The rate on item 513.71 was made free of duty in the first stage. The full concession granted on item 514.21 also became effective in the first stage, while that on item·515.51 was effective in two stages.
February 1969 5:1
MONUMENTAL, PAVING, AND BUILDING STONE 75
The ad valorem equivalents of the 1968 rates, based on imports in 1968, were as follows for the items in this summary dutiable at specific rates:
The value.of annual U.Se consumption of all types of monumental, paving, and building stone combined (except slate) is about $100 million. Insofar as may be surmised from available data, consumption· peaked in 1963-64 for the period 1962-67 and was moderately lower in the three succeeding years.
Consumption of the individual types of monumental, paving, and building stone also is inconclusive of any particular trends. Consumption of shaped granite increased substantially in terms of value, to. more than $40 million in 1967, compared with a stable-annual consumption valued at about $35 million reported for 1962-66. It has been esti- · · mated that about 60 percent of the output of shaped granite is used in monuments (predominantly grave markers), 30 percent in high-quality nonresidential buildings, and 10 percent in curbing, flagging, and paving applications.
The value of annual u.s. consumption of shaped limestone varies. from $15 million to $18 million, while that of annual consumption of the marble-breccia-onyx group is probably in the range of $20 million to $25 million; by far the bulk of constimption in the latter group is represented by marble. Annual consumption of the miscellaneous stones, principally sandstone, included under items 515.51 and 515.54, was valued at about $15 million in 1966-67, some 15 to 20 percent less than in 1963.
U.S. producers
The number of producers of monumental, paving, and building stone is not known with exactness. The 1963 Census of Mineral Industries reported that 551 firms operated quarries for prod.ucing such rough stone; these totals were approximately the same as those shown in the 1958 Census of Mineral Industries. Of the 551 companies operating
February 1969 5:1
MONUMENTAL, PAVING, AND BUILDING STONE
such quarries, about 42 percent had facilities for dressing stone; most of the output from the remaining quarries was shipped to local fabricators throughout the country. The quarry-dressing plant combinations were much larger, on the average, than the nonplant quarries and hence accounted for the bulk of the output.
In 1966, monumental, paving, and building granite was produced at 158 quarries in 21 States. The major granite quarrying and finishing operations are concentrated in one-industry rural areas in Vermont, Massachusetts, South Dakota, Georgia, Minnesota, North Carolina, and Wisconsin. Granite not dressed to final form at the quarry is generally shipped to small local fabricators, principally finishers of grave markers.
Limestone for monumental, paving, and building purposes was quarried at 102 locations in 24 States in 1966, with about two-thirds of the output coming from 18 quarries in Indiana, largely in the Bedford area. Wisconsin and Minnesota also haye active limestone operations.
Sandstone for building uses was produced in 1966 at 191 quarries in 29 States; Ohio, Pennsylvania, and New York were by far the largest producing States.
In 1966, production of marble slabs and other shapes was accounted for by 36 quarries situated in 15 States, principally Vermont, Georgia, Missouri, and Tennessee.
An unrecorded number of quarries produced the remaining types of monumental, paving, and building stone.
U.S. production
The long-term trend in the value of annual U.S. production of all .types of monumental, paving, and building stone combined is moderately upward; this trend is also apparent for most types individually, although over a shorter period of time production may fluctuate' considerably and even decline for a few years. Thus, the value of overall production declined from nearly $88 million in 1963 to $80 million in 1966 but regained most .of that loss in 1967 (table 1).
The value of the annual output of shaped granite increased from an average of about $28 million in 1957-61 to an average of $33 million in 1962-66 (table 2). The value of production increased sharply in 1967 to $39 million. Between 8 and 12 percent of the output of granite, in terms of value, comes from each of the following States: Vermont, Massachusetts, South Dakota, Georgia, and Minnesota.
February 1969 5:1
MONUMENTAL, PAVING, AND BUILDING STONE 77
The value of the annual production of shaped limestone in 1962~ 66 ranged from about $19 million in 1964 to $17 million in 1962 (table 3), and averaged $18 million; the annual average in 1957-61 was also about $18 million. About 60 percent of the value of the output is usually accounted for by Indiana, and 10 percent each, by Wisconsin and Minnesota.
The value of the annual output of.monumental, paving, and building marble (including minor amounts of breccia and onyx) has shown wide fluctuation in the past few years, ranging from $21 million in 1963 to $14.4 million in 1966 (table 4). In terms of value, the principal producing States in 1966 were Vermont, Georgia, Missouri, and Tennessee, in that order.
The value of the annual output of monumental, paving, and building sandstone usually ranges from $10 million to $12 million, approximately half of which is accounted for by Ohio and one-fourth by New York and Pennsylvania combined. Shaped sandstone accounts for about three-fourths of the value of "other" stone shown in table 5. Production of the remaining unspecified types of dimension stone is generally valued at $3 million to $4 million a year.
U.S. exports
Prior to 1965, all types of rough and dressed monumental, paving, and building stone were combined in export data; beginning with that year, separate data have been reported for "unworked" {i.e., rough split or squared) and "worked" (i.e., shaped or polished or both). About 45 percent of the exports shown in table 1 are accounted for by unworked stone, ana 55 percent, by worked stone. Data are not available showing exports by type of stone, although it is believed likely that granite and marble are the major types exported.
The bulk of the u.s. exports of such stone go to Canada.
U.S. imports
In terms of value, the United States imports approximately five times as much monumental, paving, and building stone as it exports. In the period 1962-68, the value of' annual imports ranged from about $8.7 million in 1962 to nearly $12.9 million in 1968 (table 1). Italy supplied more than half of total imports.
Imports of shaped granite have been highly irregular in recent years (table 2). In 1963-67, annual imports of such granite had an average value of $2.2 million. Imports were valued at $4.2 million
Tubruary 1969 5:1
78 MONUMENTAL, PAVING, AND BUILDING STONE
in 1968, with Canada and Italy accounting for the major share of the increase. Although the United States obtains granite from many countries, Canada has improved its position as a supplier and now furnishes about half of total u.s. imports of granite. One-fourth to one-third of the granite imports come from Italy.
Imports of monumental, paving, and building limestone are neg~igible (table 3).
Imports of shaped marble (including minor amounts of breccia and onyx) reached a peak value of nearly $8 million in 1964 (table 4), after several years of steady growth. Marble imports were progressively lower in each of the 3 succeeding years and in 1967 amounted to $5.5 million; in 1968, they amounted to $7.1 million. About three-fourths of the imported marble slabs and other shapes comes from Italy, and most of the remainder, from Portugal.
Imports of "other" types of monumental, paving, and building stone, consisting almost wholly of travertine from Italy, had an average value of about $1.5 million a year in 1963-67, ranging from $1.4 million in 1965 to $1.8 million in 1963 (table 5). .
February 1969 5:1
MONUMENTAL, PAVING, AND BUILDING STONE 79
Table 1.--Monumental, paving, and building stone (except slate): U.S. production, imports for consumption, and exports of domestic merchandise, 1962-68
iJ Consists .mainly of marble and granite, the bulk of which go to Canada. Producer-reported exports of shaped slate stone have been subtracted from officially reported shaped stone exports, which include slate.
g/ Estimated, to eliminate an error in source data. 3/ Partly estimated. Tj) Not available.
Source: Production compiled from official statistics of the U.S. . Bureau of Mines; imports and exports compiled from official statistics of the U.S. Department of Conunerce, except as noted.
Februa;ry 1969 '.)! 1
80 MONUMENTAL, PAVING, AND BUILDING STONE
Table 2.--Granite dimension stone: U.S. production, and imports for consumption, total and by principal sources, 1962-68
Source: Production compiled from official statistics of the u.s. Bureau of Mines; imports compiled from official statistics of the U.S. Depart~ent of Commerce.
February 1969 5:1
MONUMENTAL, PAVING, AND BUILDING STONE
Table 3.--Limestone dimension stone: u.s. production, and imports for consumption, total and by principal sources, 1962-68
if. Not separately classified prior to August 31, 1963. g/ Not available. 3./ Less than $500.
11 y 11 Ii
3 115 9 35 5 69 2 75
:31 43
Source: Production compiled from official statistics of the u.s. Bureau of Mines; imports compiled from official statistics of the U.S. Department of Commerce.
February 1969 5:1
82 MONUMENTAL, PAVING, AND BUILDING STONE
Table 4.--Ma.rble, breccia, and onyx dimension stone: U.S. production, and imports for consumption, total and by principal sources, 1962-68
Source: Production compiled from official statistics of the u.s. Bureau of Mines; imports compiled from official statistics of the u.s. Department of Commerce.
February 1969 5:1
MONUMENTAL, PAVING, AND BUILDING STONE 83
Table 5.--Dimension stone, 1/ other than granite, limestone, marble, breccia, onyx, and slate: U.S. production, and imports for consumption, total and by principal source, 1962-68
1/ Includes sandstone, travertine, greenstones, gneisses, schists, and all other types of dimension stone not excepted in the title of this table.
2/ Virtually all travertine. 1962 and 1963.
Includes small a.mounts of limestone in
3) Estimated, to eliminate a major error in source data.
Source: Production compiled from official statistics of the U.S. Bureau of Mines; imports compiled from official statistics of the U.S. Department of Commerce.
Note.--For the statutory description, see the Tariff Schedules of the United States Annotated (TSUSA-1969).
U.S. trade position
85
Although no statistics are available, U.S. production of articles of stone, not .. elsewhere enumerated, is known to be much larger than imports. U.S. imports have shown no specific trend, and exports are believed to be negligible.
Description and uses
This surmnary primarily covers a wide variety of articles made f'rom granite, limestone, travertine, and "other stone" (sandstone, f'reestone, traprock, and the like). Articles of marble, breccia, and onyx (item 514.81); of alabaster and jet (item 513.94); and of slate (item 515.14) are included in other summaries in this volume.
Among the dif.ferent types of stone articles covered in this summary are: disassembled mausoleums and crypts; table tops; window sills; pedestals; lamp bases; unassembled fireplaces; and nonprofessional carvings of animals and biblical or other figures. Also covered are grave markers, tombstones, and monuments of other stone than granite. Although such articles of granite are excluded from the tariff classification, they are discussed in this summary because of their close relationship with these articles made from other stone (see the summary on monumental, paving, and building stone). Stone articles are "decorated" by such means as ornamental carving, enamelling, coloring, and painting.
U.S. tariff treatment
The column 1 (trade-agreement) rates of duty applicable to imports (see general headnote 3 in the TSUSA-1969) are as follows:
January 1969 5:1
86
TSUS item
513.81
513.84
514.41
514.44
515.31
515.34
515.61
515.64
ARTICLES OF STONE, NOT ELSEWHERE ENUMERATED
Commodity
Stone and articles in chief value of
U.S. concessions granted in 1964-67 trade conference
· Rate · (Kennedy Round) :prior to:------------------~-'-------~------~ Second stage,: Final stage, :Jan. l, effective effective . 1968
Jan. 1, Jan. 1, 1969 1972
stone, not specially: provided for:
Granite, not deco- 15% ad 12% ad val. 7 .5% ad val. rated. val. . .
Granite, decorated----: 27% ad 21. 5% ad val. : 13 .5% ad val. val.
Limestone, not deco-· 15% ad 12% ad val. 7 .5% ad val. rated. val. :
Limestone, decorated--: 27% ad 21. 5% ad val. : 13 .5% ad val. val.
Travertine, not deco- 15% ad 12% ad val. 7 .5% ad val. rated. val. :
Travertine, deco- 27% ·ad 21.5% ad val.: 13.5% ad rated. val. val.
Other stone, not deco-: 15% ad 12% ad val. 7 .5% ad val. rated. val. . .
Other .stone, deco- 27% ad 21. 5% ad val. : 13.5% ad rated. val. val.
The tabulation above shows the column 1 rates of duty in effect prior to January 1, 1968; these rates had remained unchanged under the TSUS f'rom August 31, 1963, through 1967. Also shown are the second and final stages of the annual rate modification resulting f'rom a concession granted by the United States in the Kennedy Round of trade negotiations concluded on June 30, 1967, under the General Agreement on Tariffs and Trade. These concessions, which amount to a reduction of 50 percent on each item, are being put into effect in five annual stages (see pertinent sec~ions of the TSUSA-1969, reproduced in appendix A, for the staged rates).
Comment
The value of U.S. consumption of the stone articles covered her~ is not known. Granite grave markers and other finished granite monuments probably comprise the bulk of the total consumption. The remainder consists chiefly of high-quality utilitarian and decorative
January 1969 5:1
ARTICLES OF STONE, NOT ELSEWHERE ENUMERATED
articles whose production involves specialized labor in costly and time-consuming work.
87
U.S. producers range from large, fully integrated quarriers and finishers of granite monuments to small, one-man shops scattered throughout the country. It is impossible to make a reasonable estimate of the number of producers because of the multitude of articles involved and the wide variety of producers.
U.S. exports, not separately reported in official statistics, are believed to be negligible.
During 1964-68 the value of annual U.S. imports ranged from $473,000 in 1964 to $353,000 in 1967 (see table).
In 1968, "other" stone articles, not decorated, accounted for approximate1y·33·percent of the total value of imports, and travertine articles, not decorated, and granite articles, not decorated, for about 17 percent each. Italy was the most important supplier of most of these items.
January 1969 5:1
88 ARTICLES OF STONE, NOT EISEWBERE ENUMERATED
Articles of stone, not elsewhere enumerated: U.S. imports for consumption, by types, 1964-68
Other stone: 1/ Not decorated--------------------: 71 87 138 128 Decorated------------------------: 63 ·39 28 29
Total--------------------------: 473 378 400 353
1/ Does not include articles of alabaster, jet, marble, breccia, onYx., and slate, or of statuary which are the production of professional sculptors.
Source: Compiled from official statistics of the U.S. Department of Commerce.
January 1969 5:1
66 7
10 21
64 4
126 84
382
QUARTZITE
Connnodity TSUS item
Quartzite, whether or not manufactured------ 514.91
Note.--For the statutory description, see the Tariff Schedules of the United states Annotated (TSUSA-1969).
U.S. trade position
U.S. imports of quartzite are small compared with domestic production and fluctuate widely from year to year.
Des.cription and uses ., .
Quartzite is any natural rock composed of quartz grains fully cemented together, mainly with silica. The purer grades, which contain only small amounts of associated minerals, are used as a flux in the smelting of copper ores, as a filler for acid towers in the chemical industry, and as an ingredient in the manufacture of glass. Low-iron quartzite is employed as a mill liner or grinding medium in the conuninuti9n of ores, ceramic batches, and various other raw materials. A special form of quartzite called ganister is the principal raw material for the manufacture of refractory silica brick. Quartzite containing large amounts of impurities is utilized as concrete aggregate, railroad ballast, and roadstone.
U.S. tariff treatment'
Item 514.91 continues the duty-free status of quartzite as provided for under paragraph 1775 of the original Tariff Act of 1930. The duty-free status was bound under the GATT in 1948.
Comment
The greatest quantity of quartzite is used in road construction; the use of this material, which has a low unit value~ depends_ on.its economic availability to nearby highway construction. U.S. consumption of the second most important type, refractory grade quartzite, is dependent on the level of operations of silica brick-lined furnaces in the metals extraction and conversion industries.
Annual U.S. production of refractory grade quartzite in 1962-67 increased from 389,000 short tons in 1962 to 533,000 short tons in 1965 but decreased to 354,ooo short tons in 1967 (see table).
December 1968 5:1
90 QUARTZITE
·oWing to high transportation costs of quartzite relative to value, U.S. ·exports and imports are fairly small. Export statistics are not separately·reported. During the .period 1963-67 U.S. imports ranged from.:132 1 000 short ·tons in 1966 to 31 000 short tons in 1967 (see table). Annual imports in this period averaged 62,000 short tons, in contrast with an average of 69,000 short tons for the preceding 5-year period. Imports were -very small in 1968. Canada·was the main source of imports.
December 1968 5:1
QUARTZITE 91
Quartzite, whether or not manufactured: U.S. production and importsfor consumption, 1962-68
Year Production ~ . . Imports y Quantity (1,000 short tons)
'JJ Refractory grade quartzite only. Data on other grades are not separately reportedj production of such other grades, however, was probably more than twice as much, in terms of quantity, as output of refractory grade quartzite.
94 5
63 72
132 3 7
296 73
249 357 5~ 198 273
y Data does not include shipments from Brazil, which are believed to be Brazilian pebble. · ~ Not available.
Source: Production compiled from official statistics of the U.S. Bureau of Minesj imports compiled from official statistics of the U.S. Department of Commerce.
Note.--Exports are not separately reported.
December 1968 5:1
SLATE, AND ARTICLES OF SLATE
Commodity TSUS item
Roofing slate---------------------------------- 515.11 Slate, and articles of slate, not
Note.--For the. statutory description, see the Tariff Schedules of the United States Annotated (TSUSA-1969).
U.S. trade position
93
U.S. imports of the commodities covered by this summary consist almost entirely of slate articles and have a value equivalent to about one-fifth that of U.S. production of slate and articles of slate, while U.S. exports, likewise almost all in the form of articles, are equivalent in value to less than one-tenth of the value of imports.
Description and uses
This summary covers slate in its various forms, including blocks, slabs, and sheets, and slate articles, but excludes slate flour and granules, which materials are provided for under TSUS item 513.31 and included in another summary in this volume, namely "Crushed or Ground Stone."
Slate is a fine-grained metamorphic rock that varies widely in color and is characterized by a more or less perfect cleavage in one direction, enabling it to be split readily into sheets of small thickness and comparatively large lateral dimensions. Slate is usually dark gray to blue, although some varieties are light gray, red, green, or purple.
Thin slabs of slate ranging in thickness from 1/8-inch to 3/8-inch used for roofing, as well as slate shingles, are included under item 515.11. This provision had its origins in the exclusionary language to the concession made ·u.nder paragraph 235 of the previous tariff schedules (note proclamation relating to General Agreement on Tariffs and Trade of 1956 (T.D. 54108)). Other slate, slate articles, and articles in chief value of slate (all provided for in item 515.14) include such articles as billiard table tops, blackboards and writing slates, grave vaults and covers, laboratory sinks and hoods, electrical panels, switchboards, and a wide variety of shapes for interior structural uses, such as mantels, window sills, steps, stair
December 1968 5:1
SLATE, AND ARTICLES OF SLATE
risers, baseboards, wainscoting, and floor tile. '};_/ Irregular slabs of slate are used for flagging or stepping stones.
Slate encounters strong competition from other building materials and utilitarian products, many of which are lighter in weight and less expensive. Roofing slate competes with wood, asbestos cement products, and composition shingles and roll roofing. In blackboard applications, boards made of plaster, glass or synthetic compositions may be used in place of slate. For most structural applications slate competes with other stone, ceramic tile, brick, metal, glass, and especially concrete.
U.S. tariff treatment
The column 1 (trade-agreement) rates of duty applicable to imports (see general headnote 3 in the TSUSA-1969) are as follows:
TSUS item
515.11
515.14 .
Commodity
Slate, and articles of slate:
Rate prior to
Jan. 1, 1968
Roofing slate-----: 25% ad val.
Other not specially provided for.
10.5% ad val.
U.S. ·concessions granted in 1964-67 trade conference
(Kennedy Round) Second stage, Final stage,
effective effective Jan. 1 1969 Jan. 1, 1972
20% ad val.
8% ad val.
12.5% ad val.
5% ad val.
The tabulation above shows the column 1 rates of duty in effect prior to January 1, 1968. These rates had remained unchanged under the TSUS from August 31, 1963, through 1967. Also shown are the second and final stages of the annual rate modifications resulting from concessions granted by the United States in the Kennedy Round of trade negotiations concluded on June 30, 196r(, under the General Agreement on Tariffs and Trade. These concessions, which amount to reductions
'};_/ The comprehensive term 11millstock" is used in the slate industry to include forms of structural slate except roofing, as well as a variety of slate shapes, suitable for special uses, such as blackboards, electrical panels, and billiard table tops.
DE:l:•::mber 1968 ~i: l
SLATE, AND ARTICLES OF SLATE
of about 50 percent, are being put into effect in five annual stages. (see pertinent sections of the TSUSA-1969, reproduced in appendix A, for the staged rates).
Comment
95
During the period 1962-67, apparent U.S. consumption of slate increased every year, in terms of value, from about $8 million in 1962 to about $12 million in 1967. In that period, millstock accounted for aQout 45 percent of the total value but only about 20 percent of the quantity. Roofing slate, flagstones, and miscellaneous uses each ac- · counted for about 18 percen~ of the total value.
Slate encounters strong competition from other building materials and utilitarian products, many of which are lighter in weight and less expensive.
Of the approximately 50 U.S. producers of slate and slate articles, 21 are situated in Vermont, 11 in New York, and 9 in Pennsylvania, with most of the remainder in Maine or Virginia.
During the period 1962-67, U.S. production of slate and slate articles increased gradually, in terms of value, from $7.4 million in 1962 to $9.6 million in 1967 (see table). Average annual production_ in this period amounted to $8.8 million, markedly above the level of output of the late 1950's and early 1960 1 s.
During the 5-year period 1962-66, the value of annual U.S. exports of the commodities covered here, averaged $78,ooo, compared with an annual average of $208,000 in 1957-61. Slate exports were valued at $37,000 in 1968.
U.S. imports of slate and slate articles increased sharply, in terms of value, from $0.6 million in 1962 to $2.3 million in 1967 before declining moderately in 1968 (see table). Annual imports in 1957-61 had an average value of only $348,ooo.
Imports of slate and slate articles are believed to consist predominantly of billiard table tops, blackboards and slabs for further fabrication. Imports come mainly from Italy and Portugal.
December 1968 5:1
SLATE; AND ARTICLES OF SLATE
Slate, other than crushed slate, and articles of slate: U.S. production, imports for consumption, and exports of domestic merchandise, 1962-68
1/ Principally from Italy and Portugal. ~/ Not available.
582 1,066 1,401 1,320 1,479 2,333 2,131
116 76 60 76 64 37
Source: Production and exports from official statistics of the U.S. Bureau of Mines; imports from official statistics of the U.S. Department 'of Comm.erce.
December 1968 5:1
MICA, NOT MANUFACTURED, AND MICA FILM AND SPLITTINGS
Note.--For the statutory description, see the Tariff Schedules of the United States Annotated (TSUSA-1969).
U.S." trade position
The United States is the world's largest consumer of unmanufactured mica; imports supply the bulk of U.S. requirements (usually valued from $5 million to $7 million a year).
Description and uses
Mica comprises a group of aluminum silicate minerals which are characterized by an exceptional cleavage, permitting ready separation into thin sheets. Its main characteristics are flexibility, toughness, transparency, chemical stability, low heat conductivity, and high dielectric strength, i.e., the ability to withstand high voltage without puncturing. Muscovite and phlogopite are the two principal varieties of mica used in industry. Chemically, muscovite is potassium aluminum silicate, and phlogopite is magnesium aluminum silicate. Muscovite is the more important in terms of quantities consumed. Man-made mica is also within this summary.
In its natural state, mica occurs in books or crystals of various sizes and thicknesses, usually embedded in rock formations. After the mica is removed from the ground it is carefully hand co1;>bed to rem~ve adhering rock and then carefully sorted and rifted, i.e., split into thin sheets about 1/8 inch or less in thickness. After being rifted, the sheets are trimmed and otherwise prepared by hand with the use of knife or scissors.
Trimmed mica, commonly known as uncut or unmanufactured sheet mica, is further processed into blocks, films, or splittings. TSUS items 516.11 and 516.41 cover all mica in an unmanufactured state, not cut or stamped to dimensions, shape or form, which is neither waste and scrap valued at 5 cents or less per pound nor split block mica. Block mica consists of sheets ranging in thickness from 0.007 to 0.040 inch with a minimum usable area of 1-1/2 by 2 inches. Split block mica (item 516.31)--as defined in headnote l(b) to subpart D, part 1, of schedule 5 of the TSUS--is mica, not cut or stamped, not exceeding 0.020 inch in thickness, that has been split anc selected within a tolerance of 8 mils.
January 1969 5:1
98 MICA, NOT MANUFACTURED, AND MICA FILM AND SPLITTINGS
Film mica (item 516"61) is derived from the best quality trimmed sheet mica split to thicknesses ranging from 0.00125 to 0.006 inch. Mica splittings (item 516.51) as defi'ned in headnote l(c) to subpart D, part 1, of schedule 5 of the TSUS, are mica laminae in bookform or book-pack, or in loose_ pack, suitable for use in the manufacture of built-up mica.
Block mica, split block mica, and film mica are important materials for use in the manufacture of many items, among which are electrical commutators, armatures, radio and radar tubes, radio condensers, diaphragms for oxygen-breathing apparatus, gage-glass gaskets for high temperature boilers, and marker dials for navigation compasses. These forms of mica are also used as parts for electric irons, toasters, water heaters, and other electrical appliances and equipment.
Mica splittings are used almost entirely in making built-up mica, which, as defined in headnote l(d) to subpart D, part 1, of schedule 5 of the TSUS, means electrical insulating plates, sheets, and tapes, whether or not attached to paper, cloth, or other backing, consisting of reconstituted mica, whether or not treated with resins or of a layer of mica splittings and bonding material.
Although many varieties of manmade micas have been developed since 1950, few have proved feasible for commercial use. Manmade micas are relatively expensive, less flexible than natural mica, and not readily split into the thin platelets used in manufacturing many mica products.
January 1969 5:1
MICA, NOT MANUFACTURED, AND MICA FILM AND SPLITTINGS 99
U.S. tariff treatment
The column 1 (trade-agreement) rates of duty applicable to imports (see general headnote 3 in the TSUSA-1969) are as follows:
TSUS. item
516.11
516.31 516.41
516.51
Commodity
Rate prior
to . Jan. 1,:
1968 .
Mica not manufactured (including mica over 0.006 inch in thickness, not cut or stamped to dimen-: sions ,' shape, or form, and split block mica):
Untrimmed phlogopite from which no rectangular piece over 2 inches long or 1 inch wide may be cut.
5% ad val.
Split block mica------: Free Other-----------------: 4¢ per
lb.
Mica splittings---------: Free
516.61 Mica, not over 0.006 Free inch in thickness, not cut or stamped to dimensions, shape, or form.
U.S. concessions granted in 1964-67 trade conference
(Kennedy Round) Second stage,: Final stage, effective effective
Jan. 1 1969 Jan. 1 1972
4% ad val. 2.5% ad val.
1/ y 2¢ per lb. . Free ..
y 1/
y y
y Duty-free status not affected by the trade conference.
The tabulation above shows the column 1 rates of duty in effect prior to January 1, 1968. The rates had remained unchanged under the TSUS from August 31, 1963, through 1967. Also shown are the second and final stages of the annual rate modifications resulting from concessions granted by the United States on TSUS items 516.11 and 516.41 in the Kennedy Round of trade negotiations concluded on June 30, 1967, under the General Agreement on Tariffs and Trade. These concessions, which amount to a reduction of 50 percent on item 516.11 and the elimination of the
January 1969 5:1
100 MICA, NOT MANUFACTURED, AND MICA FILM AND SPLITTINGS
duty on item 516.41, are being put into effect in five annual stages (see pertinent sections of the TSUSA-1969, reproduced in appendix A, for the staged rates). The ad valorem equivalent of.the 1968 rate, based on imports in 1968, was 2.2 percent for item 516.41.
U.S. consumption
During the period 1962-67, apparent annual U.S. consumption of unmanufactured mica, not including mica waste and scrap, ranged from 11.8 million pounds, valued at $8.2 million, in 1962 (table 1) to 7 million pounds, valued at more than $4 million, in 1967.
Data from the U.S. Bureau of Mines show that annual U.S. consumption of block (including split-block) and film mica during the period 1962-66 ranged from 2.3 million pounds, valued at $2.8 million, in 1963 to 2.8 million pounds, valued at $3.6 million, i~ 1966 (table 2). Average annual consumption of such mica in this period amounted to about 2.6 million pounds, valued at $3.2 million, whereas the average for 1957-61 was 2.9 million pounds, valued at $4.1 million. In 1967, consumption declined to about 2 million pounds, valued at about $2.8 million. The decline in consumption is attributed to a reducti9n of mica requirements through the miniaturization of electrical and electronic components and to the substitution of alternative materials, such as ceramic insulators.
During 1962-66, annual U.S. consumption of mica splittings, which consisted entirely of imported material, ranged from 6.7 million pounds, valued at $2.6 million, in 1963 to 8.3 million pounds, valued at $3.7 million, in 1965, and averaged 7.3 million pounds, valued at $3.1 million. The annual average for 1957-61 was 6.5 milliort· pounds, valued at $3.1 million. Consumption in 1967 amounted to 6.2 million pounds, valued at $2.8 million.
Certain grades and qualities of mica have been stockpiled by the U.S. Government as strategic and critical material. As of January 1, 1968, the national stockpile of block mica amounted to about 15.4'million pounds; that of film of all qualities, to about 1.9 million pounds; and that of splittings, to about SO million pounds. Government inventories of block mica and mi~a splittings are in excess of the stockpile objectives as determined by the Office of Emergency Preparedness, the inventory of mica film is less than the objective. In addition, some 4.6 million pounds of ungraded and unsorted domestically mined mica of less than strategic and critical grade is maintained in inventory.
The Congress has authorized the General Services Administration (GSA) to sell the surplus stockpile of mica. The GSA has offered to sell 1 million pounds of mica annually as follows: Mica splittings, 735,000 pounds; mica block, 255,000 pounds; and mica film, 10,000 pounds. Sales of various amqunts of mica began in late 1967.
January 1969 S;l
MICA, NOT MANUFACTURED, AND MICA FILM AND SPLITTINGS 101
U.S. producers and production
In the United States, mica mining is confined largely to a few well-defined areas. In 1960, sheet mica was produced in the United States by about 250 mines, many of them small, part-time operations. The ending of Government purchasing programs in June 1962 resulted in the closing of most facilities for the mining of domestic sheet mica. During 1966 only one mine was actively producing sheet mica. Muscovite mica is the only variety of mica produced in the United States.
. In 1962 the United States produced 363,000 pounds of sheet mica, valued at $13 million. Production fell to a nominal 4,000 pounds, valued at $1,000, in 1966 (table 1). Owing to the large amount of skilled labor required in preparing sheet mica for market, it is uneconomical to produce sheet mica in the United States. Most of the domestically mined sheet mica used by U.S. fabricators consists of roughly trimmed, .low-quality pieces, generally referred to in the United States trade as punch and circle mica.
U.S. exports
U.S. exports of unmanufactured mica, except waste and scrap mica, are nominal. Part of the exports consist of reexports of previously imported sheet mica.
U.S. imports
During the period 1962-67, annual U.S. imports of all types of unmanufactured mica' and mica films and splittings, in terms of value, averaged $6.2 million, ranging from $7.5 million in 1966 to $4.0 million in 1967 (table 1). In 1968, imports amounted to 6.5 million pounds, valued at $3.1 million. The United States is dependent on imports for almost all its requirements of better quality unmanufactured mica and mica films and splittings, the major portion of which are supplied by India.
Imports of unmanufactured bloc~ mica, excluding split block mica, declined from 943,000 pounds, .valued at $1.2 million, in 1964 to 484,000 pounds, valued at $500,000, in 1968 (table 3). Brazil supplied about 43 percent of the total quantity of these imports in 1967.
During the period 1964-6S, annual imports of split-block mica increased steadily from 1.3 million pounds, valued at $1.2 million, in 1964 to 2.5 million pounds, valued at $2.9 million, in 1966, then fell to 1.1 million pounds, valued at $1.0 million, .in 1968 (table 3). In the same period, imports of mica film increased from 94,000 pounds, valued at $338,000, in 1964 to 291,000 pounds, ·valued at $832,000, in 1966, then fell to 98,000 pounds, valued at $233,000, in 1968.
January 1969 5:1
102 MICA, NOT MANUFACTURED, AND MICA FILM AND SPLITTINGS
In 1968 India supplied about 41 percent of the quantity of mica film imported and about 38 percent of that of split-block mica imported. Brazil supplied 62 percent of the quantity of split-block mica imported in 1968.
Annual imports of mica splittings have been irregular in recent years, partly because of fluctuating acquisitions for the U.S. stockpile and partly because of the subsequent uncertainty about the continuing availability of the Indian material at a reasonable price. During the period 1964-68, annual imports of splittings averaged 6.9 million pounds. In 1968 India supplied more than 96 percent of the total quantity of mica splittings.
Foreign production and trade
India accounts for about three-fourths of the total quantity of unmanufactured sheet mica (not including waste and scrap) entering world trade. All Indian mica is muscovite, with splittings accounting for more than 50 percent of the total export value. A factor that has enabled India to maintain its primary position as the major mica producer is th~ country's large reserve of high-grade mica and its abundant supply of experienced and inexpensive labor. High-quality muscovite is produced in the State of Bihar, while lower qualities are mined in the States of Andhra, Pradesh, and Rajasthan.
Indian Government actions have in recent years affected exports of most qualities of natural mica. Among these actions have been the setting of minimum export prices, the levying of an export duty, the banning of exports on a consignment basis, granting of shipments only on irrevocable letter of credit for ·100 percent .of.invoice value, and compulsory Government inspection of mica. These regulations have been initiated to increase foreign exchange earnings and to stimulate domestic fabrication of mica.
Other countries producing muscovite mica are Argentina, Brazil, the Republic of South Africa, and Tanzania. Brazilian producers are making special efforts to take advantage of the Indian situation, and Brazil has become the ~econd largest producer of sheet mica.
The world's largest producer of phlogopite mica is the Malagasy Republic. The only other important commercial source of phlogopite mica is in Canada. Trade in phlogopite mica has been diminishing because of the increased use of other materials.
January 1969 5:1
MICA, NOT MANUFACTURED, AND MICA FILM AND SPLITTINGS 103
Table !.--Mica, not manufactured (except waste and scrap), and mica films and splittings: U.S. production, imports for consumption, exports of domestic merchandise, and apparent consumption, 1962-68
1/ Not separately reported; small amounts included in exports of ground mica.
2/ Not available.
Source: Production compiled from official statistics of the U.S. Bureau of Mines; imports and exports compiled from official statistics of the U.S. Department of Commerce.
January 1969 5:1
104 MICA, NOT MANUFACTURED, AND MICA FILM AND SPLITTINGS
Table 2.--Block and film mica and mica splittings: U.S. consumption, 1962-67
Source: Compiled from official statistics Commerce.
1966 1961 1968
( 1 , 000 pounds)
728 592 484 2,520 1,141 1,129
291 112 98 6,798 4,885 4,808
10,337 6,730 6,519
(1,000 dollars)
1,139 2,853
832 2,694
7,518
of the U.S.
669 500 1,320 1,041
300 233 1,700 1,339
3,989 3,113
Department of
January 1969 5:1
WJ\STE AND SCRAP MICA
Commodity TSUS item
Waste and scrap mica---------------- 516.21-.24
Note.--For the statutory description, see the Tariff Schedules of the United States Annotated (TSUSA-1969).
U.S. trade position
107
Apparent U.S. consumption of waste and scrap mica, which is supplied almost entirely by domestic production, averaged about $_3.3 million a year during 1962-66. U.S. imports and exports are both negligible in comparison with domestic production.
Description and uses
Mica that is not usable as sheet mica !/ because· of being too small or containing gross imperfections, fractures, or mineral inclusions is considered scrap mica. Waste mica is mica obtained from shops where mica articles are cut or stamped from sheet mica. For tariff purposes, such mica valued over 5 cents per pound is considered as mica not manufactured, under item 516.41. In the United States, mica schist (mica too small in size to be considered sheet mica) is mined for use as scrap mica. In the trade this mica is usually referred to as flake mica. The term "scrap mica" is used hereinafter to cover all the forms of waste and scrap mica.
Scrap mica may be either muscovite, a potassium variety of mica, or phlogopite, a magnesium variety of mica; however, there is no use for which either variety is preferred.
Scrap mica is usually ground before being used, although some specially delaminated scrap mica is used to make reconstituted mica. y
1/ th Is
y mica
For the definition of the term, "sheet mica" see the summary in volume on mica, not manufactured, and mica film and splittings. See the summary in this volume on built-up mica and articles of not elsewhere enumerated (items 516.91 and 516.94).
January 1969 5:1
108 WASTE AND SCRAP MICA
U.S. tariff treatment
The column 1 (trade-agreement) rates of duty applicable to imports (see general headnote 3 in the TSUSA-1969) are as follows:
TSUS item
516.21
516.24
Commodity
Mica not manuf actured and mica scalings, mica cleanings, and other mica waste and scrap:
Waste and scrap valued not over 5 cents per pound:
Rate prior to Jan. 1,
1968
·Phlogopite-------: 12.5% ad val.
Other------------: 12.5% ad val.
U.S. concessions granted in 1964-67 trade conference
(Kennedy Round) Second stage,: Final stage, effecti~e effective
Jan. 1, 1969 Jan. 1, 1972
10% ad val. 6% ad val.
10% ad val. 6% ad val.
The tabulation above shows the column 1 rates of duty in effect prior to January 1, 1968; these rates had remained unchanged under the TSUS from August 31, 1963, through 1967. Also shown are the second and final stages of the annual rate modifications resulting from concessions granted by the United States in the Kennedy Round of trade negotiations, concluded on June 30, 1967, under the General Agreement on Tariffs and Trade. These concessions, which amount to reductions of about SO percent, are being put into effect in five annual stage? (see pertinent sections of the TSUSA-1969, reproduced in appendix A, for the staged rates).
Comment
During 1962-66, apparent annual consumption of scrap mica, in terms of quantity, showed no specific trend, while value increased steadily from year to year. Average annual consumption of scrap mica in this period was about 233 million pounds, with a value of $3.2 million. In terms of quantity, 93 to 99 percent of total U.S. consumption of scrap mica was supplied from domestic sources.
January 1969 5: 1
WASTE AND SCRAP MICA 109
During 1962-67, U.S. production of scrap mica, excluding factory waste, increased from 215 million pounds in 1962 to 241 million pounds in 1965, then declined to 237 million pounds in 1967 (table 1). In terms of value, annual production during this period increased steadily from $2.6 million in 1962 to $3.7 million in 1966, then declined to $2.9 million in 1967. More than half of this mica was produced in North Carolina; substantial quantities _were also produced in Georgia, Alabama, and South Carolina. In 1966, waste and scrap mica was produced by 27 companies at 32 mining operations.
U.S. exports of scrap mica are not classified separately in official statistics and are believed to be small, if any.
Annual U.S. imports of scrap mica during 1962-67 decreased from a high of 16.3 million pounds, with a value of $132,000, in 1963 to 1 million pounds, with a value of $25,000, in 1967, then increased to 3 million pounds·, valued at $76,000 in 1968 (table 2). Imports of muscovite scrap from India, which had been the major foreign supplier for many years, declined from 14.1 million pounds in 1963 to 216,000 pounds in 1967 (table 3) mainly because of a substantial increase in that country's established export price. Imports from Brazil, the only other major foreign source of muscovite scrap mica, have declined since 1966. In most years about 90 percent of the total imports consisted of muscovite waste scrap; Canada was the principal source of phlogopite mica.
January 1969 5:1
110 WASTE AND SCRAP MICA
Table 1.--Waste and scrap mica valued not over S cents per pound: U.S. production, imports for consumption, and apparent consumption, 1962-68
Source: Production, compiled from official statistics of the U.S. Bureau of Mines; imports compiled from official statistics of the U.S. Department of Commerce.
January 1969 5:1
WASTE AND SCRAP MICA 111
Table 2.--Waste and scrap mica valued not over S cents per pound: U.S. imports for consumption, by types, 1962-68
Type 1962
Phlogopite-----: Other mica-----: 8,916 .
Total------· 8,916 t
Phlogopite-----: Other mica-----: · SS
Total------: SS
1963 . 1964 : 196S : 1966
Quantity (1,000 pounds)
22S 629 16,07S 4,836
16,300 S,465
331 2, 712
3,043
346 2,296
2,642
Value (1,000 dollars)
7 12S
132
12 S9
71
11 60
71
16 S5
71
1967
120 896
1,016
2 23
2S
1968
93 3,004
3,097
s 71
76
Source: Compiled from official statistics of the U.S. Department of Commerce.
January 1969
S:l
112 WASTE AND SCRAP MICA
Table 3.--Waste and scrap mica valued not over 5 cents per pound: U.S. imports for consumption, by principal sources., 1962..:68
Source 1962
Brazil-------: 99 India--------: 8,383 Canada-------: All other----: 434
Total----: 8,916
Brazil-------: India--------: Canada----:..--:
2 so
All other-- 7 -: 3 ---. Total----: SS
1963
958 14, 112
181 1,049
16,300
21 94
6 11
132
: 1964 1965 1966
Quantity (1;000 pounds)
1;682 3,361
203 220
5,466
1,949 672 296 126
3,043
1,090 909 200 443
2,642
Value (1,000 dollars)
36 24 6 5
71
4S 13
9 4
71
27 24 s
lS
71
1967
665 216 64 71
1;016
16 6 1 2
2S
·:.
1968
260. ~,564
273
3,097
6 61
9
76
Source: Compiled from official statistics of the U.S. Department of Commerce
January 1969 S:l
MICA, cur OR STAMPED TO DIMENSIONS, SHAPE, OR FORM
Conunodity TSUS item
Mica, cut or stamped-------- 516.71, -.73, -.74, -.76, -.98
Note.--For the statutory descriptj_on, see the Tariff Schedules of the United States Annotated (TSUSA-1969).
U.S. trade position
113
Apparent annual U.S. consumption of cut or stamped mica averaged 2.9 million pounds during 1962-66. Imports of cut or stamped mica not over 0.006 inch in thickness (mica films) supplied more than 50 percent of the annual consumption of mica films, whereas imports of other cut or stamped mica supplied only a minor part of annual consumption. Exports were negligible.
Description and uses
Mica is cut or stamped from natural sheet mica 1/ to specified dimensions, shapes, or forms. With the exception of-fuse discs, most mica is cut or stamped to customer specifications, and few standardized articles are made. The cut or stamped mica may be a finished article ready for incorporation into electrical or electronic apparatus or equipment, or it may require further processing, su_ch as splitting to a specified thickness or the addition of rivets or other parts. Perforated or indented mica articles, as imported, usually require splitting to a spe~ified thickness to be ready for installation, whereas fuse discs, split to thickness, are ready for immediate use. Most of the other imported articles of cut or stamped mica usually require the addition of metal parts before they are ready for use.
The principal uses for cut or stamped mica are as components in capacitors and electronic tubes. Other important uses are in electrical apparatus, household and industrial electrical heating apparatus, and as gage glass gaskets and insulating material in electrical appliances.
Also included in this swnrnary are Canadian articles which are original motor-vehicle equipment comprising cut or stamped mica and articles not specially provided for of mica.
1J See the summary, in this volume, on mica, not manufactured, and mica films and splittings (items 516.11, 516.31-.61) for the definition of the term "sheet mica'' and certain other terms, such as ''block mica", used in this summary.
December 1968 5:1
114 MICA, CUT OR STAMPED TO DIMENSIONS, SHAPE, OR FORM
U-.S-. tariff treatment
The column 1 (trade-agreement) rates of duty applicable to imports (see general headnote 3 in the TSUSA-1969) are as follows:
Commodity to :Second stage,:Final stage, :Jan. 1,: effective effective
Mica, cut or stamped to dimensions, shape, or form, whether or not perforated or indented,:
·and whether or not dedicated to a specific: use:
Not over 0.006 inch in thickness.
Over 0.006 inch in thickness:
Not perforated or: indented:
Fuse discs, split to thickness.
Other--------:
Perforated or indented.
Any article described in the foregoing or in item 516.94, if Canadian article and original motor-vehicle equipment. g/ ·
1968 Jan. 1, Jan. 1, 1969 1972
22.5% 18% ad val. ad val.
25% 20% ad val. ad val.
40% 3?J~ ad val. ad val.
25% 20°/o ad val. ad val.
Free "!:_/
11% ad val.
12.5% ad val.
20a/o ad val.
12.5°/v ad val.
"!:_/
1/ Duty-free status not affected by trade conference. g/ See headnote 2, part 6B, schedule 6, •rsusA-1969.
The tabulation above shows the colwnn 1 rates of duty in effect prior to January 1, 1968. The rates on items 516.71 to 516.76 had remained unchanged under the •rsus from August 31, 1963, through 1967. Also shown are the second and final stages of the annual rate modifications resulting from concessions granted by the United States in the Kennedy Round of trade negotiations concluded on June 30, 1967,
December 1968 5:1
MICA .• CUl' OR 8'1'1\MPlm 1ro DIMENSIONS, SH.APB' OR FORM 115
under the General Agreement on Tariffs and Trade. These concessions, which amount to reductions of about 50 percent on each item, are being put into effect in five annual stages (see pertinent sections of the TSUSA-1969, reproduced in appendix A, for the staged rates)~
Item 516.98 became effective as to articles entered on or after January 18, 1965, under the provisions of the Automotive Products Trade Act of 1965 (Public Law 89-283 ).· This item covers mica cut or stamped to dimensions, shape, or form and articles not specially provided for, of mica. This item was not negotiated in the Kennedy Round of trade negotiations.
U.S. consumption, producers and production
During the period 1962-66, apparent annual U.S. consumption of cut or stamped mica was relatively stable, ranging from 2.4 million pounds in 1963 to 3 .o million pounds in 1966 (table 1). The average annual consumption for that period was approximately 2.8 million pounds; that for the preceding 5-year period was 3.0 million pounds. Consumption for 1967 was about 2.1 million pounds.
During 1966, about 71 percent of all qualities of block and film mica consumed in the United States were used in electronic applications, principally as parts for tubes and capacitors (table 2). A reduction in requirements for mica, through miniatur·ization of electrical and electronic components, was an important factor in limiting growth in the consumption of fabricated mica.
In 1966, 15 plants, situated in nine states, fabricated mica. There were three plants each in the States New Jersey, New York, and North Carolina, and one each in Illinois, Massachusetts, Ohio, Pennsylvania, Rhode Island, and Virginia.
Average annual production of cut or stamped mica (made principally from imported sheet mica) during each of the periods 1957-61 and 1962-66 was 2.7 million pounds. During 1962-66, annual domestic production reached a high of 2.8 million pounds in both 1962 and 1966 (table 1). The low for that period was 2.3 million pounds in 1963. Production in 1967 slumped to about 2.0 million pounds.
The U.S. Bureau of Mines shows separate data on the production of fabricated block and cut film mica. Annual production of cut film mica during 1962-67 averaged about 85,000 pounds and never exceeded 9 percent of the combined output ot' fabricated block and film.
Deceniber 1968 5:1
116 MICA, CUT OR STAMPED TO DIMENSIONS, SHAPE, OR FORM
U.S. exports and imports, and foreign production
Because the United States depends on imports for its supply of uncut sheet mica and because mica articles are not standardized, exports of cut or stamped mica are small.
During the period 1962-68, imports of cut mica showed no distinct trend; they averaged 163,000 pounds a year, with a value of $1.7 million. In 1968, imports of cut mica not over 0.006 inch thick and perforated mica over 0.006 inch thick accounted for 99,000 pounds and 69,000 pounds, respectively (table 3). In contrast, the value of cut mica not over 0.006 inch thick was more than $1.4 million, whereas that of perforated or indented mica over 0.006 inch thick was only $122,000. Imports of fuse discs, split to thickness over 0.006 inch thick were about 50,000 pounds, with a value of $64,ooo. Imports of mica not perforated or indented and over 0.006 inch thick accounted for 2,000 pounds, with a value of $5,000.
No imports of Canadian articles which ar~~ original motor-vehicle equipment have been reported for item 516.98. India, the principal foreign producer of cut or stamped mica, was the most important U.S. supplier in .1968 (table 4). Cut or stamped mica is also imported from Mexico, the United Kingdom, Brazil, and Belgium.
December 1968 5:1
MICA, CUT OR STAMPED TO DIMENSIONS, SHAPE, OR FORM 117
Table 1.--Mica, cut or stamped to dimensions, shape, or form: U.S .. production, imports for consumption, and apparent consumption, 1962-68
Source: Production compiled from official statistics of the U.S. Bureau of Mines; imports compiled from official statistics of the U.S. Department of Commerce, except as noted.
Note.--There are no exports of any appreciable quantities.
December 1968 5:1
118 MICA, CUT OR STAMPED TO DIMENSIONS, SHAPE, OR FORM
Table 2.--Block and film mica: U.S. consumption by end-product uses, 1962-67
{In thousands of pounds)
Electronic uses Nonelectronic uses
Year Gage Grand and : Capac-: .. glass total form Tubes :Other: Total and. Other Total
Source: Compiled from official statistics of the U.S. Department of Commerce, except· as noted.
December 1968 5:1
120 MICA, cur OR STAMPED TO DIMENSIONS, SHAPE, OR FORM
Table 4.--Mica, cut or stamped to dimensions, shape, or form: U.S. imports for consumption, by types and principal sources, 1968
Total India
Mica, cut or stamped,: not over 0.006 inch: thick--------------: 87
Fuse discs, over 0.006 inch thick---: 48
Not perforated, over . . 0.006 inch thick---: 2
Perforated, over 0.006 inch thick---: 20
Mica, cut or stamped,: not over 0.006 inch: thick--------------: 1,211
Fuse discs, over 0.006 inch thick---:
Not perforated, over : 0.006 inch thick---:
Perforated, over 0.006 inch tnick.---:
l,/ Less than 500 pounds.
59
3
31
. . . 'United · . ·
Mexico :K. d :Rhodesia: Other . ing om.
Quantity (l,000 pounds)
4 2 6
ll 2
ll 4 -. : .l7. ~ 28
Value ( 1, 000 dollars)
Total
99
50
2
69
123 62 48 1,444
1 4 64
2 5
23 14 122
Source: Compiled from official statistics of the U.S. Department of Commerce.
December 1968 5:1
MICA, GROUND OR PULVERIZED
Commodity TSUS Iteiii
121
Mica, ground or pulverized---------------- 516.81
Note.--For the statutory description, see the Ta.riff Schedules of the United States Annotated (TSUSA-1969).
U.S. trade position
Apparent annual U.S. consumption of ground or pulverized mica. averaged 108,ooo short tons during the period 1962-66. The United States is a net exporter of such mica., and imports constitute less than O.l percent of domestic consumption.
Description and··uses
Ground mica 1/ is produced by the wet or drY grinding of mica waste and scrap or mica schists. Ground mica is a light, flaky powder which when dry-ground has a dull appearance, but when wet-ground has a glistening sheen. Dry-ground mica is used principally as a coating for rolled roofing, asphalt shingles, and welding rods; as a filler in plastics; in the manufacture of cement for filling joints in wallboard construction; and as a filler and mold lubricant in th~ vulcanizing of rubber.
Wet-ground mica, which sells at prices 2-1/2 to 3 times those for dry-ground mica, is used principally where its characteristic glistening sheen is desired:. The principal uses for wet-ground mica are as a pigment extender in paints, as artificial snow, and in the manufacture of wallpaper. Other uses are as a. filler in ha.rd rubber and as a. mold lubricant and dusting agent in the manufacture of rubber tires.
1/ In this swnmary, the term 11 ground micah refers to ground or pulverized mica.
January 1969 5:1
122 M:CA, GROUND OR PULVERIZED
u.S. tariff treatment
The column 1 (trade-agreement) rate of duty applicable to imports {see general headnote 3 in the TSUSA-1969) is as follows:
TSUS item Commodity
516.81 Mica., ground or pulverized.
Rate prior to
Jan. 1, 1968
l~ ad val.
U.S. concessions granted in 1964-67 trade conference
{Kennedy Round) · Second stage, Final stage,
effective effective Jan. 1, 1969 Jan. 1, 1972
10'% ad val. 6% ad val.
The tabulation above shows the column 1 rate of duty in effect prior to January 1, 1968; which rate had remained unchanged under the TSUS from August 31, 1963, through 1967. Also.shown are the second and final stages of the annual ra.te modification resulting from a. concession granted by the United States in the Kennedy Round of trade negotiations concluded on June 30, 1967, under the General Agreement on Tariffs and Trade. This concession, which amounts to a reduction of about 50 percent, is being put into effect in five annual stages {see pertinent sections of the TSUSA-1969, reproduced in appendix A, for the staged rates).
U.S. consumption .
During the period 1962-66, apparent U.S. consumption of ground mica ranged from 123,000 short tons, valued at $7.0·million, in 1965 to 98,000 short tons, valued at $5.3 million, in 1966. Average annual consumption during that ~eriod amounted to about 111,000 short tons, valued a.t $6.2 million {table 1). Consumption in 1967 amounted to 90, 000 short tons, valued a.t $5. 0 million. The 5-year average for 1957-61 amounted to about 97,000 short tons, valued at $5.2 million. In 1967 about 28 percent of the total quantity consumed went into roofing, 23 percent into pa.int, 18 percent into joint cement, and 6 percent into the manufacture of rubber· {table 2). Consumption of dryground mica. accounted for ~bout 85 percent, based on quantity, of the total consumption of ground mica.
U.S. producers and production
The United States is the world's largest producer of ground mica. In 1966, 23 firms actively operated 19 dry-grinding plants and four wet-grinding plants. Many of these plants obtain the raw material in
January 1969 5:1
MICA, GROUND OR PULVERIZED 123
conjunction with their own mica-mining operations. Nine of the micagrinding plants are in.North Carolina; two each in California, Georgia, and New Mexico; and the other eight plants are scattered throughout the United States.
In 1962-67, annual sales by producers averaged approximately 112,000 short tons, valued at $6.6 million. During that period production of ground mica showed no definit~ pattern. Production reached a high in 1965 of about 127,000 short tons, valued at $7.6 million. Tbe following year it dropped to 103,000 short tons, valued at $6.2 million; in 1967 it dropped to a low· point for the period, 97,000 short tons, valued a.t $5.8 million. About 85·or 90 percent of all ground mica sold is dry-ground (table 3).
U.S. exports and imports
In 1962-67'; annual U.S. exports reached a high of 7,151 short tons, 1/ valued at $781,000 in 1967. In terms of quantity, exports in 1967 were almost twice as large as those in 1962 (table 1). During 1962-67, annual exports averaged 4,656 short tons. Canada was the primary U.S. export market, accounting for about one-third of the total export value and tonnage in most years. Exports in 1968 increased to 13,507 short tons, valued at $1.4 million.
Imports of ground mica into the United States are negligible com-' pared with domestic production. During 1962-67, imports ranged from a low of 21 short tons in 1967 to a high point for the period of 148 short tons in 1966. During this period Canada., France, and Norway were the principal suppliers of imported ground mica.. Imports of ground phlogopite mica come principally from Canada, whereas ground muscovite mica comes from France and Norway. Imports in 1968 principally from France amounted to 114 short tons, valued at $13,000.
1/ Includes a small amount of block, film, splittings, and waste and scrap mica. for the years 1965 through 1967.
January 1969 5:1
124 MICA, GROUND OR PULVERIZED
Table 1.--Mica., ground or pulverized: U.S. production, imports for consumption, exports of domestic merchandise, and apparent consumption, 1962-68
l/ Includes a small amount of block, film and splittings, and waste scrap mica.
3/ Not available.
Source: Production compiled from official statistics of the U.S. Bureau of Mines; imports and exports compiled from official statistics of the U.S. Department of Commerce.
January 1969 5:1
MICA, GROUND OR PULVERIZED 125
Table 2.--Ground or pulverized mica: Consumption of U.S. production, by industries,.1962-67 !/
Source: Compiled from official statistics of the U.S. Bureau of Mines.
January 1969 5:1
BUILT-UP MICA AND ARTICLES OF MICA, NOT ELSEWHERE ENUMERATED 127
TSUS item
Built-up mica---------------------------------- 516.91 Articles of mica not elsewhere enumerated------ 516.94
Note.--For the statutory description, see the Tariff Schedules o~ the United States Annotated (TSUSA-1969,).
u.s. trade position
Du.ring the period 1962-66, u.s. production supplied 98 percent of the average annual consumption of built-up mica (5.4 million pounds) and a like percentage of the estimated annual consumption of articles of mica (2.4 million pounds). u.s. exports of built-up mica and articles of mica combined amOUJ;lted to about 5 percent of total annual production.
Description and uses
Built-up mica consists of plates, sheets, or tapes made of alternate la;yers of overlapping, irregularly arranged mica splittings and a bonding material, or of reconstituted mica, whether or not treated with resins. 1/ Reconstituted mica is a sheet material formed from specially delaminated scrap mica by papermaking techrtiques.
The principal forms of built-up· mica covered here are segment plates, molding plates, heater plates, flexible (cold-forming) plates, and.sheets and tapes.
Segment plates are hard rigid stock primarily used in commutators as electrical insulation, between the copper commutator segments in all direct current motors, high voltage alternating current motors, and generators. Molding plates, which are designed to soften when subjected to heat, are molded into the desired shape or form for use as commutator rings, tubes, sleeves, and bushings for motors and generators and armature slot cells. Heater plates, which are nonflam-. mable, odorless, and smokeless, are used where high insulation strength at high temperatures is required, such as in hair dryers, heaters, irons, toasters, hot plates, and other heating equipment.
Flexible (cold-forming) plates are used in electric motors and generators for armature end-turn insulation and slot liners, field coil insulation, and magnet and commutator core insulation, as well as in transformer coil insulation, insulating collars, channels, and rings.
1J See headnote l(d) to subpart D, part 1, of schedule 5 of the TSUSA-1969.
January 1969 5:1
128 BUILT-UP MICA AND ARTICLES OF MICA, NOT ELSEWHERE ENUMERATED
Built-up mica sheets and tapes (with or without paper, cloth, - or other backing) are used as wrapped insulation for coils and conductors of motors, transformers, and other electrical equipment.
Reconstituted mica, which is used instead of built-up mica in some applications, is used in electrical insulating systems of electrical equipment and as a dielectric material in special capacitors.
Articles of mica considered here are those in chief value of mica, and they consist generally of items for electrical and electronic equipment. These articles may be made from built-up mica-commutator rings and insulating collars which are not chiefly used with particular machines or equipment--or they may be made from sheet mica 11 to which eyelets, wires, rivets, or other forms have been attached. Not included here are mica articles cut or stamped to dimensions, shape, or form (see separate sununary in this volume, items 516.71 -.76) and mica articles that are considered parts of specific electrical machinery and equipment provided for in schedule 6, part 5 of the TSUSA.
U.S. tariff treatment
The column 1 (trade-agreement) rates of duty applicable to imports (see general headnote 3 in the TSUSA-1969) are as follows:
TSUS item
516.91
516.94
Commodity
Built-up mica--------:
Articles not special-: ly provided for, of mica. 11
Rate prior to
.;ran. 1, 1968
17% ad val.
25% ad val.
'.u.s •. concessions granted'· in : 1964-67 trade conference
ii These articles, if Canadian articles and original motor-vehicle equipment, are duty free under item 516.98. See swmna.ry on mica, cut or stamped to dimensions, shape, or form.
ii See the sununary, in this volume, on mica, not manufactured, and mica films and splittings (items 516.11, 516.31, -.61) for the definition of the term "sheet mica".
January 1969 5:1
BUII,T- UP fvITCA AND /\_R'J.'ICI,J·~S OF JV!ICA, NOT ELSEWHERE ENUMEHATED 129
The tabulation above shows the column 1 rates of duty in effect prior to January 1, 1968. These rates had remained unchanged under the TSUS from [email protected] 31, 1963, through 1967. Also shown are the second and final stages of the annual rate modifications resulting from concessions granted by the United States in the Kennedy Round of trade negotiations concluded on June 30, 1967, under the General Aereement on Tariffs and Trade. Thes~ concessions, which amount to a reduction of 50 percent on each item, are being put into effect in five annual stac;es (see pertinent sections of the TSUSA-1969, reproduced in appendix A, for the staged rates).
U.S. consumption, production, and producers
Built-up mica.--During the period 1962-66 apparent U.S. consumption of built-up mica, which is nearly equivalent to production, showed an increase every year in both quantity and value. Consumption ranged from 4.9 million pounds, valued at $15.5 million, in 1962 to 5.7 million pounds, valued at $17.8 million, in 1965 (table 2). Consumption has declined since that year and in 1967 amounted to 5.4 million pounds, valued at $15.0 million. The trend of consumption of built-up mica generally parallels that of production of the electronic and electrical generating industries. The principal forms of built-up mica produced and consumed in 1966, were segment plates ( 29 percent of the total quantity and 21 percent of the total value.), tapes (25 percent of quantity and 32 percent of value), molding plates (20 percent of quantity and 21 percent of value), and flexible plates (15 percent of quantity and 12 percent of value).
In 1966, 12 v.s. companies with 13 plants produced built-up mica; however, the bulk of the output was accounted for by five plants--two each in New York and Pennsylvania and one in New Hampshire. Several firms manufacture built-up mica for their own use.
Articles of mica.--Estimated annual production and consumption of articles of mica, based on the quantity of block and film mica consumed by domestic fabricators plus imports, held at a relatively steady rate during 1962-66, averaging approximately 2.3 million pounds a year (table 2). Estimated production reached a high of 2.5 million pounds in 1962 and 1966, while the low during this period was 1.8 million pounds in 1963. Production in 1967 declined to an estimated 1.7 million pounds.
Approximately 20 companies, including ma:n.y of the 12 producers of built-up mica, accounted for most of the domestic production of articles of mica. These producers are concentrated near the major mica-consuming areas in the northeastern United States.
January 1969 5:1
130 BUILT-UP MICA AND ARTICLES OF MICA, NOT ELSEWHERE ENUMERATED
u.s •. ex:ports and imports
U.S. exports of built-up mica and articles of mica are not separately reported. Exports, the statistics on which include unknown quantities of worked mica, generaJ..ly have amounted to less than 5 percent of production. During 1962-66, exports rose from a low of 197,000 pounds in 1962 to a high of 538,000 pounds in 1966 (table 1). They declined in both 1967 and 1968 and amounted to 475,000 pounds in the latter year.
During the period 1962-66, u.s. imports of built-up mica and articles of mica each were equal. to less than 3 percent of domestic production of the like articles. In this period imports of built-up mica declined from a high of 142,000 pounds in 1962 to a low of 11,000 pounds in 1965, then increased to 53,000 pounds in 1966 (table 2). They declined to 42,000 pounds in 1967, then increased to 46,ooo pounds in 1968. Most of the imports of built-up mica came from Belgium. ·
During 1962-66, imports of articles of mica, consisting mostly of articles of natural mica, declined from 93,000 pounds in 1962 to a low of 8,ooo pounds in 1965·. After increasing to 13,000 pounds in 1966, and 15,000 pounds in 1967, they again declined to 8,ooo pounds in 1968. The United Kingdom and France have been the principal. sources in recent years.
January 1969 5:1
BUILT-UP MICA AND ARTICLES OF MICA, NOT ELSEWHERE ENUMERATED 131
Table 1.--Built-up mica and articles of mica: u.s. production, im-. ports for consumption, exports of domestic merchandise, and apparent consumption, 1962-68
1/ Estimated on_the basis of the quantity of block and film mica consumed by domestic fabricators.
gj Value of production not reported. . '·
Source: Production compiled from official statistics of the u.s. Bureau of Mines, except as noted; imports compiled from official statistics of the U.S. Department of Commerce.
January 1969 5:1
CARBON AND GRAPHITE PRODUCTS
Commodity TSUS item
Artificial graphite-------------------------------- 517.11 Electrodes for electric f'urnaces------------------- 517.61 Lighting carbons----------------------------- 517.71, -.74 Carbon brushes and brush stock--~------------ 517.81, -.82 Carbon or graphite products, not elsewhere
Note.--For the statutory description, see the Tariff Schedules of the United States Annotated (TSUSA-1969).
U.S. trade position
The industry producing carbon and graphite products in the United States is a sizable one with sales of more than $290 million in 1967. The industry has long been on net export basis. The average value of annual U.S. exports of such products in 1962-67--about $19.1 million--was more than twice the average value of imports in the same period.
Description and uses
The commodities included in this swnmary are artificial graphite and articles composed wholly or made from artificial amorphous carbon, artificial graphite, and natural graphite. A few of these products, however, contain v.arying amounts of other materials (principally metals)--some to such an extent that the products are essentially in large part of materials other than carbon. Certain refractory carbon and graphite products, including natural graphite crucibles (TSUS item 531,33) are discussed in other summaries as are calcined coke (TSUS item 517.51), natural graphite (TSUS items 517.21, 517.24, 517.27, and 517.31) and carbon black (TSUS item 473.04).
Carbon is especially suitable for use in a variety of products included in the items considered here because of its high resistance to the action of most chemicals, high thermal and electrical conductivity, high resistance to thermal shock, immeltability, high strengthto-weight ratio, and the ease with which it can be formed into a variety of shapes by extrusion, molding, or machining.
Manufactured carbon products are made from various carbonaceous substances, the most important of which are petroleum coke, specially prepared anthracite coal, carbon black, natural graphite, and coal coke. Artificial carbon and graphite articles are made by processing and heat-treating the impure carbonaceous materials into almost pure
December 1968 5:1
. 134 CARBON AND GRAPHITE PRODUCTS
amorphous carbon and very pure graphite. The selected raw material is usually calcined, ground; and sized, and then mixed with a coal-tar pitch binder and a small quantity of petroleum-based oil to facilitate extrusion or molding. The materials are then heated to about 150° c., thoroughly mixed, cooled to about 100° C., and extruded or molded into the desired shape. After baking in oil or gas-fired furnaces at about 1,000° C. for about 11 to 13 weeks, the carbon products are removed and cooled preparatory to use or shipment to consumers. Those to be converted to graphite are transferred to graphitizing, resistance types of furnaces and heated at about 2,800° C. to produce a dense mass of soft, unctuous graphite in the desired shape and size. At this stage most of the graphite products are ready for use, but some may undergo further machining or manufacturing operations.
Artificial graphite.--Artificial graphite powder is produced by heating petroleum coke to about 2,800° C. in an electric resistance furnace or as a byproduct in the manufacture of artificial graphite articles. In the latter operation, powdered o.r granular coke is used to cover the extruded or molded carbon articles in order to form a homogeneous charge of equal resistivity in the electric furnace. When the articles are graphitized, the covering material is also graphitized. The covering material may be reused or marketed. Artificial graphite powder is used in lubricants, brake linings, clutch facings, foundry facings, and many other diverse applications.
Electrodes for electric furnaces.--Furnace and ~lectrolytic electrodes are terminals of an electrical source used to produce the heats needed in the production of certain metals, metal products, chemicals, and chemical compounds. Both types are made of carbon or graphite and may be square, cylindrical, or· rectangular in shape. The principal materials used to manufacture electrodes are petroleum coke and anthracite coal. · ·
Graphite electrodes are preferred in electrolytic cells producing chemicals and chemical compounds, and in some of the larger electric furnaces making steel and special alloy ingots. Carbon.
·electrodes are commonly used to produce calcium carbide, abras~ves, ferroalloys, and phosphorus, and in the electrolytic production of primary aluminum. Both types are used in electric furnaces producing iron and steel.
Lighting carbons.--Electric arc carbons and electrodes are used to produce radiations of very brilliant, visible light and the closely allied, invisible ultraviolet and infrared forms of radiant energy. Carbon arc radiation, visible and invisible, is produced by separating carbon rods (electrodes) and passing high voltage electricity through them to create a continuous spark of great brilliance at the gap between their tips. The carbons are made from :petroleum coke and specially prepared carbon black.
December 1968 5:1
CARBON AND GRAPHITE PRODUCTS 135
The present trend in the utilization of the carbon arc is toward specialized fields rather than the field of general illumination. Industrial and commercial applications of the carbon arc include photography, blueprinting, photoengraving and photolithography, motionpicture projection, searchlights and floodlights, light therapy, and spectroscopic analysis. '.rhe carbon arc is also used to reproduce natural sunlight for accelerated testing of materials, plant growth control, milk irradiation, and color motion-picture production.
Brushes and brush stock.--Brushes are sliding electrical contacts tbat collect electric current from the revolving commutators of motors and generators. Many standardized brush shapes and sizes are regularly manufactured, but there are also .thousands of types, not regularly stocked, that are made to order from brush stock such as plates or rods of carbon or graphite.
Brushes are.usually made of natural amorphous lump graphite, artificial graphite, and artificial amorphous carbon, either wholly or of admixtures of these materials. They may also contain varying quantities of copper, silver, lead, and tin--the copper to facilitate the flow of electricity and the other metals to reduce commutator wear. The copper and silver content may run as high as 95 percent so that the brush is essentially metallic in appearance, but other brush grades containing lesser quantities of metals are graphitic in appearance.
Carbon brushes are most indispensable in: power generation, transportation, military equipment, and consumer appliances.
Other carbon and graphite products.--Carbon and graphite products have wide industrial applications, particularly in the metallurgical, chemical, and electrical fields. Either amorphous carbon or artificial graphite is used, depending on which is best suited for the particular use.
Metallurgical applications include carbon linings for ferroalloy furnaces, ingot mold plugs, molds, sintering boats, liners, fluxing tubes, and many others. Pipes, fittings, valves, pumps, heat exchangers, and special shapes for handling and processing corrosive materials, to mention a few non-enumerated articles of carbon, find extensive use in the chemical industry.
Special-property carbon and graphite products have recently been developed using complex, though secret, manufacturing processes. Foremost among these are oriented graphite, recrystallized bulk graphite, and the so-called vitreous carbons, all of which are stronger, harder, and denser than ordinary graphite, in addition to having special individual properties. Oriented graphites and recrystallized bulk graphite are used in the missile industry as rocket motor nozzles and nose cones. Both of these materials may join artificial graphite
December 1968 5:1
136 CARBON AND GRAPHITE PRODUCTS
products for use in the field of atomic energy. Vitreous carbons may have space applications as well as high temperature uses.
U.S. tariff treatment
The column 1 (trade-agreement) rates of duty applfoableto imports (see general headnote 3 in the TSUSA-1969) are as follows:
TSUS item Commodity
517.11 Graphite, crude and refined; artificial.
Carbons and electrodes:
Rate prior to
Jan. 1, 1968
5% ad val.
: U.S. concessions granted : in 1964-67 trade confer
517.61 Electrodes, in part .12.5% 10% ad val. 6% ad val. of carbon or graph- ad val. :
517.71
ite, for electric furnace or electro- : · lytic purposes. 1/
Carbons and elec- -trodes, for pro.;.· ducing electric arc light:
Under 0.5 inch in diameter or of equivalent cross- : , sectional area.
517.74 0.5 inch or more in diameter or of equivalent ·crosssectional area.
517.81 Brushes for electric generators, motors, or other electrical machines or appli- · ances; plates, ~ods, powder, and other forms, wholly or part-: ly manufactured, for manufacturing into the: aforesaid brushes.
See footnote at end of tabulation.
14% ad val.
12% ad val.
10% ad val.
:, 11%. ad val. : . 7% ad yal.
. .
.. . .
. ..
.. '
9.5% ad val.
. . . .. .·• .
. 6% ad val.~ . •. . .. . . .. 8% ad val. .: 5% ad val. . . .
December 1968 5:1
CAHBON J\ND GRAPHITE PRODUCTS 137
TGUS item
Commodity
Rate prior to
U.S. concessions granted in 1964-67 trade confer
: _ence (Kennedy Round)
517.82
517.91
Brushes for electric generators, motors, etc.--Con. If Canadian article
and original motorvehicle equipment (see headnote 2, part 6B, schedule . 6) ..
Articles not specially provided for, of carbon or graphite.
1/ Duty temporarily suspended from October 8, 1965 for electrodes used in producing aluminum; the suspension of duty, unless extended by legislation, terminates on July 15, 1969.
g/ Duty-free status not affected by trade conference.
The tabulation above shows the column 1 rates of duty in effect prior to January 1, 1968; these rates had remained unchanged under the TSUS from August 31, 1963, through 1967. Also shown are the second and final stages of the annual rate modifications resulting from concessions granted by the United States in the Kennedy Round of trade negotiations concluded on June 30, 1967, under the General Agreement on Tariffs and Trade. These concessions, which amount to reductions of about 50 percent, are being put into effect in five annual stages (see pertinent sections of the TSUSA-1969, reproduced in appendix A, for the staged rates). Item 517.82 became effective as to articles entered on or after January 18, 1965 under the provisions of the Automotive Products Trade Act of 1965. 'l'his item was not negotiated in the Kennedy Round of' trade negotiations.
U.S. consulllption
U.S. consumption of carbon and graphite products is related to industrial production and should continue to rise as industrial activity expands.
Consumption of these commodities was valued at nearly $281 million in 1966 (table 1). This figure cepreserrts only the portion of
December 1968 5:1
138 CARBON A.1\JD GRAPHITE PRODUCTS
the carbon and graphite products that entered trade channels and does not include the value of the huge quantities of electrodes produced and consumed by producers of primary aluminum metal. Estimated annual U.S. consumption of electrodes by the aluminum industry in the period 1962-66 increased from 1. 2 million to nearly 1. 7 million tons, with a value of $60 million to $85 million.
In 1963, the latest year detailed trade statistics are available, consumption of electrodes for furnace and electrolytic purposes accounted for about 49 percent of total consumption; brushes and brush stock, for about 19 percent; and carbon and graphite articles (including lighting carbons), for the remaining 32 percent.
-Annual consumption of crude artificial graphite is estimated to range between 5,000 and 10,000 tons, valued at $1 million to $2 million.
U.S. producers
In 1966 about 35 U.S. companies produced carbon and graphite products at 54 plants. Half of the primary producing plants were situated in the northeast part of the United States, the other half, in the north. central, southwest, and western sections of the United States.
Companies that manufacture carbon and graphite products vary in size and in variety of products. Of the 19 large firms producing a relatively full line of carbon and graphite products, several produced aluminum and also manufactured huge quantities of furnace electrodes for their own use. These large firms accounted for about 80 to 90 percent of brush and other carbon apd graphite ma.nufactures. Nine firms produced lighting carbons, however, one of them dominated domestic production.
U.S. product ion (shipments)
U.S. production of carbon and graphite products, as measured by value of shipments, was almost $218 million in 1963. Of that amount, electrodes for electric furnaces and electrolytic purposes accounted for approximately $104 millio~. This did not include the value of the very large output of electrodes produced by aluminum companies for internal consumption. Brushes for electrical machines and apparatus accounted for about $39 million, and other carbon and graphite manufactures including lighting carbons for $75 million. The value of lighting carbons produced annually in recent years probably amounted to about $20 million.
December 1968 5:1
CARRON AND GRAPHITE PRODUCTS 139
U.S. exports
For many years, the United States has been on a net export basi13 for carbon and graphite products. During 1962-67, the value of annual U.S. exports of these conunodities ranged from $16.6 million to $21.9 (table 1) and avera~ed :p19.1 million. Exports were shipped principally to Canada, Mexico, and Central and South America. In 1968, exports amounted to $23.9 million.
There were :probably no exports of crude artificial graphite during 1962-68.
U.S. imports
During 1962-67, the value of U.S. imports of carbon and graphite products ranged from $5.8 million in 1962 and 1963 to $13.2 million in 1967 (table 2), and averaged $8.4 million. In 1968, imports of carbon and graphite products amounted to $10.8 million.
During 1962-67 the increase in the value of imports of carbon electrodes for electric furnaces offset the substantial declines in the value of imports of lighting carbons and other articles of carbon or graphite products. The value of imports of brushes more than doubled during this period (table 2).
Japan, the United Kingdom, France, West Germany, and Canada supplied most of the carbon and graphite products, but significant quantities were contributed by Belgium (lighting carbons) and Mexico (miscellaneous pro~ucts). Imports from France, traditionally the major foreign source of the products, were exceeded in total value beginning in 1964 by imports from Japan, most of which consisted of furnace and electrolytic electrodes.
In 1967, Japan, the Netherlands, the United Kingdom, and France supplied most of the electrodes for electric furnace or electrolytic purposes (table 3). Carbon and graphite products came mainly from West Germany, Japan, and the United Kingdom. France and West Germany supplied the bulk of the lighting carbons, while the United Kingdom and Canada were the principal sources of brushes and brush stock. West Germany accounted for about half of the value of the artificial graphite imported during 1967.
December 1968 5:1
140 CARBON AND GRAPHITE PRODUCTS
Table 1.--Carbon or graphite products other than natural graphite: U.S. shipments, imports for consumption, exports of domestic merchandise, and apparent consumption, 1962-68
(Value in thousands of dollars)
Year . .
1962--------------------: 1963--------------------: 1964--------------------: 1965--------------------: 1966--------------------: 1967--------------------: 1968--------------------: !/ Not available.
Shipments
193,400 217,817 245,228 277,100 293,600
1/ !I
Imports
5,840 5,828 7,182 9,270 9,001
13,194 10,800
Exports
16,600 17,685 18,646 19,465 21,910 20,338 23,875
Apparent consumption
182,640 205,960 233,764 266,905 280,691
1/ !I
Source: Compiled from official statistics of the U.S. Department of Commerce.
December 1968 5:1
CARBON AND GRAPHITE PRODUCTS
Table 2.--Carbon and graphite products: U.S. imports for consumption, by item, 1962-68
Note.--For the statutory description, see the Tariff Schedules of the United Gtates Annotated (TSUSA-1969).
U.S. trade position
143
u.s. constunption of natural graphite is supplied almost entirely from imports.
Description and uses
Graphite, sometimes called plumbago, is a soft, black, unctuous (greasy) form of carbon which is found naturally as a mineral, or is produced artificially. Artificial graphite is provided for in TSUS item 517.11 and is covered in the summary on manufactured carbon and graphite products. Graphite owes its commercial importance to such inherent qualities as refractoriness (ability to withstand high tern-. peratures), high thermal and electrical conductivity; inertness to a wide range of reagents, opacity, unctuousness, and miscibility.
Deposits of natural graphite are widely distributed throughout the world, but many of them are unsuited for conunercial operation. Lump graphite is mined from vein deposits; amorphous, from metamorphosed coal beds; and crystalline flake, from layered metamorphosed rocks. A wide variety of milling methods are used for beneficiating graphite ores, depending on the nature of the deposits. Some ores require only hand-sorting, but others must be subjected to such operations as crushing, washing, screening, flotation, and air separation.
Natural graphite is divided into two commercial classes--crystalline and amorphous. Both may include lump, chip, and dust graphite, but only the crystalline class contains flake. Crystalline graphite is commonly understood by the trade to be graphite.in crystals large enough to be seen with the unaided eye. "Amorphous graphite" is a term used by the trade for designating very fine-grained, earthylooking graphite, even though it is usually composed of minute crystals. Thus the trade distinction between crystalline and amorphous graphite (except Ceylon lump graphite) is based chiefly on the difference in the size of the graphite particles" Crystalline graphite is graded according to carbon conte1~t and particle size, while amorphous graphite, except that from Ceylon, is graded according to carbon content.
January 1969 5:1
144 GRAPHITE, NATURAL
Lump graphite from Ceylon (the most important world source of high-grade lump graphite) that can be easily reduced to fine particles by grinding, is classed as amorphous, while the tough Ceylonese lump that can be reduced to fine particles only with great difficulty is classed as crystalline lump.
There are many commercial grades of graphite, but most of them can be described only in general terms because of the lack of standard specifications. Because imports supply most of the U.S. requirements of natural graphite, emphasis in this summary is given to the properties and utilization of the kinds imported. Graphite imported from one country is generally blended with graphite from other countries, and the specifications of the blended products are closely guarded trade secrets. To the consumer, satisfactory performance in actual use is generally the main criterion of suitability.
Flake graphite imported from the Malagasy Republic, the principal world source of high-grade flake, is marketed as "flake" (coarse flake) and "fines" (fine flake) of a specific carbon content. Crucible-grade flake, ranging in size from 8- to 60-mesh and containing at least 86 percent graphitic carbon, is noted for the size and toughness of the individual flakes.
Lump graphite from Ceylon is classed by grades, depending on particle size and graphitic carbon content, as follows:
Lump----------------- Walnut to pea Chip----------------- Pea to wheat grain Dust----------------- 40- to 60-mesh Flying dust---------- Finer than 60-mesh Lump and chip grades are further classed
of consolidation.
90-98 85-90 55-85 55-90
according to degree
Amorphous graphite from Mexico is classed as high or low m:ade, depending on graphitic carbon content. IIigh-grude Mexican graphite contains about 85 percent graphitic carbon and, u.lthour;h the low-r;rade graphite can be anywhere below this figure, little is shipped to the United States that contains lees than 80 percent graphitic carbon.
The various grades of' graphite are marketed 1.Jy producers, importers, and distributors. Domestic producers sell directly to consumers, while foreign suppliers sell almost wholly to importers, which in turn mey sell the graphite as imported or grind and blend it to meet consumer requirements. 'l'he marketed product is usually a loose material of a specific carbon content and particular size, although the graphite may be manufactured into finished shapes ~y some importers.
January 1969 5:1
GHAPHITE, NATURAL
Certain grades of graphite deemed essential in wartime have been designated strategic by the United States. The major strategic use for Ceylon amorphous lump graphite is in brushes for fractional horsepower motors and other electrical equipment used in high-altitude military aircraft and submarines, and for similar low-voltage applications. The major strategic application of Malagasy flake graphite is in cl~-graphite crucibles. The inven~ory as of December 31, 1967, of stock pile grade graphite showed that all categories were at or above stock pile objectives.
Amorphous graphite is used largely in foundry facings (about 40 percent), steelmaking (about 20 percent), lubricants (about 13 per~ cent), and refractories (about 13 percent). Flake graphite is used principally in crucibles, foundry facings, lubricants, and pencils.
u.s. tariff treatment
The column 1 (trade-agreement) rate of duty applicable to imports (see general headnote 3 in the TSUSA-1969) is as follows:
0.825¢ : 0.65¢ per o.4¢ per per pound pound uound :
5:5°/o ad: 4% ad val. 2.5% ad val. val. :
0. 5% ad: Free Free val.]}:
1/ Applicable to that valued at more than $50 per ton.
January 1969 5:1
146 GRAPHITE, NATURAL
The tabulation above shows the column 1 rates of duty in effect prior to January 1, 1968; these rates, except for item 517.31, had remained unchanged under the TSUS f'rom August 31, 1963, through 1967. Also shown are the second and final stages of the annual rate modifica.tion resulting from a concession granted by the United States in the Kennedy Round of trade negotiations concluded on June 30, 1967, under the General Agreement on Tariffs and Trade. These concessions, which a.mount to reductions of about 50 percent, are being put into effect in five ahnual stages (see pertinent sections of the TSUSA-1969, reproduced in appendix A, for the staged rates). The ad valorem equivalent of the rate for TSUS item 517.24, based on 1968 imports, was 7.7 percent. The duty on natural graphite, crude and refined, as provided for in original TSUS item 517.31, if valued at $50 per ton or less, was temporarily suspended through June 30, 1966 under item 909.20. In accordance with Public Law 89-433 of May 31, 1966, item 909.20 was deleted effective on July 1, 1966. At the same time, item 517.31 was repealed and two new items, 517.30 and 517.33, were established, effective as of July l, 1966--item 517.30 providing for graphite free of duty if valued at $50 or less per toti, with item 517.33 providing for graphite valued over that amount. Effective January 1, 1968, as a result of ·the Kennedy Round negotiations, items 517.30 and 517.33 were deleted and new item 517.31 was established providing for a duty free status for that graphite previously provided for by both items 517.30 and 517.33.
u.s. consumption
u.s. consumption of natural graphite in 1966 was 48,365 tons, valued at $6.6 million, compared with 44,385 tons, valued at $5.6 million, in 1962. During 1962-66, annual consumptio~ averaged 48,180 _tons, valued at $6.4 million. Of .'this tonnage, '7 percent consisted of amorphous lump (all from Ceylon); 19 percent, crystalline flake; and 74 percent, "other" amorphous, imported principally from Mexico. In terms of value, however, "other" amorphous accounted for only 55 percent, while crystalline flake and Ceylon amorphous lump accounted for 31 and 14 percent, respectively.
The current consumption pattern of natural graphite indicates little change in the foreseeable future. Use in lubricants and foundry facings appears to be declining, while batteries, steelmaking, and other uses are remaining stable or rising slightly.
Although there is no satisfactory substitute for graphite in most of its applications, some replacement has occurred. Silicon carbidegraphite crucibles have been substituted for clay-graphite crucibles, reducing the need for coarse flake. Molybdenum disulfide has, to a · certain extent, replaced natural graphite as a lubricant.
January 1969 5:1
GRAPHITE, NATURAL 147
U.S. producers and production
The one producer of natural graphite in the United States in 1966 marketed about 20 grades of flake graphite from an open pit mine located near Burn~t, Texas. ~be company is considered to be vertically integrated with respect to its natural graphite operations since it owns, mines, and processes the raw mat~rial and markets the finished products. The firm also imports and blends graphite for its own utilization or for resale to consumers. Products sold, in addition to blends of natural graphite, include antiflux bearings, clay-graphite crucibles, lubricants, electroplating facings, and pencils.
U.S. graphite producers encounter ·strong competition from foreign sources because imported graphite is lower in price and is usually of better quality. U.S. graphite is acceptable, however, sometimes even at the higher price, but consumers refus~ to change established formulas requiring· foreign graphite, because there is no assured supply of domestic graphite with the qualitites required. Foreign reserves of high-grade material are large and assured, but the current trend is toward deeper underground mining with its consequent higher cost. The higher extraction cost will probably be offset by greater mine mechanization, so that the competitive position of foreign graphite with respect to U.S. graphite will probably remain the same.
U.S. exports
Annual U.S. exports of natural graphite averaged about 2,300 short tons during 1962-67, and consisted principally of amorphous graphite from Mexico that had been reprocessed.
u.s. imports
Imports increased from 3'.5, 000 short tons in 1962 to 57, 000 short tons in 1966, but were higher in 1965 than in 1964 (table 1). In 1968 imports amounted to 68,ooo short tons having a value of $2.4 million.
Natural graphite was imported, processed and distributed by five domestic companies in 1964. Some of these companies owned and operated almost all of the amorphous graphite deposits in Mexico. In 1962-66, amorphous graphite usually accounted for about 85 percent of all imports of natural graphite, flake graphite for slightly more than 11 percent, and Ceylon runorphous and crystaJ..line lump for 2 to 4 percent.
January 1969 5:1
148 GRAPHITE, NATURAL
The United States is dependent on foreign countries for· nearly all of its natural graphite requirements. Mexico supplies most of the low-grade amorphous; the Malagasy Republic, most of the flake; and Ceylon,. most of the high-grade- lump graphite. West Germa.ny- and Norwey also supply moderate tonnages of amorphous graphite.
January 1969 5:1
GRAPHITE, NATURAL 149
Table 1.--Graphite, crude and refined: U.S. consumption, imports for consumption, and exports of domestic and foreign merchandise, 1962-68
iJ Includes small quantities of artificial graphite. ?} Principally amorphous graphite imported from Mexico and processed
in the United States. 3./ Not available.
Source: Consumption, compiled from official statistics of the U.S. Bureau'of Mines; imports and exports, compiled from official statistics of the U.S. Department of Commerce.
Note.--Statistics on U.S. production of natural graphite are not available, but production is known to be small.
January 1969 5:1
150 GRAPHITE, NATURAL
Table 2.--Natural graphite: U.S. imports for consumption, by principal sources, 1962-68
. Malagasy : All Mexico : Republic '. Ceylon other
23 40 34 41 40 43
_ __25.
432 766 653 816 847 893
1,035
. . Quantity (1,000 short tons)
5 ..., .)
5 2 4 3 6 3 6 4 5 4 h 2
Value (1,000 dollars)
4'{1 468 416 539 601 570 429
328 279 364. 279 474 442 260
4 5 6 8 7 4 'I
457 474 506 r(42 611 436 734
Total
35 52 47 58 57 56 68
1,688 1,987 1,939 2,376 2,533 2,311 2,458
Source: Compiled from official statistics of the U.S. Department of Commerce.
.Jaa'J.a.L·y 1)6)
5:1
CAJ.CTNED PETHOLETJM J\ND COAL COKE NOT SUITABLE FOR FUEL 151
Commodity
Calcined petroleum and coal coke not
TSUS item
suitable for fuel---------------------------- 517.51
Note.--For the statutory description, see the Tariff Schedules of the United States Annotated (TSUSA-1969).
U.S. trade position
The United States is believed to be the largest producer and consumer of calcined petroleum and coal coke. During the period 1962-66, estimated annual exports averaged a million short tons, while imports were virtually nil.
Description and uses
Calcined petroleum and coal cokes are cokes that have been heattreated (calcined) in rotary, shaft, and electric kilns to drive off volatile impurities and to shrink the coke so that volume changes in subsequent heat treatment will be small and controllable. Calcined cokes are specifically produced for nonfuel uses. Petroleum coke an~ coal coke suitable for use as a fuel are included in ~he summary on item 521. 31--"Coal Coke and Compos it ions Thereof."
Calcining is done principally in rotary kilns. Calcination at high temperatures in an atmosphere of limited oxygen results in an almost pure material--low in volatile fractions and low in ash or insoluble residue--that contains about 95 percent fixed carbon. The calcined coke may be further treated to improve its chemical composition and physical characteristics. The quality of calcined coke depends largely on its density and impurity content.
Nearly all calcined coke is obtained from delayed petroleum coke, a carbon residue from the cracking of petroleum refinery residuums. Calcined petroleum coke is also obtained from gilsonite, a natural bitumen, while calcined coal coke is produced from cellular residue of the distillation of volatiles from certain varieties of bituminous coal.
Coke calciners process and blend selected cokes to yield a calcined coke of uniform quality that is suitable for use -in the manufacture of certain carbon compounds and carbon and graphite products. The carbon compounds include carbon disulfide and the carbides of calcium, boron, and silicon.
January 1969 5:1
152 CALCINED PETROLEUM AND COAL COKE NOT SUITABLE FOR FUEL
Carbon and graphite products made from calcined coke fall into four main groups: (1) Electrodes; (2) brushes and brush parts for electrical. equipment; (3) specialties such as valves, impervious pipe, and heat exchangers; and (4) electronic, missile, and jet propulsion parts. Carbon and graphite products are covered in another summary in this volume.
Ca~cined coke encounters little direct competition from other materials as a source of carbon in the manufacture of carbon products. Specially prepared anthracite is virtually the only carbon material that successfully competes with calcined coke.
U.S. ·tariff treatment
The column 1 (trade-agreement) rate of duty applicable to imports (see general headnote 3 in the TSUSA-1969) is as follows:
TSUS item
517.51
Commodity
Calcined petroleum and coal coke, not coI!llllercially suitabie for· use as fuel.
Rate prior to
Jan. 1, 1968
U.S. concessions granted in 1964-67 trade conference
(Kennedy Round) Second stage, Final stage,
effective effective Jan. 1, 1969 Jan. 1, 1972
15% ad 12% ad val. 7 .5°/o ad val. val. .
'•
The tabulation above shows the collmm 1 rate of duty in effect pr1or to January 1, 1968, which had remained unchanged under the TSUS from August 31, 1963, through 1967. Also shown are the second and final stages of the annual rate modification resulting from a concession granted by the United States in the Kennedy Round of trade.negotiations concluded on June 30, 1967, under the General Agreement on Tariffs and Trade. This concession, which amounts to a reduction of 50 percent, is being put into effect in five annual stages (see pertinent sections of the TSUSA~1969 reproduced in appendix A for the staged rates).
U.S. consumption
It is estimated that the average annual U.S. consumption of calcined coke for the period 1962-66 exceeded 2 million short tons, valued at about $50 million. Consumption is believed rising (at an
January 1969 5:1
CALCINED a;--l'!WLEUM AND COAL COKE NOT SUITABLE FOR FUE.L 153
unknown rate), principally because of availability, and increasing knowledge of calcined coke and its applications.
An estimated one-half of the calcined coke is utilized by primary aluminum companies for captive electrode manufacture, while the rest is consumed by the carbon products industry, the chemical industry, and others.
U.S. producers
Prior to 1957, calcined coke was produced exclusively by firms in the carbon products industry, but calc:lned coke is now produced by companies of the carbon products industry, the primary aluminum industry, and the petroleum industry. The three types of companies all calcine petroleum coke, and one carbon products firm also calcines coal coke. Som~ of the companies that manufacture products composed of carbon or graphite are owned either partly or wholly by petroleum and coal companies.
At the end of 1963, nine of the 18 coke calcining plants in the United States were owned by five carbon products companies; four, by two producers of primary aluminum; and five, by three petroleum companies. Five of the plants were situated on the west coast, four on the gulf coast, four in the Midwest, three in West Virginia, and one each in New York and Colorado. Most calcining plants are adjacent to petroleum refineries, but some are strategically located to take advantage of a variety of cokes from a number of refin.eries.
Carbon products companies calcine coke for their own use, for consumers on a custom basis, and for sale in domestic and foreign markets. Such companies account for about 90 percent of the calcined coke produced; Coke calcined by aluminum companies is all captive production, while that calcined by petroleum companies is sqld in the open market or used by subsidiary companies manufacturing carbon products.
U.S. production
An estimated 50 percent of the marketable petroleum coke produced by the U.S. petroleum industry is calcined. U.S. production of calcined coke has steadily risen from slightly more than 1.6 million tons in 1962 to about 3.8 million tons in 1966.
Most calcined coke is produced as an intermediate product in the manufacture of carbon products, or it is produced on a custom basis for aluminum companies and is not sold in the open market.
January 1969 5:1
154 CALCINED PETROLEUM AND COAL COKE NOT SUITABLE FOR FUEL
The percentage of U.S. production that is captive is unknown. At the present time, producers of primary aluminum purchase most of their needs, but some of the companies have recently erected their own calciners. The continued erection of calciners by aluminum producers is dependent on their obtaining adequate supplies of quality petroleum coke, most of which is already committed on a long-term basis to established calcining companies or is sent to other markets. If sufficient_ marketable coke becomes available, most of the calcined coke production will be captive since much of it, apart from that consumed by the aluminum industry, is produced and consumed by manufactures of carbon products.
U.S. ·exports and imports
It is estimated that during the period 1962-66 an average of about 900,000 tons of calcined coke valued at about $25 million, was exported each year. Most of this coke is used to manufacture carbon and graphite products. Japan, the country that imported the largest quantity of calcined coke from the United States, accounted for about 50 percent of the total exported in recent years.
There are virtually no U.S. imports of calcined coke. During the period 1964-67 approximately 2,000 tons was imported each year, mainly· from Canada; in 1968, however, imports amounted to 4,639 tons.
Foreign production and trade
The carbon and graphite products industry in foreign countries depends on calcined coke, but the ~olume of trade in calcined coke is unknown. Foreign companies that have no local sources of coke nor large enough markets to justify erecting calciners, import calcined coke from the United States. Those companies that do have calcining plants may utilize imported petroleum coke, locally generated coke, or both, as feed material.
Despite some differences in equipment and production materials used, U.S. and foreign producers of calcined coke are similar in operations. Foreign calciners use shaft kilns, while U.S. producers use rotary kilns, but, based on economics and product quality, the two methods are about equal. Foreign calciners probably use more coal coke than do their U.S. counterparts. It is doubtful if many foreign refineries produce petroleum coke for use in the carbon products industry.
January 1969 5:1
CARBON OR GRAPHITE CRUCIBLES
TSUS item
155
Carbon or graphite crucibles--------------- 531.33
Note.--For the statutory description, see the Tariff Schedules of the United States Annotated (TSUSA-1969).
U.S. trade position
The value of annual U.S. production of carbon and graphite crucibles is estimated to be between $3 million and $4 million. Imports are small and exports are believed to be about 20 percent of annual production.
Description and uses
This summary covers crucibles composed principally of carbon and graphite; crucibles manufactured from other materials are included elsewhere (see summary on item 531.35 in. Schedule 5, Volume 3).
Carbon and graphite crucibles are refractory containers used to melt and hold metals for casting into various solid forms. These crucibles are manufactured--largely of graphite imported from the Malagasy Republic--in many different sizes but in only a few basic shapes. ·
The two main types of such crucibles are the clay-graphite crucible and the silicon carbide-graphite crucible. Approximately 75 percent of all carbon and graphite crucibles are of the latter type. A few special-use crucibles are machined from manufactured graphite.
Carbon and graphite crucibles are used by nonferrous foundries in casting precious metals, brass, bronze, copper, and aluminum.
U.S. tariff treatment
The column 1 (trade-agreement) rate of duty applicable to imports (see general headnote 3 in the TSUSA-1969) is as follows:
December 1968 5:1
156 CARBON OR GRAPHITE CRUCIBLES
TSUS item
531.33
Commodity
Carbon or graphite crucibles.
Rate prior to Jan. 1,
1968
15% ad val.
U.S. concessions granted in 1964-67 trade conference
(Kennedy Round) Second stage,: Final stage,
effective effective Jan. 1, Jan. 1,
1969 ! 1972
12% ad val. 7 .5% ad val.
· The tabulation above shows the column 1 rate of duty in effect prior to January 1, 1968, which remained unchanged. under the TSUS f'rom August 31, 1963, through 1967. Also shown are the second and final stages of the annual rate modifications resulting f'rom a concession granted by the United States in the Kennedy Round of trade negoti_ati~ns, concluded on June 30, 1967,, under the General Agr,eement on Tariffs and Trade. This concession, which amounts to a reduction of 50 percent", is being put into effect in five annual stages (see pertinent s~ctions of the TSUSA-1969, reproduced in appendix A, for the staged rates).
U .s. consumption, production, .and producers
No statistical data are available on U.S. production and con~umption of carbon or graphite crucibles. The value of annual U.S. consumption is estimated to be between $3 million and $4 million.
Crucibles are sold to approximately 3,500 ;mail foundries throughout the United States._ Though the industry producing them is small, its significance to industrial activity is great. Because of this importance, crucible-grade natural flake graphite, a principal ingredient in crucibles, has been stockpiled by the Federal Government (see summary on natural graphite, items 517.21 to 517.31 in this volume).
U.S. consumption .has decreased because of product improvement (resulting in longer crucible life), substitution of other hightemperature ref'ractory materials, and improved technology in the melting and alloying of metals. In addition, foundries tend to switch to other melting methods rather than use more crucibles when business expands. U.S. producers of carbon and graphite crucibles are believed to be operating at about 35 percent of capacity.
December 1968 5:1
CARBON AND GRAPHITE CRUCIBLES
The eight producers of carbon and graphite crucibles in the United States manufacture a complete range of carbon and graphite refractories. None of the firms are large; total employment is approximately 400. Four of the companies are situated in Pennsylvania, and one each in New Jersey, New York, Connecticut, and Massachusetts.
U.S. exports and imports
Statistical data on foreign trade in carbon or graphite crucibles are limited. The value of annual U.S. imports during the 5 years 1964-68 averaged about $29,000. Annual U.S. exports during 1962-66 had an estimated value of about $700,000. Carbon and graphite crucibles are exported principally to Canada and Mexico; imports come from the United Kingdom, Canada, and Japan.
December 1968 5:1
ASBESTOS, NOT MANUFACTURED
Commodity TSUS item
. 159
Asbestos, not manufactured------------------ 518.11
Note.--For the statutory description, see the Tariff Schedules of the United States Annotated (TSUSA-1969).
U.S. trade ;position
The United States is the largest asbestos-consuming country in the world, but it ;produces only a minor portion of its requirements. In 1962-66, U.S. imports supplied more than 90 percent of apparent domestic consumption. U.S. exports of unmanufactured asbestos are small in comparison with imports.
Description and uses
Asbestos is a general term applied to a number of nonmetallic fibrous minerals which differ in chemical composition and in some physical characteristics. The most important commercial varieties of asbestos--in the order of their importance--are chrysotile, crocidolite, and amosite. Anthophyllite and tremolite asbestos are of limited commercial importance.
Chrysotile, the fibrous variety of the mineral serpentine, is a silicate of magnesium. Deposits of chrysotile are more widespread and abundant than those of crocidolite and amosite, and its fibers are more amenable to spinning. The great bulk of the world's commercial production of asbestos--in recent years about 95 percent--consists of chrysotile.
Crocidolite is a sodium-iron silicate variety of asbestos·. Its fibers have a higher tensile strength than those of chrysotile, but are less resistant to high temperatures. Amosite is an·iron-magnesium silicate which is closely related to crocidolite. Amosite fibers are flexible and relatively long, but they are harder and harsher and usually have less tensile strength than those of chrysotile, and are less resistant to high temperatures. Each of the principal -commercial varieties of asbestos may readily be broken up into fine fibers.
The commercial value of asbestos is due to its fibrous structure which can easily be separated into fine filaments possessing high tensile strength and flexibility, low density, good absorption, high electrical resistivity, and resistance to heat and acids. Most important, however, a.sbestos, unlike vegetable fibers, consists of chemically inert, incombustible mineral matter.
January 1969 5:1
160 ASBESTOS, NOT MANUFACTURED
Commercial asbestos is divided into: (l) asbestos crudes, (2) milled asbestos fibers, and (3) asbestos sand and refuse. 11Crudes 11 is a trade term applied to fibers of spinning grade, measuring threeeighths of an inch or longer, that are hand cobbed (cleaned of waste material with a hannner) without being passed through a mill for fiberizing. Milled asbestos fibers consist of all groups of fibers produced by mechanical treatment of crude asbestos. On the basis of use, milled fibers fall into two principal classes: spinning and nonspinning fiber. Asbestos sand and refuse as provided for in the TSUS item covered here consist of the dust and discards from the milling which does not contain more than 15 percent by weight of foreign matter.
Unma.nufactured asbestos is marketed by groups rather than as a. single product. Grou,i;is of asbestos are principally governed by the length of the fiber. Ea.ch length has different characteristics and thus has different applications. Longer fibers command higher prices, and prices a.re progressively lower for shorter grades, although openness, tensile strength, absorption, and other qualities of the fibers are a.lso taken into consideration.
There is no standard uniform group classification of asbestos in commerce, and the various producing companies and countries adopt their own groupings. The specifications of the Quebec Asbestos Mining Association, whose grades are determined by mechanical sieving (using the Quebec Testing Ma.chine), are widely accepted in the United States. According to the Quebec Asbestos Mining Association, the crudes and spinning fibers comprise group l, 2, and 3. Group 4 is designated as shingle fiber; group 5, paper fiber; group 6, waste, stucco or pla.ster; and group 7, refuse or shorts.
Asbestos is currently being us'ed in more than '20 major industry cla.ssifica.tions, and there are at present more than 3,000 industrial applications, ranging from textiles to rockets.
Some of the principal· uses of asbestos are in woven and molded friction materials, asbestos-cement products, fire-insulating materials, protective coverings, vinyl and asphalt floor tiles, clutch facings, brake band linings, safety clothing, roofing shingles, flat and corrugated siding, boiler and roofing cement, asphalt paving mixes, acid-resistant pa.ckings and gaskets, gas mask filters, chemical00resistant filters, cigarette filters, and fireproof drop curtains in thea.ters. Asbestos is also used as a. filtration agent for wines, fruit juices, blood plasma, and a large variety of liquids because of its good absorption qualities. A potential growth market for asbestos is in asphalt paving mixes. ·Fiber gla.ss competes with as .. bestos, ma.inly in the field of heat insulation. Although asbestos can be produced synthetica.lly, commercial production of synthetic asbestos appears to be at least some years away.
January 1969 5:1
ASBESTOS, NOT MANUFACTUR1"'D 161
U.S. tariff treatment
Imports of asbestos, not manufactured, are duty free, as provided for under paragraIJh 1616 of the original Tariff Act of 1930. The duty-free status was bound under the General Agreement on Tariffs and Trade, effective January 1, 1948.
U.S. consumption
Annual apparent U.S. consumption of unmanufactured asbestos showed no particular trend during 1962-66, ranging from 720,000 short tons in 1967 to 813,000 short tons in 1964 (table 1). Average annual apparent U.S. consumption for the 5-year period 1963-67 was 771,000 short tons, 10 percent above the average for the preceding 5-year period. The great bulk of this consumption was of the chrysotile variety.
Domestic coi:is1inrption is centered largely in the northeastern section of the country, but California and southern Louisiana. have recently become important consuming areas.
The increased overall consumption in 1963-67 is primarily attributed to the growing number of industrial uses and applications for asbestos. The availability of improved fiber grades in recent yea.rs, together with improvement in product design, has permitted many manufacturers to minimize the amounts of asbestos required ~n their products.
Certain grades and qualities of asbestos have been stockpiled by the U.S. Gpvernment as a strategic and critical material. The national stockpile items are spinning-grade chrysotile and amosite. As of January 1, 1968, the national stockpile of chrysotile asbestos amounted to about 10,456 short tons of stockpile grade and 5,228 short tons of nonstockpile grade; that of amosite, to 65,805 short tons; and that of crocidolite, to i5,684 short tons. Government inventories of asbestos are in excess of stockpile objectives as determined by the Office of Emergency Preparedness. The Congress has authorized the General Services Administration to sell the surplus stockpile of asbestos.
U.S. producers and production
Although asbestos occurs in many parts of the United States, deposits suitable for commercial exploitation are limited. In 1967 there were nine producers mining asbestos. One producer, situat~d in Vermont, had long accounted for the major share of U.S. production until 1964, when California, with four producers, superseded Vermont as the leading producing State. Arizona, with three producers, and North Carolina, with one, accour.ted for the rest. Some of these producers also manufactured articles of asbestos.
,January 1969 5:1
162 ASBESTOS, NOT MANUFACTURED
During 1963-67, U.S. production of asbestos increased from about 66,ooo short tons in 1963 to 123,000 short tons in 1967. The value of U.S. production increased steadily from $5.1 million in 1963 to $11.l million in 1966 and 1967 (table 1). The annual average for 1963-67 was 107,000 short tons, valued at $9.1 million, about double the average for the preceding 5-yea.r period, which was 48,000 short tons, valued at $4.6 million. The sharp increase in production reflects the growth of the industry in California.
Nearly all of the U.S. production of asbestos consists of the . chrysotile variety. Fibers from the Vermont mine are of moderately short length. Those from California are generally short and suitable only for asbestos-cement products. The asbestos deposits of Arizona a.re characterized by their pure white color, low iron content, and length of fiber. The Arizona fiber is highly suitable for use in electrical insulation applications because of its low iron content, but it is expensive to mine. Small amounts of anthophyllite asbestos are presently being mined in North Carolina.
In connection with the possible development of suitable domestic deposits, the U.S. Government grants loans, through the Office of Minerals Exploration, of up to 50 percent of approved costs for such developments • ·
U.S. exports
U.S. exports increased every year during 1963-67, in both quantity and value. In this period, exports increased from 10,000 short tons, valued at $1.3 million, in 1963 to 48,000 short tons, valued at $6.0 million, in 1967 (table 1). In 1968 exports declined to 41,000 short tons, valued at $4.7 million •
. The annual average value for the 5-year period 1963-67 was $4.3 million, up from $660,000 for the preceding 5-year period.
In 1967 India was the most important export market, receiving shipments of more than 2.2 million dollars' worth of asbestos, all of nonspinning quality. Approximately one-third of the exports to India in 1967 consisted of U.S. foreign aid shipments.
U.S. imports
In 1963-67, annual U.S. imports of umnanufactured asbestos averaged 700,000 short tons, valued at $69 million (table 1). In the preceding 5-year period imports had averaged 664,000 short tons, valued at $62 million.
January 1969 5:1
AGRESTOS, NO'I' Ml\.NlJFACTURED
In general, imports of asbestos followed the trend of activity in the construction and auto industries, the two industries which consurn.e the bulk of the asbestos.
In 1966, imports reached an all time high in both volume and value (table 1). In 1968 the value of imports of asbestos was $69.7 million. Canada has supplied more than 90 percent of the total quantity of imports of usbestos for many years (table 2.).
African countries supply about 6 percent, and Europe and Australia each about 1 percent, of the quantity of U.S. imports (table 2). African asbestos came from the Hepublic of South Africa and Rhodesia. The Hepublic of South Africa supplied crocidolite and amosite asbestos, while Rhodesia supplied chrysotile fiber. The United States embargoed imports of asbestos from Rhodesia in January 1967 (Executive Order 11322; also see Executive Order 11419).
Foreign production and trade
During 1963-66 all of the leading asbestos-producing countries increased their output (table 3). Except in the u.s.s.R. and the United States, relatively little of the asbestos is consumed in the countries in which it is mined. Thus, the three important producing countries supplying the great bulk of the international trade of the free world in asbestos are Canada, the Republic of South Africa, and Rhodesia.
Canada has long been the world's leading producer of asbestos. About 95 percent of Canadian production--which is confined entirely to the chrysotile variety--is exported. Estimated figures for 1967 put Canadian asbestos production at about 1.4 million short tons (table 3).
The U.S.S.R. is the second largest producer of asbestos, with production in 1967 estimated at 980,000 short tons (table 3). All of the Soviet mines are state-operated, and trade is conducted under government control.
The Republic of South Africa is the world's only commercial source of amosite and also the world's largest producer of crocidolite asbestos; its output of chrysotile is relatively small. Its total annual production--nearly all exported--averaged about 232,000 short tons in 1962-66 (table 3). Asbestos production in Rhodesia is confined to the low-iron, long-fiber chrysotile variety. Finland is the only important producer of the anthophyllite variety of asbestos.
January 1969 5:1
164 ASBESTOS, NOT MANUFACTURED
Table 1.--Asbestos, not manufactured: U.S. production, imports for consumption, exports of domestic merchandise, and apparent consumption, 1962-68
Source: Production compiled from official statistics of the U.S. Bureau of Mines; imports and exports compiled from official statistics of the U.S. Department of Commerce'. · '· ·
January 1969 5:1
AflBESTOS _. NO'l' MANUFACTURED 165
Table 2.--Asbestos, not manufactured: U.S. imports for consumption, by principal sources, 1962-68
Note.--For the statutory description, see the Tariff Schedules of the United States Annotated (TSUSA-1969).
U.S. trade position
For many years the United States has been a net exporter of asbestos textile products. During 1962-67, exports amounted to approximately 2 percent of estimated U.S. production, whereas imports were equivalent to less than 1 percent of production.
Description and uses
The term "asbestos textile products" as used in this summary includes yarns, slivers, rovings, wick, rope, cord, cloth, and tubing either in chief value of asbestos, or of asbestos and any other spinnable fiber, (with or without wire) and articles, made from any of the foregoing, except footware, headware, and gloves. As indicated in headnote 1 (ii) to schedule 3, fibers, yarns, fabrics, or other articles containing asbestos in significant a..~ounts (used in suffic-. ient amounts to impart the peculiar characteristics or properties of asbestos to the product) are included with asbestos and asbestos products in schedule 5 of the TSUS.
In the manufacture of asbestos textile products, asbestos is defiberized and usually blended with cotton, rayon, or other natural or synthetic organic or inorganic fiber.
The fiber mixture is carded to form a loose, bulky, ropelike material known as sliver, which is separated into ribbons, mechanically rubbed, and condensed into untwisted strands known as roving. Roving is the basi.c component of nearly all asbestos textiles.
Asbestos wick, which is soft and pliable, is produced by loosely twisting strands of roving. Asbestos rope is formed by twisting together two or more strands of asbestos wick. Asbestos wick and rope are used largely in caulking applications, for packing valves, and as an oven sealant.
Asbestos yarn is produced by spinning and twisting strands of roving. The yarn is generally woven into tape, cloth, or tubing, or formed into cord. Asbestos tape, cloth, and tubing may be made with an embedded light-gage wire for reinforcement purposes. Cord is formed by tightly twisting together strands of yarn. The principal
December 1968 5:1
168 ASBESTOS TEXTILE PRODUCTS
uses for asbestos tape, cloth, tubing, and cord are in woven brake and clutch facings, in theater curtains and protective fire fighting clothing, and in covers for ironing boards, and as supporting and insulating mediums for electric-resistance wires. in glass and chemical works. The U.S. Navy requires an outside jacket of asbestos cloth over pipes and boilers on all its vessels.
U.S. tariff treatment
The column 1 (trade-agreement) rate of duty applicable to imports (see general headnote 3 in TSUSA-1969) is as follows:
TSUS item Commodity
Rate prior to Jan. 1, 1968
518.21 Yarn, slivers, 8% ad rovings, wick, val. rope, cord, cloth, tape, and: tubing, of as-bestos, or of asbestos and any: other spinnable fiber, with or without wire, and articles of any of the fore-: going.
U.S. concessions granted in 1964-67 trade conference
(Kennedy Round)
Second stage, effective
Jan. 1, 1969
6% ad val.
Final stage, effective
Jan. 1, 1972
4% ad val.
The tabulation above shows the column 1 rate of duty in effect prior to January 1, 1968, which had remained unchanged under the TSUS from August 31, 1963, through 1967. Also shown are the second and final stages of the annual rate modifications resulting from a concession granted by the United States in the Kennedy Round of trade negotiations concluded on June 20, 1967, under the General Agreement on Tariffs and Trade. This concession, which amounts to a reduction of 50 percent, is being put into effect in five annual stages (see pertinent sections of the TSUSA-1969, reproduced in appendix A, for the staged rates).
December 1968 5:1
ASBESTOS TEXTILE PHODUCTS
U.S. consumption
During 1962-6G, the value of apparent annual u.s9 consumption of asbestos text:lle products ranc;ed from $l+3. 9 million in 1963 to $49. 5 million in 1966 (table 1) and averae;ed $118 million. It is believed that domestic consumption was at a record or near record level in 1967.
U.S. producers
In 1967, asbestos textile products were produced by 10 firms with 16 plants. The firms (which are generally single-plant operations) are situated principo.lly in Pennsylvania, North Carolina, and South Carolina. About two-thirds of the U.S. output is produced by about ho.lf of the firms. Most of the firms produce a wide range of asbestos text:j..les and other asbestos products. In general, production of asbestos textile products is a minor part of a firm's to.tal operations. One producer is a subdivision of a major u.s. rubber manufacturer; several have foreign affiliations. One of the large firms secures most of its crude asbestos from itE own mines in Canada and Africa.
U.S. production
During 1962-66 the value of annual U.S. production of asbestos textiles ranged from $44.5 million in 1963 to an estimated $50 million in each of the years 1965 and 1966, and it seems likely that production in 1967 exceeded the latter figure.
The breakdown of production of asbestos textile products for 1966 is estimated to have been as follows: Cloth, 44 percent; yarn and cord, 21 percent; roving and other forms of carded asbe$tos, 17 percent; tape, 9 percent; and wick, rope, and tubing, 9 percent.
U.S. exports
The value of annual U.S. exports of asbestos textiles products in 1963-67, averaged $1.2 million, compared with an average of $0.8 million in the preceding 5-year period. In 1962-66, exports amounted to approximately 2 percent of u.s. production; in 1967, however, they constituted nearly 4 percent of production.
Shipments to Canada accounted for most of the exports. Other important export markets have been the Netherlands and Venezuela.
December 1968 5:1
170 ASBESTOS TEXTILE PRODUCTS
u.s. imports
The value of annual u.s. imports of asbestos textiles in 1963-65 was stable, at a level. slightly below $0.3 million, but increased markedly in the following 2 years, amounting in 1967 to more than $1 million (table 1), equivalent to about 2 percent of estimated domestic production. In 1968, the value of asbestos textile imports was $1.3 million.
In 1967 the United Kingdom supplied about 47 percent of all imports, in terms of value, while Japan supplied 24 percent, and Canada 21 percent. Imports from Japan were small until 1966, when large shipments started entering the United States from that country (table 2) •. The articles imported from Canada consist mainly of intracompany transfers.
Foreign production and trade
Two British firms and an American firm produce most of the free world's supply of ~rude asbestos and therefore have substantial control over the production of asbestos textiles. The British firms have subsidiaries which are large producers and exporters of these textiles. These subsidiaries purchase crude asbestos in a competitive market. General policy control is in the hands of the British parent organization, but in areas of production and marketing, the producing subsidiaries are autonomous.
ASBESTOS TF~ILE PRODUCTS 171
Table 1.--Asbestos textile products: U.S. production, imports for consumption, exports domestic merchandise, and apparent con-sumption, 1962-68
(In thousands of dollars)
Year Production Imports Exports Apparent consumption
Note.--For the statutory description,. see the Tariff Schedules of the United States Annotated (1969).
UrS. trade po&ition
U.S. imports and exports of all asbestos cement products were equivalent to less than 5 percent of estimated production, in terms of value, in any year in the period 1962-66. Imports of asbestos pipes, tubes, and fittings have declined steadily in both quantity and value since 1963.
Description and uses
173
Portland cement and asbestos fibers are used in combination in a great variety of building materials to produce products having weather and fire resistant properties. In a wet state, this material can be molded into almost any desired shape. When dry, it is rigid, strong; and durable. The ratio of asbestos fibers to cement in such products Vari.es from 15 to 25 percent, depending on the length and class of the fibers used and the product being made. Chrysotile asbestos is the principal fiber used in making asbestos cement products. Crocidolite is sometimes used, but in small amounts because of its low strength; amosite fiber is rarely, if ever, used for such purposes. A product which contains a commercially significant quantity of "asbestos and hydraulic cement" is "in part" of such materials and unless more specifically provided for elsewhere in the TSUS is covered by this summary.
Asbestos cement products are particularly useful in industrial . buildings and private housing. Principal products made from asbestos cement are shingles, roofing, siding, flat and corrugated sheets, wallboard, and pipes. Asbestos cement pipes are manufactured for use in the construction of sewage and water systems.
U.S. tariff treatment
The column 1 (trade-agreement) rates of. duty applicable to imports (see general headnote 3 in the TSUSA-1969) are as follows:
December 1968 5:1
174 .ARTICLES IN PART OF ASBESTOS AND HYDRAULIC CEMENT
TSUS item
518.41
518.44
Commodity
Articles in part of asbestos and hy-draulic cement:
Pipes and tubes . and fittings therefor.
Other----------..:--:
Rate prior to Jan. 1,
1968
0.3¢ per lb.
0.225¢ per lb.
..
U.S. concessions granted in 1964-67 trade conference
(Kennedy Round ) Second stage,: Final stage,
effective effective Jan. 1,
1969 Jan. 1,
1972
0.24¢ per lb.: 0.15¢ per lb.
0.15¢ per lb.: 0.1¢ per lb. }./
}./ This rate is to become effective on Jan. 1, 1971.
'rhe tabulation above shows the column 1 rates of duty in effect prior to Ja~uary 1, 1968~ which had remained unchanged under the TSUS from ,August 31, 1963, through ·1967.. Also shown are the second and final stages of the annual rate modifications resulting from concessions granted by the United States in the Kennedy Round of trade negotiations concluded on June 30, 1967 under the General Agreement on Tariffs and Trade. The concession on item 518.41, which amounts to a reduction of 50 percent, is being put into effect in five annual stages; that on item 518.44 is being put into effect in four annual stages (see ·pertinent sections of the TSUSA-1969, reproduced in appendix A, for the staged rates). Based on imports in 1968 the. ad valorum equivalent of the 1968 rates for item 518.41 was 5.9 percent; and for item 518.44 was 1.5 percent.
U.S. consumption
During 1962-66, the value of apparent annual U.S. consumption of all asbestos cement products averaged about $170 million and showed no specific trend (table 1). The annual average was about the same for the preceding 5-year period. Consumption of asbestos cement shingles, roofing, and siding is mainly dependent on new construction and the home-remodeling market. Sales of asbestos cement products are made primarily to distributors, contractors, and muni~ipalities.
During 1962-66, estimated apparent annual consumption of pipes, tubes, and fittings of asbestos cement had an average value of $104 million and showed no specific trend (table 2). Tubes and pipes accounted for about 58 percent of the total value of all asbestos cement products consumed during 1962-66.
December 1968 5:1
ARTICLES IN PART OF ASBESTOS AND HYDRAULIC CEMENT 175
Consumption activity in the public works markets, which create. the de~and for pipe, has not changed for the past several ye~rb. Asbestos cement pipe products are in direct competition with ·cast iron, clay, plastic, cement, and wood pipes.
U.S. producers
Approximately 16 firms in the United States produce asbestos cement products. About 10 of these firms account for more than 90 p~rcent of total U.S. production; these same firms are also major producers of other types of asbestos products. Several of the large firms produce a relatively complete line of building and construction materials. The small firms derive most of their income from the production and sale of asbestos cement products.
In 1967, .. four companies with 14 plants produced asbestos cement pipes and tubes in the United States. One company has seven plants, another has five plants, and the two remaining companies have one plant each.
The plants for the asbestos cement industry are concentrated in the northeastern States, California, and the gulf coast area.
Because their high weight-to-value ratio results in high trans~ portation costs, asbestos cement products are usually marketed in areas near the plants where they are manufactured. The cement used in the manufacture of these products is procured locally~
U.S. production
Estimated U.S. production of asbestos cement products--including pipes, tubes, and fittings--was valued at $173 million both in 1965 and in 1966 (table 1). Estimated production of asbestos cement products during 1962-66 had an average value of $169 mi~lion a year. In the same period, the value of estimated annual production of asbestos cement pipes, tubes, and fittings averaged $100 million a year (table 2 ).
U.S. exports
During 1962-66, the average value of annual U.S. exports of asbestos cement products was $3 million and showed no specific trend. In 1968 the value of exports was $3.6 million.
The principal export market for asbestos cement products is Canada.
December 1968 5:1
176 ARTICLES IN PART OF ASBESTOS AND HYDRAULIC CEMENT
U.S. imports
From a high of $7.0 million in 1963, the value of annual U.S. imports of asbestos cement products decreased steadily to $4.1 million in 1967 (table 1). Even with the decline, average annual imports in 1963-67, valued at $5.5 million, were larger than those in the preceding-5-year period, when the average value was $4.2 million. Imports in 1968 amounted to $5.5 million.
Imports of asbestos pipes, tubes, and fittings declined every year f'rom 1963, when they were valued at $5.l million, to 1967, when they_ were valued at $1.9 million (table 2).
In 1967, shipments from Belgium accounted for more than 68 percent of the total value of imports of "other" articles in part of asbestos and hydraulic cement, while those from Canada accounted for approximately 25 percent (table 3).
For many years prior to 1966 Belgium had been the main supplier of asbestos cement pipes, tubes, and fittings to the United States. In 1966 and-1967 Japan was the major supplier of these products to the United States. In 1967 shipments from Japan accounted for more than 54 percent of the value of total imports of' pipes, tubes, and fittings; the remaining imports, which were small, Callle mainly from Mexico, Italy, Canada, and Belgium (table 4).
Foreign production and trade
Almost all of the developed and most of the' lesser developed countries are producers of asbestos cement products. The lesser developed countries specialize in making sheets and shingles since the manufacture of pipes is limited because of high plant capitalization and the sophisticated technical processes involved. Two British holding companies operate or have interest in plants producing asbestos cement products in many parts of the world. Some of tbese plants are situated in Rhodesia, the Republic of South Africa, and Canada, the countries in which asbestos is mined.
A large U.S. building-material firm operates plants producing asbestos cement products and pipe in Belgium, Canada, and Mexico.
Asbestos cement pipe made in foreign countries can meet the specifications set up by various municipalities and other Government and private agencies in the United States.
December 1968 5:1
ARTICLES IN PAHT OF ASBESTOS AND HYDRAULIC CEMENT 177
Table 1.--Asbestos and hydraulic cement articles: U.S. production, impor\s for consumptio~, exports of domestic merchandise, and apparent consumption, 1962-68
Year Production Imports Exports l_/ Apparent consumption
1/ Exports are not ~trictly comp~able with production and imports. Ex'Port statistics include some asbestos articles that do not contain cement and, at the same time, exclude some asbestos cement articles.
2/ Not available. · 3/ Estimated on the basis of total U.S. production of all asbestos
products.
Source: Compiled from official statistics of the U.S. Department of Commerce, except as noted.
December 1968 5:1
178 ARTICLES IN PART OF ASBES'IOS AND HYDRAULIC CEMENT
Table 2.--Asbestos cement, pipes and tubes and fittings: U.S. production, imports for consumption, and apparent consumption, 1962-68
Note.--For the statutory description, see the Tariff Schedules of the United States Annotated (TSUSA-1969).
U.S. trade position
181
In recent yea.rs the United States has been a substantial net exporter of the asbestos articles covered by this summary. Imports during 1962-66 were equivalent to about 1 percent of production.
Description and uses
The articles covered by this summary include asbestos paper, millboard and articles made therefrom, packing, gaskets, insulation, and molded friction material. l/ Asbe?tos.paper is used to make many articles: Roofing felt; linings f6r cabinets, mufflers, and electrical appliances; thermal insulation for applications in manufacturing plants; and asbestos felts which, when saturated with tar or asphalt, serve as corrosion protection for underground pipelines. Millboard is used as fireproof wallboard or other fireproof structural material. It serves as linings for heaters, stoves, furnaces, kilns, and table pads and mats, and for various uses in industrial plants. Molded friction material consists of asbestos mixed with or impregnated with rubber. Such material is used chiefly for making brake linings and clutch facings. Packing is a compressible and resilient material used as a seal on moving parts of certain machinery, and gaskets are used in the joining of flanges or pipelines.
1/ Articles made of asbestos that are discussed in other summaries include asbestos and hydraulic cement products (items 518.41 and 518.44) and footwear, headgear, and gloves of asbestos, and laminated or reinforced asbestos containing plastics, including tile (provided for in schedule 7 of the TSUS).
January 1969 5:1
182 ASBESTOS ARTICLES
U.S. tariff treatment
The column 1 (trade-agreement) rate of duty applicable to imports (see general headnote 3 in the TSUSA-1969) is as follows:
TSUS item Commodity
518.51 Articles, not specially provided for, of asbestos.
Rate prior to
Jan. 1, 1968
9% ad val.
U.S. concessions granted in 1964-67 trade conference
(Kennedy Round) Second stage, Final stage,
effective effective Jan. 1 1969 Jan. 1 1972
7% ad val. 4. 5% ad val.
The tabulation above shows the column 1 rate of duty in effect prior to January 1, 1968, which had remained unchanged under the TSUS from August 31, 1963, through 1967. Also shown are the second and final stages of the annual rate modif'icai..ion resulting from a concession granted by the United States in the Kennedy Round of trade negotiations concluded on June 30, 1967, under the General Agreement on Tariffs and Trade. This concession, which amounts to a reduction of 50 percent, is being put into effect in five annual stages (see pertinent sections of the TSUSA-1969, reproduced in appendix A, for the staged rates).
U.S. consumption and production . '·
The value of apparent annual U.S. consumption of asbestos products increased from $95 million in 1962 to $111 million in 1966 (see table). The value of annual consumption in 1962-67 averaged $107 million. Consumption of asbestos products has been largely dependent on the· level of production in the automotive and other large m~nufacturing industries. In each of the years from 1962 to 1966~ U.S. production supplied more than 98 percent of consumption.
U.S. producers
About 65 U.S. firms produce the asbestos products covered by this summary. Seventy percent of the production of these asbestos articles is concentrated in New Jersey, Pennsylvania, New York, Indiana, Illinois, Ohio, and California. Most of the remainder of the output is produced in Connecticut, Massachusetts, Minnesota, and Missouri.
January 1969 5:1
ASBESTOS ARTICLES
Most of the firms also produce other asbestos products (covered in separate sumni.aries), such as asbestos cement products and asbestos ·textile products. About 20 of the larger firms in the industry produce construction materials. U.S. imports supplied approximately 90 percent of the raw asbestos used in the production of the articles discussed in this sununary.
U.S. exports
During 1962-67 the value of annual U.S. exports averaged $14 million and ranged from $10.7 million in 1964 to $17.8 million in 1967. Exports during this period amounted to approximately 10 percent of domestic production. The principal foreign markets for U.S. exports of asbestos products have been to Canada, the European Economic Community, and Japan. A substantial part of the exports were for replacement parts for American-made automobiles, trucks, and other machines sold abroad. The principal items exported were clutch facings, brake linings, and other friction materials. Exports in 1968 amounted to $19.l million.
U.S. imports
The value of annual U.S. imports of asbestos products, not else .. where enumerated, increased from $309,000 in 1962 to $1.5 million in 1965, then declined to $1.4 in 1966 and 1967. The val~e of annual imports during 1962-67 averaged $1~000,000. In 1968 the value of imported asbestos articles was $994,000.
Canada and the United Kingdom are the main foreign suppliers of U.S. imports of these products; during 1967 Canada supplied about 45 percent, based on value, and the United Kingdom 38 percent of the total U.S. imports. Some of the imports from Canada were intracompany shipments.
Foreign production and trade
Canada and the United Kingdom are the leading foreign.producers of asbestos products. Canada has the largest source of raw asbestos in the free world. More than a dozen Canadian firms produce asbestos products. Many of these are either directly or indirectly controlled by United States or British firms that also produce asbestos products. Two British holding companies operate asbestos product plants in England and in many other countries.
January 1969 5:1
184 ASBESTOS ARTICLES
Asbestos articles, not elsewhere enumerated: U.S. production, imports for consumption, exports of domestic merchandise, and apparent consumption, 1962-68
. Note.--For the statutory description, see the Tariff Schedules of the United States Ann.otated (TSUSA-1969).
U.S. trade positio·n
U.S. production, imports·, and exports are small. Exports and imports are approximately equal.
Description and uses
This summary covers burrstone in rough blocks and grinding, polishing, and sharpening stones and wheels cut or fashioned from naturally occurring abrasive rock. Products composed of artificial abrasives or of natural abrasives not in the form of solid natural stone are covered in this volume by other summaries on abrasive products.
Burrstone (item 519.01), which is found in Europe, is a tough, porous siliceous rock that is cut into wedges and bound up with iron straps into circular millston.es. In the United States, millstones are cut whole from such rocks as sandstone, granite, or quartz conglomerate; these articles, if imported, would be provided for in item 519~81. Millstones are usually mounted parallel on a central axis so that the flat grinding surfaces are face to face. Circular stones mounted so that the edges are the grinding surfaces are called chaser stones. The term 11wheels" is defined in the TSUSA as embracing rotary cutters, disks, and other circular bodies designed to rotate on a central a.xis.
Grindstones and pulpstones are solid stone wheels (item 519.81) of various sizes used in a variety of grinding and sharpening operations. The stones of smaller diameter are usually cut from fine-grained sandstone and are used in hand-grinding operations, while the larger wheels are made from coarse-grained stone and are used for machine grinding.
January 1969 5:1
186 BURRS'l'ONES, WHETS'l.10.NES, HONES, OILSTONES, . AND SOLID NATURAL STONE WHEELS
The hones, whetstones, oilstones, and polishing stones included here are those designed to be held in the hand, whether having handles or without handles. These stones are usually cut from novaculite, a very fine-gr~ined quartz rock, and from fine-grained sandstone. In recent years, however, cast shapes (items 519.83 and 519.97) manufactured from natural and artificial abrasives have largely supplanted the natural stone. ·
Millstones are used to grind various substances, including grain, paint pigments, and mineral fillers; the stones referred to as pulpstones are used to grind wood. Circular grindstones, as well as hand-held stones, are used for sharpening a variety of cutting utensils and articles. In addition, the stones included here are used to smooth and polish many manufactured products.
U.S. tariff treatment
Essentially, the duty-free status for the articles in this summary was provided for under paragraphs 1640 (item 519.71), 1692 (519.61 and 518.81) and 1775 (519.01) of the Tariff Act of 1930, as originally enacted. The duty-free status of the articles provided for under paragraphs 1692 and 1775 was bound under the General Agreement on Tariffs and Trade, effective January 1, 1948. The duty-free status. of item 519.71 was bound in the Kennedy Round, effective January 1, 1968.
U.S. consumption, producers, and production
No data on U.S. consumption and production of the commodities covered in this summary are available. The value of annual domestic consumption during 1962-66 is estimated to have been about $200,000. Production and consumption of natural stone abrasives have been on the decline for many years as artificial abrasives and natural abrasive powders have replaced them in many applications.
Solid natural stone abrasive products were produced by a few companies, situated principally in the Midwest. Grindstones were produced in Ohio, and oilstones and other sharpening stones, in Arkansas and Indiana.
U.S. exports
For some years prior to 1965, exports of the natural stone abrasive products covered in this sununary were valued at about $60, 000 annually. Beginning with 1965, these products were no longer reported separately in official statistics. U.S. exports consisted principally
January 1969 5:1
BURRSTONES, WllETSTONES, HONES, OILSTONES, AND SOLID NATURAL STONE WHEELS
of hand-held sharpening stones sent to Canada, West Germany, Japan, and other countries, and small quantities of grindstone2 shipped to various countries.
U.S. imports
Imports of the natural stone abrasive products covered in this swnmary in 1964-68 were as follows:
Nearly all of the U.S. imports in 1964-68 were hones, oilstones, and whetstones entered from Japan, West Germany, and the United Kingdom. Burrstones bound up into wheels were imported in negligible quantities from the United· Kingdom.
January 1969 5:1
PUMICE AND ARTICLES OF PUMICE
Commodit;y TSUS item
Pumice for use in concrete masonry products---- 519.05 Pumice, crude----------------------------· 519.11, - .14 Pumice, ground--------------------------------- 519.31 Pumice articles, not elsewhere
Note.--For the statutory description, see the Tariff Schedules of the United States Annotated (TSUSA-1969).
U.S. trade position
For some years the United States has been on a substantial import basis with respect to the pumice and articles of pumice covered in this summary.
Description and uses
This summary includes both pumice and pumicite. Pumice is a white to gray, highly cellular, glassy, volcanic rock. Pumicite (also known as volcanic ash) is a material consisting of naturally cemented or uncemented, rounded, sand-size particles of natural volcanic glass. Both materials are of volcanic origin, and the present form depends on the original chemical composition and manner of ejection from the volcano. The term "pumice", wherever used alone in this summary, unless otherwise indicated, includes pumicite.
Until the mid-1930's the only important domestic use of pumice and pumicite was as an abrasive. Thereafter, the use of pumice (but not pumicite) as an aggregate in lightweight concrete increased rapidly, as did the use of pumicite as an additive in concretes.
Pumice is used in concrete masonry products either as aggregate in the form of lumps and small pieces meeting established size specifications or as a pozzolanic additive 1./ in the form of a very fine powder. Crude pumice is used as roadstone or railroad ballast. The term "crude pumice" in this summary includes pumice crushed to facilitate transportation.
When used in abrasive compositions, pumice is usually hand-selected for uniformity of color and physical properties, and the selected material is then ground and sized. Ground pumice that meets less
i/ A pozzolanic material is any inherently noncementitious material which in the presence of lime forms a hydraulic cementitious material and thereby replaces a part of the normal portland cement requirement in a given concrete mix.
January 1969 5:1
190 ?UMICE AND ARTICLES OF PUMICE
stringent quality and grading specifications than does that for abrasive use is utilized in plasters, fertilizers, insecticides, matches, paints, and many other compositions.
Abrasive blocks, bricks, and rubbing stones are cut from lump pumice, or molded or cast from a mixture of a binder and sized pumice grains. In determining the component material of chief value of abrasive articles in chief value of pumice (item 519.93), only the abrasive components are compared. Wall masks are molded from a mixture of a binder and sized pumice grains, while other decorative and utilitarian (nonabrasive) articles are either cut from lump pumice or molded from a mixture of a binder and sized pumice grains.
January 1969 5:1
PUMICE AND ARTICLES OF PUMICE 191
u.s. tariff treatment
The column 1 (trade-agreement) rates of duty applicable to imports (see general headnote 3 in the TSUSA-1969) are as follows:
:U.S. concessions granted in Rate : 1964-67 trade conference
TSUS item Commodity :prior .to: (Kenned.y Round)
519.05 Pumice stone to be used in the manufacture of concrete masonry products such as building: blocks, bricks, tiles,: and ··Similar forms.
Pumice, crude or crushed: merely to fac"ilitate: transportation to the United States:
519.11 Valued not over $15 per ton. g/
519.14 Valued over $15 per ton. g/
519.31 Pumice, in grains, or ground, :pulverized, or refined. :
519.93 Millstones (except burr-: stones, manufacture4 or bound up into mill+: stones) and abrasive ': articles other than .. wheels, not elsewhere· : enumerated, of pumice. :
523.61 Articles other than ab- 14% rasive wheels, not elsewhere enumerated,
7°/o
of pumice.
jJ Free rate bound by trade conference, effective January 1, 1968. y The term "ton" here means 2,240 pounds.
January 1969 .5:1
192 PUMICE AND ARTICLES OF PUMICE
The tabulation above shows the column 1 rates of duty in effect prior to January 1, 1968; these rates had remained unchanged under the TSUS from August 31, 1963, through 1967. Also shown are the second and final stages of the annual rate modifications resulting from concessions on items 519.11, 519.14, 519.31, 519.93, and 523.61 granted by the United States in the Kennedy Round of trade negotiations concluded on June 30, 1967, under the General Agreement on Tariffs and Trade. These concessions, which amount to reductions of about 50 percent, are being put into effect in five annual stages (see pertinent sections of the TSUSA-1969~ reproduced in appendix A, for the staged rates). The duty-free status of item 519.05 was bound by the trade conference.
The ad valorem equivalents of the 1968 rates, based on imports in 1968, were as follows for the items in this summary dutiable at specific rates:
Since exports are negligible, U.S. consumption of pumice is virtually equivalent to production plus imports. The domestic consumption has varied considerably in recent years, reaching a record of 1. 3 million short tons 1/ in 1964 (table 1). Average annual consumption was 913,000 tons in 1962-66, compared with 860,000 tons in 1957-61.
:J.S. producers
In 1967 pumice was produced by 129 operators of 152 mines in 15 States, all west of the Mississippi River. One company accowited for the bulk of the U.S. output of abrasive grade pumice, whereas·most of the remaining firms, some of them very small, produced pumice for use as aggregate, railroad ballast, and roadstone.
jJ The term 11 tons 11 used hereafter in this summary refers to short tons.
January 1969 5:1
PUMICE AND ARTICLES OF PUMICE 193
U.S. production
u.s. production of pumice and pumicite was at a high level in 1963-64, with out:PUt in each of those years exceeding 1 million tons (table 1). Production in·.1965, however, was considerably leas than half that of 1964. Out:PUt increased moderately in 1966 and again in 1967, but failed to approach the 1.2 million tons produced in 1964. The average annual production in 1962-69 was 756,000 tons, compared with 860,000 tons annually in the period 1957-61.
New Mexico, California, Hawaii, and Oregon are usually the major producing States in terms of quantity. Most abrasive grade pumice is produced in New Mexico, while pumice used for aggregate, railroad ballast, and road construction is produced in many States. Pumicite is produced mainly in_Kansas, Nebraska, and Oklahoma.
U.S. exports
U.S. exports of pumice were reported as such for the first time in 1966. Exports amounted to 298 tons, valued at $66,ooo,· in 1966; 153 tons, valued at $21,000, in 1967; and 623 tons, valued at $54,ooo, in 1968. Because of the high average value, most or all of this material is presumed to have been abrasive grade material. More than two-thirds of the exports in those 3 years went to Canada.
U.S. imports
Since being placed on the free list by congressional action (Public Law 86-325) in 1959, u.s. imports of pumice (except pumicite) for use in concrete masonry products have grown substantially, reaching a record volume in 1968, when 299,000 tons, valued at $615,000, was imported (table 2). Most of this imported material came from Greece and Italy and was used on the east coast, where it competed with domestically produced expanded clay, shale, and slag and, to a limited extent, with expanded perlite and exfoliated vermiculite; the imported material did not compete with domestic pumice.
u.s. imports of crude pumice, whether valued under or over $15 per ton of 2,240 pounds, come almost entirely from ItaJ.y and are ground and sized in this country for use in abrasive compositions. Imported ground, lJUlverized, or refined pumice also is mostly Italian material and is. already ground and sized for direct use in abrasive compositions and acoustical plasters. In 1964-68 the value of annual imports of ground, lJUlverized, or refined pumice ranged from $76,ooo to $163,000 (table 3), and averaged $118,000. This average a.mount
January 1969 5:1
194 PUMICE .AND ARTICLES OF PUMICE
was equivalent to about one-third of the value of average annual production of domestic abrasive pumice in that period. Imported abrasive pumice competes principally in the Midwest with u.s. pumice of similar quality.
West Germany and Ita.ly supply most of the imported pumice articles, whether of abrasive or nonabrasive type; the value of annual imports of pumice articles in 1964-68 ranged from $17,000 to $26,000o. There -is probably little or no domestic production of articles similar to imported items.
The small imports of abrasive pumice articles consist largely of shaped block pumice mounted on a handle or in a holder, while imported nonabrasive pumice articles comprise wall masks and other decorative iteni.s.
January 1969 5:1
PUMICE AND ARTICLES OF PUMICE 195
Table 1.--Pumicet U.S. production, imports for consumption, and apparent consumption, 1962-68
y . ]J Not available. g/ Value reported on an f.o.b. mine basis only, rather than mine
and/or grinding plant, as previously reported.
Source: Production compiled from official statistics of the U.S. Bureau of Mines; imports compi1ed from official statistics of the U.S. Department of Connnerce.
Note.--u.s. exports are negligible.
January 1969 5:1
196 PUMICE AND ARTICLES OF PUMICE
Table 2.--Pumice to be used in concrete masonry products: U.S. imports for consumption, by principal sources, 1964-68
Greece------------------------------: Italy-------------------------------1 Albania----~------------------------: Spain-------------------------------: All other---~-----------------------:
Total---------------------------1
1/. Less than 500 tons. ~ Less than $500.
Quantity (1,000 short tons)
60 141 137 125 184 28 23 132 112 115 13 - :
12 1 ~~2 1
101 l'.II 238 222 Value (1,000 dollars)
129 306 258 271 367 100 53 302 231 248
22 22 - 1 1 : ~~o 2
251 382 504 : 615
Source: Compiled from official statistics of the u.s. Department of Commerce.
January 1969 5:1
PUMICE AND ARTICLES OF PUMICE 197
Table 3. --Pumice, crude 1/, or in grains, and articles other than wheels, not elsewhere enumerated, of pumice: U~S4 imports for con-· sumption, 1964-68
Item 1966 1968
Quantity (l,000 pounds) gj
Crude, or crushed merely to .facilitate transportation: j/
Valued not over $15 per ·: ton'!±./------------------: 8,348 : 16,724 16,115
Valued over $15 per : ton'!±./------------------: 2,649 3,189 2,669 1,934 . 1;836
In grains, or ground, :pul- t
verized, or refined 'l/----:~6_1 1_8_4 ____ 7~'~0_6_1 ____ 8_1_6_2_1_· __ 4_,_1_6~7_: ___ 6~,=38~1 I Value (1,000 dollars)
Crude, or crushed merely to I
facilitate transporta-tion: 'l/
Valued not over $15 per : ton'!±./------------------: 38 65 57 28 44
Valued over $15 per : ton '!!:)------------------: 27 34 34 21 25
In grains, or ground, :pul- : verized, or refined]/----: 105 127 : 163 76 t 121
Abrasive articles-----------: 4 I 9 11 5 5 Other articles--------------: .16 17 14 17 l2 . . . .
1/ Does not include pumice stone to be used in the manufacture of concrete masonry products such as building blocks, bricks, tiles, and similar forms.
g} Quantity not reported for abrasive articles and other articles~ not specially provided for.
3/ Virtually all from Italy. '!iJ Ton of 2,240 pounds.
Source: Compiled from official statistics of the u.s. Department of Commerce.
Note.--For the statutory description, see the Tariff Schedules of the. United States Annotated (TSUSA-1969).
U.S. trade position
199
The United States imports significant tonnages of only one of the crude natural abrasives, i.e., corundum; it exports substantially greater amounts of ground natural abrasives, i.e., garnet and emery, than it imports.·· the bulk of the U.S. requirements for crude silicon carbide and other artificial abrasives are imported; most of the imports, however, are by U.S. firms operating Canadian plants to produce material for that firm's U.S. operations. U.S. exports of refined silicon carbide and artificial abrasives are sizable.
Description and uses
Abrasive materials are divided, according to origin, into two major types, natural and artificial.
Natural abrasives are natural minerals having physical and chemical characteristics which make them suitable for use as abrasives. Among the more common natural abrasives are the harder, higher quality abrasives corundum, pumice, emery, garnet, and flint, and the softer, or milder, minerals rottenstone and tripoli. All of these minerals, except pumice, are included in this summary, whether or not of·abrasive quality. Pumice is covered in a separate summary in this volume (items 519.05-.14, 519.31, 519.91, and 523.61).
This summary does not include sand, natural or synthetic diamond dust or powder, and crushed or powdered glass.
Emery and corundum are used as abrasive grains in polishing compositions and in coated abrasive products such as papers, cloths, and belts; ground emery is also used in nonslip concrete floors. Garnet is used mainly in coated abrasive products and as an abrasive grain in sandblasting. Crude flint stones are used principally in pebble mills in which ceramic raw materials are ground to meet low-iron specifications. Pulverized rottenstone and tripoli are used as abrasive grains in scouring powders and in abrasive articles used £or buffing wood, painted surfaces~ fingernails and calluses, and other so-called soft materials. ·
February 1969 5:1
200 ABRASIVES; NATURAL AND ARTIFICIAL
Artificial abrasives, compr1s1ng almost solely silicon carbide and aluminum oxide, are manufactured materials produced by fusing proportioned batches of the necessary raw materials and crushing the cooled and solidified mass. Artificial abrasives are more efficient than even the better grades of natµral abrasives, and therefore artificial abrasives are usually employed in industrial grinding operations.
Most natural and artificial abrasives must be ground and sized before use, and at least one (garnet) is usually heat-treated to improve its.properties .
.Natural or artificial abrasive materials crushed merely to facilitate transportation are generally considered "crude" for tariff purposes.
February 1969 5:1
ABRASIVES, NATURAL AND ARTIFICIAL ·201
U.S. tariff treatment
The column 1 (trade-agreement) rates of duty applicable to imports (see general headnote 3 in the TSUSA-1969) are as follows:
: U.S. concessions granted in Rate 1964-67 trade c"onference
TSUS Commodity prior to (Kennedl Round) item Jan. 1, Second stage,: Final stage,
519.17 Emery, natural corun- Free 1/ !/ dum, flint, rotten-stone, and tripoli, crude or crushed merely ·to·facili-tate transportation.:
519.21 Crude silicon car- Free !/ y bide and crude ar-tificial abrasives.
Emery, natural corun-dum, flint, rot-tenstone, trip-oli, garnet, silicon carbide, and artificial abrasives, in grains, or ground, pulver-ized, or refined:
519.34 Rottenstone and Free !/ y tripoli.
519. 37 Other---------------: 0.5¢ per 0.4¢ per lb. 0.2¢ per lb. lb. y
1/ Duty-free status not affected by the trade conference. 2/ This rate, as well as those for 1970 and 1971, is contingent;
see footnote 1 to Staged Rates and Historical Notes to Pt. 1 of Schedule 5 of the TSUSA-1969, as shown in appendix A to this volume .
. febru~i'11969
202 ABRASIVES, NATURAL AND ARTIFICIAL
The tabulation above shows the column 1 rates of duty in effect prior to January 1, 1968; these rates had remained unchanged under the TSUS from August 31, 1963, through 1967. Also shown are' the second and final stages of the annual rate modification (contingent on cer.tain conditions) resulting from a concession on item 5i'9.37 granted by the United States in the Kennedy Round of trade negotiations concluded on June 30, 1967 under the General Agreement on Tariffs and Trade. This concession, which amounts to a reduction of about 50 percent, is being put into effect, subject to the above-noted contingency, in five annual stages (see pertinent sections of the TSUSA-1969, reproduced in appendix A, for the staged rates). Under the Tariff Act of 1930, as originally enacted, duty free status was provided for as follows: emery ore, corundum ore, and crude artificial abrasives, paragraph 1672; natural flint and natural flint stones, unground, paragraph 1679; and rottenstone and tripoli, crude or manufactured, paragraph 1775.
Based on imports in 1965, the average ad valorem equivalent of the 1968 specific rate of duty on item 519.37 was 3.0 percent.
Comment
Generally speaking, each type of abrasive covered here is utilized more on the basis of particular suitability for a given use than on the basis of initial cost; there is comparatively little competition between the different materials.
Emery.--Annual U.S. consumption of ground emery is estimated to range from 12,000 to 15,000 tons, Y.with approxim~te.ly 80 percent domestically produced and the remainder imported, mainly from Turkey and Greece. Commercial production of emery in the United States is confined to Westchester County, N.Y., where three firms each operating one mine reported an output .in 1966 of 11,000 tons valued at $210,000 (table 1). '!:) Exports, which are fairly small, go largely to Canada.
Natural corundum.--Natural corundum suitable for use as an abrasive is not produced commercially in the United States, and therefore the entire U.S. requirement of about 2,000 tons a year has been imported for many years, principally from Southern Rhodesia and largely by one importer-processor. Imports of natural corundum from Southern Rhodesia, however, were prohibited by Executive Order 11419, issued in May 1968.
y Hereafter in this summary the term "tons" refers to short tons, . the domestic unit of quantity.
2/ Production data for 1967 were not published, to avoid disclosing individual company confidential data.
February 1969 5:1
ABRASIVES, NATURAL AND ARTIFICIAL 203
Flint. --Production of flint and flint pebbles and stones suitable for use in ceramic grinding mills is negligible; domestic requirements of about 10,000 tons a year are met by imports from France, Denmark, and Belgium.
Rottenstone and tripoli.~-Little or no rottenstone or tripol{ is imported, either in crude or ground form.· U.S. consumption of ground or refined rottenstone and tripoli approximates domestic production, which averaged about 58,000 tons a year during 1962-66. Rottenstone is produced in Pennsylvania by two companies, and tripoli, in Missouri, Illinois, Oklahoma, Arkansas, and Alabama by some half dozen firms, most of them small although one is a division of a major producer of a wide range of abrasive products. A moderate quantity of ground or refined rottenstone and tripoli is exported.
Artificial abrasives.--About half a dozen U.S. companies produce crude artificial .. abrasives, for their own use. Most of the crude material is produced in Canada for economic reasons, chiefly because of the availability of low-cost electric power. The bulk of the Canadian crude artificial abrasives is shipped into the United States for grinding, refining, and use; there is little open-market selling of the crude material. During 1962-66, average annual U.S. imports (and, hence, apparent consumption) of the two major types of crude artificial abrasives were as follows: silicon carbide, 80,000 tons, valued at $10 million; aluminum oxide, 151,000 tons, vaiued at $16 million. The record year for imports of silicon carbide was 1968, when 106,000 tons were entered; of aluminum oxide, 1966, ·183,000 tons (table 2).
No statistics are available on the production of ground and refined artificial abrasives, but it is known that milling losses during the grinding and refining range from 10 to 20 percent of the tonnage of crude materials, and that the processing adds substantially to the value of the crude materials.
U.S. exports exceed imports of ground and refined artificial abrasives by a sizable margin. In 1965-68, annual exports of both fused aluminum oxide and the carbide abrasives were each in the value range of $4.5 million to $6.3 million (tables 3 and 4).
U.S. imports of ground and refined artificial abrasives have generally increased, and in 1967 had a total value of about $2 million (table 5); most of these imports were from Canada. A large part of the imports of ground and refined artificial abrasives are brought in by domestic producers for their own use, and frequently from their own foreign subsidiaries; most of these materials consist of products not manufactured domestically.
February 1969 5:1
204 ABRASIVES, NATURAL AND ARTIFICIAL
Garnet.--All or virtually all of the U.S. requirements for ground abrasive garnet are supplied domestically from two mines in New York and two in Idaho. Production of abrasive garnet increased substantially from 1963 to 1966 (table 1), and in 1962-66 averaged 17,000 tons a year, valued at $1.6 million. Output in 1967 was slightly lower than in the record year, 1966. A moderate tonnage of abrasive garnet is exported; it is believed that a considerable part of the exports in the export class designated "emery, natural corundum, and other natural abrasives, not elsewhere classified, crude, crushed or ground" are a~counted for by crushed and refined abrasive garnet. Statistics for.this basket category are given in table 6.
February 1969 5:1
ABRASIVES, NATURAL AND ARTIFICIAL
Table 1.--Certain natural abrasives, processed: U.S. production, 1962-67
Source: Compiled from official statistics of the U.S. Bureau of Mines.
Note.--All U.S. production of these materials, whether or not sold for abrasive use, is shown in this table. Of the total domestic output of the respective materials, the share of each used for abrasive purposes was approximately as follows: Tripoli and rottenstone, 75 percent; garnet, 100 percent; and emery, 50 percent·.
February 1969 5:1
206 ABRASIVES, NATURAL AND ARTIFICIAL
Table 2. --Natural and artificia·l abrasives, crude: U.S. imports for consumption, 1962-68
Natural abrasives : Artificial abrasives Year
Corundum '. Other _l/.: Silicon : Aluminum Other carbide : oxide
India----------------------------Republic of South Africa!---------: All other----------~-------------:
Total------------------------:
Canada----------------------~----: United Kingdom-------------------: Japan----------------------------· Sweden--------------~~-----------: West Germany---------------------: France---------------------------: Italy----------------------------: Mexico-------~-------------------· Australia------------------------: India----------------------------. Republic of South Africa---------· All other------------------------: .
Source: Compiled from official statistics of the U.S. Department of Commerce.
207
February 1969 5:1
208 ABRASIVES, NATURAL AND ARTIFICIAL
Table 4.--Silicon carbide and other carbide abrasives, crude, and in grains, powders, and flours: U.S. exports of domestic merchandise, by principal markets, 1965-68
1/ No data on a comparable basis are available for years before 1964. 2/ Includes emery, natural corundum, flint, garnet, and artificial
abrasives not named in this table. ~ Not reported.
Source: Compiled from official statistics of the U.S. Department of Commerce.
February 1969 5:1
210 ABRASIVES, NATURAL AND ARTIFICIAL
Table 6.--Emery, natural corundum, and other natural abrasives other than pumice, not elsewhere enumerated, crude, crushed, or ground: U.S. exports of domestic merchandise, by principal markets, 1965-68
Market 1965 1966 1967 1968
Quantity (1,000 pounds) .
Canada-----------------------------: United Kingdom---------------------: Japan-~----------------------------: France-----------------------------: West Germany-----------------------: Australia--------------------------: M . . . ex1co-----------------------------.
Italy------------------------------: Republic of South Africa-----------: All other---~----------~-----------:
Total--------------------------:
3,297 6,065 2, 713 2,469 3,745 1,531
711 ' 288
730 4,789
26,338
Canada-----------------------------: 412 United Kingdom---------------------: 232 Japan------------------------------: 257 France----------------·-------------: 164 West Germany-----------------------: 185 Australia--------------------------: 97 Mexico-----------------------------:.· 62 Italy------------------------------: 35 Republic of South Africa-----------: 39
7,828 6,953 2,205 2,534 2,736 1,514
983 313
1,294 6,403
32,763
Value (1 ,000
502 281 153 174 170
91 82": 40 . 42
471 All other--------------------------: 364 ----Total------------------~-------: 1,847 2,006 .
4,076 5,985 2,958 2,264 2,483 1,629 1,026
579 809
6,981 9,957 3,278 3,340 4,323 1,932
855 1, 115
813 6,191 . 7,837
28,000 :40,431
dollars)
344 271 229 169 159 117 92 63 57
434 1,935
451 332 32~ 198 317 127
97 127
48 550
2,569
Source: Compiled from official statistics of the U.S. Department of Commerce.
February 1969 5:1
COATED ABRASIVES
Commodity TSUS item
Coated abrasives------------------------ 519.51
Note.--For the statutory description, see the Tariff Schedules of the· United States Annotated (TSUSA-1969).
U.S. trade position
211
The United States has long been the world's largest producer and consumer of coated abrasives. In recent years U.S. exports of coated abrasives have been declining, whereas imports have been increasing; as a result, the export-import ratio, based on value, declined from about 5:1 in 1962 to 2:1 in 1967.
Description and uses
Papers, cloths, and other materials that have been wholly or partly coated with abrasives are generally termed 11coated abrasives" by producers and consumers. These may be in the form of sheets, strips, disks, belts, sleeves, or similar forms. Coated abrasives are made by gluing sized natural or artificial abrasive grains to paper, cloth, or other fiexible backing material. The abrasive grains used are primarily aluminum oxide, silicon carbide, garnet, emery, flint, and quartz sand. The adhesive agent is usually either·hide glue combined with synthetic resin, or modified glue and resins.
Coated abrasives encompass products of widely differing types, qualities, and unit values. Improvements in coated abrasives for use in sanding machines, together with innovations in these machines and their operation, have greatly increased the use of these products in the metalworking industry, which is now the major consumer of coated abrasives. Papers and cloths coated with silicon carbide or aluminum oxide are used mainly in the working of comparatively ·hard metals. Some nondurable goods industries are minor purchasers of coated abrasives.
The woodworking industry is the major consumer of papers and cloths coated with garnet grains or crushed quartz, which are generally called sandpaper. Sandpaper is also used in finishing such materials as leather, hard rubber, plastics, felts, and the softer metals.
February 1969 5:1
212 COATED ABRASIVES
U.S. tariff treatment
The column 1 (trade-agreement) rate of duty applicable to imports (see general headnote 3 in the TSUSA-1969) is as follows:
TSUS item Commodity
Rat.;: prior to
Jan. 1, 1968
519.51 Papers, cloths, and 6.53 ad other materials, val. wholly or partly coated with abra-sives, artificial or natural, or both, whether in the form of sheets, strips, .. 9-isks, belts, sleeves, or similar forms.
. .. . . .
U.S. concessions granted in 1964-67 trade conference
(Kennedy Round) Second stage, Final stage,
effective effective Jan. 1, 1969 Jan. 1, 1972
5°/o ad val. 3% ad val.
The tabulation above shows the column 1 rate of duty in effect prior to January 1, 1968, which had remained unchanged under the TSUS from August 31, i963, through 1967. Also shown are the second and final stages of the annual rate modification resulting from a concession granted by the United States in the Kennedy: Round of trade negotiations concluded on June 30, 1967, under the General Agreement on Tariffs and Trade. This concession, which amounts to a reduction of about 50 percent, is being put into effect in five annual stages (see 'pertinent sections of the.TSUSA-1969, reproduced in appendix A, for the staged rates).
U.S. consumption
Apparent annual u.s.·consumption of coated abrasives increased markedly from 1963 to 1966; in the latter year, the value of consumption was more than $161 million compared with $120 million in 1963 (table 1). The value of consumption in 1967, however, was approximately $148 million, about 9 percent less than in the preceding year. Apparent annual U.S. consumption had an average value of $140 million in 1963-67, compared with $109 million in 1958-62.
About 97 percent of the U.S. consumption of coated abrasives was supplied by domestic producers in 1967. Most coated abrasives are
February 1969 5:1
COATED ABRASIVES 213
used principally in the industrial States, although sandpaper is used in every part of the country.
U.S. producers
Nearly 40 U.S. companies produce coated abrasives. The three largest producers account for about 65·percent of the total annual output; the 10 largest account for more than 95 percent. Producers of coated abrasives are situated principally in New York, Massachusetts Connecticut, Michigan, Ohio, and Minnesota. '
Most of the U.S. producers manufacture all of the important types of coated abrasives, and the three largest also produce abrasive wheels and other products. Medium-sized and smaller firms generally specialize in certain types of coated abrasives, determined principally by the kind of abrasive grain used in their manufacture.
'• .
U.S. production
The United States is the world's largest producer of coated abrasives. In 1966 the value of production in the United States reached a record high of more than $168 million; the comparable value for 1967 was $153 million. The value of average annual U.S. production was $149 million in 1963-1967; it had been $114.million in · 1958-62.
U.S. exports
Annual U.S. exports of coated abrasives increased consistently up to 1964, when they were valued at $12.2 million. Thereafter, exports declined each year to 1967 when they were valued at $9.4 million,. down 23 percent from 1964; in 1968, however, exports were 13 percent higher than in 1967. The downward trend is thought to be ascribable more to increasing self-sufficiency abroad than to a decline in foreign consumption. Exported coated abrasives are nearly all high-grade industrial products, i.e., products incorporating silicon carbide or aluminum oxide as the abrasive grain. _
U.S. exports accounted for 8.7 percent of domestic production of coated abrasives in 1964, the year of record exports, whereas they
.accounted for 6.2 percent in 1967.
The United States exports coated abrasives to many·countries, principally the highly industrialized nations. In terms of value, Canada has historically been the leading U.S. export market; in recent years, approximately 2 million dollars' worth of coated
February 1969 5:1
214 COATED ABRASIVES
abrasives have been exported annually to Canada (table 2). Other leading markets have been the European Economi~ Community countries, Japan, the United Kingdom, the Republic of South Africa, Australia, Sweden, and Venezuela. ·.·
U.S. imports
Annual U.S. imports of coated abrasives have generally been increasing for many years, and this trend has accelerated in the last 5 years; in 1968, imports were valued at $5.8 million (table 3), more than three·times the value of imports in 1964. However, 1968 imports were equivalent to less than 5 percent of domestic consumption.
Some coated abrasives are imported by U.S. producers to complement their domestic production. However, most U.S. imports are commercial sales of foreign-made coated abrasives, largely emery- or garnet-coated papers, which are similar, in type .and quality, to standard domestic products, w~th which they compete on a price basis.
In recent years ab.out half of U.S. imports of coated abrasives have come from West Germany. Other important suppliers have been Switzerland, the United.Kingdom, Canada, and Norway.
Foreign production and trade
The combined capacity of foreign nations reporting production of coated abrasives is somewhat larger than that of the United States. The principal foreign producer, West Germany, has a large coated abrasives industry which has been, not only suppiying most of the requirements of its domestic market, but ·also exporting a substantial quantity of these products. In terms of value, West Germany's annual output of coated abrasives has averaged slightly more than half that of the United States. Other foreign countries with significant production of coated abrasives have.been Frarce, Brazil, Italy, and Switzerland.
West Germany has been the leading foreign exporter of coated · abrasives, and France has been second .in importance. Italy is the leading foreign importer'of coated abrasives; other importing countries have been France, Belgium and Luxembourg, and the Netherlands.
February 1969 5:1
COATED ABRASIVES 215
Table 1.--Coated abrasives: U.S. :production, imports for consumption, exports of domestic merchandise, and apparent consumption, 1962-68
.. Ratio of Apparent . Pro- imports to Year duct ion Imports Exports con sump-
Source: Production supplied by Coated Abrasives Manufacturers' Institute and the Business and Defense Services Administration of the U.S. Department of Connnerce; imports and exports compiled from official statistics of the U.S. Department .of Commerce.
February 1969 5:1
216 COATED ABRASIVES
Table 2.--Coated abrasives: U.S. exports of domestic merchandise, by principal markets, 1965-68
Note.--For the statutory description, see the Tariff Schedules of the United States Annotated (TSUSA-1969).
U.S. trade position
219
The United States is the world's largest producer and consumer of the abrasive wheels and other abrasive articles dealt with in this sununary. U.S ... ex:ports of these commodities have been small relative to total output; the value of U.S. ex:ports, however, has been about 10 times that of U.S. imports in recent years.
Description and uses
Regardless of the nature of the abrasive grain and the type of binder used, bonded abrasive products are produced by molding or oth~rwise forming into the desired shapes a mixture of grain and binder, and then vitrifying or curing the binder so that the abrasive particles will be held fast in the hardened binder. Most such products are wheel shaped, but hones, whetstones, and other abrasive articles included in this sunnnary are made in rectangular and other shapes for hand or machine use. The term "wheels 11 embraces rotary cutters, disks, and other circular bodies designed to rotate on a central axis. The articles included in this summary are used for grinding, sharpening, smoothing, polishing, trueing, cutting, or similar purposes.
Diamond grinding wheels (item 519.83) are formed.mainly from natural or synthetic industrial diamond grit, dust, or powder and a satisfactory bond, such as metal, plastic, or vitrified ceramic. Diamond grinding wheels are used for shaping, polishing, and lapping glass, porcelain, cemented carbides, and other hard materials.
Grinding wheels bonded with synthetic resins (item 519.84) are formed mainly from a resin having the required properties and either silicon carbide or aluminum oxide as the abrasive grain. Resin-bonded grinding wheels are used for polishing and shaping metals and other materials.
The grinding wheels formed from abrasive grain materials other than diamond and bonded with materials other than synthetic resins
February 1969 5:1
220 ABRASIVE WHEELS AND OTHER ABRASIVE ARTICLES, NOT ELSEWHERE ENUMERATED
(item 519.86) consist of natural or artificial abrasive grain in a bond of vitrified ceramic, sodium silicate, hard rubber, or shellac. Such grinding wheels find wide use in heavy industries, small shops, and tools for home use. ·
Other abrasive articles of emery or garnet (item 519.81) or of natural corundum or artificial abrasive materials, not specially provided for (item 519.95), consist of sharpening, rubbing, and grinding stones. Articles provided for under item 519.97 consist of sharpening or grinding stones and other shapes, composed of any abrasive grain other.than emery, garnet, pumice, natural corundum, and artificial abrasives. These articles are used mainly in small shops and private households.
In determining the component material of chief value of TSUSA items 519.83, -91, -.93, or -.95, only the abrasive components thereof are to be compared.
l•'el.Jnwry J l)b9 I):]
ABRASIVE WHEELS AND OTHER ABRASIVE ARTICLES, NOT ETJSE'V-HIERF. ENUMERATED
U.S. tariff treatment
The column 1 (trade-agreement) rates of duty applicable to imports (see general headnote 3 in the TSUSA-1969) are as follows (in cents per pound and percent ad valorem):
221
Rate u.s, concessions grar/cea. ir.
prior 196L~-67 trade confer=mce TSUS Commodity to (Kennedy Round) item Jan. , Second stage, Final stage,
.L' 1968 effective effective
~ Jan. 1, 1969 Jan. 1, 1972
.•
Abrasive wheels, and abrasive arti-~l~s, not elsewhere enumerated:
The tabulation above shows the column 1 rates of duty in effect prior to January 1, 1968; these rates had remained unchanged under the TSUS from August 31, 1963, through 1967. Also shown are the second and final stages of the annual rate modifications resulting from concessions granted by the United States in the Kennedy Round of trade negotiations concluded on June 30, 1967, under the General Agreement on Tariffs and Trade. These concessions, which amount to reductions of about 50 percent, are being put into effect in five annual stages (see pertinent sections of the TSUSA-1969, reproduced in appendix A, for the staged rates).
February 1969 5:1
222 ABRASIVE WHEELS AND OTHER ABRASIVE ARTICLES, NOT ELSEWHERE ENUMERATED
The 1968 compound rate of 18.9 cents per pound plus 15 percent ad valorem on abrasive wheels bonded with synthetic resins (item 519.84) was equivalent to about 34 percent ad valorem, based on total imports under this item in 1968.
U.S. consumption
The value of U.S. consumption of abrasive wheels reached $272 million in 1966, then declined to $260 million in 1967 (table 1), of which an estimated 10 to 15 percent was accounted for by diamond wheels. Based on value, less than 0.5 percent of U.S. consumption is supplied by imports. About 50 percent of the consumption of grinding wheels is accounted for by the industrialized States of Michigan, Pennsylvania, Ohio, Illinois, and New York.
The value of consumption of the numerous types of abrasive articles covered here is unknown, but is believed to exceed $3 million a year. In the aggregate, probably more than 90 percent of the domestic consumption of these abrasive articles is produced domestically. Such articles are widely used in all States in small shops and homes.
U.S. producers
Diamond wheels are manufactured in the United States by at least six large companies and a number of small firms. These producers are situated mainly in Massachusetts, New York, and Illinois. The company accounting for the largest share of the domestic output is in Massachusetts; both this firm and the second largest producer are well diversified in the abrasive and ceramic industries·, Most or all of the manufacturers of diamond wheels also produce nondiamond abrasive wheels.
Approximately 40 companies manufacture nondiamond grinding wheels; about 10 of these account for mo1·e than 80 percent of' the total value of' production. Virtually all manufacturers of grinding wheels '})roduce both resin-bonded and ceramic-bonded wheels. Most of the manufacturers are situated in New York, Massachusetts, Michigan, and Pennsylvania.
It is estimated that hundreds of domestic firms produce one or more articles included under items 519.91, 519.95, and 519.97, usually along with an extensive line of other merchandise.
U.S. production
1'he United States is the world's largest producer (accounting
February 1969 5:1
ABRASIVE WHEELS AND O'l'JJER ABHASIVE ARTICLES, NOT ELSEWHERE ENUMERATED
223
for about 60 percent of world output) and consumer of abrasive wheels and other abrasive articles included here.
The value of U.S. production (sales) of abrasive wheels increased steadily from about $206 million in 1962 to $282 million in 1966, but declined about 5 percent in 1967, to $2613 million. Precise data are not publicly available on the domestic ·production of diamond grinding wheels, but is is believed that the value of annual production of such wheels has ranged between $30 million and $35 million in recent years.
Annual U.S. production of abrasive articles, not elsewhere enumerated in the 'I'SUSA, is estimated to total more--possibly considerably more--than $3 million.
U.S. exports .
U.S. exports of abrasive wheels, which approximately doubled in the decade 1957-66, were valued at $10 million in 1966 (table 1). The value of exports of such wheels, although constituting less than 5 percent of the value of domestic production, has been 10 times the value of imports in recent years.
About one-third of the total value of exports of abrasive wheels is accounted for by diamond wheels. Both diamond and nondiamond wheels are exported, and the same countries are generally the largest markets for both types (table 2 and 3). Canada has long been the major outlet, followed by several European countries and Mexico. Since the manufacture of abrasive wheels in Mexico began a few years ago, that country has declined in importance as a market for the U.S. products.
U.S. exports of other abrasive articles are not separarely reported. Although small, such exports probably far exceed U.S. imports of these articles.
U.S. imports
The value of U.S. imports of abrasive wheels and that of abrasive articles, not specially provided for, increased moderately from 1964 to 1968. In that period, the value of imports of diamond wheels more than doubled, while that of imports of articles of natural corundum or of artificial abrasives quintupled (table 4); imports in the other categories were irregular but generally trended upward. Nevertheless, imports of diamond wheels were equivalent to less than 0.5 percent of domestic production; the comparable ratio for abrasive articles, not specially provtded for, is believed to be less than
February 1969 5:1
224 ABRASIVE WHEELS AND OTHER ABRASIVE ARTICLES, NOT ELSEWHERE ENUMERATED
10 percent, a_nd possibly less than ~ percent.
U.S. imports of diamond wheels came mainly from Switzerland, and those of nondiamond wheels, from West Germany and other European countries, as well as from Japan ·and Canada. Imports of emery and . garnet articles are mostly from West Germany and Japan; those of articles of natural corundum or artificial abrasives, from France, West Germany, and Japan; and those of other abrasive articles con~ sidered here, from the United Kingdom and Japan.
Manufacturers of abrasive wheels iri Japan, Italy-, and other countries have offered their products on the U.S. market at prices substantially lower than-those of domestically produced wheels. However, most industrial consumers in the United States prefer the domes-· tic wheels because of their generally better quality and performance-factors which usually outweigh the price differential. In addition, grinding wheels are made by domestic producers to meet innumerable specifications for size, shape, grain, bond, and other requirements, while the imported wheels are generally made only in the more coIIllllon -sizes and.shapes. Furthermore, domestic manufacturers of grinding wheels can ~eliver the products required by industry on much shorter notic_e than can the foreign producers,. which do not have comparable distribution facilities in the United States. The imported products have generally been sold to individuals and small firms via mail-orc1r:r· houses and retail stores rather than to large-scale industrial userti.
Foreign production and trade
Production of gririding wheel~-- and other abrasive articles has increased in recent yea.rs in· the majority of foreign countries manufacturing these coI!UUodities, reflecting the expansion of metalworking and related industr~es. ~n these countries and the development of new uses for abrasive pr.oducts. It has been estimated that the combined productive capacity-0'f all.foreign producers of these commodities is approximately equivalent.to that of the United States. U.S. companies own or .-conir-0J;;.,·a, 'SiZabi-€ share of the foreign capacity for the production of· these abra.sive .products.
The chief foreign producers .of grinding wheels and other abrasive articles have been West Germany; the United Kingdom, Japan, and France. West Germany has been the leading _foreign _e;x:Porter of thes.e coIIllllodities. Other important exporting-nations include the United Kingdom, Austria, Belgium, Switzerland, France, and Italy. Among the importing nations have been West Germany, Sweden, Italy, Switzerland," France, the Netherlands, Belgium, and Canada. · ·
February 1969 5:1
ABRASIVE WHEELS AND OTHER ABRASIVE ARTICLES, 225 NOT ELSEWHERE ENUMERATED
Table 1.--Abra.sive wheels: U.S. production (sales), imports for consumption, exports of domestic merchandise, and apparent consumption, 1962-68
Source: Production (sales) from Grinding Wheel Institute of America and the Business and Defense Services Administratioµ of the U.S. Department of Commerce; imports and exports compiled from official statistics of the·U.S. Department of Connnerce. ·
February 1969 5:1
226 ABRASIVE WHEELS AND OTHER ABRASIVE ARTICLES, NOT ELSEWHERE ENUMERATED
Table 2.--Diamond grinding and polishing wheels: U.S. exports of domestic merchandise, by principal markets, 1965-68
f)ource: Compiled from official statistics of the U.S. Department of' Commerce.
FelH'UH i'Y ] 9Gq ):1
ABRASIVE WHEELS AND OTHER ABRASIVE ARTICLES, NOT ELSEWHERE ENUMERATED
227
Table 3.--Grinding and polishing wheels, except diamond wheels: U.S. exports of domestic merchandise., by principal marke.t.s, 1965-.68
Market . ..
Canada-----~----------------------~: Italy-------~----------------------: West Germany-----------------------: France-----------------------------: Sweden-----------------------------: United Kingdom---------------------: Mexico-----------------------------: Belgium and Luxembourg-------------: All other--------------------------:
Total--------------------------:
Canada-----------------------------: Italy------------------------------: West Germa.ny-------------------.----: France-----------------------------: Sweden-----------------------------: United Kingdom---------------------: Mexico-----------,;..--~------------·--: Belgium and Luxembourg-------------: All other-------------------------~:
Of emery or garnet--------------: 10 21 17 7 26 Of natural corundum or of arti- . •
ficial abrasive materials-----: 38 82 101 211 176 Other (except of pumice)--------: 66 40 49 65 47
: Source:· Compiled from official statistics of 'the U .s. Department
of Commerce#
February l)h' 1
5:]
APPENDIX A
Tariff Schedules of the United States Annotated (1969): General headnotes and rules' of interpretation, and excerpts relating to the items included in this volUllle.
NOTE: The shaded areas in this appendix cover headnotes and TSUS items not included in the sununaries in this volume.
A-1
A-3
TARIFF SCHEDULES OF THE UNITED STATES ANNOTATED (1969)
GENERAL HEADNOTES AND RULES OF INTERPRETATION
I. Tariff Treatment of Imported Articles. Al I articles Imported Into the customs territory of the United States from outside thereof are subject to duty or exempt therefrom as prescribed In general headnote 3.
2. Customs Territory of the United States. Tho term "customs territory of the United States", as used In the schedules, Includes only tho States, the District of Columbia, and Puerto Rico.
3. Rates ot Duty. The rates of duty in tho "Rates of Duty" columns numbered I and 2 of the schedules apply to articles Imported Into the customs territory of the United States as hereinafter provided In this headnote:
(a) Products of Insular Possessions. (I> Except as provided in headnote 6 of
schedule 7, part 2, subpart E, (and] except as provided In headnote 4 of schedule 7, part 7, subpart A, artlcles Imported from insular··pos·sesslons of the Un I ted States wh I ch are outs I de the custO!JlS terr I tory of the United States are subject to the rates of duty set forth in column numbered I of the schedules, except that al I such articles the growth or product of any such possession, or manufactured or produced in any such possession from materials the grow-th, product, or manufacture of any such possession or of the cust()1ls territory of the United States, or of both, which do not conta l n foreign materials to the value ot rrore than 50 percent of their total value, coming to the customs territory of the United States directly from any such possession, and all articles previously Imported Into the customs terr I tory of "the Un I ted States w I th payment of al I app I !cable duties and taxes Imposed upon or by reason of Importation which were shipped from the United States, without remission, refund, or drawback of such duties or taxes, directly to the possession from which they are being returned by direct shipment, are exempt from duty.
( I i l In determ In Ing whether an art i c I e produced or manufactured In any such insular possession contains foreign materials to the value of more than 50 percent, no mater I a I sha I I be cons i dared tore i gn which, at the time such article is entered, may be Imported into the customs terr I tory from a foreign country, other than Cuba or the Philippine Republic, and entered tree of duty.
(b) Products of Cuba. Products ot Cuba Imported Into the customs territory ot the United States, whether imported directly or Indirectly, are subject to the rates of duty set forth In co I umn numbered I of the schedu I es. Preterent i a I rates of duty tor such products app I y on I y as shown In the said column I. I/
<cl Products of the Phil lppine Republic. ( i) Products of the Ph I Ii pp i ne Republ le imported
Into the customs terr I tory ot the Un I ted States, whether Imported directly or Indirectly, are subject to the rates of duty wh I ch are set forth In co I umn numbered I of the schedules or to fractional parts ot the rates In the said column I, as hereinafter prescribed In subdivisions Cc)( 11) and (c)( i 11) of th Is headnote.
( i I > Except as otherwise prescribed In the schedules, a Philippine article, as defined in subdivision (c)(ivl of this headnote, Imported Into the customs
l/ By virtue of section 401 of the Tariff Classification Act of 1962, the application to products of Cuba of either a preferen't ial or other reduced rate of duty in column 1 is suspended. See general headnote 3(e), ~· The provisions for preferential Cuban rates continue to be reflected in the schedules because, wider section 401, the rates therefor in column 1 still fonn the bases for detennining the rates of duty applicable to certain products, including "Philippine articles".
Page 3
territory of the United States and entered on or before July 3, 1974, Is subject to that rate which results from the appl icatlon ot the fol lowing percentages to the· most favorable rate of duty (I.e., Including a·preterent i a I rate prescr I bed for any product ot Cuba l set forth In column numbered I ot the schedules:
( A1 20 percent, dur Ing ca I endar years i 963 through 1964,
<Bl 40 percent, during ca I endar years 1905 through 1967,
<Cl 60 percent, during calendar years 1968 through 1970,
<D) 80 percent, during calendar years 1971 through 1973,
CE> 100 percent, during the period from January I, 1974, through July 3, 1974. < i 11 > Except as otherwise prescribed In the sched
u I es, products of the Phi I ipplne Republ le, other than Philippine articles, are subject to the rates of duty (except any preterent i a I rates prescr I bed tor products of Cuba) set forth In co I umn numbered I of the schedu I es.
( ivl The term "Phi I lppine article", as used Jn the schedules, means an article which Is the product of the Phi I ippines, but does not Include any article produced with the use of materials Imported Into the Phi I lppines which are products of any foreign country (except materials produced within the customs territory of the Urlted States) it the aggregate value ot such Imported materials when landed at the Phi I ippine port of entry, exclusive of any landing cost and Philippine duty, was more than 20 percent of the app ra I sed customs va I ue of the art I c I e Imported into the customs terr I tory of the Un I ted States.
(d) Products of Canada-. ( i) Products of Canada Imported Into the customs
territory of the United States, whether Imported directly or Ind I rect ly, are subject to the rates of duty set forth In co I umn numbered I of the schedu I es. The rates of duty tor a Canadian article, as defined In subdivision (d)(il) of th Is headnote, app I y on I y as shown In the said column numbered I.
<ii) The term "Canadian article", as used In the schedules, means an article which Is the product of Canada, but does not inc I ude any art i c I e produced with the use of mater I a Is Imported Into Canada wh I ch are products of any foreign country (except materials produced within the customs territory of the United States>, it the aggregate value of such imported materials ·when landed at the Canadian port of entry (that Is, the actual purchase price, or If not purchased, the exporT value, of such mater i a Is, p I us, 1 f not 1 nc I u·ded there l n, the cost of transport Ing such materials to Canada but exclusive ot any landing cost and Canadian duty> was --
<A> with regard to any motor vehicle or automob i I e truck tractor entered on or before December 31, 1967, more than 60 percent of the appraised value of the article Imported Into the customs territory of the United States; and
(8) with regard to any other article (including any motor vehicle or automobile truck tractor entered after December 31, 1967), more than 50 percent of the appraised va I ue of the article imported into the customs territory of the Un I ted States.
(e) Products of Communist Countries. Notwithstanding any of the foregoing provisions of this headnote, the rates of duty shown in co I umn numbered 2 sha I I app I y to products, whether Imported directly or indirectly, of the following countries and areas pursuant to section 401 of the Tariff Classltlcatlon Act ot 1962, to section 231 or 257(e) (2) of the Trade Expansion Act of 1962, or to
A-4 TARIFF SCHEDULES OF' THE UNITED STATES ANNOTA'.I'ED (1969)
General Ifeadnutes and Rules of Interpretation
Page 4
action taken by the President thereunder: Albania Bu I gar i a Ch Ina (any pa rt of which may be under
Communist d~ninatlon or control) Cuba I/ CzechO'slovakia Estonia Germany (the Soviet zone and the Soviet
sector of Ber I In) Hungary Indochina (any part of Cambodia, Laos, or
Vietnam which may oe under Communist domination or con.tro I )
. Korea (any part of wn I ch rnay be unoer Communist domination or contro I )
Kur I le Islands Latv la Lithuania Outer Mongo I i a Ruman fa Southern Sakha I In Tanna lwva Tibet Union of Soviet Socia I 1st Republics and the
area In East Prussia under the provisional administration ct the Union of Soviet Socialist Republ.ics.
Cf) Products of Al I Other Countries. f'roduc1s of al I countries not previously mentioned in this headnote Imported into the customs territory of"1he lJnited States are subject to the rates of duty set forth in co I umn numbered I of the schedules.
(g) Effective Date: Exceptions - Staged Rates of Q!!h. Y Excep·t as specified below or as may be specified elsewhere, pursuant to section 501Ca) of the Tariff Classification Act of 1962 CP.L. 87-456, approved May 24, 1962), the rates of duty in co I umns numbered I and 2 become ef tect i ve with respect to articles entered on or after the 10th day fol lowing the date of the President's proclamation provided tor In section 102 of the said Act. If, in column numbered I, any rate of duty or pad the roof is se1 forth In parenthesis, !he effective date shal I bo governed as to I lows:
( I ) It the rat" in co I umn numbert?d I has on I y one part (I.e., 8¢ <10¢) por lb.), the parenl"hetlcal rate (viz., 10¢ per lb.) shall be effective as to articles entered before Ju I y I, 1964, and 1he other rate ( v I z., 8¢ per lb. l shal I be effective as to arl'lcles en1ered on or attar July I, 1964.
( 11) It tho rate In co I umn numbered I has t•o or more parts (I.e., 5¢ per lb. + 50% ad val.) and has a parenthetical ra1e tor el ther or both parts, each part of
·the rate sha I I be governed as If It were a one-part rate. For example, It a rate Is expressed as "4t (4.5¢) per lb. + 6% C9%> ad val.", 'the rato appl lcable to artlcllls entered before July I, 1964, would be "4.5¢ per lb. + 9% ad val."; the rate appl lcaDle to ar11cles entered on or after July I, 1964, would be "4¢ per lb.+ 6% aa val.''.
(iii) If the rate In column numbered I Is 11\Qrked with an aster·isk C*>, the foregoing provisions ot Ci) and (ii) shall apply except that "January I, 1964" shall be substituted for "July I, 1964", wherever this latter date appears.
!I In Proclamation 3447, dated February 3, 1962, the President, acting under authority of section 620(a) of the Foreign Assistance Act of 1961 (75 Stat. •145), as amended prohibited the importation into the United States of ail goods of Cuban origin and all goods imported from or through Cuba, subject to such exceptions as the Secretary of the Treasury determines to be consistent with the effective operation of the embargo.
2/ The purpose of headnote 3[g) was to provide for an effective date for the rates of duty initially contained in the Tariff Schedules of the United States. By Presidential Proclamation 3548 of August 21, 1963, these rates o~. duty: except as noted in subpa:ragraphs (i), [ii), and (111) or headnote 3(g), became effective on August 31, 1963.
4. Modi f i cat Ion or Amendment of Rates of Duty. Except as otherwise provided in the Append Ix to the Tari ft Schedu I es --
(a) a statutory rate of duty supersedes and termlm1tcs The ex: is ting rates of duty In both co I umn numbered I and column numbered 2 unless otherwise specified In the am'3nd Ing statute;
Cb) o rate of duty proclaimed pursuant to a concession granted in a trcide agreement shat I be reflected in column numbered I and, if higner than the then existing rate In column numcered 2, also In the latter column, and shal I super!,ede but not terminate the then existing rate Cor ra·tes> in such column 1or columns>;
Cc> a r·dte of duty proclaimed pursuant to section 336 of t'1& Tariff Act of 1930 shall be reflected In both column nuinber·eu I and co I umn numbered 2 and sha 11 5upersede but not tenrdn.3te the then existing rates In such columns; and
( d) whenever a proc I a I med rate Is term I nated or suspenced, the rdte shal I revert, unless otherwise provided, to tha next Intervening proc I a I med rate previous I y superseded but not terminated or, If nonet to the statutory rate.
5. I ntang i b I es. For the purposes of t1eadnote I (al corpses, together with their coffins and
accompany 1 ng f I owe rs, (b) currency (metal or paper) In current circu- ·
I at ion In any country and Imported for rronetary purposes,
Cc) electricity, (d) securlTles and slmi lar evidences of value, and (e) vessels which 3re not "yachts or pleasure boats"
w I tn in the purv I ew of subpart D, part 6, of schedu I e 6,
are not art i c I es subject to the prov Is I ans of these schedu I es.
6. Containers or Holders for Imported Merchandise. For the purpo·;es of 1·he tariff schedules, containers or holders are subject to tar I ff treatment as fol lows:
Cal Imported Empi·y: Containers or holders If Imported empty are subject to tariff treatment as Imported articles and as such are subject to duty unless they are wl1hln the purview of a provision which specifically exempts them from duty.
Cb) Not lmportea Empty: Containers or holders If ·imported containing or holding articles are subject to tariff treatment as fol iows:
CI) The usu a I or ora I nary types of shipping or transportation containers or holders, If nor designed for, or capab I e of, reuse, and cont a I ners of usua I types ordinarl ly sold at retai I wl1h their contonts, are not subject to troatment as Imported articlos. Their cost, howovor, Is, under sect I 6n 402 or sect I an 402a ct the tariff act, a part of the value of their contents and If the Ir contents are subject to an ad valorem rate of duty sucll containers or holders are, In effect, dutiable at the same rate as the Ir contents, except that the Ir cost Is deductible from Outlablo value upon submission of sat Is factory proof that they are products of the United States •hich are being returned without having been advanced in value or Improved In condition by any means while abroad.
C 11) The usua I or ord I nary types of sh I pp Ing _or transportation containers or holders, If designed tor, or capable of, reuse, are subject to treatment as Imported articles separate and distinct from their conton1 s. Such ho I de rs or cont a I ners are not part of the du1lable value of ttrAir contents and are separately subject to duty upon ~ach and every Import at Ion into the customs territory of the United Stales unless within· the scope of a provision specitlcal ly exempting them from duty.
C 11 i) In the absence of context which requires otherwise, al I other containers or holders are subject to the same trea1ment as specified In C 11) above for usud I or ordinary types of sh I pp Ing or transportat I on cont a I ners or ho I de rs des I gned for, or capab I e of, reuse.
A-5
TARIFF SCHEDULES OF THE UNITED STATES ANNOTATED (1969)
General Headnotes and Rules of Interpretation
7. Commingl Ing of Articles. (a) Whenever articles subj~ct to d If ferent rates of duty are so packed together or m1 ng I ed that the quantity or va I ue of each c I ass of art I c I es cannot be readily ascertained by customs officers <without phys I ca I segregat Ion of the shipment or the contents of any entire package thereof), by one or nore of 1he following mnans:
(I) sampling, (Ii) verification of packing I is ts or othor docll
ments ti led at the time of entry, or (Iii) evidence showing performance of commercial
Sr:)ttlcment tests generally accepted In the 'trade and filed In spch time and manner as may be prescribed by regu I at Ions of the Secretary of the Treasury,
the commingled articles shal I be subject to the highc»t ratP. of duty app I I cab I e to any part thereof un I ess the cons I qnee or h Is agent segregates the nrt i c I es pursuant to subd 1 vis I on (b) hereof.
(b) Every segregation of articlos m,.~de pursunnt to th Is headnote sha 11 be accomp I i shed by the cons i oneo or his agent at the risk and expense of tho consignee within 30 d~ys (unless tho Secretary authorizes in writing a longer time) after the date of personal ·del hery or· mal 1 lng, by such employee as the Secretary of the Treasury shal I designate, of written notice to the consignee tha·t the articles are cormi i ng I ed and that lhe quant I ty or va I ue of each c I ass of articles cannot be readily ascertained by customs officers. Every such segregation shal I bo accomplished undor customs supervision, a~d the compensr:1tion and expenses of the superv~stng customs officers shal I be reimbursed to the Governm(!:nt by the consignee under such regu tat ions as the Secretary of the Treasury may prescrlhe.
(c) The foregoing provisions of this headnoie do not apply with respect to any part of a shipment If the consignee or his agent furn i shos, in such ti me and m~nne r il~
ITIOV be prescribed by regtJlationc; of tho SP.cretarv cf the Treasury, satisfactory proof -- ,
(j) that such part CA) i5 corrrnercially negligible, (8) Is not capable of segregation without exo~ssivo cost, and (C) will not be segregated prior to its use in a manufacturing process or athendse, and
(ii) that the commingling was not intended to avoid the payment of lawful duties.
Any article with respect to which such proof is furnished shal I be considered for al I customs purposes as a part of the article, subject to the next lower ra"te of duty, with which it is commingled.
_(d) The foregoing provisions of this headnote do not app I Y w 1th respect to any shipment if the consignee or h ls agent shal I furnish, In such time and manner as may bo pre~cr I bed by regu I at i ans of the Secretary of the Troasury. satisfactory proof --
( i) that the value of the commin9led articles is I ess than the aggregate va I ue wou Id be' if the sh i prnent were segregated;
(ii) that the sh I pment Is not capab I c of segrege-t ion with?ut excessive cost and wi I I not be segreg~ted prior to its use tn a manufacturin~ process. or otherwise; and
(iii) that the corrmingl Ing was not intended to avoid the payment of lawful duties.
Any merchandise with respect to which such proof is furnished shal I be considered tor al I customs purposes to be dutiable at the rate appl I cable to the material present in greater quantity than any other mater i a I.
(el The provisions of this headnote shall apply only In cases where the schedules do not expressly provide a part i cu I ar tariff treatment for cc:nrrd nq 1 ed ar1 i c I C>s.
Page 5
8. Abbreviations. In the schedules the fol lowing sy;:ibols and abbreviations are used with the meanings respsctlvely indicated below:
S dollars ¢
i + ad va:. bu. cu. doz. ft. gal. in. lb. oz. sq. wt. yd. pcs. prs. I in. I .R.C.
cents percent p I us ad valorem bushel cubic dozen feet gal Ion inches pounds ounces square weight yard pieces pa I rs I inear Internal Revenue Code
9. Definitions. For the purposes of the schedules, un I ess tne context otherwise requires --
(a) the tenn "entered" means entered, or withdrawn from warehouse,· for consumption in the customs terr I tory of the United States;
(b) the term "entered for consumption" does not inc I udo w i thdrawa Is f rem warehouse for consumption:
(c) the term "withdrawn for consumption" means withdrawn from warehouse for consumption and does not Include articles entered for consurnption;
(d) ;the term "rate of duty" fncfudes a free rate of du·ty; rates of duty proclaimed by the President shal I be refer·red to as "proc I a fmed" rates of duty; rates of duty enacted by the Congress sha 11 be referred to as "statutory" rates of duty; and the rates of duty in col urnn numbered 2 at the time the s...:hedules become effective shal I be referred to as "or f g i na f statutory'' rates of duty;
(el the term "ton" means 2,240 pounds, and the term "short ton" means 2 ,000 pounds;
(f) the terms "of", "wholly of", "almost wholly of", "in part of" and "contain Ing", when used between the description of an articfe and a material (e.g., "furniture of wood", "woven fabrics, wholly of cotton", etc.>. have the fol lowing meanings:
Cl) "of" means ihat the article ls wholly or In ch f ef va I ue of the named mater I a I;
( i i) ''who I I y of" means that the _art i c I e Is, except for neg I igible or insignificant quantities of some oth0r material or materials, coMposed completely of the named material;
(iii) "almost wholly o.f 11 means that the essential character- of the article Is imparted by the named !T'aterial, notwfthstanding the fact that significant quantities of some other material or materials may be present; and
{iv.) "in part of" or ''containing" mean that the article contains a significant quantity of the named rnaterii31.
With regard to the appl icatlon of the quantitative concepts speci lied in subparagraphs (Ii) and (iv) above, It is intended that the de minimis rule apply.
A-6 TARIFF SCHEDULES OF THE UNITED STATES ANNOTATED (1969)
General Headnotes and Rules of Interpretation
Pl'.(.:e 6
10. General Interpretative Rules. For the purposes of lhese schedules --
(a) the general, schedule, part, and subpart headnotes, and the provisions describing the classes of imported articles and specifying rhe rates of duty or ott1er import restrictions to be Imposed thereon are subject to the rules of interpretation set forth herein and to such otner ru I es of statutory interpretotion, not lnconslsient therewith, as have been or may be developed under administrative or j ud 1 c i a I ru I I ngs;
(b) the titles of ~he various schedules, parts, and s•;bparts and the footnotes therein are intended for convenience in reference only and havo no legal or Interpretative signlflcar.ce;
Cc) an Imported article which is described In two or roore provisions of the schedules is classifiable In the prov is inn which most spec i ti ca I I y describes It; but, in opp I yi ng th!s rule of interrre1ation, the fol lowing consider·atlons shal I govern:
( i ) u superior head Ing cannot be en I arged by inter i or headings indented under it Dut c<3n be I imited tnereby;
(Ii) comparisons are to be made on I y between prov i -s:ons of coordinate or equal status, I.e., between the primary or ma In superior headings of the schedu I es or bet\.,een coo rd 1 nate inf er i or heading.;; 1.;h i ch are subordinate to the same superior heading;
(d) If two or more tariff descriptions are equally appl !cable to an article, such article shal I be subject to duiy under the descrlpTio~ for which the original statutory rate is highest, anc~, sh~uld the highFlst original statutory rai·e be appl ica~le to two or rror·e ot such descriptions, tho article shal I be suLject to duty under th~t one of ·such descriptions which f i rs t appears In the schedu I es;
Ce) in the absence of s.pec i a I I anguage or context which otherwise requires --
(i) a tariff classification controlled by use (other tt-1an actual use) Is to be determined in accordance with the use In the United States 1t, or immediately prior to, the date of importation, of articles of that class or kind to which the imported Drticles belong, and the control I ing use is the chief use, i.e., the use which exceeds ~II ot"her uses (jf any) combir1ed;
(ii) a tariff cl<:::issification control led by the actual use to which an imported art"icle is put in the: United States is satisfied only lt such use is intended at the timu of importation, the article is so used, and proof thereof Is furnished within 3 years after the date the article ls entered;
(f) an article is In chief value of a material If such material exceods in value each other single component material of the article;
(g) a headnote provision which enumerates arricles not included in a schedule, part, or subpart is not necessarily exhausiive, and the absence of a particular article from such headnote provision shal I not be given weight in determining the relative speci tlcity of competing provisions Nhlch describe such article;
{ h) un I ess the context re4u ires otherw I se. a tar i t f description for an article covers suct1 article, whet~er
· assemb I ed or noT assemb I ed, and whether finished or not finished;
( ij) a provision for "parts" of an article covers a product solely or chiefly used as a part of such article, Jut does not preva i I over a spec i f i c provision for such ;iart.
I I • Issuance of Ru I es and Regu I at i ans. The Secretary of the Treasury is hereby authorized to issue rules and regulations governing the admission of articles under the provisions of the schedules. The allowance of an Importer's claim for classification, under any of the provisions of the schedules which provide for total or partial rel let from duty or other Import restrictions on the.basis of tacts which are not determinable from an examination of the article Itself in its condition as imported, Is dependent upon his complying with any rules or regulations which may be Issued pursuant to this headnote.
12. The Secretary of the Treasury Is authorized to prescribe methods of analyzing, testing, sampl Ing, weighing, gauging, maasuring, or other methods of ascertainment whenever he t Inds that such methods are necessary to determine the physical, chemical, or other properties or characteristics of articles for purposes of any law administered by tho Customs Service.
Gerzerol etat1:etiaaL hcadnotea:
l. Statistical Re uirements or J, orted Artioles. Persons ma 7..ng aWJtoma entry or ?Jtt awa of aPttc es im-po1•ted into the cWJtoms tu1'1'itory of the United States shalt complete the entry or withdi>azJal forms, as provided herein and in regulations issued pUl'suant to kn.I, to provide for statistical purposes information as follows:
(a} the number of the Customs district and of the port where the articles are beir.g entered for consumption or warehouse, as shO!Jn in Statistical Anne;r A of these scheduled;
(b) the name of the carrier or the means of transportation by which the al'ticles were transported to the fi1'Bt port of unloading in the United States;
(c) the foreign port of lading; (d) the United States port of unlading; le) the date of i,mportation; ( f! the country of origin of the articles eo:pressed
in terms of the designation therefor in Statistical Anneo: B of these schedules;
( g) a description of the articles in sufficient detail to permit the classification thereof under the
.proper statistical reporting number in these sch'1dules; lh! the statistical reporting number under !.)hich the
articles are classifiable; (ij) gross weight in pounds for the articles covered
by C1ach reporting number whe.i imported in vessels or ai.roraft;
(k) the net quantity in the units specified herein .for the classification involved;
(l) the U.3. dollar value in accordance with the definition in Section 402 01• 402a of the Tariff Act of 1930, aa amended, for aU merchandise inaluding that free of duty or dutiable at specifio rates; and
(m) suoh other information with respect to the imported articles as is provided for e lseLJhel'B in these schedules.
TARIFF SCHEDULES OF THE UNITED STATES ANNOTATED (1969)
General Headnotes and Rules of Interpretation
2. Statistical Att>1otations. (a) Tho statistical anttetations to the T<U'f.ff Sclicdl<les of the United States consist of --
(iJ the 2-digit statistical suffi:r:es, (ii) the indicated units of quantity, (iii) the otatistical l1eadnotes and annexes, and (iv) the italiciaed aT'ticle descriptions.
(b) The legal to>:t of t11e Tariff Schedules of the United States conaiots of the remaining tc>:t as more specifimlly identified in hoadttete 10( a) of the general headttetes and rules of interpretation.
(c) The statistical anttetations a1'6 subordinate to the provisions of the legal text and cannot change their scope.
J. Statistical Reporotina Number. (a) General Rule: Except as provided in paragraph (b} of this headttete, and in the absence of specific instructions to the contrary elsewhere, tho statistical rooporting nl#nber for an article consists of the 7-digit number formed by combining the 5-digit item number ~th t11e appropriate 2-digit statiatical suffi:r:. Thus, the statistical reporting number for live monkeys dutiable under item 100.95 ia "100.9520".
(b) Wherever in the tariff. ochqdules an <U'ticle is classifiable under a provision which derives its rote of duty from a different provision, the statistical reporting nl#nbor is, in tlze absence of specific instructions to the contrary elsmJhero, the 7-digit rumzber for the basic provision followed by the item number of the provision from which the rote is dsrived. T11us, the statistical reporting nl#nbar of nri.3:ed apple and grape juices, not containing over 1.0 percent of et11yl alcohol by voll#ne, is "165.6500-165.40".
4. Abbreviations. (a) The following symbols and abbreviations are used with tho meanings rospecti ve ly indicated below:
s. ton c. i;tit. mg. M. bd. ft. M. bd. ft. me. cord
short ton one hundred 100 tbs. milligram 1,000 board feet 1,000 board feet miilicurie 128 cubic feet amount to cover 100
sqU<U'e feet of surface
sup. ft. superficial foot oa. ounces avoirdupois fl. oa. fluid ounce ca. troy troy ounce pf. gal. proof gallon
(b) An "X" appearing in t>zo column for unita of quantity means that no quantity (other tl1an gross weight) is to be reported.
(c) Whenever two sepa:mt" units of quantity are ah01.m for tlzs same aT'ticle, the "v" follOt.>ing one of such uni.ts means that the oolue of the <U'ticle is to be reported with that quantity.
A-'7
Page 7
A-8 TARIFF SCHEDULES OF THE UNITED STATES ANNOTATED (1969)
HISTORICAL NOTES Notes p. 1 General Headnotes
Amendments and.Modifications
PROVISIONS
Gen Hdnte--Language "Bxcept as provided in headnote 6 of 3(a)(i) · schedule 7, part 2, subpart B," added; language
"except that all articles" deleted and language "except that all such articles" inserted in lieu thereof. Pub. L. 89-805, Secs. l(a), (c), Nov. 10, 1966, 80 Stat. 1521, 1522, effective date Jan. 1, 1967.
Language "Bxcept as provided in headnote 4 of schedule 7, part 7, subpart A," added. Pub. L. 89-806, Secs. 2(b), (c), Nov. 10, 1966, 80 Stat. ·1523,_ effective date March 11, 1967.
'PROVISIONS
Gen Hdnte--Headnotes 3(d), (e), and (f) redesignated as 3(d), (e), headnotes 3(e), (f), and (g), respectively,, (f) and (g) and new headnote 3(d) added. Pub. L. 89-283,
Secs. 40l(a), 403, Oct. 21, 1965, 79 Stat. 1021, 1022; entered into force Oct. 22, 1965, by Pres. Proc. 3682, Oct. 21, 1965, 3 CPR, 1965 Supp., p. 68.
Gen Hdnte--Language "and containers of usual types· ordi-6(b) (i) narily sold at retail with their contents,"
added. Pub. L. 89-241, Secs. 2(a), 4, Oct. 7, 1965, 79 Stat. 933, 934, effective date Dec. 7, 1965.
A-9
SCHEDULE 5, - NONMETALLIC MINERALS AND PRODUCTS
A-10 TARIFF SCHEDULES OF THE UNITED STATES ANNOTATED (1969)
SCHEDULE 5. - NONMETALLIC MINERALS AND PRODUCTS 278
Part 1 - Nonmetallic Minerals and Products, Except Ceramic Products and Glass and Glass Products
A. Hydraulic Cement; Concrete; Concrete Products
B. Lime, Gypsum, and Plaster Products C. Stone and Stone Products D. Mica and Mica Products E. Graphite and Related Products F. Asbestos and Asbestos Products
~I Part 2 - Ceramic Products
A. Refractory and Heat-Insulating Articles
Stat. Item 3uf
f1x
Sll.11
SI 1.14
Sil. 21 Sll. 2S
Sll.31 Sll.41
511. 51
Sil. 61 511.71
512.11
512.14
Sl2. 21 512 .24
512 .31 512. 35
00
20 40
00 00
00 00
00
00 00
00
00
00 00
00 00
TARIFF SCHEDULES OF THE UNITED STATES ANNOTATED (1969)
SCHEDULE 5. - NONMETALLIC MINERALS AND PRODUCTS Part 1. - Nonmetallic Minerals and Products, Except Ceramic
Products and Glass and Glass Products
Page 279.
5 - 1 - A, B 511. 11 - 512. 35
A-11
Units Of
Qurtntlty
Ratee or nity Artie lee
PART 1. - NONMETALLIC MINERALS Al'ID PRODUCTS, EXCEPT CERAMIC PRODUCTS AND GLASS AND GLASS PRODUCTS
Subpart A. - Hydraulic Cement; Concrete; Concrete Products
Subpart A head no·t e:
I. For tho purposes of th Is subpart --(a) the term "cement" means cemeni· Ing mater· I a Is
without added sand, gn1vel, or other aggregate; and (b) the term "concroto" means :i composite of
cementing materials of mineral origin with added mineral aggregate such as sand, crushod stone, or gravel; and
(cl the term "tiles" aoes not Include any ar-tlcle 1.25 inchesOrm:>re in thickness.
Plaster rock or gypsum: Not ground and not wholly or partly calcined....... S. ton .. Ground, wholly or partly calcined, or both. . . . . . . . . Ton .•...
Cement of gypsum: Valued not over $40 per ton........................ Ton ..... Valued over $40 per ton .• '. . . . . . .. . .. .. . • . . . . • .. . . • Ton ...•.
1
2¢ per 100 lbs., including weight of container 1.3~ per 100 lbs., including weight of container
3\ ad val. 12% ad val.
21\ ad val. 20 .5% ad val.
10% ad val.
12\ ad val. 21.5\ ad val.
1.5~ per 100 lbs., including weight of container
I.St per 100 lbs., including weight of container
Free 95t per ton
$8 per ton $11.20 per ton
I
2
8¢ per 100 lbs., including weight of container 6' per 100 lbs. including weight of container
20\ ad val. 30\ ad val.
55\ ad val. SS\ ad val.
SO\ ad val.
30\ ad val. 40\ _ad val.
12¢ per 100 lbs., including weight of container
10¢ per 100 lbs., including weight of container
Free $1. 40 per ton
$10 per ton $14 per ton
A-12
Page 280
B, C 513. 61
TARIFF SCHEDULES OF THE UNITED STATES ANNOTATED (1969)
SCHEDULE 5. - NONMETALLIC MINERALS AND PRODUCTS Part 1. - Nonmetallic Minerals and Products, Except Ceramic
Products and Glass and Glass Products
Stat Item Sut
f1x
Unite ot
Q.lant1t;r
Rates ot lb~
512.41 512.44
513. 11
513. 14
513.21 513. 31
513.35
513. 30 513.41
513.51
Sll.61
00 00
00
00
00 00
Articles
Articles not specially provided for, of plaster of Paris, with or without reinforcement;
Statues, statuettes, and bas .. rcliefs ......••..•• , .• Other ...•.......... ·· •.. ·•·······•····••··••·•·••··
Subpart C. - Stone and stone Products
Subpart C headnotes:
I. This subpart covers stone and articles of stone, but does not include --
( i ) I imestone to be used in the manufacture of forti Ii zer <see part 11 of schedu I e 4);
(I I) articles of concrete in which stone chips or particles are used as aggregate (soe subpart A of this part);
(Ii I) certain abrasives and abrasive stones (see subpart G of this part);
Civ) precious and semiprecious stones (see subpart Hof this part>;
(v) talc, soapstone, or cornwal I stone (see 5ubpar-t J of this part); and
(vi) certain articles provided for in schedule 7.
2. The term "slabs" (items 514.61 and 514.65) embraces t I at st'one pieces, not over 2 inches in 1hickness, having a facial area ot 4 square Inches or more, whether or not cut to size and whother or not one or both surfac~s have been rubbod or polished, the edges of which have not been beveled, rounded or otherwise processed except such proce5sing as may be needed TO faci litato Installation as ti ling or veneering in bui I ding construction.
Subpai·t C atatia tical headnote:
( 1) Fol' the puPpoBes of this aubpa1•t the teim "SupePficial foot" refers to a unit of quantity deaignati"fl tlte area of the largest face of a a lab in terms of square feet.
Sand, crude or manufactured, and gravel: Sand containing by weight 95 pcrc~nt or more
of silica and not more than 0.U percent of oxide of iron ........ , ............... , .......•...
Other •............................................ ·
Stone chips <.ind spalls, a11<l stone, crushed (othentise than mt!rcly to facilitate shipment to the United States) or ground:
Marble, brcccia, and onyx chips •.•................. Slate ............................................. , Limcstorw:
00 Imported to he used in the m,rnufacturc of cement ...... , .......... : ...... , ....... , , .
00 Other ..•.........•.•....•..•......•..•.....•.. 00 Other ......................................•.......
00 Storie statuary anJ .sculpture!<. 11ot spc.•dal ly providc.•d for. the profc.ssioua~ proJuc.:tLon~ of sculpt0rs only ...
{.;ranitt! and .trticlcs of gr~rn1te: 00 Granite, not. 11K111ufacturcc.I, .'.rnJ not suitable for
x .••.••• x ..... ..
Ton., ..• Ton .....
s. to11., s. ton ..
s. ton .. s. ton .. s. ton ..
x .......
8\ ad val. 9.5\ ad val,
40~ per ton Free
8\ ad val. 8\ aJ val.
Fr~t.·
12~ per short 4\ aJ val.
b\ aJ val.
use us numumt:ntal, paving. or hui I Jing stone, •... Ton .. ,., Frt•(!
1
to11
60\ ad val. 35\ ad val.
$2 per ton frea
30\ ad val. 25\ ad val.
2
$1 per short ton $1 per short ton .10\ ad val.
ZO\ ad val.
Free
Stat Item Sur
flx
s 13. 71 00
Sl3. 74 00
Sl3. 81 00 Sl3. 84 00
Sl3.91 00 Sl3.94 00
Sl4. II 00
Sl4. 21 00
S!4. 24 00
Sl4. 34 00
Sl4. 41 00 Sl4. 44 00
S!4. Sl 00
S!4.S4 00 s 14. s 7 00
Sl4.61 00
Sl4. 6S 00 Sl4. 81 00
Sl4.91 00
SIS .11 00 SIS .14 00
SIS. 21 00
SIS. 24 00
SIS.31 00 SIS.34 00
SIS. 41 00
SIS.SI 00
SIS. S4 00
S!S.61 00 SIS.64 00
TARIFF SCHEDULES OF THE UNITED STATES ANNOTATED (1959)
SCHEDULE 5. - NONMETALLIC MINERALS AND PRODUCTS Part l. - Nonmetalllc Minerals and Products, Except Ceramic
Products and Glass and Glass Products
Page 261
5 - l - c
A-13
513. 71 - 515. 64
Unlte Of
~e.ntlty
Ra tea or Ill ty Articles
Granite an<l articlC'S of granite (con.): Granite, suitable for use ns monumental.
p.:1vin~, or buil<ling stone: Not pitchcJ 1 not lined, not. pointC'tl, not
hewn, not sawed, not dressed, not polished, and not otherwise manufactured ... :
Pi tchl"'J, lined, pointed, hewn, sawed. drcssc<l, polishC'U, or otherwise manu-factured ................................... .
Other, not spcci al \y provid"J for: Not decorated ................................ . Decorated .......................... , ......... ,
Jet; and articles of alabaster, of jct, or of alaba•ter and jet:
Jct, not manufactured ..... , ....................... . Other, not specially provided for ................. .
Limestone and articles of limestone: Limestone, crude, not suitable for use as
monumental, paving. or building stone .. : ........ . Limestone suitable for use as monwnental,
paving, or builJing stone: Not hewn, not sawed, not dressed, not pol-
ished. and not otherwise manufactureJ ...... . Hewn, sawed, dressed, polished, or other~
wise manufactured .......................... . Other, not specially provided for:
Articles of chalk ...... , ...............•...... Other:
Not decorated ........................... . Decorated ............................... .
Marble, breccia, and onyx, and articles· of one or more of these substances:
Marble, breccia, in block, rough or squared only ................ , ........................... .
Onyx, in block, rough or squared only .... , ........ . Marble, breccia, or onyx, sawed or dressed,
over 2 inches thick ............................. . Slabs:
Not rubbed and not polished in whole or in part ... , .......... , ..................... .
Rubbed or polished in whole or in part ....... . Other, not specially provided for .......•.........•
Quartzite, whether or not manufactured .........•........
Slate, and articles of slate: Roofing slate ..................... , ........ , ...... . Other, not specially provided for ............•.....
Travertine and articles of travertine: Travertine, not hewn, not sawed, not dressed,
not polished, and not othen1ise manufactured ..... Travertine, hewn, sa'iiied, dressed, polished, or
othen1ise manufactured, and suitable for use as monumental, paving, or bui I ding stone ••.••....
Other, not specially provided for: Not decorated .•..•......................•..... Decorated ......•...........••..•.. • ••••••...••
Stone, and articles not specially provided for, of stone:
StoneJ not manufacturedJ and not suitable for use as monumental, paving, or building stone ...•.
Stone suitable for use as monUll'lental, paving, or building stone: ,
Not hewn, not sawed, not dressed, not pol .. ished, and not othen1ise manufactured ... , •.•
TARIFF SCHEDULES OF THE UNITED STATES ANNOTATED (1969)
SCHEDULE 5. - NONMETALLIC MINERALS AND PRODUCTS Part l. - NonmetaWc Minerals and Products, Except Ceramic
Products and Glass and Glass Products
Units ot
~tit:r
Rates ot D.lt)' Articles
Subpart D. - Mlca and Mlca Products
Subpart 0 headnote:
I • For the purposes of th Is subpart --!al the term "ml ca" Includes both natural and
man-made_ mica; --(bl the term "split block mica" !Item 516.311
means mica, not exceeding 0.020 Inch In thickness, that has been split and selected within a tolerance of 8 mils, but which has not been cut or stamped to dimensions, shape or form;
!cl the te.rm "mica splittings" !Item 516.51) means mica laminae In book-form or book-pack, or In loose pack, suitable for use In the manufacture of bul l:t-up mica (Item 516.91); and
ldl the term "built-up mica" !Item 516.91) means electrical lns·u1atlng plates, sheets, and tapes, •hether or not attached to paper, cloth, or other backing, consisting of reconstituted mica whether or.not treated with resins or of layers of mica splittings and bonding material.
Mica not manufactured (including mica over 0.006 inch in thickness, not cut or stamped to dimensions, shape or form, and split block mica). and mica scalings, mica cleanings, and other mica waste and scrap: ·
Untrimmed phlogopite from which no rectangular piece over 2 inches long or l inch wide may be cut ......................... •••·•·•••··•· .. ···
Waste and scrap valued not over 5 cents per pound:
Ph logopi te .......•...•..••..•..•....•..•.•.... Other ..•.•..........•.•...•.... , ..• ,,,, •.• ,,,.
Articles not specially providt!J for, of mica ........... .
Any article described in the foregoing items 516.71 to 516.76, inclusive, or 5lb.94, if Canadian orticle anJ original motur-vchi e..:lc equipment (sec lwaJnotc 2,
1
Lb ...... 4\ ad val.
Lb ...... 10\ ad val. Lb ...... 10\ ad val. Lb,. .... Free
········ 2f per lb. lb, Lb.
Lb ...... Free
Lb ...... Free
Lb ...... 18\ ad val.
Lb ...... 20\ ad val. Lb ...... 32\ ad val. Lb ...... 20\ ad val.
lb ...... 10\ ad val.
l.b ...... ll.5\ ad val.
Lb ...... 2U\ ad val.
part 68, schedule b).................................. l.b...... Fre<:
2
15\ ad val.
25\ ad val. 25\ ad val. Free 4• per lb.
Free
Free
45\ ad val.
40\ ad val. 40\ ad val. 40\ ad val.
20\ ad val.
40\ ad val.
40\ ad val.
TARIFF SCHEDULES OF THE UNITED STATES ANNOTATED (1969)
SCHEDULE 5. - NONMETALLIC MINERALS AND PRODUCTS Part I. - Nonmetallic Minerals and Products, Except Ceramic
Products and Glass and Glass Products
A-15
Page 283
5 - l - E, F 517 .11 - 518. 51
Stat Item sur
nx
Unite ot
Qmnttty
Rates or ti.tty
517. 11 00
517.21 00 517. 24 00 517. 27 00 517.31 00
517.51 00
517 .61 00
Articles
Subpart E. - Graphite and Related Products
rr,ph i tr. ,~rudt' t1nd re fi. ncd: Artii1 ... 1al ............ , .............. , ............ . Natural:
Crystalline flake (not including flake dust):
'valued not over S.S cents per pound ..... . Valued OVC'T S.S cents per pound ......... .
Calcined petroleum and coal coke .. not conuncrciul ly suitable for use as a fua 1 ........................... .
Carbons and c lcct rodes:
Lh ......
lb ..... . Lb ..... . Lb ..... . Lb ..... .
S. ton •.
4\ ad val.
12\ ad val. 0. 65t per lb. 4\ ad val. Free
12\ ad val.
l
Electrodes, in part of carbon or. graphite, for electric furnace or electrolytic purposes ........ Lb ...... 10\ ad val. Y
517. 71 00
517. 74 00
517. 81 00
Carbons and e lec't'rodCs, for producing c 1 ectric arc light:
Under 0.5 inch in diameter or of .equivalent cross-sectional area........................ No,..... II\ ad val.
0.5 inch or more in diameter or of equiva-lent cross-sectional area ............ , ...... No ...... 9.5\ ad val.
Bn1shes for electric generators, motors, or other electrical machines or appliances; plates, rods, powder, and other forms, wholly or partly manufactured, for manufacturing into the aforesaid brushes. . . . . . . . . . . . . . . . . . . . • . . . . . . . . . . . . . . . . . . . . . . . . . . X. . . . . . . 8\ ad val •
517. 82 00 If Canadian article and original motor-vehicle equipment (see headnote 2, part 68, schedule 6).. X....... Free
517.91 00 Articles not specially provided for, of carbon or graphite.............................................. X....... 12\ ad val.
518.11
518.21
518. 41 518.44
518.51
10 20
30 40 ~o
60
00
00 00
00
Subpart F. - Asbestos and Asbestos Products
Subpart F headnote:
I. This subpart does not Inc I ude footwear, headwear, gloves, laminated or reinforced plastics, and certain other articles provided for In schedule 7.
Asbestos, not manufactured, asbestos crudes, fibers, and stucco, and asbestos sand and refuse containing not more than 15 percent by weight of foreign matter .......•..•....•.•... •·····•·······•·•··········
Yarn, slivers •. rovings, wick, rope. cord .. cloth .. tape, and tubing, of asbestos, or of asbestos and any other spinnable fiber, with or without wire, and
Free s. ton s. ton
s. ton s. ton s. ton s. ton
articles of any of the foregoing...................... lb...... 6\ ad val.
Articles in part of asbestos and hydraulic cement: Pipes and tubes and fittings therefor •...•••.••.... Other ........•....•.•.......••..•........•.......•.
Articles not specially provided. for, of asbestos ......•.
1/ Duty temporarily sus;iended for certain electrodes. See Appendix to Tariff Schedules.
lb .... .. Lb .... ..
x •......
0. 24t per lb. 0.15t per lb.
7\ ad val.
2
10\ ad val.
1.65~ per lb. l.65t per lb. 30\ ad val. 10\ ad val.
45\ ad val.
45\ ad val.
60% •d val.
45\ ad val.
45\ ad val.
45\ ad val.
Free
40\ ad val.
0.75t per lb. It per lb.
25\ ad val.
A-16
Page 284
5 · 1 - .G ~]),Ill - 519. 05
TARIFF SCifEDULES OF THE UNITED STATES ANNOTATED (1969)
SCHEDULE 5. - NONMETALLIC MINERALS AND PRODUCTS Part l. - Nonmetallic Minerals and Products, Except Ceramic
Products and Glass and Glass Products
Stat Item Suf
fix
Unite of
~tity
Rates ot Jlity
519 .0 ! 00
519 .OS 00
Articles
Subpart G. - Abrasives and Abrasive Articles
Subpart G headnotes:
I. This subpart cov·ers certain crude minerals convnon I y used for mak i 119 abrasives and abrasive art i c I es .li tem5 519. 0 I through 519, 17, inc I us Ivel but these minerals are cla5si f iable in tnis subpart even it they are not of abrasive quality. This subpart also covers certain mineral5 and artificial abrasives in forms suitable for use as abrasives or tor abrasive purposes {items 519.31 through 519.37, inclusive). The. r·ernaining provisions of this subpart apply to papers, cloths, stones, and other articles which are cut or fashioned from natural st0ne or made from natural or ar1 if iciul abrasiv~ rna1orials usually with the use of glues, rosins, rubber or other bindi11g materials, and which are designed and used tor grinding, sharpening, smoothing, po 1-i sh i ng, trueing, cutting, or similar purposes. The provisions of this subpart do not cover --
~I) sand {see subpart C of this part), unloss mude up into abrasive articles;
(ii) naturdl or synthetic diamond dust or powder (see subpart H of .this part);
{ilil crushed or powdered glass (see part 3 of this schedule), unless made 'up into abrasive dt"t i c lcs;
( i vl cosmetics and other toilet preparat i ens (see pur1 75 of schedu I e 4);
(vl soup and syntho1 ic detergents (sco part 83 of cchedu I e 4 l;
(vi) wht!els or oth~r abrasiv+:J articles moun1ed in frameworks or ruch i nt:=s (see schedule 6>;
{vii l dent a I burrs (see par1 2 of schedule 7); or
(vi I i ) too Is to wt1 i ch aLlrd~ i vtis have been appl icd but which have o1hur tunctioni ng or working elements such as cutting teeth, edges, grooves, dnd f lules (sne schedule 6l.
L. for thu purpoJcs of this subpart ~-la} the ti;;rni "pumi ce 11 incl lldtls bo·th purni cu and
disks and fftticr circura;:-bot.Jiu::; dosig11ed to rotato 011 a central uxis.
j. In Jotermining the c.ompo11er.t md1or:d~ of c:..r.lef Vdlue in the nrriclos covered by i tum 519.SJ, 519.91, 'Jl9.9:~, or ?19.95, only inc cJbr~sive co•r1pur11rnts thereof shc1l I Lil cc.•mp.irud.
H•Jrrs tOill.:5 in bloc)...~., rough ........•...............
Pumice stone tu h ... ~ US!.!d in tht· manuf.ll"l un.: of coac1ctc masonry prudut.:ts s111.:h as bui Jdi11g hlo'-°l.s, bricks, ti It.·-;, a11d si1ni lar fun.1~ ..................... .
l
Tou ..... Free
s. to11 .. Free
2
TARIFF SCHEDULES OF THE UNITED STATES ANNOTATED (!969)
SCHEDULE 5. - NONMETALLIC MINERALS AND PHODUCTS Part l. - Nonmetallic Minerals and Products, Except Ceramic
Products and Glass arid Glass Products
A-17
Page 285
5 - I - G 519.ll - 519,97
Ste.t Item Su1'
t'1x
Unlto or
Quantity
Rates or lhty
519.11 519 .14 519.17
519.21
519~ 31 519.3·1 519.37
519. SI
519.61
519. 71
519.81 519 .. 83
519.84
519. 86
519.91 519.93 519.95
519.97
00 00
20 40
~o 40 60
Articles
EIJ'l("ry, natural corundum, pumh~l?, flint, rottcnstclflC; and tripoli.., al I the forcgoi ng, crude, or c.ru!-ihcJ merely to facilitat .. ~ trnnsportati<m to the Unit<"<l Stntcs:
Pumice: Valued not ovl:'r $15 per ton ................. . Valu~d over $15 per ton .......... _, ........ ..
Si liaL"n Cltrbi1ic .•••.•••.• , .• , •••.•.•.•.••••• , ••••• A lu.':'fi nu.'11 o.rida • ••••.•• , .•••••• , ••• , •• , •••••••••••• Other ....•........•••................•.......•....
Emery, natural corundum, pumice, flint, rottcnstone, tripoli, garnet, silicon carbide, onJ artificial abrasives, nll the foregoing. in grains, or ground, pulverized, or refined:
00 Pumice ......... ,·;, .. · .........................•.... 00 Rottens tone ond tripoli. ................... : ..... .
Other ... , ........................................ . 20 Si Licon carbide ..•....•...........••......... 40 A lwrr;mun oxide • .••••..••.•••..••••••.•••••..• 60 Other .••••.•••..•••••.•.••••..••.••••••••••••
00 Papers, cloths, anJ other mntcrials, wholly or partly coated with abrasives, artificial or natural, or both, whether in the fonn of sheets, strips, disks, belts, sleeves, or similar fonns .................... .
00 Hones. whetstones, oils tones, and polishing stones,
00
00 00
00
00
00 00 00
00
all the foregoing (except emery files or <tones), with or without handles, designed to be used directly in the hand ...... , ..................... , ... .
Millstones, abrasive wheels, and abrasive articles not specially provided for:
Burrstones, manufactured or bound up into millstones ......................•...............
Abrasive wheels: Solid natural stone wheels .................. . Of diamond .................................. . Other:
Bonded with synthetic resins .•......•...
Other .••. , ...............•..........•... Other:
Of emery or garnet ........................•.. Of pumice .. · .................•......•........• Of natural corundum or of artificial
abrasive materials ........•................ Other ....................................... .
l.h ...... IJ>. • •.•.•
S. ton s. ton
S. ton S. ton S. ton
Lb ...... Ton •••..
Lb. Lb. Lb.
x .......
No ......
Ton .....
No, .•... No,. ....
Lb ..... :
x .......
x ....... x .......
x ....... x .......
U .034' per lb o.o<>, p"r lh. Frcl~
Free
0. 28' per lb. Free 0. 4¢ per lb.
5\ ad val.
Free
Free
Free 12\ ad val.
16.8¢ per lb.
l
13.5\ ad val. 8\ ad val.
8\ ad val. 11\ ad val.
4\ ad val. 12\ ad val.
+
2
0.1, per lb. U.25¢ per lb. Free
Free
o.75, per lb. Free H per lb.
20\ ad val.
Free
Free
Free 30\ ad val.
50¢ per lb. + 40\ ad val.
20\ ad val.
20\ ad val. 35\ ad val.
20% ad val. 30\ ad val.
A-18 TARIFF SCHEDULES OF THE UNITED STATES ANNOTATED (1969)
STAGED RATES AND HISTORICAL NOTES
Staged Rates
Notes p. I &hedule 5,
Part 1
Modifications of colur.m I rates of duty by Pres. Proc. 3694 (Canadian Compensation), Dec. 27, 1965, 3 CFR, 1965 Supp., p. 85, as modified by Pres. Proc.:ssia •liov, 6, 1967 , ·32 F.R.16467:
Rate of duty, effective wi tt, respect to articles entered on and after January 1 --TSUS Prior item rate
1966 1967 1968 1969 1970
513. 3S 1/ 20, per short ton !St per short ton 16f per short ton 2/ y 2/ Sll. 36 I! 20f per short ton 18¢ per short ton 16t per shC'rt ton 14t per-short ton 12t per short ton !Ot per-short ton
I/ Fonnerly part of TSUS item 513.34. !J See Kennedy Round staged rates, infra.
Modifications of coltunn I rates of duty by Pres. Proc. 3822 (Kennedy Round), Dec. 16, 1967, 32 F.R.19002:
TSUS item
Sll. ll
511.14
511. 21 511. 25 511.41
Sil.SI :Sll.61 Sl 1. 71 Sl2. II
Sl2 .14
Sl2 .24 Sl2. 31 512. 35 Sl2.41 512.44
513. lt 513.21 Sl3.31. 513.35 513.36
Sl3.4l Sl3.51 513. 71 513. 74 513. 81
513.84 513.94 Sl4. ll 514. 21 514. 24
514.34• 514 .41 S!4 .44 514.51 514. 54
Prior rate
3t per 100 lbs., including weight of container
2.25¢ per 100 lbs., including weight of container
5\ aJ val. l~\ ad val. ~6% ad val.
12. S\ ad val. 15\ ad val.
• 27\ ad val. 3t per 100 lbs.,
including weight of container
2.5¢ per 100 lbs., including wci ght of container
$1. 19 per ton $10 pe:r ton $14 per ton 10\ ad val. 12\ ad val.
50t per ton 10\ ad val. 10.5\ ad val. 161 per ohort tun 16¢. pee short ton
5.5\ ad val. 8\ ad val. 14 per cu. ft. 12.5\ aJ VJl.
JS\ ad val.
27\ ad val. 17\ ad val. 20¢ per s:. >rt ton 2f per cu. ft. 21\ ad val
10\ ad val. 15\ ad val. 27\ ad val. 27.51 pc~ cu. fl. 32. 5f per cu. ft.
Rate of duty, effective with respect to articles entered on and after January I --
1968
2.5¢ per 100 lbs., ir.oluding weight of container
l.5! per 100 lb•., including weipht of container
4\ ad val. 13\ ad val. 23\ ad val.
11\ ad val. 13\ ad val. 24\ ad val. 2f per 100 lbs.,
including weight of container
2¢ per JOO lbs., including weight of container
$1.07 per ton $9 per ton $12 .60 per ton 9\ ad val. 10.S\ ad val.
45¢ per ton 9\ ad va ! . 9\ ud val. free 14; per sho~t ton
4.S\ ad val. "/\ ud '/al. Free 11\ ,,J val. 1.S\ ad Vdl.
24\ ad val. 15\ ad val. 18• per short ~un l~ per cu. ft. 18.S\ uc val.
9\ ad VJ!.
I 3\ ad val. 24\ ad val. 24¢ fH.: r i.=u. ft. 29¢ per cu. ft.
1969
2f per JOO lbs., including: "'eight of container
1.31 per JOO lbs., including weight of contniner
3\ ad val. 12\ ad val. 20.S\ ad val.
JO\ aJ val. 12\ ad val. 21.5\ ud val. l .5j per 100 lbs., including weight of container
1.51 per 100 lbs., including weight of containc.:r
95¢ per ton $8 per ton $11.20 per ton 8\ ud val. 9.5\ ad val.
40 I per ton 8\ ad val. 8\ ad val. Free I 2f per short ton
4\ ud val. 6\ ud val. Free HJ\ .iJ val. IL\ ad Vd!,
21. 5\ .iJ val. 13.5\ ud vul. lLf pt~r short ton lj per cu. ft. lU .!1\ ad val.
ti\ .1J val. 11\ ad val. ..! I.!>\ aJ val. 22f per <..·u. ft. :UJ4 per cu. ft.
1970
2~ per 100 lbs., including weight of container
0.9j per 100 lbs., including weight of container
2\ ad val. 10\ ad val. 18\ ad val.
8.5\ ud val. 10\ ad val. 18.5\ ad val. 11 per 100 lbs., including weight of container
If per JOO lbs., including .weight of container
83f per ton $7 per ton $9. 80 per ton 7\ 3d val. 8\ ad val.
35f per ton 7\ ad val. 7\ ad val. Free 10¢ per short tc.n
3.5\ ad val. S.S\ nd val. Free 8.5\ ad val . JO\ ad val.
18.5\ ad val. 11.S\ ad val. 14f per short ton 1¢ per cu. ft. 14.5\ ud val.
7\ .. d val. 10\ a•l val. 18.S\ ud val. l9i pt!r cu. ft. 22~ per cu. ft.
1971
I.Sf per JOO lbs., including weight of container
0.4f per 100 lbs., including weight of container
I\ ad val. 9\ ad val. 15.5\ ad val.
7\ ad val. 9\ ad val. 16\ ad val . 0.51 per 100 lbs.,
including weight of container
0.51 per 100 lbs., including weight of container
71 j per ton $0 per ton $8. 40 per ton 6\ ad val. 7\ ad val.
30t per ton 6\ ad val. 6\ ad val. f'rce 10¢ per short
3\ ad val. 4.5\ ud val. Free 7\ ad val. 9\ ad val.
16\ all val. 10\ ad val.
ton
ll ¢ per short ton I j pc r cu. ft . 12.5\ ad val.
o\ all val. 9\ ad val. lo\ ad val. luf per cu. ft. 19f per w. ft.
1972
1¢ per 100 lbs., including weight of container
Free
Free 7.5\ ad val. 13\ ad val.
6\ ad val. 7.5\ ad val. 13. 5\ ad \'al. Free
Free
59¢ per ton $S per ton $7 per ton 5\ ad val. 6\ ad val.
25t per ton 5\ ad val. 5\ ad val. Free !Of per short
2.5\ ad val. 4\ ad val. Fre" 6\ ad val. 7.5\ ad val.
13.5\ ad val. 8.5\ ad val.
ton
10¢ per short ton h per cu. ft. 10.5\ all val.
5\ ad val. 7.5\ ad val.
I ll.S\ ad val. 13.Sf per cu. ft. lot per cu. ft.
Notes p. 2 Schedule 5,
Part 1
TARIFF SCHEDULES OF TUE UNITED STATES ANNOTATED (1969)
STAGF:D RA1'ES AND HlSTOruCAI.. NOTES
i\-19
Modifications of column l rates of duty by Pres. Proc. 3822 (Kennedy Found), Dec. 16, 1967, 32 F.R. 19002 (con,):
TSUS l tem
514.57 514. 61 514 .65 514. 81 515 .11
51s'. 14 Sl5.2l 515. 24 515.31 SIS. 34
SIS. S 1 515.54 Sl5 .61 515.64 516. ll
516. Zl 516.24 516.41 Sl6. 71 516. 73
s 16. 74 Sl6. 76 516.81 Sl6. 91 516.94
517 .11 517.21 517.24 517. 27 Si 7. 31
SI 7. S 1 517. 61 517.71 517. 74 SI 7. 81
517.91 518.21 518. 4.1 518.44 518. 51
$19. 11 519. 14 519. 31 Sl9.37 y 519. Si
519. 83 519.84
519. 86 519.91 519. 93
Prior rate
50t peT cu. ft. 5.5\ ad val. 7\ ad val. 21\ ad val. 25\ ad val.
10.S\ ad val. 10.~t per cu. ft. 21\ \id val. 15\ ad val. 27\ .. d vaL
2t per cu. ft. 21\ ad vaL 15\ ad val. 27% ad val. 5\ ad val.
12.5% ad val. 12.S\ ad val.. 4t per lb. 22. 5\ ad val. 25\ ad val.
40% ad val. 25\ ad val. 12.5\ ad val. 17\ ad val. 25\ ad val.
5\ ad val. 15\ ad val. 0.82H per lb. 5.5\ ad val. Free (formerly
517.30) 0. 5% ad val. (formerly 517 .. 33)
15% ad val. 12. 5% ad val. 14\ ad val. 12% ad val, 10\ ad val.
15% ad val. 8% ad val. 0.3¢ per lb. 0.225¢ per lb. 9% ad val.
O. 0425¢ per lb. O. OB'/ per lb, O. 35¢ per lb. 0.5¢ per lb. 6.S\ ad val.
15% ad val. 21¢ per lb. +
17% ad val. 10% ad val. 10% ad val. 14% ad val.
Rate of duty, effective with Tespect to articles entered on and after January l --
1%8
45~ per cu. ft. 4.5% ad val. 6% ad val. 18. 5\ ad val. 22\ ad val.
9% ad val. 9¢ per cu. ft. 18. 5\ ad val. 13\ ad val. 24\ ad val.
1. St per cu. ft. 18.5\ ad val. 13% ad val. 24% atl val. 4% ad val.
11% ad val. 11% ad val. 3¢ per lb. 20\ ad val. 22\ ad val.
36% ad val. 22\ ad val. 11 % ad val. 15% ad val , 22% ad val.
4% ad val. 13\ ad val. O. 7¢ per lb. 4. 5\ ad val. Free
13% ad val. 11% ad val. 12. 5% ad vat. 10.5% ad val. 9% ad val.
13% ad val. 7% ad val. O. 25¢ per lb. 0.2'/ per lb. 8% ad val.
0.038¢ pet lb. 0.07'1 per lb. o. 31'1 per lb. 0.4¢ per lb. 5.5% ad val.
13% ad val. 18. 9¢ per lb. • 15% ad val.
9% ad val. 9% ad val. 12.5% ad •1a1.
1969 \970 l97l 1972
--1------·--·-~---------4---------1 40t per cu. ft 4\ ad val. 5. 5% ad val. 16.S\ ad v3L 20\ ad val.
8\ ad val. 8t per cu. ft . 16.S\ ad Vil!. 12\ ad val. 21.5\ ad val.
H per cu. ft. 16.5% ad val. 12\ ad val., 21.5\ ad val. 4\ ad val,
10% ad val. 10\ ad val. 2t per lb. 18\ ad val. 20\ ad val.
32\ ad val. 20\ ad val. 10\ ad val. 13.5% ad nl. 20\ ad val.
4\ ad val. 12\ ad val, 0.65¢ per lb. 4\ ad val. Free
12% ad val. 10% ad val. ll\ ad val. 9.5\ ad vaL 8% ad val.
12\ ad val. 6% ad val. 0.24¢ per lb 0 .15¢ per lb. 7% ad val.
0.034¢ per lb. 0.06¢ per lb. 0. 28¢ per lb. 0.4¢ per lb. 5% ad val.
12% ad val. 16.8¢ per lb. '
13.51; ad val. 8% ad val. 8\ ad val. 11 'I; ad val.
35t per cu. ft. 3.5\ ad val, 4. 5\ ad val. 14~5\ ad va!~ 17\ ad val.
7\ ad val. 7t per cu. ft. 14 .5\ ad val. 10\ ad val. 18. 5\ ad val.
It per cu. ft. 14.5\ ad val. 10\ ad val. 18.5\ ad val. 3\ ad val.
8.5\ ad val. 8.5\ ad val. lt per lb. 15.5\ ad val. 17\ '!-d vaL
28% ad val. 17\ ad val. 8. 5\ ad val. 11.5\ ad val. 17\ ad val.
3\ ad val. 10\ ad val. 0.55t per lb, 3.5\ ad val. Free
10\ ad val. 8.5\ ad val. 9.5% ad val. 8\ ad val. 7\ ad val.
10% ad val. 5. 5% ad val. 0.2j: per lb. O.lSt per lb. (,\ au val.
0.029~ per lb. 0. 055j: per lb . O. 24t per lb. 0.3t per lb. 4.5\ ad val.
10% ad val. 14.7f per lb. + 11.5\ ad val.
rt. ad val. 7\ ad val. 9.5\ ad val.
30¢ per cu. ft. 3% ad val. 4% ad val. 12,5% ad val. 15% ad val.
6% ad val. 6t per cu. ft. 12,5% ad val. 9\ ad val, 16% ad val,
It per cu, ft. 12. 5% ad val. 9% ad val, 16% ad val. 3% ad val.
7% ad val, 7% ad val. 0.5. per lb. 13% ad val. 15% ad val.
24% ad val. 15% ad val. 7% ad val. 10% ad val 15% ad val.
3% ad vai. 9% ad val. 0.49¢ per lb. 3% ad val. Free
9\ ad val. 7% ad val 8% ad val, 7% ad val. 6% ad ·val,
9\ ad val. 4. 5% ad val. 0.18¢ per lb. 0.1¢ per lb. 5% ad vc..l.
0.025¢ per lb. 0.045'1 per lb, 0. 21¢ per lb. 0.3¢ uer lb. 3.5% ad val.
9% ad val. 12.5¢ per lb. ~ 10% ad val.
6% ad val. 6% ad val. 8% ad val.
25¢ per cu. ft. 2 .5% ad val. 3.5% •d ~al. 10.5% ad val. 12.5% ad val.
S\ ad val. 5¢ per cu. ft. 10. S% ad val. 7.5\ a~ val. 13.5% ad val.
1¢ per cu. ft. 10. 5% ad val. 7 .5% ad val. 13.5% ad val. 2 .5% ad val.
6% ad val. 6% ad val. Free 11\ ad val. 12.S\ ad val.
20% ad val. 12.5% ad vaL 6\ ad val. 8.5% ad val. 12.5% ad val.
2 .5% ad val. 7.5% ad val. 0.4¢ per lb. 2 .5% ad val. Free
7 .5% ad val. o\ ad val. 7% ad val. 6% ad val. 5% ad val.
7. 5% ad val. 4% ad val, 0.15<1 per lb. 0.1'/ per lb. 4.5% ad val.
0. 02<1 per lb. 0.04¢ per lb. 0.17<1 per lb. o. 2¢ per lb. 3% ad val.
7.5\ ad val. 10¢ per lb. •
8.5% ad val. 5% ad val. 5% ad val. 7% ad val.
!! See footnote l at the end of this list of Staged Rates.
Sl.ihpt hdnte J (b)
A-~L;.uig.J(tgt 0 f1nclu<l1hg b ... tw1H:n:. ·md Jt•:-...ons) wtlii o.H~d~i:J
sand) g!avel, lH" oth<JI llh.ncx.tl £1ggre,4.Ht:'' J.c•letcd ana language n1,.,f mlflcll al or1 gill wJ th nddt•J UllH(·r1.1!
aggregate :such cts ··U.n1..i, n·ushed ~h)f;;:J oi gra,u:l" irisvrted jn l:.tuu. Ul:C.Cf:vi, Puh. L. w~~l4A ~ .St:CS
--ltc;a tilj, ~ .. ~ (c0ll1-f1Ui l tate .. --16t per short ton; colwnn 2 rate· ·$1 per short ton) deleted and items 513 .. ~'.. End 513.36 and heading illllllediately preceding item 513.35 added in lieu thereof. l're5. Pro~ 3822 (Kennedy Round), Dec. 16, Hl67, :;1 f R. l9clU2, effective date Jan. 1, !968.
A-21
Notes p. 4 Schedule 5,
Part I
TARIFF SCHEDULES OF THE UNITED STATES ANNOTATED {1969)
STAGED RATES AND HJSTOIUCAL NOTES
PROVISION
516.98--Item 516.98 added. P11h. L. 89-283, Secs. 40l(a), 40S(h), 0ct. 21, 196>, 79 Stat. 1021, 1024; entered into force Dec. 20, 1!>65, bv Pres. Proc. 3682, Oct. 21, 1%5, 3 CFR, 1965 S11pp., p. 68; effective with respect to articles entered on nnd after .Jan. 18, 196!'.
511.30--Item 517.31 (col\mm l rate--O.:;\ nd vnl.; column 2 rate--517.31 10\ ad val.) deleted and lte"" 517.30 nnd 517.33 nnd 517.33 heAding immediately precNling item 517.30 added in
lieu thereof. Pub. L. 89-433, Secs. l(n), (c), May 31, 1966, 80 Stat .. 169, effective date ,July l, 1966. The rates of duty for item 517.31 had hem1 temporarily suspended for graphite valued $50 per to11 or less by former item 909.20.
Items 517.30 (column l rAte--free; column:< rate--IO\ ad val.) and 517.33 (column I ratc--0.5\ Rd vnl.; column 2 r:tte--10\ ad vnl.) und heading immediately precedinR item 517.30 deleted and item 517.31 added In lieu thereof. Pres. Proc. 3822 (Kennedy Round), Dec. 16, 1967, 32 l'.R. 19002, effectiv" date Jan. 1, 1968. ·
PHOVl ~Jr:l>I
:;!7.n2--1t<-.n 5!7.R2 ndded. Pub. L. 89-283, Secs. ·iOl(a), 40S(d}, Oct. 21~ 1965, 7~l :=;tat. 1021, 1025; t'n-t 1~rcd into force Dec. 20. 1965, by Pres. Proc. 3681 ~ Oct. 2!, 1965, .3 CFR, 1965 Supp., p. 68; effcctivt:. 'l<1'ith r(:~pcct to articles onterod on and after ,l:rn~ 18. 1965.
Statistical Notes.
PROVISION
511.14--
Effective date
00--Disa. (trunsfet'I'ed to 511.1420 & 40) ....... Jan. 1, 1964 do 20--Estab. (trunsfet'I'ed from 51J .1400ptJ •.....•
40--Estab. do
513.34--See Other Amendments and Modifications 00--Disc. (trunsfet'I'ed to 513. 3500 &
i. This par-1 covers ccrdrnic war·es, and articles of such wares and, in addition, certain unshaped refractory material (suopart Al closely rcl~:lt-ed
th.:;refo,
L.. For the purposes of tr1e tar-iff sd1c:duies ... ~ (3) c 11 ce1-ar:1ic articlell is a shaped cJrticle
:1av ·, ng a g I ~ztid or~ 'Ung I a zed body of crys1 a I I i ne or su:::istar.tiui ly crysta! line structure, whicn body ls conposed essentially of i c nonr:1etal l ic $ub-stan.::es and eit 11er is tornied a molten m<:iSS wr, i ch soi id if; es on cool i or ! s 1 orrncd and sub-seauent i y hardened by sudi Treat111trn1· th Lit tf1e bcdy, if r·e,'H"iat.:.::d to pyr.om0tric cone 0/0, HVLI!d not becor:ie 1;,ore den:,e / harder, or I t'.':'.)S po row,, but Joes not include g!~ss ariicle;
( b J the 11 eor ~henware 11 erri~racos CtJrdm i c ware, whetl1er or notld;)dOr dt:corat"ed, having a f i rc::J l1ocly v.'h i ch ns c i ay as an es'.AJnt i a! !ngreC:it>.r.~ rJnd will ausorb m.)rt:: Hrnn 3.0 perceni of lts weight of water;
\c) tt1e. terrn 11 stonewore" ornL1races c.:.;ramic ware. '»'IH~i"her or not ']I ozed orde'Cor·atl··d, r·1av i ;1rJ a fired bodv· which con·t,:i;ns clay as an t·::;~~E:ntia! in9redient, is r,vT curnmon\y wnite, vii Ii <Jt>Sor-Li noi morf; than J.0 pt!rcer~ r of it;; H':J i 0t1 t of WcJ t-er p .Jnd is na turu I I y opaque ( excep·!· in very l Iii n pi \Kes) t;ven wrion f u 11 y vi t-ri f ! 8d;
(cJ) thC; 1·0rm 11 ~~_?rce~H cmbr,:1ce~; fine .... grrJl ncd ccrrJm·1c ware (other ·th<Jn '-"tu11c.;\"df1..~), w11e1-hor
or noi· gl.JZG:.! or de::coraTed, t1avi11~J iJ tired body 1vt1icJ1 is w·1i1"e <.unless iJrt\tici<JI ly colored) • .mu vd i ! <-it.isorb mor·e ihan o.~ pun:•?nt hut nol inon~ than 3.0 pur(~t:::r1r cf its weight u! w-..tc:r;
(Ed tt1c ti~nns 11~~~~11 and t 1 pon:\:-~" r:mt.Jrac(,: flni:::--9rc1ined ceru111ic wrif't] (otht:r ihc-H\ s·torwware), whett1r.::r OJ' not g I ated or docoruttHJ, hJv i ng (\ body wf1icll i'~ while lur1lo'._/, '1r1 ificia! ly culorad) and v1 i I I r1oi <Jb',orb nK1ru ifHH\ 0. 1J porcc;r1 ! of its weigh·t of water;
ware c,r lrii1• l~l};")uYCJ-:/hTcti con!<Jl11·:. by wcJ,.,t1 1 PtJC'::r1t ,Jt' r11urt-' of ,_;u!1..im:d l>ur\•!'
. :_., {r1J 1t1£1 iurrr; 11 11011t;u:1e ,.:::1i n<1wtJ1·u 11 uml·r;H"·•~'., er· i 1.d\',.Jrt! ur pur._t.:> !~·;r:-Uil\"071fi~in bv113 di i !lo\~dr'-;
{h) th.~ tur-111 ''s_~~~.:2.'.~~11 , <J'., .-q1rl!r~d 1o cere:.rn;i c \'/~ire, r.ornl1r uC•;', '.luc!1 w~lrtl'> huvi l·~ d 1!1.)rly lll<Jdlof 1~k\icrl<JIS fh)no of which hcHJ !Jc1in w0:~11vd~ 11rountl~ o:- uf!1erwi 0,,c; tiur1uli dtud;
(/) 1110 lurm n0~.~~-11 , d"> dpplii:d :o
cc ram i c l'tdr17c. p (!/flt;1·<.1l:tJ'., :.-ud1 w,iro:, t1<.1Y i 11s1 d DoJy
r:idde of rr.:jt<.::rial~s 1Hly of whict1 /,Jd Lll~u11 Wd.'.~ti...h;,
grc·und, or 1JH1erw!~~u benoJicicih-~d:; dl1J
lj) t!10 "term 11 ~_9.L' 1 inc I tHlU:~ ilny t~nqcAJtl i.•t body sl ~r, tX<.:<-'p-1" 0119obi1 or budy ~,I ip dppl lt;J ro lt1.1 bodv a-:. a dccor::.i-tio!l; ond
weignt of !O grams, and mJy havc;:i 0110 largH :.urtact, gtqzed.l.
Units of
~tit;y l 2
Page 290
5-2-A 531.01- 531. 39
TARIFF OCl-U:Dtli.EB OF THE UNITED BTA'l'ES ANNOTATED (!969)
SCHEDULE 5. NONMETALLIC MINERALS AND PRODUCTS Part 2. - C;•ramk Proow·t11
A-23
··----------------~----Stat SUffix
1----+--1------------~·------------------ ---Subpart A. - Refradory an<i Hea1-Immlatlnv
ArtkleR
t. lt.is ',ubpa.1 d·n~, tiol 1tl\l!•r •tr~mi!c nip -
t1tcnt WJt-€1 {•~•'(J t,,itpnl rJ(1f 1h1', p,Ft),
~·. , for tt1a p11rrl1',iJ" qf tt., '\\JI l'•l' r, ~~!.!:.g~L~_!_,e_1 ', \il\~'t!wr •,t11poo 1o1 r.o1 ls one hav!11~1 i1 bulk Jonc;it) nol nvrr :•1 \•\iu.1d•, cubic fc'Ot an,J d·-·~~l1JIH1 d tu 1•11podn 01 ""Irr f 1n1, of hf:!at ,1~ terr•oei-at~r0·, .:;( .• wr ir,()(' 0 1.
3. F•H tho Mn po~""' 1_\f th, tory ar~11 • wiwth::i; '-'hJpc,J having a bulk Jnn-::,i ty (\VHI /')
and d(ls ! qn~'d to btt <1 ,t:;id to n«; _, t 2(100°~-. ~A shapeid n .... 1r,h·tory Mrt1elA h;::i:, spn_1 1! prop~·,rties of str on~1ft1 ,JIHJ rr><,i~ td'l(r< lo th1""rm<1I
Shor~ anrl ITIOy O I ">~'I ! 1 dV'~ ~ df)pOPd 1 PV up._)n ihn ~'Uf t I, 1.;·~ lar use, +ot ~h·111 du:-~1gned, 01her Spl"·,1nt pr,,p~H tier, ~llch ll" resistan1 t.! ~o Jt'rasi'-)n and ((.\rrosi,-.n.
Unit. of
Q).1ontity
Rateo of niw -1-·-=r=----2---...i
TARIFF SCHEDULES OF THE UNITED STATES ANNOTATED {196~
STAGF;D RATES AND IUSTORICAL NOTES Notes p. l Schedule 5,
Part 2
MOOification<> of col~ l :rate-; of duty by Pres. Prue. 3322 tKennedy noun&)~ nee. 16~ 1967 32 t~~R. l9CH2:
Value of U.S. imports for consumption, by TSUS items included in the individual sunnna.ries of this volume, totaJ. and from the 3 principaJ. suppliers, 1967.
B-1
APFENOJ X ll
Value of. U.S. imports for consumption, b;• TSIJS items included in the individual summaries of this volume, total and from the 3 principal suppliers, 1967
B-3
(In thousands of dollars. TI1c dollar value of imports shown is defined generally as the market value in the foreign countrv nnd thcn•fore excludes U.S. import duties, freight, and transportation insurance)
Summary tit le
and
Al 1 countries First supplier Second supplier Third supplier --~-- --- --------- --Per-
Gypsum rock and gypsum plaster (p, .31) 512.21 9,723 -38.3 Cane.de. 512.24 86 5,3 u King 512.31 J./ 3/ 512.35 "f../ J/
Articles of plaster of Paris (p. 39) 512.41 613 57.2 Spain 512.44 76 39,5 : Mexico
Sand and gravel (p, 45) 513.11 159 : 66.7 Australia 513.14 753 - 8.1 Canada
Crushed or ground stone (p. 53) 513.21 127 8.7 Italy 513.31 1_/ 513.34 1,529 21.1 Canada 513.41 J.,079 -18.l Canada
Value
389 5,951
14 16
819 2
29 3
9 960
7,TIO 78
359 30
134 753
115
1,440 1,058
Country Value Country
J>1.pan 217 Denmark Canada 4,087 Norway
Cane.de. 1 U King Canada gj Denmark U King 75 Italy
w Germ 15 Mexico Cane.de. ?./ Spain
Dom Rep 3 France 1
Mexico 1,065 Jamaica w Garro 4 Kor Rep
U King 125 Italy Italy 16 Canada
Fep SAf 18 Cane.de.
Canada 7 Mexico -
Be.ha.me.a 79 Mexico Pana.me. 9 ItaJ.y
Marble, jet, alabaster, and chalk articles, and stone sculptures, not else·.ihere enumerated 513. 51 266 -26.9 Italy 251 Japan 1 Israel 513.94 855 -13.2 Italy 842 Spain 6 Greece 514. 34 l -19.9 U King 1 Japan gj 514.81 3,776 - 1.0 Italy 2,900 Portugal. 554 Mexico
Stone, crude and not suitable for use as monumental, paving, or building stone (p. 63) 513.61 11 ,9 Canada 6 Sweden 3 .. Norway 513.91 gj 3/ Italy g/ 514.11 121 -65.4 Canada 118 W Germ 2 France 514.41 22 38.5 Canada 19 Mexico 1 Italy
See footnotes at end of table.
V\).lue
(p. 59)
123 1,586
2/ ?./
25
4
505 2
94 8
4
3
10 6
1 1
161
2
J. l
B-4 APPENDIX !.I
Value of U.S. imports for consumption, by TSUS items included in the individual swnmaries of this volume, total and from the 3 principal suppliers, 1967
(In thousands of dollars. The dollar value of imports shown is defined generally as the market value in the foreign country and therefore excludes U.S. import duties, freight, and transportation insurance)
Summary title
and
All countries First supplier Second supplier ' Third s~pplier
Value of U.S. imports for consumption, by TSUS items included in the individual summaries of this volume, total and from the 3 principal suppliers, 1967
B-5
(In thousands of dollPrs. lhe dollar value of imports shown is defined generally as the market value in the foreign country and therefore excludes U.S. import duties, freight, and transportation insurance)
Summary All countries First supplier -----------~p·--
Second supplier Third supplier
title Per-and Amount cent
page; in change Country Value Country Value Country Value TSUS it.em l96'i from
')16.9:1 ~= •• -34.ll : Belgium 21 C11nada 14 W Germ 13 _,, 516.911 ·, 9 : -:~3.6 : Crt.t)adB. :!6 : U King 25 France 21
Carbon and graphite products (p. ! ') \) 517.11 3'{ 217.0 W Germ 19 Canada 9 S'1itzerland: 6 517.61 l0.4h8 7l1.9 Japan 11,922 Netherlands: 4,759 U King 359 517. 71 432 - 7.7 France 241 Japan 68 Belgium 5<; 517. 71, 192 80.7 W Germ 88 France 67 Italy 15 517.81 1,160 ,3 U King 407 Canada 236 France 233 517.82 110 20.7 Canada 110 517,91 816 -31.9 W Germ 257 Japan 251 U King 152
Graphite, natural (p. 1-43) 517 .21 364 -26.7 Malagas 354 Turkey 6 Austria 517.24 147 -31.9 Malagas 103 W Germ 43 France 517.27 4 '}_/ W Germ 4 517.30 913 130.2 r.jex.ico 893 Kor Rep 18 Ceylon 2
Calcined petroleum and coal coke not suitable for fuel (p. 151-) 517. 51 13 -84.4 : Canada 13 :
Carbon or graphite crucibles (p. 155) 531. 33 46 : 118.3 : U King 24 Svitzerland: 6 W Germ 5
Asbestos. not manufactured (p. 1-59) 518.11 65,744 : -10.l : Canada 59,164 Rep SAf .5,298 Rhodesia 897
Asbestos textile products (p. 167) 518.21 1,007 : 15.5 : u King 474 : Japan 237 Canada 214
Articles in part of asbestos and hydraulic cement (p. 1-73) 518.41 1,916 : -26.1 Japan 1,040 Mexico 240 Italy 215 518. 44 2,136 : 8.2 : Belgium 1,454 : Canada 530 Mex.ice 82
Asbestos articles (p. 181-) 518.51 1,439 : 1.1 : Canada 651 : u King 533 : W Germ 91
Burrstones, whetstones, hones, oilstones, and solid natural stone vheels (p. 185) 519.01 '}:./ 3/
6 519.61 79 --5.2 Japan 40 W Germ 26 u King 519.71 ±./ 519.81 13 59.6 U King 11 Japan l Greece g/
Pumice and articles of pumice (p. 189) 519.05 504 -10.0 Greece 271 Italy 231 Lv Ww I l 519.11 28 -51. 3 Italy 27 Honduras l 519.14 21 -36.9 Italy 21 519.31 76 -53.2 Italy 76 519.93 5 -57.3 Italy 5 Japan g/ 523.61 17 18.9 'N Germ 9 Italy 4 Netherlands: 2
See footnotes at end of table.
B-6 APPENDIX B
Value of U.S. imports for consumption, by TSUS items included in the individual sU111111aries of this volume, total and from the 3 principal suppliers, 1967
(In thousands of dollars. The dollar value of imports shown is defined generally as the.market value in the foreign country and therefore excludes U.S. import duties, freight, and transportation insurance)
Summary title and
All countries First supplier Second supplier : Third s~pplier ·
page; TSUS item
Amount in
1967
Percent
change from 1966
Country
Abrasives, natural and ar.tificial (p. 199) 519.17 522·: 519.21 27,938 519.34 y 519.37 2,170
Coated abrasives \r· 2ll) 519. 51 ,292 :
Abrasive wheels and other 519.83 242 519.84 220 519.86 532 519.91 7 519.95 211 519.97 65
1/ No imports in 1967. 2/ Less than $500. J/ No imports in 1966.
-34.2 France -15.6 Canada
3/ -ll.6 W Germ
3.2 : W Germ
abrasive articles not 13.6 Switzerland: 59.2 W Germ 25.9 U King
-59.4 Japan 108.7 France
34.1 U King
Value ·country Value Country Value
402 Rhodesia 53 BelgiUlll 27,594 Norway 249 W Germ
625 U King 603 France >.
2,092 : Switzerland: 601 U King
elsewhere enumerated (p. 219) lbO W Germ : 23 U King
70 Italy 66 U King 141 W Germ 114 Italy
3 W Germ 3 U King 78 W Germ 54 Japan 28 W Germ 15 Italy
37 66
312
375
19 35 61
l 4o
7
APPENDIX C
Value of U.S. imports for consumption, by TSUS items included in the individual summaries of this volume, total and from the 3 principal suppliers, 1968.
C-1
APPENDIX C
Value of U.S. imports for consumption, by TSUS items included in the individual summaries of this volume, total and from the 3 principal suppliers, 1968
C-3
(In thousands of <lol lars. The dol l:tr va Jue of imports shown is defined generally as the ·market value in the foreign country :ind therefore excludes U.S. import duties, freight, and transportation insurance)
Summary title
and
All countries First supplier Second supplier : Third supplier
Articles of plaster of Paris (p. 39) 512. 41 527 -13. 9 Spain 512.44 126 66.6 : Mexico
Sand and gravel (p. 45) 513.11 144 -47.1
30.8 513 .14 984 :
Crushed 513.21 513.31 513:35 513.36 513. 41
or ground stone (p. 53) 89 -30.l 1 2/
1,199 2; 879 2;
1,599 48.2
Australia Canada
Italy Italy Canada Canada Canada
571 Japan 7,279 Canada
33 Denmark 6 c.,nuda
1,019 IJ King
21 200 Mexico 15 Spain
21 874 France
8,976 88
Mexico Canada
298 IJ King 63 Italy
61 982
1 1,172
825 1,589
Rep SAf Norway
Canada
Bahamas Bahamas Italy
218 Denmark 4,837 Norway
9 France 1
61 Italy
4 Spain 3 Mexico
·3
1,380 1
Jamaica
126 Italy 21 Spain
41 1
18
27 47
5
Sweden U King
Mexico
~exico
Norway
Marble, 513.51 513.94 51 4. 34 514.81
jet, alabaster, and chalk articles, and stone sculptures, not elsewhere enumerated (p. 59)
Stone, crude and 513.61 513.91 514.11 514.41
251 - 5.4 932 9.0
12 1244.6 4,163 10.2
not suitable for 18 57.3
'}./ -42.2 68 -44.4 10 -54.l
S"e foot not es at end of table.
Italy 237 France 6 U King Italy 896 Spain 15 .;"apan Italy Switzerland: 2 Spain Italy 3 ,209 Portugal 541 :·!exico
use as monumental, paving, or building stone Norway 6 ~ep SAf 5 Italy ll Canada 62 W Germ 3 W Germ 5 Spain 4
(p. 63) Canada
France Canada
125 2,982
4
48
3 1
734
71 11
36 1
2
7 4
6 6 2
186
5
1 1
C-4 APPENDIX C
•::llue of U.S. imports for consumption, by TSUS items included in the individual swmnaries of this volume, total and from the 3 principal suppliers, 1968
(_I_n,.__.t_h~ou_s_a_n~d_s~o_f~d_o_l_l_a_rs_. The dollar value of imports shown is defined generally as the market value in the foreign country and therefore excludes U.S. import duties, freight, and transportation insurance)
Summary title and
page; TSUS item
All countries First supplier Second supplier : Third s~pplier
paving, and building stone (p. 1,088 8.7 Canada 3,115 87.4 Italy
8 165.0 Canada 35 -50.8 Canada.
270 -17.5 Italy 13 -60.9 Argentina 82 115.2 Italy
762 .. - 6.7 Italy 5,944 3 7.5 Italy
129 - 6.4 Italy 1,404 35,7 Italy
6 -36.3 Canada 16 -60.5 Mexico
Value ·country
69) 6' J Sweden
l,l) ,o Canada 6 Italy
27 Italy 170 Greece
12 Mexico 33 Greece
694 Portugal 4,554 Portugal
129 1,387 India
5 Mexico 8 W Germ
Articles of stone, not elsewhere enumerated (p. 85) 513.81 66 9.2 Italy 30 U King 513.84 7 -31.3 Finland 4 Italy 514.41 10 -54.l W Germ 5 Spain 514.44 21 -20.0 Italy 20 Belgium 515.31 64 -13.l Italy 64 515.34 4 1.3 Italy 4 515. 61 126 - 1. 7 Japan 33 W Germ 515.64 84 191.9 Mexico 55 Japan
Quartzite (p. 89) 514.91 273 4.9 : Sweden 153 Canada
Slate, and articles of slate (p. 93) 515.11 l 2/ Italy l 515.14 2,130 - 8.1 : Italy 1,733 Portugal
Mica, not manufactured, and mica films and splittings (p. 97) 516.11 l 2/ Mexico l Brazil 516.31 1,041 -2l.l Brazil 710 India 516.41 499 -25.5 Brazil 250 India 516. 51 1,339 -21.2 India 1,237 Mala.gas ::;16.61 233 -22.4 India 119 Jamaica
Waste and scrap mica (p. 107) 516.21 5 177.3 Mala gas 5 516.24 71 : 216.0 India 61 Brazil
Mica, cut or stamped to dimensions, shape, or form (p. 113) 516.71 1,444 37,7 : India 1,211 Mt:xico 516.73 64 50.2 India. 59 Brazil 516. "{4 5 -71. '( India J Taiwan 516. '(6 122 ll.0 India Jl Mexico 5}~ .98 !} ?}
Mica, ground or pulverized (1i. 121) 516.81 13 : -37.6 : Franc<: 12 India
See footnotes at end of t>ible.
Value Country Value
139 Rep SAf 1,309 Finland
2 6 W Germ }/
28 France di
31 Canada 23 Belgium
1,222 Belgium
13 Mexico l 4 Italy
14 Sweden 2 Canada 4 Canada l
33 Canada 8 India
83 W Germ
273 1J King
}/ 329 Tnzania 101 Malagas 89.: Mozambq 67 : Brazil
6 Rep SAf
123 u King 4 u King 2
23 Rep SAf
l
95 127
14
10 23 57
3
l
10 l l
24 6
19
101
2 92
6 39
4
61 l
20
APPENDIX C
Value o( U.S. imports for consumption, by TSUS items included in the individual summaries of this volume, total and from the 3 principal suppliers, 1968
C-5
(Tn thousands of dollars. The dollar value of imports shown is defined generally as the market value in the foreign country and therefore excludes U.S. import duties, freight, and transportation insurance)
Summary title and
Al I countries First supplier Second supplier Third supplier
page; TSUS item
Amount in
1968
Percent
change from 1967
Country Value Country
Bui.lt-up mica and articles of mit··1, '"'I. <>l::ewlwre t'l\\lffi<!l"'ll;ecl (p. 12'7) 5lti.91 Tl 3). 3 : W 1Jcrm !19 Canada 516.94 76 : - 11. l : ll Kin1< 39 : 'l'aiwan
1,216 Ii.~ U King 2~22 102. 5 Canada. 930 14.l U King
(p. :i_Jn) 292 -19.8 300 104.9 64 1395.4
Malagas W Germ W Germ
6,921 Italy 289 Japan 102 Japan 516 W Germ 222 287 Japan
290 Turkey 170 Malagas
50 Italy
1~alcined petroleum and coal coke not suitable for fuel (p. 151) 517. 51 104 691. 7 : Canada 104 :
Carbcn or graphite crucibles (p. 155) 531. 33 32 : -30.2 : U King 17 Switzerland:
Asbestos, not manufactured (p. 159) 518.11 72,930 : 10.9 : Canada 65,351 Rep SAf
Asbestos textile products (p. 167) 518.21 1,324 : 31.5 : Canada 571 : U King
Articles in part of asbestos and hydraulic cement (p. 173) 518.41 2,971 : 55.l : Japan 1,759 Mexico 518.44 2,487 : 16.5 : Belgium 1,777 : Canada
Asbestos articles 518.51
(p. 181) 944 : -34.4 : U King
Burrstones, whetstones, hones, oilstones, 519.01 l/ 519.61 73 - 7. 5 Japan 519.71 4 2/ Japan 519.81 9 -32.7 U King
See footnotes at end of table.
582 : Denmark
and solid natural stone
39 W Germ 3 U King 7 Ireland
wheels
Value Country Value
17 Belgium 12 India
4 Italy 350 Nethlds ll8 W Germ
34 W Germ 301 France
221 Canada
2 121 Nethlds
10 Rep SAf
10 ·canada
6,536 Rhodesia
407 Japan
516 Belgium 603 Australia
37 : Italy
(p. 185)
14 u King l l Belgium 11
9 11
2 146
75 26
157
148
4 3
2
520
294
315 56
35
12
c-6 APPENDIX C
Value of U.S. imports for consumption, by TSUS items included in the individual sW11111aries of this vol1une, total and from the 3 principal suppliers, 1968
(In thousands of dollars. The dollar value of imports shown is defined generally as the market value in the foreign country and therefore excludes U.S. import duties, freight, and transportation insurance)
Summary title and
: All countries : First supplier : Second supplier : Third s~pplier