Dublin Area Bus Network Redesign CTS Public Consultation Report
TRANSFORMING CITY BUS SERVICES Summary
Summary
JARRETT WALKER+ ASSOCIATES Dublin Aroa Bus Network Redesign Public Consultation Report - Summary
11
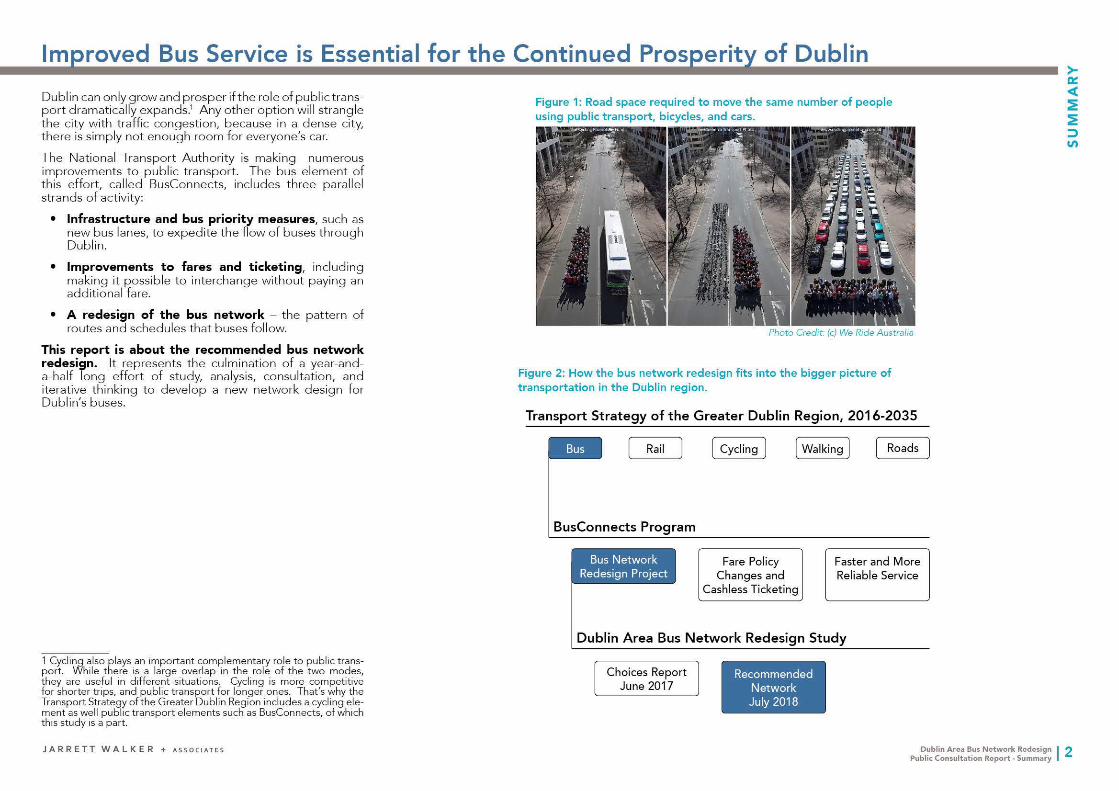
Figure 2 How the bus network redesign fits into the bigger picture of transportation in the Dublin region
Transport Strategy of the Greater Dublin Region 2016-2035
Rail [ Cycling ] [ Walking ] [ Roads
BusConnects Program
Bus Network Fare Po licy Faste r and More Redesign Project Change s and Reliable Service
Cashles s Ticket ing
Dublin Area Bus Network Redesign Study
Cho ices Report Recommended June 20 17 Network
Improved Bus Service is Essential for the Continued Prosperit y of Dublin
Dublin can only grow and prosper if the role of public trans shyport dramatical ly expands 1 Any o ther option will strangle the city with traffi c congestion because in a dense cit y there is simply not enough room for everyones car
The National Transport Au t hority is making numero us impr ove men t s t o public t ra nspor t The bus element of this effort called BusConnects includes three paralle l strands of act ivity
bull Infrastructure and bus priority measures such as new bus lanes to exped ite the flow of buses through Dublin
bull Improvements to fares and ticketing including ma king it possible to interchange without paying an add itional fare
bull A redesign of the bus network - the pattern of routes and schedules that buses follow
This report is about the recommended bus network redesign It represents the culmination of a year -and shya-ha lf long effort of study analysis cons ultation and iterative thinking to develop a new network design for Dublins buses
1 Cycling also plays an important complementary role to public trans shyport Wh ile there is a large overlap in the role of the two modes t hey are useful in diffe rent situations Cycling is more competitive for shorter trips and publ ic transp ort for longer ones That s why the Transport Strategy of t he Greater Dublin Region includes a cycling ele shyment as we ll public transport elements such as BusConnects of wh ich this study is a part
JARRETT WALKER+ ASSOC IATES
Figure 1 Road space required to move the same number of people using public transport bicycles and cars bull
Photo Credit middot (c) We Ride Australia
July 2018
Dublin Area Bus Network Redesign I2 Public Consultation Report - Summary
0 nix Park ary Road rn d Zoo)
Blackhall Place Four Mayor Spencer The Point
Museum Courts Square Dock lim 25a25b~ middot ffi Abbey St
-1==1~ ~ ~ imfm
~J rnJl= t=im=t~25a25b emm e1oo ril North Wall
0 ml [Ifill Grand Canal Dock
0Rmgsend Road
Christchurch Thomas W rillim Street
Rialto Tram Stop
ins The Coombe
0
Why Rethink the Bus Network gt-
Changing a bus network is always controversial Existi ng bull cus t o mers are used to the bus routes as they are and some may be unhappy with any change to their routine
However NTA has also received many commen ts asking for a more useful network and in fact the ne t work has obvious problems t hat only a redesign can repair
bull The network is very complex which makes it ha rd to remember and thus to use spontaneously You can remember a bus route you t ake every day b ut if yo u wan t to fee l free to move about the city you need to be able to reme mber the structure of a network just as most people remember the st ructu re o f the street netwo rk
bull The network is good for many radial trips - taking people into Dublins core - but not for orbital trips For example a trip from Blanchardstown t o Lucan or from DCU to t he Malahide Road usually requires going into the city centre and back out which takes tar too long and puts more buses into crowded city streets tha n need t o be there
bull Many routes overlap for long distances While lots o f buses go down some streets they are not evenly spaced to create the m os t frequent possible service
Figure 3 The three main types of public transport line are called radials orbitals and feeders
City Centre
Radial L Interchange
po int
Rail and tram network improvements require changes to the bus services Buses trams and trains are not competi t ors They are meant to wor k together to crea te the most useful possible ne t work Rail and tram upgrades (such as the rece nt Luas Green Line extensi o n and the planned frequency impr ove shyment on DART) the refore change the role that buses should play in the affected areas
0
bull The city is growing and changing in ways that the c( bus network must adap t to serve New communities and j ob centres are appearing on the fringe while the C ity Cen tre continues to grow denser especially gt in and near the Dockla nds v
All of these factors tell us that while any change in bus routes wi ll raise objections it is time to cons ider a sub shystantial redesign
Figure 4 The city centre network is so complex that it is impossible to draw a clear map of it A more useful network would have fewer overlapping routes but those routes would run much more frequently so that they are coming whenever you need them
JARRETT WALKER+ ASSOCIATES Dublin Area Bus Network Rodosign I 3 Public Consultation Report - Summary
Define Project Goal and Limits
Geometric Princip les of Analyse Demographics and Analyse Exist ing Net work High-Patronage Design Land Use Inefficiencies
Recommend ed Des ign Strategies
Choice Report
Public Consultation on Choices and Strategies
Analyse Travel Time Core Design Workshop to Outcomes Deve lop All-Day Plan
Refine Plan
Analyse Outcomes
Figure 5 Project steps to the Recommended Plan
Core Design Worksho p t o Refine Peak-Only Service
Refined Plan
Final Analysis
Recommended Plan
How the Plan Was Developed gtshy
Whats Included This proposed redesign ca n be implemented as soon as 2019 However it is mean t to set up a net wor k that w ill endure wit h minor adjus tmen t s for ma ny yea rs into t he future
This plan deals only w ith the bus se rvices co nt racted by t he NTA that opera te primarily within th e Dub lin M etr opo litan Are a Al l of these services are currently run by Dublin Bus th o ugh ap pr oximately 10 will soon be run by a new ope rshyator Go -A head Ireland following their successful bid in a recen t tend er compe t it ion
For profit services - including all Airp or t express services and the Swo rds Express service - are not covered by t he plan Ser vices provided by Bus Eireann including com shymuter services int o the Dublin area from neighbouring counties are also not included
To Increase Patronage Make Service Useful and Liberating The goal of the pr opos ed network is to make public trans shyport useful to mo re peop le to reach more destina ti ons all over Du b lin
Dubliners have already shown t hat the y use public tr ansshyport w hen it is useful But th ere are m any purposes for which t he service is no t useful and thi s is wha t the plan aims to change
Later in this summary we quant ify t his expans ion of use shyfulness For example under the proposed network the average Dubliner can access 18 more jobs and schools within 30 minutes 1 compared to the existing system
1 Technica lly the measu re here is the change in the numbe r of jobs and the number of enrol led stude nt s at pos t-seco nd ary colleges and universities within 30 minutes by walking and publ ic transport
JARRETT WALKER+ ASSOC IATES
How the Plan Was Developed Figure 5 shows how the p lan was developed
The Choices Rep ort released in June 2017 shared the consu lt ant t eams analysis of the existing situation and described several high -level strategies that could guide a network redesign
The public was asked to com ment on the se stra te gies to guide us on whet her and how stro ng ly to pursue the m Based on the very positive response to the str ateg ies NTA choose to proceed
In Ju ly 2017 the consultant tea m facili t ate d a t wo -week intensive retreat with NTA Dublin Bus and local gov shyernment officials T he pr oposed ne two rk was designed collaborat ively t o about 80 comp letion in these worksho ps
a The plan t hen went through furt her cycles of iteration lt( includ ing an additional workshop focused on the peak - ~ only services leading to the final recommendation ~ presented in thi s rep ort
VI During the workshops we repeatedly che cked how the new ne twork would improve w her e people could get to quickly and used th at feedback to continuous ly improve the des ign
Dublin Area Bus Network Redesign I 4 Public Consultation Report - Summary
Changing Buses Can Get You There Faster
The plan is based on a geometric principle that sounds wrong when people first hear it A network that assumes you are willing to change buses can often get you to your destination sooner
In t he pr opos ed network some trips t hat are now di rect will require changing buses but because the frequency is so much higher waiting time is reduced so much that the total t rip is faster
While a tolerance of interchange is thus an essential fea shy
service Complexity ~ ow frequency Buses in City
Centre
STANDARDIZE SERVICE 1 CATEGORIES
Yes Categories make planning
effi c ient services easier
Yes Frequency and span are
apparent from the category withshyou t look ing at
timetables
Yes Service catshyegories make
frequencies pre shyd ictable and cons istent
Yes Categor ies make planning
eff icient serv ices easier reducing excess bus trips
Yes Consolidating
2 SIMPLIFY RADIAL
SERVICE
Yes Releasesresources fororbital use
Yes Vast reducshytion of complexity especially in City
Centre
Yes Much h ig her frequency fo r
travel to from and thro ugh the City
Centre
service to the cen shytre on fe wer routes means frequency can be optimized reducing surplus
trips
BUILD FREQUENT3 ORBITALSYes
Yes The intersec shytion of frequent
orbi t als and radials produce a pat shy
tern that is easy to grasp
Yes Inc reased orbital fr equency
Yes Fewer pas shysenger tr ip s are forced through
City Centre reducing loads
GROW SUBURBAN 4 FEEDER NETWORKS
Yes Improves market for bo t h
orbital and radial se rvices to regional centres
Yes Fewer over shylapping rou tes in
suburban markets
Yes Improved local frequency fo r travel with in sub shy
urban area
Yes Feeder ne tshyworks support
consolidating sershyvice to City Centre
o n fewer routes
ture t here is still an inconvenience Thus t he proposed net work seeks to minimize the number of cases where multiple interchanges are requ ired to complete a t rip Under t he pla n
bull Within the MSO almost all of Dublin still has direct se rshyvice to the cit y centre
bull All of Dublin is no more than one interchange away from the City Ce ntre
bull Wi th few except ions trips between any two poi nts in Dublin can be comple t ed with no more then t wo inte rshychanges and often with ze ro or one
bull Three interchanges is the max imum needed to travel between any two points but in practice t hat situation affects a very small number of trips
Key Strategies The table on this page shows four key strategies ident ishyfied to address the major issues w ith the current network These strategies are described in detail on the following pages
JARRETT WALKER+ ASSOCIATES Dublin Area Bus Network Rodosign I 5 Public Consultation Report - Summary
ABUS EVERY 10 MINUTES MAXIMUM ON OVER 30 BUS ROUTES BETWEEN6 AM AND 9 PM WEEKDAYS
- Maal l h121h
~ MaallhlWh
c(-- MaN1114hl21h
Strategy 1 Clearer Service Categories Strategy 1 is t o develop a clearer set of service cat egories to which all services wo uld be assigned
Service categories mark clear dis t inctions in usefulness For example they clearly distinguish frequent services from infrequent o nes and peak -o nly services from all shyday services These categories improve t he clari t y of the network and ca n form the basis for clearer mapping and pub lic informati on
A key idea is that the network of higher frequency sershyvices (every 15 minutes or better) should be easy to identify because these serv ices are so usef u l for a diver shysity of purposes
Strategy 2 Simplify Radial Services Using Spines Figures 6 and 7 show a sc hematic of the existing and proshyposed radial networks
In the existing system most radial corridors are served by a pile of overlapping lines each of w hich goes to a different corridor on the opposite side of t he ci ty This provides direct se rvice between many places but each of the indiv idual routes is not ve ry fr equent so wai t times are long
The proposed strategy would put just a single line called a spine on each radial corridor but would run this service very frequently Service would come every 4 t o 8 minutes all day so that the next bus is coming whenshyever you need it This also means you could change from any spine to any other with little delay so that trips across the city would still be easy Ag ain total travel times are faster because the wa iting time saved by the high freshyquency is greater t han the t ime spent on the interchange
Figure 6 Montreal Canada presents a simple map of just its high frequency services so that people can see where they can go without waiting long
JARRETT WALKER+ ASSOCIATES
gtshy~ lt( lE lE gt V)
Figure 7 Existing Network Multiple lines from each corridor cross the City Centre in different directions
Figure 8 Proposed Network Each corridor has a single frequent line crossing the City Centre on a single path
Dublin Area Bus Network Redesign I 6 Public Consultation Report - Summary
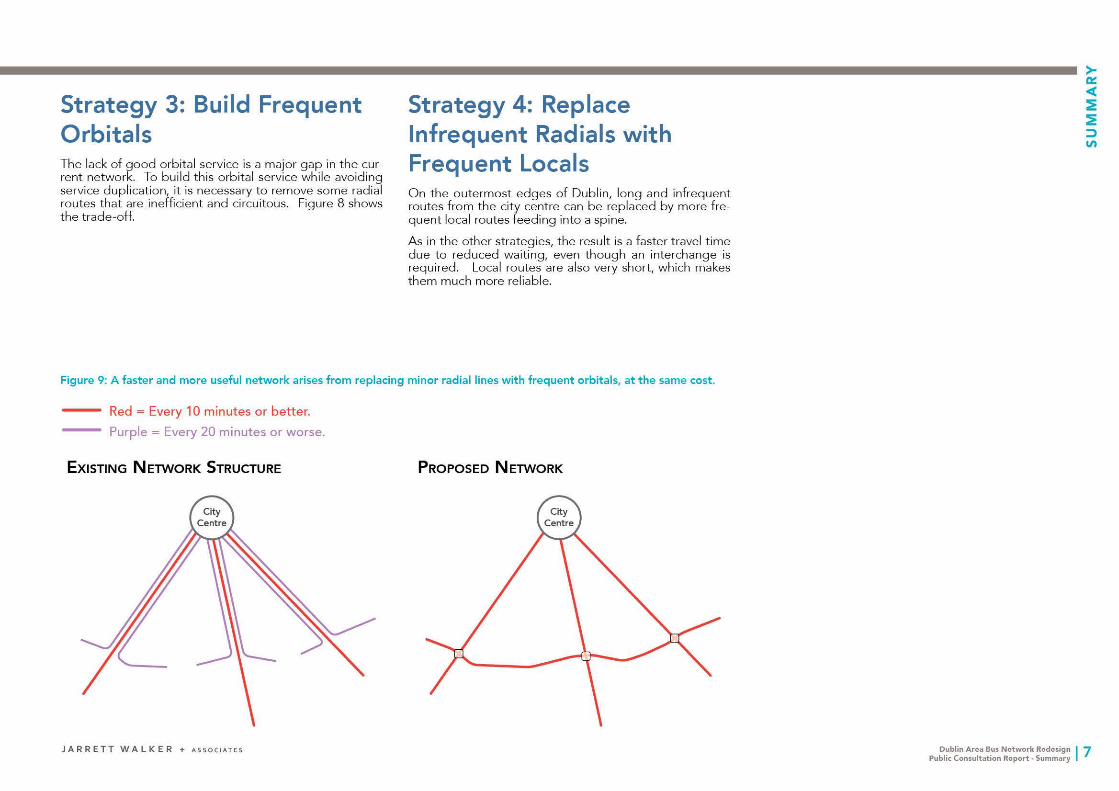
Strategy 3 Build Frequent Orbitals The lack of good orbi t al service is a major gap in the cu rshyrent network To bu i ld this orbita l service while avoiding service duplication it is necessa ry to remove some rad ial routes tha t are inefficien t and ci rcuitous Figure 8 shows the trade -off
Strategy 4 Replace Infrequent Radials with Frequent Locals On the o utermos t edges of Dublin long and infrequent routes from the city cen t re can be replaced by more fre shyquent local routes feeding into a spine
As in t he other strategies the resul t is a fa ster t ravel time due to reduced waiting even though an interchange is required Local routes are also very short which makes t hem m uch more reliable
Figure 9 A faster and more useful network arises from replacing minor radial lines with frequent orbitals at the same cost
Red= Every 10 minutes or better
Purple = Every 20 minutes or worse
EXISTING NETWORK STRUCTURE PROPOSED NETWORK
JARRETT WALKER+ ASSOCI ATES Dublin Aroa Bus Network Redesign I7 Public Consultation Report - Summ ary
- -
Public Response to the Strate gies Was Overwhelmin gly Favourable
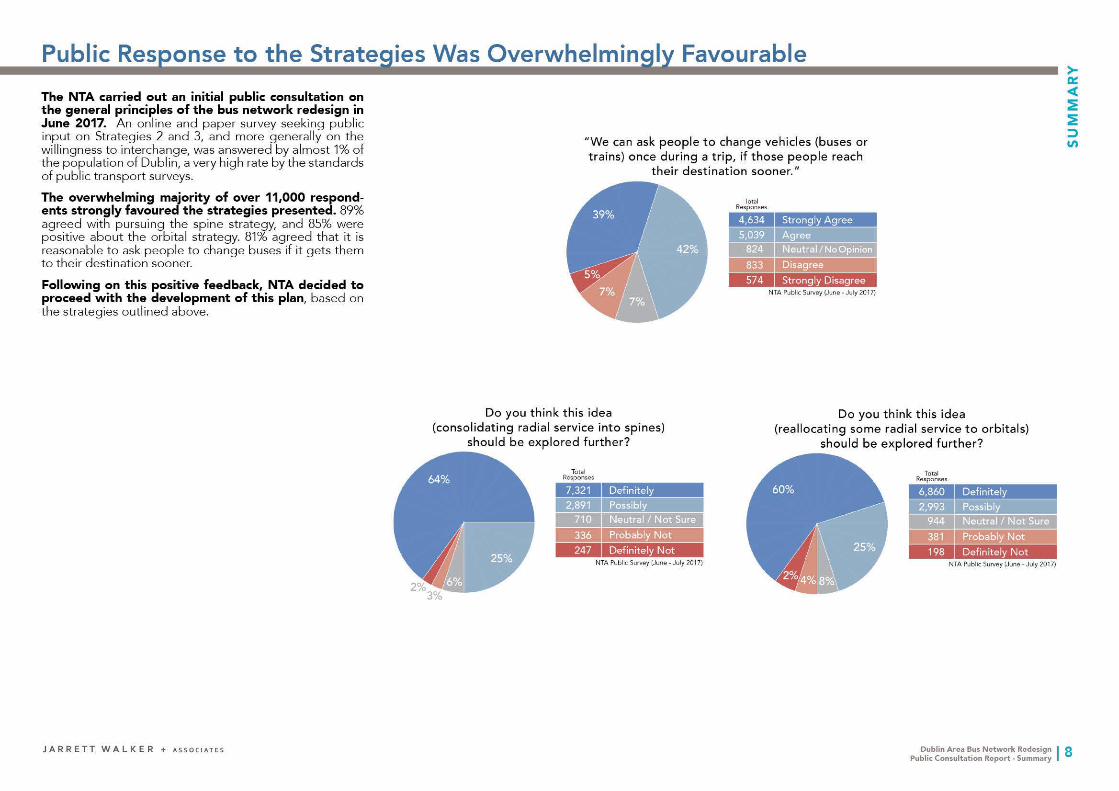
The NTA carried out an initial public consultation on the general principles of the bus network redesign in June 2017 An online and paper survey seeking public inpu t on Strategies 2 and 3 and more generally on the willingness to inte rchange was answered by almost 1 of the populati o n of Dublin a very high rate by the st andards of public transport surveys
The overwhelming majority of over 11000 respondshyents strongly favoured the strategies presented 89 agreed with pursuing the spine stra tegy and 85 we re positive about the orbi tal strategy 81 ag re ed tha t it is reasonable to ask people to change buses if it gets the m to their des tinatio n sooner
Following on this positive feedproceed with the development the strategies outlined above
back of th
NTA decided is plan based
to on
We can ask people to change vehicles (buses or trains ) once during a trip if those peopl e reach
their destination sooner
Do you think this idea (consolidating radial service into spin es)
should be explored further
7321 Definitely
ll 2891LI Possibly
710L Neutral Not Sure
336 ProbablyProbably NotNot
247 DefinitelyDefinitely NotNot
Tota l Respons es
MyenGIStrongly Agree
- -
Strongly Disagree NTA Publlc Survey (June bull July 20 17)
Do you t hink th is idea (reallo cati ng some radial ser vice to orbitals)
should be ex plored further
I
Total Responses -
Definitely Not NTA Public Survey June - July 2017)
JARRETT WALKER+ A SSOC IATE S Dublin Area Bus Network Redesign I 8 Public Consultation Report - Summary
Very high frequency spine-- Every 5 minutes or better
High frequency spine~ Every 6 - 75 minutes
---e- Every 75 minu tes
---e-- Every 10 - 15 minutes
----()-- Every 20 - 25 minutes
-Cl)- Every 30 m inutes
-fm- Every 40 minu tes
-G)- Every 60 minutes
Combined lines with -((Elraquo-better resulting frequency
Line continues at low er -CiHD-
-frequency
Multiple lines and frequencies
Primary Interchange D or Terminus
~ Line ends at Prim ary LJlilmLJInterchange or Terminus
- a End of line
The Proposed Network gtshya ~ E V)
The t wo following pages show a big -picture look at the exis ti ng and proposed network These provide a general illustration of the network but are not meant to be legible in detai l The complete network report features detailed maps of every par t of Dublin
Subsequent pages illus t rate t wo of the netwo rks most important big ideas the crea tion of very fr equent spines and the sign ificant expansion of the networ k of frequent routes
To read most maps in this report note t hat red is used to indicate high frequency service every 15 minu t es or better all day Th ick red is used for very high frequency every 8 minutes or better and dark red is used for ex t reme ly h igh frequency every 5 min utes or better O t her colours indi shycate lower frequencies as shown below 1
bull
Figure 10 Legend of colours used on the Network Map
1 Furth ermore due to the extreme complexity of the existing networ k we have om itte d peak -only services and a small number of routes that operate very infreque nt ly less than every 60 minutes in the middle of the day These are existing routes 406 416 47 56a 65 161 220 and 239
JARRETT WALKER+ ASSOCI ATES
The Big Ideas The proposed network builds o n the four strategies described above t hrough t he following ac t ions
bull Spines A-G would extend across the city provid shying very high frequency ru nning through from a corridor on one side of t he city to one on the other side
bull A complete set of orbital lines would be added so that far more trips can be made without going into the centre These orbi tals serve many tr ips that are almost impossible today in any reasonable amount of t ime such as from Blanchardstown to Lucan
bull The all -day frequent network (red lines) would be much expanded The number of people and jobs on t he frequent network rises by about 13 from about 750000 today to almost 1 million unde r t he plan
bull The frequent network would become a webshyshaped grid with many interchange opportunities to reach more destinations Everywhe re that two red lines cross a fast interchange is possible Todays network provides few of these high-frequency inte rshychanges ou t side of the centre The proposed network introduces many of them all over the city
bull More routes would converge on major suburban centres - such as Tallaght Dun Laoghaire Liffey Valley and Blanchardst own - inc reasing local access and interchange opportunities at each centre NTA would wo rk with local governments to plan suitable capaci t y expansions for these facilities
bull Travel within the city centre (between the canals) would become easier The proposed network pro shyvides t he ex t reme frequency that these short trips require and offers many new direct links within this area A very frequen t inner orbita l (Line 0) also makes it easier to tr ave l to and from major destinat ions on the edges of the centre
bull Additional service would be provided at peak hour s to limit overcrowding Th e proposed network features additional peak-hour frequencies on most routes and also includes several peak -only routes to meet extremely high demand at specif ic hours t o locations such as the City Cen t re or Univers ity College Dubl in
Key Assumptions At the direction of NTA t he plan is built on the following assumpt ions
bull Fare penalties for interchanging are removed A passengers fare would not depend on whet her an interchange is required No second fare would be required upo n boarding a second vehicle A paral lel BusConnects p lanning effort is work ing to ach ieve this
bull Rail frequencies are increased in 2019 including 10-minute frequen cy all day on DART between Howth Junction and Bray per current NTA plans
bull Reliability continues to improve through added bus lanes and ot he r tools that reduce disruption and delay th at will be developed under the paral lel BusConnects project on speed and reliab ility
bull Adequate shelters and information are found at every interchange stop and any walk required for the interchange is safe efficient and short As part of implementation NTA would work wi th the local governmen ts to improve stop locat ions and pedest rian facilities as needed to ensu re easy con shynections between major lines
bull Key interchange facilities can be developed and expanded as needed The plan requires only one entirely new interchange located at Liffey Valley Shopping Centre on the nor th perimeter roadway adjacent to the pedestrian bridge to the bus stops o n the N4 nati onal road Several other inte rchanges (eg in Tallaght and at Blanchardstown) wo uld need modest expansion
Dublin Aroa Bus Network Redesign I 9 Public Consultation Report - Summary
--
J
f
I
I-(l)
Existin Network Bi Picture 7
Figure 11 Map of the existing public transport network showing weekday midday frequencies
euro11)
A larger version of this map is available to download on ww w busconnectsie
f
JARRETT WALKER+ ASSOCIATES Dublin Area Bus Network Redesign I 1Q Public Consultation Report - Summary
Pro osed Network Bi Picture shy
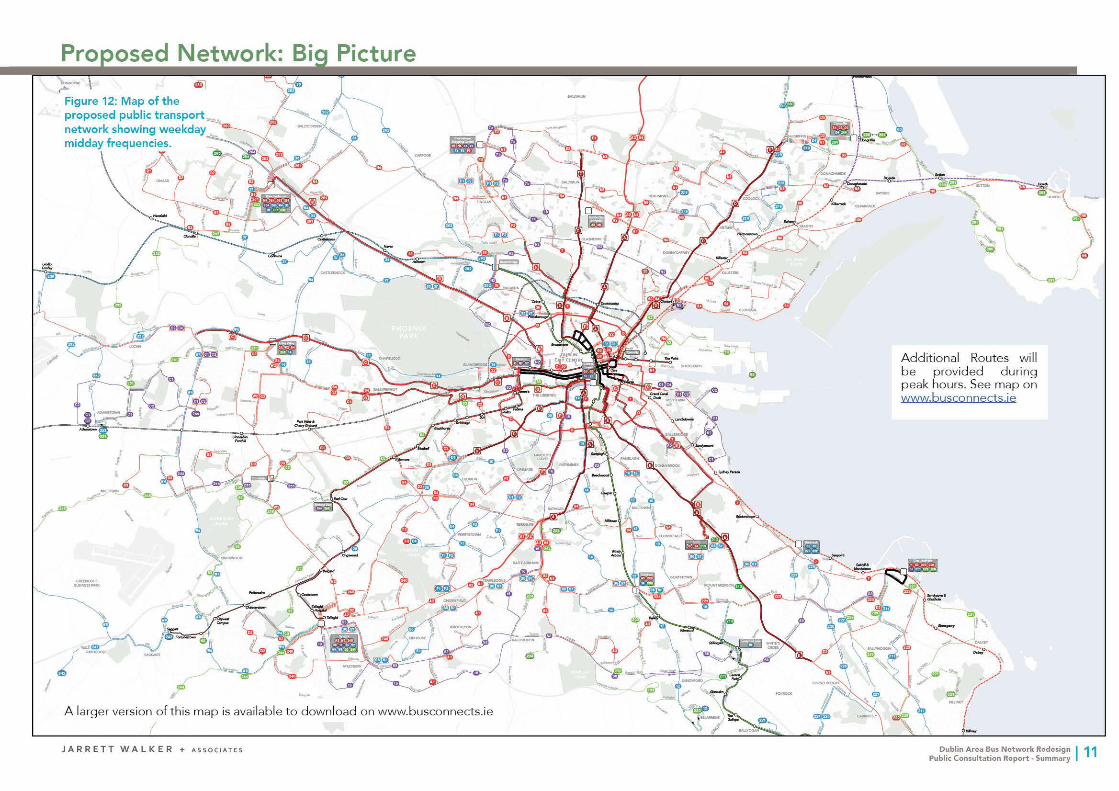
Figure 12 Map of the proposed public transport network showing weekday midday frequencies
Additional Routes w ill be provided during peak hours See map on wwwbusconnects ie
0
_flJ
i
A larger version of t his map is avai lable to down load on ww wbusconnectsie
JARRETT WALKER+ ASSOCI ATES Dublin Aroa Bus Network Redesign I 11 Public Consultation Report - Summary
________ P_r_o e o se_d_ N_etw_ o_r_k_ Big_ P_i_ctu_re ____ gt-~
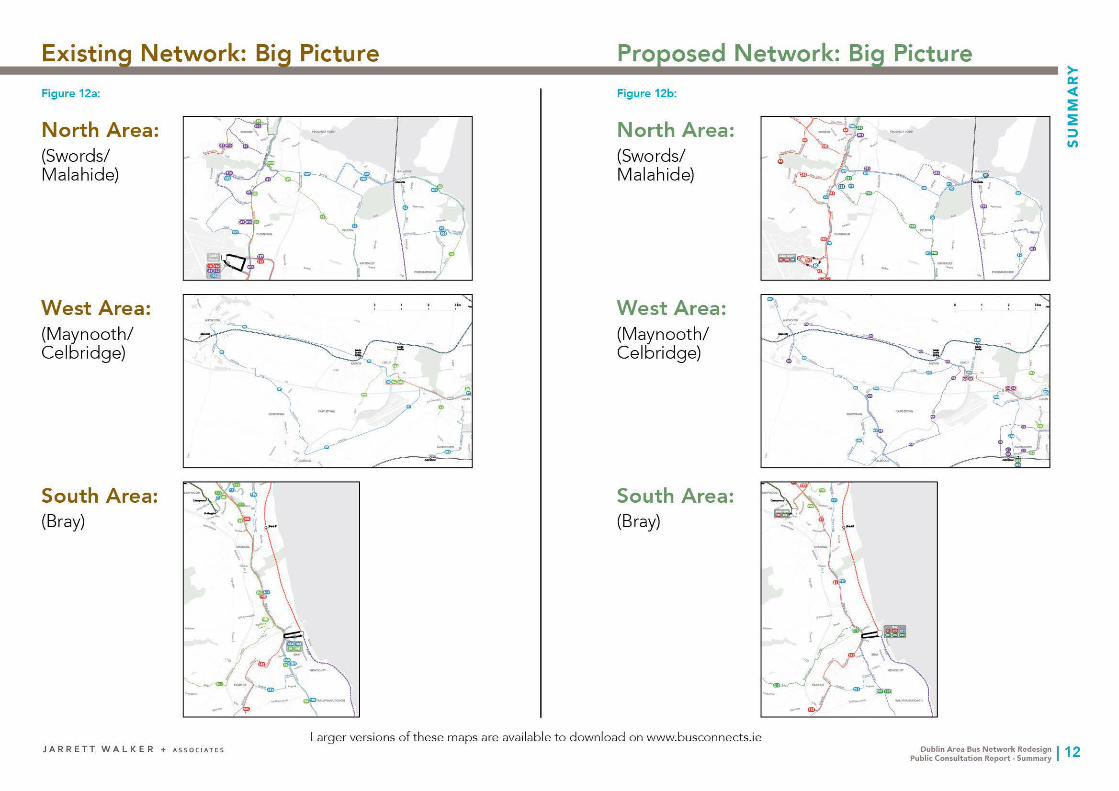
Figure 12b lt(
E Egt V)
North Area (Swords Malahide)
West Area (Maynooth Ce I bridge)
South Area (Bray)
Larger versions o f t hese maps are available t o do w nload o n www busc o nne ctsie JARRETT WALKER+ ASSOCIATES Dublin Area Bus Network Redesign I 12
Public Consultation Report - Summary
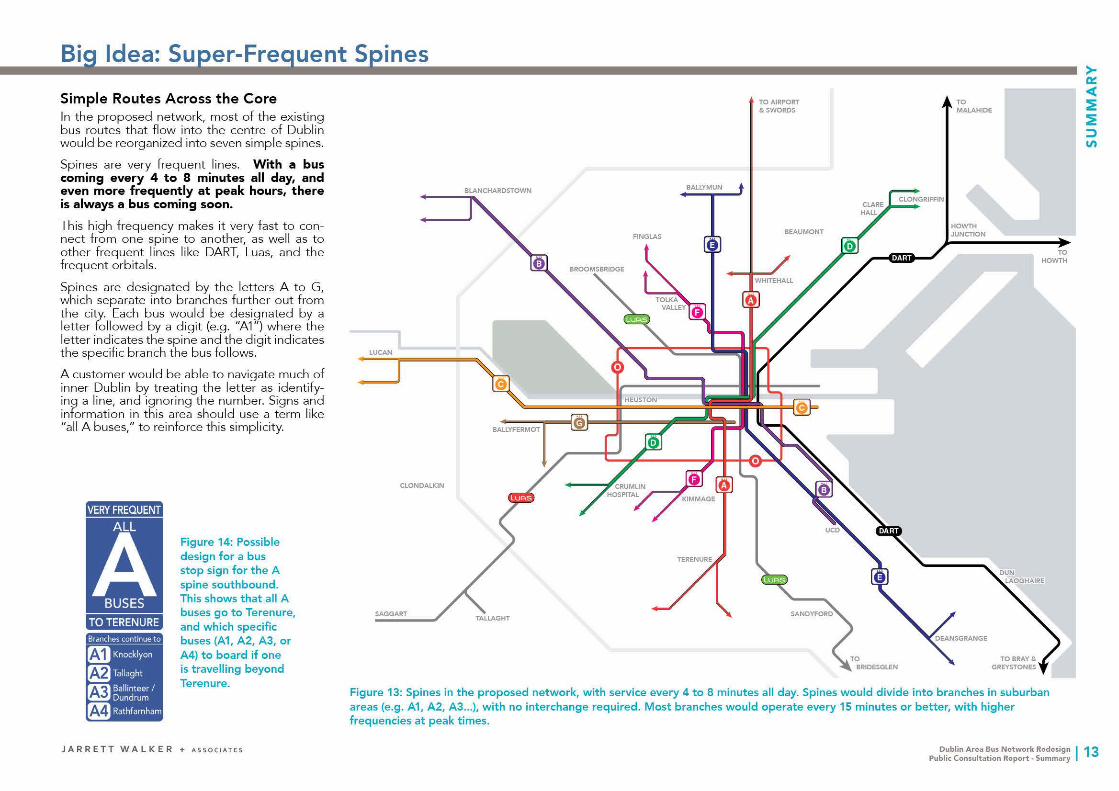
Big Idea Super-Fre quent Spines
Simple Routes Across the Core TOAJRPORT TO amp SWORDS MALAHIDE
In the proposed ne twork most of the ex isting bus routes t hat flow into the centre of Dublin would be reorganized into seven simple spines
Sp ines are very frequent lines With a bus coming every 4 to 8 minutes all day and even more frequently at peak hours there is always a bus coming soon
This high frequency makes it very fas t to con shynect from one spine to another as well as to other frequent lines like DART Luas and the frequent orbi tals
Sp ines are designated by the letters A to G which separate into branches further out from the city Each bus would be designated by a letter followed by a digit (eg A1 ) where the lett er indicates the spine and the digit indicates the specific branch the bus follows LUCAN
A customer would be able to navigate much of inner Dublin by treating the letter as identify shying a line and ignor ing the number Signs and information in t his area should use a term like all A buses to reinforce this simplicity
Figure 14 Possible design for a bus stop sign for the A spine southbound This shows that all A buses go to Terenure SAGGART
and which specific buses (A1 A2 A3 or A4) to board if one is travelling beyond Terenure
Figure 13 Spines in the proposed network with service every 4 to 8 minutes all day Spines would divide into branches in suburban areas (eg A1 A2 A3 ) with no interchange required Most branches would operate every 15 minutes or better with higher frequencies at peak times
JARRETT WALKER+ ASSOCI ATES Dublin Aroa Bus Network Redesign I 13 Public Consultation Report - Summary
BAUYFERMOT
BALLYMUN
BEAUMONT
TO BRIDESGLEN
HOWTH JUNCTION
TO HOWTH
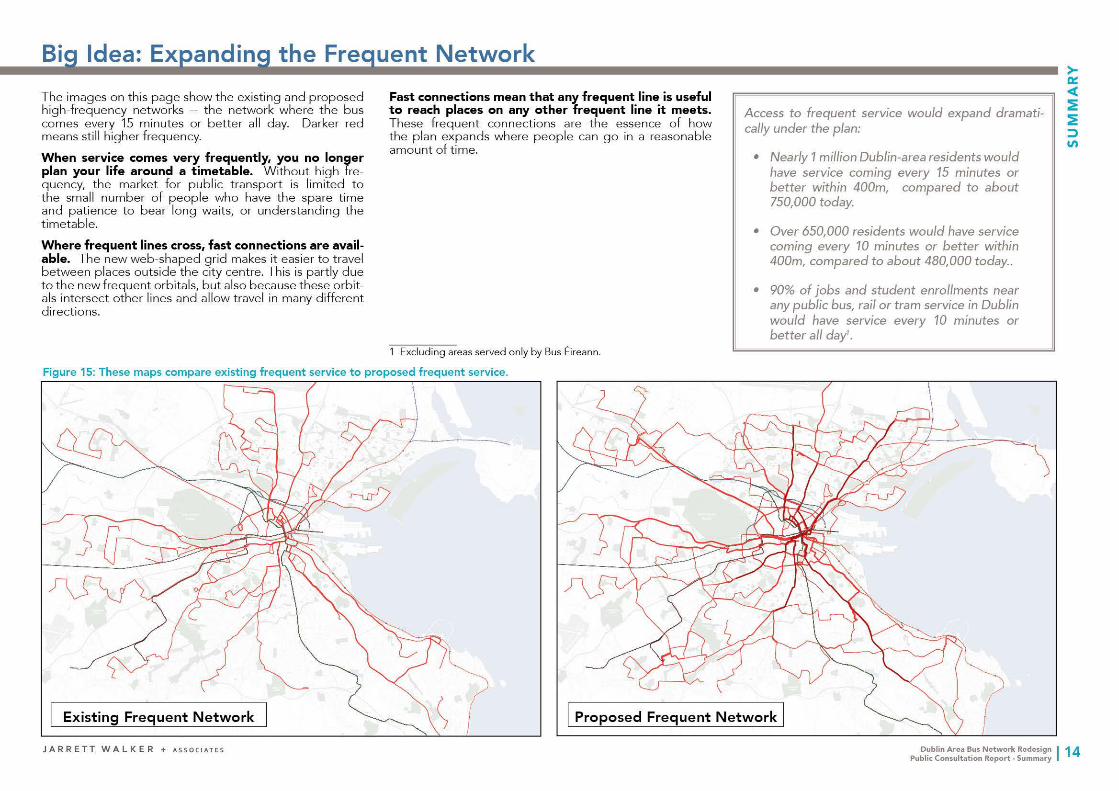
Big Idea Expanding the Frequent Network
The images on this page show the existing and proposed high -frequen cy networks -- the network where the b us comes every 15 minutes or better all day Darker red means still higher freque ncy
When service comes very frequently you no longer plan your life around a timetable Wi t hout high fre shyquency the marke t for public transport is limited to the small number of people who have the spare t ime and patience to bear long wa its or understanding the timetable
Where frequent lines cross fast connections are availshyable The new web -shaped grid makes it easier to trave l between places outside the c it y centre This is partly due to t he new frequent orbitals but also because these orbit shyals intersect other lines and a llow t ravel in many different directions
Fast connections mean that any frequent line is useful to reach places on any other frequent line it meets These frequent connect ions are the essence of how the plan expands whe re people can go in a reasonable amoun t of time
Access to frequent service would expand dramatishycally under the plan
bull Nearly 1 million Dublin-area residents would have service coming every 15 minutes or better within 400m compared to about 750000 today
bull Over 650000 residents would have service coming every 10 minutes or better within 400m compared to about 480000 today
bull 90 of jobs and student enrollments near any public bus rail or tram service in Dublin would have service every 10 minutes or better all day1
1 Excluding areas served only by Bus Eireann
Figure 15 These maps compare existing frequent service to proposed frequent service
Existing Frequent Network I Proposed Frequent Network I
JARRETT WALKER+ A SSOC IATES Dublin Area Bus Network Redesign I 14 Public Consultation Report - Summary
If you cant go places you cant do many things Your freedom to pursue lifes opportunities depends on your transport opt ions
If the goal is for publ ic transport to car ry more people thus limiting congestion and enha ncing sustainabili t y and prosperity t he best way to do that is to make public t rans shypor t more usefu l and t hus mo re liberating
The image across shows an example of what this means from the point of view of someone at the south end of Finglas In this image purple is the area that someshyone can reach today in 45 minutes or less and could still reach under the plan Red is the area they could no longer reach in that t ime Blue is t he area that they cant reach now but could reach in the new network There is clea r ly far more blue than red which is true across almost all of t he city
In t he upper left of the image we quan t ify this impact For someone living at this loca t ion 40 more j obs can be reac hed in 45 minutes For a business at this locat ion 57 more reside nts (customers or employees) can reach t hem in 45 minutes
The plan would dramatically increase the range of places Dubliners can reach in a short amount of time On average
bull Dubliners within the canals could reach 20 more jobs and 18 more residents in 30 minutes or less by walking and public transport
bull Those in the inner suburbs (between the canals and the M50) could access 24 more jobs and 26 more residents in 30 minutes or less
bull Those beyond the M50 could reach 26 more jobs and 31 more residents in 45 minutes or less
JARRETT WALKER+ ASSOCI ATES
How far can I tra vel in 45 minutes
from Finglas Village on
weekdays at 12 pm bull
Figure 16 45bullminute isochrone from Finglas Village
Dublin Aroa Bus Network Redesign I 15 Public Consultation Report - Summ ary
Absolute ch11t19e n number of ]Obs
and Uflll8f$ lty S1udent s acces sble li t
MOGWE
1200 from cente r of each hexagon
4XgtOOor less ~ILCLONF
-60000 to -JOCXXl -KLCLOON
-30000 to -15000 --1 5000 to -3000
-3000 -to +3000
--~tQWTH + 3000 to +15000
+l SOCOto +3000)
+JOIXX) to +60000
+ 60(X)() or mOfe
How Far Can You Go In t he course of developing the proposed network t he NTA and consul t ant team t racked how many jobs and stu shyde nt enrolments could be reached within 20 30 45 and 60 minutes of any area
Other activities such as shopping and social opportuni shyties are harder to measure but an improvement in access to jobs is a signal tha t access to those activi t ies will improve as well
The map across shows how the number of j obs that can be reached in 45 m inutes changes from any part of Dublin Green means that the number increases and darker green means a bigge r increase Brown indicates a decrease in the number of jobs tha t can be reached
No te that
bull The impact is overwhelmingly positive The few zones where the number of jobs that can be reached goes down are mos t ly sparsely popu lated ~ or specia l cases such as Chapelizod Village where the existing system provides far more se rvice than the village by itself can support
bull The positive impact happens all over Dublin and is generally higher in suburban areas This is largely due to the expansion in orbital services and higher frequencies for local suburban services
Next Steps This report launches a public consultation occurring during the summer of 2018 All Dubliners are encouraged to review the proposed network and submit their commen ts
bull Further informatio n o n the plan including the com shyplete report and detailed maps can be found at www busconnects ie
bull Let us know what you think We invi t e submissio ns through an online survey at wwwbusconnects ie
Submissions and public comment will guide final decisio ns about the plan which could then be implemented as early as late 2019 Remember this plan is not inevitable
JARRETT WALKER+ ASSOC I ATES
ilUVOCAN
STaASI DE
GLENCUuEN
25 5 km
Figure 17 Map showing the change in number of jobs accessible within 45 minutes at midday
The NTA has proposed this fol lowing overwhelm ingly posit ive feedback on the general princip les but needs to hear from you to proceed further
If you agree this would be an improvement for Dublin its important to speak up And if you dont like the plan please let the NTA know how it can be improved
Dublin Area Bus Network Redesign I 16 Public Consultation Report - Summary
Udaras Naisiunta lompair National Transpo rt Aut hority
Nati o nal Transpo rt A uth o rit y Du n Sce in e Harco urt Lane Du b lin 2 D02 W T20
wwwbusconnectsie Project Ireland 2040 Email co nsu lt ati o ns(lt0bu sco nn ec t sie BuildingIrelandsFuture
BusConnects Summary - Jarret Walker Document A4 Final for Web
BusConnects Summary - Jarret Walker Document A4 Final for Web2
BusConnects Summary - Jarret Walker Document A4 Final for Web3
BusConnects Summary - Jarret Walker Document A4 Final for Web4
BusConnects Summary - Jarret Walker Document A4 Final for Web5
BusConnects Summary - Jarret Walker Document A4 Final for Web6
BusConnects Summary - Jarret Walker Document A4 Final for Web7
BusConnects Summary - Jarret Walker Document A4 Final for Web8
BusConnects Summary - Jarret Walker Document A4 Final for Web9
BusConnects Summary - Jarret Walker Document A4 Final for Web10
BusConnects Summary - Jarret Walker Document A4 Final for Web11
BusConnects Summary - Jarret Walker Document A4 Final for Web12
BusConnects Summary - Jarret Walker Document A4 Final for Web13
BusConnects Summary - Jarret Walker Document A4 Final for Web14
BusConnects Summary - Jarret Walker Document A4 Final for Web15
BusConnects Summary - Jarret Walker Document A4 Final for Web16
BusConnects Summary - Jarret Walker Document A4 Final for Web17
BusConnects Summary - Jarret Walker Document A4 Final for Web18
BusConnects Summary - Jarret Walker Document A4 Final for Web19
BusConnects Summary - Jarret Walker Document A4 Final for Web20
Summary
JARRETT WALKER+ ASSOCIATES Dublin Aroa Bus Network Redesign Public Consultation Report - Summary
11
Figure 2 How the bus network redesign fits into the bigger picture of transportation in the Dublin region
Transport Strategy of the Greater Dublin Region 2016-2035
Rail [ Cycling ] [ Walking ] [ Roads
BusConnects Program
Bus Network Fare Po licy Faste r and More Redesign Project Change s and Reliable Service
Cashles s Ticket ing
Dublin Area Bus Network Redesign Study
Cho ices Report Recommended June 20 17 Network
Improved Bus Service is Essential for the Continued Prosperit y of Dublin
Dublin can only grow and prosper if the role of public trans shyport dramatical ly expands 1 Any o ther option will strangle the city with traffi c congestion because in a dense cit y there is simply not enough room for everyones car
The National Transport Au t hority is making numero us impr ove men t s t o public t ra nspor t The bus element of this effort called BusConnects includes three paralle l strands of act ivity
bull Infrastructure and bus priority measures such as new bus lanes to exped ite the flow of buses through Dublin
bull Improvements to fares and ticketing including ma king it possible to interchange without paying an add itional fare
bull A redesign of the bus network - the pattern of routes and schedules that buses follow
This report is about the recommended bus network redesign It represents the culmination of a year -and shya-ha lf long effort of study analysis cons ultation and iterative thinking to develop a new network design for Dublins buses
1 Cycling also plays an important complementary role to public trans shyport Wh ile there is a large overlap in the role of the two modes t hey are useful in diffe rent situations Cycling is more competitive for shorter trips and publ ic transp ort for longer ones That s why the Transport Strategy of t he Greater Dublin Region includes a cycling ele shyment as we ll public transport elements such as BusConnects of wh ich this study is a part
JARRETT WALKER+ ASSOC IATES
Figure 1 Road space required to move the same number of people using public transport bicycles and cars bull
Photo Credit middot (c) We Ride Australia
July 2018
Dublin Area Bus Network Redesign I2 Public Consultation Report - Summary
0 nix Park ary Road rn d Zoo)
Blackhall Place Four Mayor Spencer The Point
Museum Courts Square Dock lim 25a25b~ middot ffi Abbey St
-1==1~ ~ ~ imfm
~J rnJl= t=im=t~25a25b emm e1oo ril North Wall
0 ml [Ifill Grand Canal Dock
0Rmgsend Road
Christchurch Thomas W rillim Street
Rialto Tram Stop
ins The Coombe
0
Why Rethink the Bus Network gt-
Changing a bus network is always controversial Existi ng bull cus t o mers are used to the bus routes as they are and some may be unhappy with any change to their routine
However NTA has also received many commen ts asking for a more useful network and in fact the ne t work has obvious problems t hat only a redesign can repair
bull The network is very complex which makes it ha rd to remember and thus to use spontaneously You can remember a bus route you t ake every day b ut if yo u wan t to fee l free to move about the city you need to be able to reme mber the structure of a network just as most people remember the st ructu re o f the street netwo rk
bull The network is good for many radial trips - taking people into Dublins core - but not for orbital trips For example a trip from Blanchardstown t o Lucan or from DCU to t he Malahide Road usually requires going into the city centre and back out which takes tar too long and puts more buses into crowded city streets tha n need t o be there
bull Many routes overlap for long distances While lots o f buses go down some streets they are not evenly spaced to create the m os t frequent possible service
Figure 3 The three main types of public transport line are called radials orbitals and feeders
City Centre
Radial L Interchange
po int
Rail and tram network improvements require changes to the bus services Buses trams and trains are not competi t ors They are meant to wor k together to crea te the most useful possible ne t work Rail and tram upgrades (such as the rece nt Luas Green Line extensi o n and the planned frequency impr ove shyment on DART) the refore change the role that buses should play in the affected areas
0
bull The city is growing and changing in ways that the c( bus network must adap t to serve New communities and j ob centres are appearing on the fringe while the C ity Cen tre continues to grow denser especially gt in and near the Dockla nds v
All of these factors tell us that while any change in bus routes wi ll raise objections it is time to cons ider a sub shystantial redesign
Figure 4 The city centre network is so complex that it is impossible to draw a clear map of it A more useful network would have fewer overlapping routes but those routes would run much more frequently so that they are coming whenever you need them
JARRETT WALKER+ ASSOCIATES Dublin Area Bus Network Rodosign I 3 Public Consultation Report - Summary
Define Project Goal and Limits
Geometric Princip les of Analyse Demographics and Analyse Exist ing Net work High-Patronage Design Land Use Inefficiencies
Recommend ed Des ign Strategies
Choice Report
Public Consultation on Choices and Strategies
Analyse Travel Time Core Design Workshop to Outcomes Deve lop All-Day Plan
Refine Plan
Analyse Outcomes
Figure 5 Project steps to the Recommended Plan
Core Design Worksho p t o Refine Peak-Only Service
Refined Plan
Final Analysis
Recommended Plan
How the Plan Was Developed gtshy
Whats Included This proposed redesign ca n be implemented as soon as 2019 However it is mean t to set up a net wor k that w ill endure wit h minor adjus tmen t s for ma ny yea rs into t he future
This plan deals only w ith the bus se rvices co nt racted by t he NTA that opera te primarily within th e Dub lin M etr opo litan Are a Al l of these services are currently run by Dublin Bus th o ugh ap pr oximately 10 will soon be run by a new ope rshyator Go -A head Ireland following their successful bid in a recen t tend er compe t it ion
For profit services - including all Airp or t express services and the Swo rds Express service - are not covered by t he plan Ser vices provided by Bus Eireann including com shymuter services int o the Dublin area from neighbouring counties are also not included
To Increase Patronage Make Service Useful and Liberating The goal of the pr opos ed network is to make public trans shyport useful to mo re peop le to reach more destina ti ons all over Du b lin
Dubliners have already shown t hat the y use public tr ansshyport w hen it is useful But th ere are m any purposes for which t he service is no t useful and thi s is wha t the plan aims to change
Later in this summary we quant ify t his expans ion of use shyfulness For example under the proposed network the average Dubliner can access 18 more jobs and schools within 30 minutes 1 compared to the existing system
1 Technica lly the measu re here is the change in the numbe r of jobs and the number of enrol led stude nt s at pos t-seco nd ary colleges and universities within 30 minutes by walking and publ ic transport
JARRETT WALKER+ ASSOC IATES
How the Plan Was Developed Figure 5 shows how the p lan was developed
The Choices Rep ort released in June 2017 shared the consu lt ant t eams analysis of the existing situation and described several high -level strategies that could guide a network redesign
The public was asked to com ment on the se stra te gies to guide us on whet her and how stro ng ly to pursue the m Based on the very positive response to the str ateg ies NTA choose to proceed
In Ju ly 2017 the consultant tea m facili t ate d a t wo -week intensive retreat with NTA Dublin Bus and local gov shyernment officials T he pr oposed ne two rk was designed collaborat ively t o about 80 comp letion in these worksho ps
a The plan t hen went through furt her cycles of iteration lt( includ ing an additional workshop focused on the peak - ~ only services leading to the final recommendation ~ presented in thi s rep ort
VI During the workshops we repeatedly che cked how the new ne twork would improve w her e people could get to quickly and used th at feedback to continuous ly improve the des ign
Dublin Area Bus Network Redesign I 4 Public Consultation Report - Summary
Changing Buses Can Get You There Faster
The plan is based on a geometric principle that sounds wrong when people first hear it A network that assumes you are willing to change buses can often get you to your destination sooner
In t he pr opos ed network some trips t hat are now di rect will require changing buses but because the frequency is so much higher waiting time is reduced so much that the total t rip is faster
While a tolerance of interchange is thus an essential fea shy
service Complexity ~ ow frequency Buses in City
Centre
STANDARDIZE SERVICE 1 CATEGORIES
Yes Categories make planning
effi c ient services easier
Yes Frequency and span are
apparent from the category withshyou t look ing at
timetables
Yes Service catshyegories make
frequencies pre shyd ictable and cons istent
Yes Categor ies make planning
eff icient serv ices easier reducing excess bus trips
Yes Consolidating
2 SIMPLIFY RADIAL
SERVICE
Yes Releasesresources fororbital use
Yes Vast reducshytion of complexity especially in City
Centre
Yes Much h ig her frequency fo r
travel to from and thro ugh the City
Centre
service to the cen shytre on fe wer routes means frequency can be optimized reducing surplus
trips
BUILD FREQUENT3 ORBITALSYes
Yes The intersec shytion of frequent
orbi t als and radials produce a pat shy
tern that is easy to grasp
Yes Inc reased orbital fr equency
Yes Fewer pas shysenger tr ip s are forced through
City Centre reducing loads
GROW SUBURBAN 4 FEEDER NETWORKS
Yes Improves market for bo t h
orbital and radial se rvices to regional centres
Yes Fewer over shylapping rou tes in
suburban markets
Yes Improved local frequency fo r travel with in sub shy
urban area
Yes Feeder ne tshyworks support
consolidating sershyvice to City Centre
o n fewer routes
ture t here is still an inconvenience Thus t he proposed net work seeks to minimize the number of cases where multiple interchanges are requ ired to complete a t rip Under t he pla n
bull Within the MSO almost all of Dublin still has direct se rshyvice to the cit y centre
bull All of Dublin is no more than one interchange away from the City Ce ntre
bull Wi th few except ions trips between any two poi nts in Dublin can be comple t ed with no more then t wo inte rshychanges and often with ze ro or one
bull Three interchanges is the max imum needed to travel between any two points but in practice t hat situation affects a very small number of trips
Key Strategies The table on this page shows four key strategies ident ishyfied to address the major issues w ith the current network These strategies are described in detail on the following pages
JARRETT WALKER+ ASSOCIATES Dublin Area Bus Network Rodosign I 5 Public Consultation Report - Summary
ABUS EVERY 10 MINUTES MAXIMUM ON OVER 30 BUS ROUTES BETWEEN6 AM AND 9 PM WEEKDAYS
- Maal l h121h
~ MaallhlWh
c(-- MaN1114hl21h
Strategy 1 Clearer Service Categories Strategy 1 is t o develop a clearer set of service cat egories to which all services wo uld be assigned
Service categories mark clear dis t inctions in usefulness For example they clearly distinguish frequent services from infrequent o nes and peak -o nly services from all shyday services These categories improve t he clari t y of the network and ca n form the basis for clearer mapping and pub lic informati on
A key idea is that the network of higher frequency sershyvices (every 15 minutes or better) should be easy to identify because these serv ices are so usef u l for a diver shysity of purposes
Strategy 2 Simplify Radial Services Using Spines Figures 6 and 7 show a sc hematic of the existing and proshyposed radial networks
In the existing system most radial corridors are served by a pile of overlapping lines each of w hich goes to a different corridor on the opposite side of t he ci ty This provides direct se rvice between many places but each of the indiv idual routes is not ve ry fr equent so wai t times are long
The proposed strategy would put just a single line called a spine on each radial corridor but would run this service very frequently Service would come every 4 t o 8 minutes all day so that the next bus is coming whenshyever you need it This also means you could change from any spine to any other with little delay so that trips across the city would still be easy Ag ain total travel times are faster because the wa iting time saved by the high freshyquency is greater t han the t ime spent on the interchange
Figure 6 Montreal Canada presents a simple map of just its high frequency services so that people can see where they can go without waiting long
JARRETT WALKER+ ASSOCIATES
gtshy~ lt( lE lE gt V)
Figure 7 Existing Network Multiple lines from each corridor cross the City Centre in different directions
Figure 8 Proposed Network Each corridor has a single frequent line crossing the City Centre on a single path
Dublin Area Bus Network Redesign I 6 Public Consultation Report - Summary
Strategy 3 Build Frequent Orbitals The lack of good orbi t al service is a major gap in the cu rshyrent network To bu i ld this orbita l service while avoiding service duplication it is necessa ry to remove some rad ial routes tha t are inefficien t and ci rcuitous Figure 8 shows the trade -off
Strategy 4 Replace Infrequent Radials with Frequent Locals On the o utermos t edges of Dublin long and infrequent routes from the city cen t re can be replaced by more fre shyquent local routes feeding into a spine
As in t he other strategies the resul t is a fa ster t ravel time due to reduced waiting even though an interchange is required Local routes are also very short which makes t hem m uch more reliable
Figure 9 A faster and more useful network arises from replacing minor radial lines with frequent orbitals at the same cost
Red= Every 10 minutes or better
Purple = Every 20 minutes or worse
EXISTING NETWORK STRUCTURE PROPOSED NETWORK
JARRETT WALKER+ ASSOCI ATES Dublin Aroa Bus Network Redesign I7 Public Consultation Report - Summ ary
- -
Public Response to the Strate gies Was Overwhelmin gly Favourable
The NTA carried out an initial public consultation on the general principles of the bus network redesign in June 2017 An online and paper survey seeking public inpu t on Strategies 2 and 3 and more generally on the willingness to inte rchange was answered by almost 1 of the populati o n of Dublin a very high rate by the st andards of public transport surveys
The overwhelming majority of over 11000 respondshyents strongly favoured the strategies presented 89 agreed with pursuing the spine stra tegy and 85 we re positive about the orbi tal strategy 81 ag re ed tha t it is reasonable to ask people to change buses if it gets the m to their des tinatio n sooner
Following on this positive feedproceed with the development the strategies outlined above
back of th
NTA decided is plan based
to on
We can ask people to change vehicles (buses or trains ) once during a trip if those peopl e reach
their destination sooner
Do you think this idea (consolidating radial service into spin es)
should be explored further
7321 Definitely
ll 2891LI Possibly
710L Neutral Not Sure
336 ProbablyProbably NotNot
247 DefinitelyDefinitely NotNot
Tota l Respons es
MyenGIStrongly Agree
- -
Strongly Disagree NTA Publlc Survey (June bull July 20 17)
Do you t hink th is idea (reallo cati ng some radial ser vice to orbitals)
should be ex plored further
I
Total Responses -
Definitely Not NTA Public Survey June - July 2017)
JARRETT WALKER+ A SSOC IATE S Dublin Area Bus Network Redesign I 8 Public Consultation Report - Summary
Very high frequency spine-- Every 5 minutes or better
High frequency spine~ Every 6 - 75 minutes
---e- Every 75 minu tes
---e-- Every 10 - 15 minutes
----()-- Every 20 - 25 minutes
-Cl)- Every 30 m inutes
-fm- Every 40 minu tes
-G)- Every 60 minutes
Combined lines with -((Elraquo-better resulting frequency
Line continues at low er -CiHD-
-frequency
Multiple lines and frequencies
Primary Interchange D or Terminus
~ Line ends at Prim ary LJlilmLJInterchange or Terminus
- a End of line
The Proposed Network gtshya ~ E V)
The t wo following pages show a big -picture look at the exis ti ng and proposed network These provide a general illustration of the network but are not meant to be legible in detai l The complete network report features detailed maps of every par t of Dublin
Subsequent pages illus t rate t wo of the netwo rks most important big ideas the crea tion of very fr equent spines and the sign ificant expansion of the networ k of frequent routes
To read most maps in this report note t hat red is used to indicate high frequency service every 15 minu t es or better all day Th ick red is used for very high frequency every 8 minutes or better and dark red is used for ex t reme ly h igh frequency every 5 min utes or better O t her colours indi shycate lower frequencies as shown below 1
bull
Figure 10 Legend of colours used on the Network Map
1 Furth ermore due to the extreme complexity of the existing networ k we have om itte d peak -only services and a small number of routes that operate very infreque nt ly less than every 60 minutes in the middle of the day These are existing routes 406 416 47 56a 65 161 220 and 239
JARRETT WALKER+ ASSOCI ATES
The Big Ideas The proposed network builds o n the four strategies described above t hrough t he following ac t ions
bull Spines A-G would extend across the city provid shying very high frequency ru nning through from a corridor on one side of t he city to one on the other side
bull A complete set of orbital lines would be added so that far more trips can be made without going into the centre These orbi tals serve many tr ips that are almost impossible today in any reasonable amount of t ime such as from Blanchardstown to Lucan
bull The all -day frequent network (red lines) would be much expanded The number of people and jobs on t he frequent network rises by about 13 from about 750000 today to almost 1 million unde r t he plan
bull The frequent network would become a webshyshaped grid with many interchange opportunities to reach more destinations Everywhe re that two red lines cross a fast interchange is possible Todays network provides few of these high-frequency inte rshychanges ou t side of the centre The proposed network introduces many of them all over the city
bull More routes would converge on major suburban centres - such as Tallaght Dun Laoghaire Liffey Valley and Blanchardst own - inc reasing local access and interchange opportunities at each centre NTA would wo rk with local governments to plan suitable capaci t y expansions for these facilities
bull Travel within the city centre (between the canals) would become easier The proposed network pro shyvides t he ex t reme frequency that these short trips require and offers many new direct links within this area A very frequen t inner orbita l (Line 0) also makes it easier to tr ave l to and from major destinat ions on the edges of the centre
bull Additional service would be provided at peak hour s to limit overcrowding Th e proposed network features additional peak-hour frequencies on most routes and also includes several peak -only routes to meet extremely high demand at specif ic hours t o locations such as the City Cen t re or Univers ity College Dubl in
Key Assumptions At the direction of NTA t he plan is built on the following assumpt ions
bull Fare penalties for interchanging are removed A passengers fare would not depend on whet her an interchange is required No second fare would be required upo n boarding a second vehicle A paral lel BusConnects p lanning effort is work ing to ach ieve this
bull Rail frequencies are increased in 2019 including 10-minute frequen cy all day on DART between Howth Junction and Bray per current NTA plans
bull Reliability continues to improve through added bus lanes and ot he r tools that reduce disruption and delay th at will be developed under the paral lel BusConnects project on speed and reliab ility
bull Adequate shelters and information are found at every interchange stop and any walk required for the interchange is safe efficient and short As part of implementation NTA would work wi th the local governmen ts to improve stop locat ions and pedest rian facilities as needed to ensu re easy con shynections between major lines
bull Key interchange facilities can be developed and expanded as needed The plan requires only one entirely new interchange located at Liffey Valley Shopping Centre on the nor th perimeter roadway adjacent to the pedestrian bridge to the bus stops o n the N4 nati onal road Several other inte rchanges (eg in Tallaght and at Blanchardstown) wo uld need modest expansion
Dublin Aroa Bus Network Redesign I 9 Public Consultation Report - Summary
--
J
f
I
I-(l)
Existin Network Bi Picture 7
Figure 11 Map of the existing public transport network showing weekday midday frequencies
euro11)
A larger version of this map is available to download on ww w busconnectsie
f
JARRETT WALKER+ ASSOCIATES Dublin Area Bus Network Redesign I 1Q Public Consultation Report - Summary
Pro osed Network Bi Picture shy
Figure 12 Map of the proposed public transport network showing weekday midday frequencies
Additional Routes w ill be provided during peak hours See map on wwwbusconnects ie
0
_flJ
i
A larger version of t his map is avai lable to down load on ww wbusconnectsie
JARRETT WALKER+ ASSOCI ATES Dublin Aroa Bus Network Redesign I 11 Public Consultation Report - Summary
________ P_r_o e o se_d_ N_etw_ o_r_k_ Big_ P_i_ctu_re ____ gt-~
Figure 12b lt(
E Egt V)
North Area (Swords Malahide)
West Area (Maynooth Ce I bridge)
South Area (Bray)
Larger versions o f t hese maps are available t o do w nload o n www busc o nne ctsie JARRETT WALKER+ ASSOCIATES Dublin Area Bus Network Redesign I 12
Public Consultation Report - Summary
Big Idea Super-Fre quent Spines
Simple Routes Across the Core TOAJRPORT TO amp SWORDS MALAHIDE
In the proposed ne twork most of the ex isting bus routes t hat flow into the centre of Dublin would be reorganized into seven simple spines
Sp ines are very frequent lines With a bus coming every 4 to 8 minutes all day and even more frequently at peak hours there is always a bus coming soon
This high frequency makes it very fas t to con shynect from one spine to another as well as to other frequent lines like DART Luas and the frequent orbi tals
Sp ines are designated by the letters A to G which separate into branches further out from the city Each bus would be designated by a letter followed by a digit (eg A1 ) where the lett er indicates the spine and the digit indicates the specific branch the bus follows LUCAN
A customer would be able to navigate much of inner Dublin by treating the letter as identify shying a line and ignor ing the number Signs and information in t his area should use a term like all A buses to reinforce this simplicity
Figure 14 Possible design for a bus stop sign for the A spine southbound This shows that all A buses go to Terenure SAGGART
and which specific buses (A1 A2 A3 or A4) to board if one is travelling beyond Terenure
Figure 13 Spines in the proposed network with service every 4 to 8 minutes all day Spines would divide into branches in suburban areas (eg A1 A2 A3 ) with no interchange required Most branches would operate every 15 minutes or better with higher frequencies at peak times
JARRETT WALKER+ ASSOCI ATES Dublin Aroa Bus Network Redesign I 13 Public Consultation Report - Summary
BAUYFERMOT
BALLYMUN
BEAUMONT
TO BRIDESGLEN
HOWTH JUNCTION
TO HOWTH
Big Idea Expanding the Frequent Network
The images on this page show the existing and proposed high -frequen cy networks -- the network where the b us comes every 15 minutes or better all day Darker red means still higher freque ncy
When service comes very frequently you no longer plan your life around a timetable Wi t hout high fre shyquency the marke t for public transport is limited to the small number of people who have the spare t ime and patience to bear long wa its or understanding the timetable
Where frequent lines cross fast connections are availshyable The new web -shaped grid makes it easier to trave l between places outside the c it y centre This is partly due to t he new frequent orbitals but also because these orbit shyals intersect other lines and a llow t ravel in many different directions
Fast connections mean that any frequent line is useful to reach places on any other frequent line it meets These frequent connect ions are the essence of how the plan expands whe re people can go in a reasonable amoun t of time
Access to frequent service would expand dramatishycally under the plan
bull Nearly 1 million Dublin-area residents would have service coming every 15 minutes or better within 400m compared to about 750000 today
bull Over 650000 residents would have service coming every 10 minutes or better within 400m compared to about 480000 today
bull 90 of jobs and student enrollments near any public bus rail or tram service in Dublin would have service every 10 minutes or better all day1
1 Excluding areas served only by Bus Eireann
Figure 15 These maps compare existing frequent service to proposed frequent service
Existing Frequent Network I Proposed Frequent Network I
JARRETT WALKER+ A SSOC IATES Dublin Area Bus Network Redesign I 14 Public Consultation Report - Summary
If you cant go places you cant do many things Your freedom to pursue lifes opportunities depends on your transport opt ions
If the goal is for publ ic transport to car ry more people thus limiting congestion and enha ncing sustainabili t y and prosperity t he best way to do that is to make public t rans shypor t more usefu l and t hus mo re liberating
The image across shows an example of what this means from the point of view of someone at the south end of Finglas In this image purple is the area that someshyone can reach today in 45 minutes or less and could still reach under the plan Red is the area they could no longer reach in that t ime Blue is t he area that they cant reach now but could reach in the new network There is clea r ly far more blue than red which is true across almost all of t he city
In t he upper left of the image we quan t ify this impact For someone living at this loca t ion 40 more j obs can be reac hed in 45 minutes For a business at this locat ion 57 more reside nts (customers or employees) can reach t hem in 45 minutes
The plan would dramatically increase the range of places Dubliners can reach in a short amount of time On average
bull Dubliners within the canals could reach 20 more jobs and 18 more residents in 30 minutes or less by walking and public transport
bull Those in the inner suburbs (between the canals and the M50) could access 24 more jobs and 26 more residents in 30 minutes or less
bull Those beyond the M50 could reach 26 more jobs and 31 more residents in 45 minutes or less
JARRETT WALKER+ ASSOCI ATES
How far can I tra vel in 45 minutes
from Finglas Village on
weekdays at 12 pm bull
Figure 16 45bullminute isochrone from Finglas Village
Dublin Aroa Bus Network Redesign I 15 Public Consultation Report - Summ ary
Absolute ch11t19e n number of ]Obs
and Uflll8f$ lty S1udent s acces sble li t
MOGWE
1200 from cente r of each hexagon
4XgtOOor less ~ILCLONF
-60000 to -JOCXXl -KLCLOON
-30000 to -15000 --1 5000 to -3000
-3000 -to +3000
--~tQWTH + 3000 to +15000
+l SOCOto +3000)
+JOIXX) to +60000
+ 60(X)() or mOfe
How Far Can You Go In t he course of developing the proposed network t he NTA and consul t ant team t racked how many jobs and stu shyde nt enrolments could be reached within 20 30 45 and 60 minutes of any area
Other activities such as shopping and social opportuni shyties are harder to measure but an improvement in access to jobs is a signal tha t access to those activi t ies will improve as well
The map across shows how the number of j obs that can be reached in 45 m inutes changes from any part of Dublin Green means that the number increases and darker green means a bigge r increase Brown indicates a decrease in the number of jobs tha t can be reached
No te that
bull The impact is overwhelmingly positive The few zones where the number of jobs that can be reached goes down are mos t ly sparsely popu lated ~ or specia l cases such as Chapelizod Village where the existing system provides far more se rvice than the village by itself can support
bull The positive impact happens all over Dublin and is generally higher in suburban areas This is largely due to the expansion in orbital services and higher frequencies for local suburban services
Next Steps This report launches a public consultation occurring during the summer of 2018 All Dubliners are encouraged to review the proposed network and submit their commen ts
bull Further informatio n o n the plan including the com shyplete report and detailed maps can be found at www busconnects ie
bull Let us know what you think We invi t e submissio ns through an online survey at wwwbusconnects ie
Submissions and public comment will guide final decisio ns about the plan which could then be implemented as early as late 2019 Remember this plan is not inevitable
JARRETT WALKER+ ASSOC I ATES
ilUVOCAN
STaASI DE
GLENCUuEN
25 5 km
Figure 17 Map showing the change in number of jobs accessible within 45 minutes at midday
The NTA has proposed this fol lowing overwhelm ingly posit ive feedback on the general princip les but needs to hear from you to proceed further
If you agree this would be an improvement for Dublin its important to speak up And if you dont like the plan please let the NTA know how it can be improved
Dublin Area Bus Network Redesign I 16 Public Consultation Report - Summary
Udaras Naisiunta lompair National Transpo rt Aut hority
Nati o nal Transpo rt A uth o rit y Du n Sce in e Harco urt Lane Du b lin 2 D02 W T20
wwwbusconnectsie Project Ireland 2040 Email co nsu lt ati o ns(lt0bu sco nn ec t sie BuildingIrelandsFuture
BusConnects Summary - Jarret Walker Document A4 Final for Web
BusConnects Summary - Jarret Walker Document A4 Final for Web2
BusConnects Summary - Jarret Walker Document A4 Final for Web3
BusConnects Summary - Jarret Walker Document A4 Final for Web4
BusConnects Summary - Jarret Walker Document A4 Final for Web5
BusConnects Summary - Jarret Walker Document A4 Final for Web6
BusConnects Summary - Jarret Walker Document A4 Final for Web7
BusConnects Summary - Jarret Walker Document A4 Final for Web8
BusConnects Summary - Jarret Walker Document A4 Final for Web9
BusConnects Summary - Jarret Walker Document A4 Final for Web10
BusConnects Summary - Jarret Walker Document A4 Final for Web11
BusConnects Summary - Jarret Walker Document A4 Final for Web12
BusConnects Summary - Jarret Walker Document A4 Final for Web13
BusConnects Summary - Jarret Walker Document A4 Final for Web14
BusConnects Summary - Jarret Walker Document A4 Final for Web15
BusConnects Summary - Jarret Walker Document A4 Final for Web16
BusConnects Summary - Jarret Walker Document A4 Final for Web17
BusConnects Summary - Jarret Walker Document A4 Final for Web18
BusConnects Summary - Jarret Walker Document A4 Final for Web19
BusConnects Summary - Jarret Walker Document A4 Final for Web20
- -
Public Response to the Strate gies Was Overwhelmin gly Favourable
The NTA carried out an initial public consultation on the general principles of the bus network redesign in June 2017 An online and paper survey seeking public inpu t on Strategies 2 and 3 and more generally on the willingness to inte rchange was answered by almost 1 of the populati o n of Dublin a very high rate by the st andards of public transport surveys
The overwhelming majority of over 11000 respondshyents strongly favoured the strategies presented 89 agreed with pursuing the spine stra tegy and 85 we re positive about the orbi tal strategy 81 ag re ed tha t it is reasonable to ask people to change buses if it gets the m to their des tinatio n sooner
Following on this positive feedproceed with the development the strategies outlined above
back of th
NTA decided is plan based
to on
We can ask people to change vehicles (buses or trains ) once during a trip if those peopl e reach
their destination sooner
Do you think this idea (consolidating radial service into spin es)
should be explored further
7321 Definitely
ll 2891LI Possibly
710L Neutral Not Sure
336 ProbablyProbably NotNot
247 DefinitelyDefinitely NotNot
Tota l Respons es
MyenGIStrongly Agree
- -
Strongly Disagree NTA Publlc Survey (June bull July 20 17)
Do you t hink th is idea (reallo cati ng some radial ser vice to orbitals)
should be ex plored further
I
Total Responses -
Definitely Not NTA Public Survey June - July 2017)
JARRETT WALKER+ A SSOC IATE S Dublin Area Bus Network Redesign I 8 Public Consultation Report - Summary
Very high frequency spine-- Every 5 minutes or better
High frequency spine~ Every 6 - 75 minutes
---e- Every 75 minu tes
---e-- Every 10 - 15 minutes
----()-- Every 20 - 25 minutes
-Cl)- Every 30 m inutes
-fm- Every 40 minu tes
-G)- Every 60 minutes
Combined lines with -((Elraquo-better resulting frequency
Line continues at low er -CiHD-
-frequency
Multiple lines and frequencies
Primary Interchange D or Terminus
~ Line ends at Prim ary LJlilmLJInterchange or Terminus
- a End of line
The Proposed Network gtshya ~ E V)
The t wo following pages show a big -picture look at the exis ti ng and proposed network These provide a general illustration of the network but are not meant to be legible in detai l The complete network report features detailed maps of every par t of Dublin
Subsequent pages illus t rate t wo of the netwo rks most important big ideas the crea tion of very fr equent spines and the sign ificant expansion of the networ k of frequent routes
To read most maps in this report note t hat red is used to indicate high frequency service every 15 minu t es or better all day Th ick red is used for very high frequency every 8 minutes or better and dark red is used for ex t reme ly h igh frequency every 5 min utes or better O t her colours indi shycate lower frequencies as shown below 1
bull
Figure 10 Legend of colours used on the Network Map
1 Furth ermore due to the extreme complexity of the existing networ k we have om itte d peak -only services and a small number of routes that operate very infreque nt ly less than every 60 minutes in the middle of the day These are existing routes 406 416 47 56a 65 161 220 and 239
JARRETT WALKER+ ASSOCI ATES
The Big Ideas The proposed network builds o n the four strategies described above t hrough t he following ac t ions
bull Spines A-G would extend across the city provid shying very high frequency ru nning through from a corridor on one side of t he city to one on the other side
bull A complete set of orbital lines would be added so that far more trips can be made without going into the centre These orbi tals serve many tr ips that are almost impossible today in any reasonable amount of t ime such as from Blanchardstown to Lucan
bull The all -day frequent network (red lines) would be much expanded The number of people and jobs on t he frequent network rises by about 13 from about 750000 today to almost 1 million unde r t he plan
bull The frequent network would become a webshyshaped grid with many interchange opportunities to reach more destinations Everywhe re that two red lines cross a fast interchange is possible Todays network provides few of these high-frequency inte rshychanges ou t side of the centre The proposed network introduces many of them all over the city
bull More routes would converge on major suburban centres - such as Tallaght Dun Laoghaire Liffey Valley and Blanchardst own - inc reasing local access and interchange opportunities at each centre NTA would wo rk with local governments to plan suitable capaci t y expansions for these facilities
bull Travel within the city centre (between the canals) would become easier The proposed network pro shyvides t he ex t reme frequency that these short trips require and offers many new direct links within this area A very frequen t inner orbita l (Line 0) also makes it easier to tr ave l to and from major destinat ions on the edges of the centre
bull Additional service would be provided at peak hour s to limit overcrowding Th e proposed network features additional peak-hour frequencies on most routes and also includes several peak -only routes to meet extremely high demand at specif ic hours t o locations such as the City Cen t re or Univers ity College Dubl in
Key Assumptions At the direction of NTA t he plan is built on the following assumpt ions
bull Fare penalties for interchanging are removed A passengers fare would not depend on whet her an interchange is required No second fare would be required upo n boarding a second vehicle A paral lel BusConnects p lanning effort is work ing to ach ieve this
bull Rail frequencies are increased in 2019 including 10-minute frequen cy all day on DART between Howth Junction and Bray per current NTA plans
bull Reliability continues to improve through added bus lanes and ot he r tools that reduce disruption and delay th at will be developed under the paral lel BusConnects project on speed and reliab ility
bull Adequate shelters and information are found at every interchange stop and any walk required for the interchange is safe efficient and short As part of implementation NTA would work wi th the local governmen ts to improve stop locat ions and pedest rian facilities as needed to ensu re easy con shynections between major lines
bull Key interchange facilities can be developed and expanded as needed The plan requires only one entirely new interchange located at Liffey Valley Shopping Centre on the nor th perimeter roadway adjacent to the pedestrian bridge to the bus stops o n the N4 nati onal road Several other inte rchanges (eg in Tallaght and at Blanchardstown) wo uld need modest expansion
Dublin Aroa Bus Network Redesign I 9 Public Consultation Report - Summary
--
J
f
I
I-(l)
Existin Network Bi Picture 7
Figure 11 Map of the existing public transport network showing weekday midday frequencies
euro11)
A larger version of this map is available to download on ww w busconnectsie
f
JARRETT WALKER+ ASSOCIATES Dublin Area Bus Network Redesign I 1Q Public Consultation Report - Summary
Pro osed Network Bi Picture shy
Figure 12 Map of the proposed public transport network showing weekday midday frequencies
Additional Routes w ill be provided during peak hours See map on wwwbusconnects ie
0
_flJ
i
A larger version of t his map is avai lable to down load on ww wbusconnectsie
JARRETT WALKER+ ASSOCI ATES Dublin Aroa Bus Network Redesign I 11 Public Consultation Report - Summary
________ P_r_o e o se_d_ N_etw_ o_r_k_ Big_ P_i_ctu_re ____ gt-~
Figure 12b lt(
E Egt V)
North Area (Swords Malahide)
West Area (Maynooth Ce I bridge)
South Area (Bray)
Larger versions o f t hese maps are available t o do w nload o n www busc o nne ctsie JARRETT WALKER+ ASSOCIATES Dublin Area Bus Network Redesign I 12
Public Consultation Report - Summary
Big Idea Super-Fre quent Spines
Simple Routes Across the Core TOAJRPORT TO amp SWORDS MALAHIDE
In the proposed ne twork most of the ex isting bus routes t hat flow into the centre of Dublin would be reorganized into seven simple spines
Sp ines are very frequent lines With a bus coming every 4 to 8 minutes all day and even more frequently at peak hours there is always a bus coming soon
This high frequency makes it very fas t to con shynect from one spine to another as well as to other frequent lines like DART Luas and the frequent orbi tals
Sp ines are designated by the letters A to G which separate into branches further out from the city Each bus would be designated by a letter followed by a digit (eg A1 ) where the lett er indicates the spine and the digit indicates the specific branch the bus follows LUCAN
A customer would be able to navigate much of inner Dublin by treating the letter as identify shying a line and ignor ing the number Signs and information in t his area should use a term like all A buses to reinforce this simplicity
Figure 14 Possible design for a bus stop sign for the A spine southbound This shows that all A buses go to Terenure SAGGART
and which specific buses (A1 A2 A3 or A4) to board if one is travelling beyond Terenure
Figure 13 Spines in the proposed network with service every 4 to 8 minutes all day Spines would divide into branches in suburban areas (eg A1 A2 A3 ) with no interchange required Most branches would operate every 15 minutes or better with higher frequencies at peak times
JARRETT WALKER+ ASSOCI ATES Dublin Aroa Bus Network Redesign I 13 Public Consultation Report - Summary
BAUYFERMOT
BALLYMUN
BEAUMONT
TO BRIDESGLEN
HOWTH JUNCTION
TO HOWTH
Big Idea Expanding the Frequent Network
The images on this page show the existing and proposed high -frequen cy networks -- the network where the b us comes every 15 minutes or better all day Darker red means still higher freque ncy
When service comes very frequently you no longer plan your life around a timetable Wi t hout high fre shyquency the marke t for public transport is limited to the small number of people who have the spare t ime and patience to bear long wa its or understanding the timetable
Where frequent lines cross fast connections are availshyable The new web -shaped grid makes it easier to trave l between places outside the c it y centre This is partly due to t he new frequent orbitals but also because these orbit shyals intersect other lines and a llow t ravel in many different directions
Fast connections mean that any frequent line is useful to reach places on any other frequent line it meets These frequent connect ions are the essence of how the plan expands whe re people can go in a reasonable amoun t of time
Access to frequent service would expand dramatishycally under the plan
bull Nearly 1 million Dublin-area residents would have service coming every 15 minutes or better within 400m compared to about 750000 today
bull Over 650000 residents would have service coming every 10 minutes or better within 400m compared to about 480000 today
bull 90 of jobs and student enrollments near any public bus rail or tram service in Dublin would have service every 10 minutes or better all day1
1 Excluding areas served only by Bus Eireann
Figure 15 These maps compare existing frequent service to proposed frequent service
Existing Frequent Network I Proposed Frequent Network I
JARRETT WALKER+ A SSOC IATES Dublin Area Bus Network Redesign I 14 Public Consultation Report - Summary
If you cant go places you cant do many things Your freedom to pursue lifes opportunities depends on your transport opt ions
If the goal is for publ ic transport to car ry more people thus limiting congestion and enha ncing sustainabili t y and prosperity t he best way to do that is to make public t rans shypor t more usefu l and t hus mo re liberating
The image across shows an example of what this means from the point of view of someone at the south end of Finglas In this image purple is the area that someshyone can reach today in 45 minutes or less and could still reach under the plan Red is the area they could no longer reach in that t ime Blue is t he area that they cant reach now but could reach in the new network There is clea r ly far more blue than red which is true across almost all of t he city
In t he upper left of the image we quan t ify this impact For someone living at this loca t ion 40 more j obs can be reac hed in 45 minutes For a business at this locat ion 57 more reside nts (customers or employees) can reach t hem in 45 minutes
The plan would dramatically increase the range of places Dubliners can reach in a short amount of time On average
bull Dubliners within the canals could reach 20 more jobs and 18 more residents in 30 minutes or less by walking and public transport
bull Those in the inner suburbs (between the canals and the M50) could access 24 more jobs and 26 more residents in 30 minutes or less
bull Those beyond the M50 could reach 26 more jobs and 31 more residents in 45 minutes or less
JARRETT WALKER+ ASSOCI ATES
How far can I tra vel in 45 minutes
from Finglas Village on
weekdays at 12 pm bull
Figure 16 45bullminute isochrone from Finglas Village
Dublin Aroa Bus Network Redesign I 15 Public Consultation Report - Summ ary
Absolute ch11t19e n number of ]Obs
and Uflll8f$ lty S1udent s acces sble li t
MOGWE
1200 from cente r of each hexagon
4XgtOOor less ~ILCLONF
-60000 to -JOCXXl -KLCLOON
-30000 to -15000 --1 5000 to -3000
-3000 -to +3000
--~tQWTH + 3000 to +15000
+l SOCOto +3000)
+JOIXX) to +60000
+ 60(X)() or mOfe
How Far Can You Go In t he course of developing the proposed network t he NTA and consul t ant team t racked how many jobs and stu shyde nt enrolments could be reached within 20 30 45 and 60 minutes of any area
Other activities such as shopping and social opportuni shyties are harder to measure but an improvement in access to jobs is a signal tha t access to those activi t ies will improve as well
The map across shows how the number of j obs that can be reached in 45 m inutes changes from any part of Dublin Green means that the number increases and darker green means a bigge r increase Brown indicates a decrease in the number of jobs tha t can be reached
No te that
bull The impact is overwhelmingly positive The few zones where the number of jobs that can be reached goes down are mos t ly sparsely popu lated ~ or specia l cases such as Chapelizod Village where the existing system provides far more se rvice than the village by itself can support
bull The positive impact happens all over Dublin and is generally higher in suburban areas This is largely due to the expansion in orbital services and higher frequencies for local suburban services
Next Steps This report launches a public consultation occurring during the summer of 2018 All Dubliners are encouraged to review the proposed network and submit their commen ts
bull Further informatio n o n the plan including the com shyplete report and detailed maps can be found at www busconnects ie
bull Let us know what you think We invi t e submissio ns through an online survey at wwwbusconnects ie
Submissions and public comment will guide final decisio ns about the plan which could then be implemented as early as late 2019 Remember this plan is not inevitable
JARRETT WALKER+ ASSOC I ATES
ilUVOCAN
STaASI DE
GLENCUuEN
25 5 km
Figure 17 Map showing the change in number of jobs accessible within 45 minutes at midday
The NTA has proposed this fol lowing overwhelm ingly posit ive feedback on the general princip les but needs to hear from you to proceed further
If you agree this would be an improvement for Dublin its important to speak up And if you dont like the plan please let the NTA know how it can be improved
Dublin Area Bus Network Redesign I 16 Public Consultation Report - Summary
Udaras Naisiunta lompair National Transpo rt Aut hority
Nati o nal Transpo rt A uth o rit y Du n Sce in e Harco urt Lane Du b lin 2 D02 W T20
wwwbusconnectsie Project Ireland 2040 Email co nsu lt ati o ns(lt0bu sco nn ec t sie BuildingIrelandsFuture
BusConnects Summary - Jarret Walker Document A4 Final for Web
BusConnects Summary - Jarret Walker Document A4 Final for Web2
BusConnects Summary - Jarret Walker Document A4 Final for Web3
BusConnects Summary - Jarret Walker Document A4 Final for Web4
BusConnects Summary - Jarret Walker Document A4 Final for Web5
BusConnects Summary - Jarret Walker Document A4 Final for Web6
BusConnects Summary - Jarret Walker Document A4 Final for Web7
BusConnects Summary - Jarret Walker Document A4 Final for Web8
BusConnects Summary - Jarret Walker Document A4 Final for Web9
BusConnects Summary - Jarret Walker Document A4 Final for Web10
BusConnects Summary - Jarret Walker Document A4 Final for Web11
BusConnects Summary - Jarret Walker Document A4 Final for Web12
BusConnects Summary - Jarret Walker Document A4 Final for Web13
BusConnects Summary - Jarret Walker Document A4 Final for Web14
BusConnects Summary - Jarret Walker Document A4 Final for Web15
BusConnects Summary - Jarret Walker Document A4 Final for Web16
BusConnects Summary - Jarret Walker Document A4 Final for Web17
BusConnects Summary - Jarret Walker Document A4 Final for Web18
BusConnects Summary - Jarret Walker Document A4 Final for Web19
BusConnects Summary - Jarret Walker Document A4 Final for Web20