SUMMARY AND CRITIQUE OF THE BENEFITS ESTIMATES IN THE RIA FOR THE OZONE NAAQS RECONSIDERATION Final Report Prepared for the American Petroleum Institute Anne E. Smith, Ph.D. Senior Vice President NERA Economic Consu lting 1255 23 rd Street NW Washington, DC 20037 July 22, 2011
Transcript
8/6/2019 Summary and Critique of the Benefits Estimates in the Regulatory Impact Analysis for the Ozone NAAQS Reconside…
Summary and Critique of the Benefits Estimates in the RIA for the Ozone NAAQS Reconsideration
Anne E. SmithNERA Economic Consulting
1255 23rd Street NWWashington, DC 20037-1125
July 22, 2011
Executive Summary
EPA’s statements on health benefits from lowering the Ozone NAAQS grosslymisrepresent what EPA is actually estimating as the potential benefits of reducing public
exposures to ozone. If based on ozone benefits alone, not one of EPA’s estimates of the benefits of reducing ozone to a tighter alternative ozone standard is as large as the costsof attaining that respective ozone standard – all cost more than the ozone benefits theymight provide.
EPA’s estimates of ozone benefits are less than their costs despite the fact that EPA hasnow escalated those benefits by always including benefits due to ozone-related mortality.EPA’s science advisors (CASAC) found no “causal” link established between ozone andmortality during their deliberations, but EPA now presumes, as part of thereconsideration, a causal link between ozone and mortality risk. Despite this change thatis unsupported by CASAC, EPA’s net benefits estimates for ozone standards tighter than
0.075 ppm are all still deeply negative.
The only way EPA finds benefits greater than costs for a tighter ozone standard is to addin health gains from concomitant reductions in PM2.5 that may occur while reducingozone precursors – “co-benefits” that have nothing to do with ozone exposures. Thus,EPA’s claim that tightening the Ozone NAAQS has greater benefits than costs hasnothing to do with reducing risks from ozone. EPA also has inflated the magnitude of these co-benefits as part of the reconsideration through several specious assumptionchanges. The Agency’s inflated co-benefits assumptions during this reconsiderationrepresent a change compared to those assumed in the original Ozone NAAQS reviewending in 2008. Even with both ozone mortality benefits and PM2.5 mortality co-benefits,
a large fraction of EPA’s net benefits estimates are negative.
8/6/2019 Summary and Critique of the Benefits Estimates in the Regulatory Impact Analysis for the Ozone NAAQS Reconside…
In 2008, EPA reduced the Ozone National Ambient Air Quality Standard (NAAQS) from0.08 ppm to 0.075 ppm.1 At the time of the 2008 NAAQS decision, a final RegulatoryImpact Analysis (RIA) was released that estimated costs and benefits of several
alternative NAAQS standards relative to the 0.084 ppm standard (USEPA, 2008,hereafter called the “2008 RIA”). The 2008 RIA analyzed alternative ozone standardlevels of 0.075, 0.070, and 0.065 ppm. In 2010, EPA announced it would bereconsidering the Administrator’s decision to set the standard at 0.075 ppm, and wouldconsider levels in the range of 0.060 to 0.070 ppm. A “Supplemental RIA” was released(USEPA, 2010) that provided “updated” benefits estimates for the three alternativestandards in the original 2008 RIA, and supplemented these with benefits estimates for alternative Ozone NAAQS of 0.060 and 0.055 ppm.
This paper explains the changes in the two versions of the ozone RIA, and provides asummary and critique of EPA’s benefit estimates for the ozone reconsideration. This
paper does not attempt to critique the RIA’s cost estimates, recognizing that others havealready done so. The primary conclusions of this paper are that none of the alternativeozone standards, including the current one of 0.075 ppm, can be justified on the basis of net benefits (i.e., benefits minus costs) being positive. Using EPA’s own estimates in itsSupplemental RIA, ozone-related net benefits are negative by billions of dollars per year.The only way that EPA manages to report positive net benefits requires reliance on “co- benefits” from fine particulate matter (PM2.5) mortality reductions combined with a causalozone-mortality association. Even so, EPA needs to use inflated estimates of both thePM2.5 and ozone mortality risks to generate any of its positive net benefits estimates for any of the alternative Ozone NAAQS considered in the RIA. EPA makes “updates” in itsSupplemental RIA that both inflate and give greater emphasis to the mortality estimates
that are essential to producing positive net benefits estimates. EPA describes theseupdates as “methodological improvements” but the changes that make the key differenceshave no basis in new or improved techniques.
Overview of Changes in the RIA since the 2008 Ozone NAAQS Decision
The ozone reconsideration is supposed to consider only information in the record at thetime of the 2008 NAAQS decision, and hence the Supplemental RIA also should not relyon any new information. Ostensibly, the Supplemental RIA for the ozone reconsiderationwas prepared to provide analysis of alternative standards additional to those that wereanalyzed in the 2008 RIA. However, EPA did also change several important assumptions
when “updating” the RIA for the Ozone NAAQS reconsideration. Although theSupplemental RIA has not relied on any new clinical or epidemiological studies, it has
1 The earlier ozone standard was specified only to the second decimal place, and in practice wasimplemented as if it had been set at 0.084 ppm. I will refer to it as 0.084 ppm hereafter. In both cases,the precise form of the standard was that the fourth highest maximum daily 8-hour average level of ozone was not to exceed these respective concentration levels, when averaged over 3 years.
8/6/2019 Summary and Critique of the Benefits Estimates in the Regulatory Impact Analysis for the Ozone NAAQS Reconside…
changed a number of assumptions that increase the level of the estimated benefits for allof the alternative standards levels, including those that were analyzed in the 2008 RIA:
“These changes reflect the more stringent range of options being proposed by the Administrator. It [sic] also reflects some significant methodological
improvements to air pollution benefits estimation, which EPA has adopted sincethe ozone standard was last promulgated.”
2
One may first wish to ask the question whether changes in benefits estimation methodsshould be allowed in the RIA for the reconsideration, as these too may be deemed “newinformation” relative to that available at the time of the Administrator’s original decision.Answering this legal question is outside the scope of this review. But within the scope of this review is whether these methodological changes can be characterized as“improvements,” as noted by EPA in the quote above. That they are not improvements isexplained below for each of the changes individually.
EPA no longer considers the possibility of no causality for ozone mortality.EPA cites the recommendations of an NAS committee report (NRC, 2008) as its basis for now assuming that ozone mortality associations are causal, and also for no longer givingany weight to the possibility that such associations may not be. This decision supplantsCASAC’s views on the matter, based on the evidence they considered during their 2008review and which they reiterated to EPA as recently as February 2011.3 The 2008 RIAdid report ozone mortality estimates, using the two studies that provide the lower andupper bound in the range of ozone mortality estimates in the Supplemental RIA.However, the Supplemental RIA employs a significantly different stance incommunicating about the ozone mortality portions of its benefits estimates. In the2008 RIA, EPA acknowledged “considerable uncertainty” in the association between
ozone and mortality, lack of knowledge of any underlying mechanisms causing mortality,and the possibility that there was no causal relationship at all in its summary of multiple benefit scenarios.4 In contrast, the Supplemental RIA’s summary statements ignore eventhe possibility that there is no causal ozone-mortality relationship. This has the effect of greatly raising the lower bound of EPA’s benefit estimates because all of theSupplemental RIA benefit summaries treat ozone mortality as certainly causal. The only basis for this substantial shift is the 2008 NAS committee opinion, which was not basedon any studies that resolved the critical uncertainties noted in the 2008 RIA. Also, that2008 NAS opinion remains unsupported by EPA’s CASAC panel today: CASAC re-stated during its 2011 reconsideration deliberations that the presumption of causality for ozone-related mortality was “not ready for prime time.”
2Supplemental RIA, p. S1-1.
3 The NAS report was not released at the time of the 2008 NAAQS decision (and was not in the record for that decision) and thus constitutes new information, in addition to being at odds with CASAC’s past andcurrent views of the evidence available at the time of the 2008 NAAQS decision.
42008 RIA, p. 6-1.
8/6/2019 Summary and Critique of the Benefits Estimates in the Regulatory Impact Analysis for the Ozone NAAQS Reconside…
EPA has included two more ozone multi-city studies.The Supplemental RIA also cites the 2008 NAS committee report to justify now includingtwo additional studies in its benefit calculations for ozone mortality. One might ask whywere these two studies were not considered important enough to incorporate them into
EPA’s 2008 Risk Analysis for ozone, which received CASAC’s review. Nevertheless,their inclusion makes little difference to the RIA results. The ozone mortality estimatesof these two studies (i.e., Schwartz, 2005 and Huang et al ., 2005) fall between theminimum and maximum of the four studies that were used in the 2008 RIA and so their inclusion causes no meaningful change in the RIA results summarized below.
EPA has increased the value of a statistical life (VSL).In the 2008 RIA, EPA used a VSL of $7.9 million (2006$) for benefits in 20205 but uses a2020 VSL of $8.9 million (2006$) in the Supplemental RIA.6 The higher VSL increasesthe mortality estimates for both ozone and PM2.5 by 17% as compared to what they werein the 2008 RIA. EPA refers the reader to Section 5.7 of the proposed NO2 RIA (USEPA,
2009) for its rationale for this change,7 but the discussion in that 2009 document makesEPA’s decision seem purely arbitrary.8 A non-arbitrary, technical rationale for a changein assumption such as this is especially needed in the present situation involving thereconsideration of the ozone standard, given that this change creates inconsistency withthe original RIA benefit estimates. But, even if a technical basis for now applying adifferent VSL could be articulated, one would still have to ask whether it is appropriate toincorporate that altered VSL into documents supporting the reconsideration if thattechnical information was not available to the Administrator at the time of the initial 2008decision. A non-arbitrary, technical rationale for this VSL change is warranted as ageneral matter as well, given that mortality estimates are the largest components of EPA’s benefit estimates in this and almost all other of EPA’s RIAs. Given the relatively
tenuous basis for any choice of VSL, it is difficult to imagine any good reason for makingthis change at this time. Uncertainties in estimating VSL create a range of uncertaintymuch wider than this 17% increase – EPA acknowledges a range of a factor of 10 in itsevidence supporting a VSL assumption.9 Uncertainty and continued debate about
52008 RIA, p. 6-25.
6 Supplemental RIA, p. S2-20.
7Supplemental RIA, p. S3-2.
8 The discussion appears on pp. 5-26 to 5-27 of EPA (2009). In essence, it states that although EPA hasused the lower VSL in all of its benefit analyses since 2004, EPA never changed its official guidance onthe VSL that it published in 2000, which suggested use of the higher VSL. Therefore, EPA has now
decided to revert to the VSL that it was using prior to 2004 supposedly for purposes of consistency (i.e.,“Until updated guidance is available, the Agency determined that a single, peer-reviewed estimateapplied consistently best reflects the SAB-EEAC advice it has received.” p. 5-27, emphasis added). Notonly did this decision in 2009 to revert to an earlier VSL actually create inconsistency with all of EPA’sanalyses since 2004, but EPA also states that its use of the VSL from its 2000 guidance document “doesnot represent final agency policy” (EPA, 2009, footnote 17, p. 5-27).
9 EPA (2009), p. 5-26.
8/6/2019 Summary and Critique of the Benefits Estimates in the Regulatory Impact Analysis for the Ozone NAAQS Reconside…
whether it is more appropriate to assign value to the quantity of life-years lost rather thanto “statistical lives” further widens that range of uncertainty, and further weakens any justification for EPA to suddenly increase the VSL it has been using since 2004.10 Therefore, the change in the VSL assumption cannot be viewed as a necessary“improvement” to the Supplemental RIA. It merely adds confusion for readers of the two
RIAs. For EPA, it provides additional inflation of the mortality benefit estimates that, asI will show below, are critical for EPA in making its case that a tighter Ozone NAAQSwill produce positive net benefits.
EPA has removed thresholds from the concentration-response functions for PM 2.5.
One of the most significant changes in the benefit calculations since the 2008 RIA isEPA’s decision to remove PM2.5 thresholds from the calculation of morbidity andmortality benefits. As explained below, this single change nearly doubles EPA’s 2008estimates of PM2.5 co-benefits. EPA’s stated reason for changing this assumption in theSupplemental RIA is consistency with other RIAs since 2009 that also computed PM2.5
co-benefits.11 Review of the discussions cited by EPA as the basis for making that
methodological change during 2009 finds merely a re-hash of the pre-existinginformation that a no-threshold, linear model provides the best fit to the availableepidemiological data. These data, by definition, extend only as low as the lowestmeasured level in the epidemiological studies. EPA provides no new evidence to supportits new “interpretation” that it should now count benefits for all modeled concentrations,no matter how far they fall below the lowest measured level in any of the statisticalanalyses.12 Like the VSL increase, this change also lacks a technical basis and cannot becharacterized as a “methodological improvement.” But, even if relevant new information providing technical support for this new assumption did exist at the time EPA releasedthe Supplemental RIA, one might still question the appropriateness of including such newinformation in the RIA for the reconsideration of the 2008 Ozone NAAQS decision.
Several other changes from the 2008 RIA made in the Supplemental RIA are notemphasized but listed here for completeness although they have little if any noticeableimpact on estimates:13
EPA changes the estimate of PM2.5 benefits per ton reduced based on a broader geographic area, which the RIA says produces “more reliable and generally larger PM-related benefits estimates.”14
10 See, for example, Sunstein (2004).
11 Supplemental RIA, p. S3-3.
12 See the American Chemistry Council (2009) for a thorough technical critique of EPA’s logic and facts inACC’s comments on the draft Portland Cement RIA.
13Supplemental RIA, p. S3-2 and S3-3.
14 Supplemental RIA, p. S3-3. This change appears to have had little effect on estimates in the 2008 RIA, but a comment is warranted on problems in EPA’s “benefits per ton” method in general, which EPA is
8/6/2019 Summary and Critique of the Benefits Estimates in the Regulatory Impact Analysis for the Ozone NAAQS Reconside…
EPA now bases the range for PM2.5 mortality only on papers by Pope et al . (2002)and Laden et al . (2006) rather than including experts’ opinions from the ExpertElicitation as well. This narrows the range of PM2.5 mortality co-benefits on bothends of the range with little effect on the overall importance of including PM2.5
mortality co-benefits at all.
EPA uses updated population projections in BenMAP.15 The effect on estimates isnot mentioned but it appears to be minimal.
EPA uses a different function for asthma emergency room (ER) visits that increasesthat benefit by a small amount.
The Excessive Role of “Co-Benefits” Compared to Ozone-Related Benefits
In the above discussion of changes in the RIA benefit calculations, one might notice thatalmost all of the important changes are in the estimate of PM2.5 “co-benefits.” This begs
the question: Why is EPA including PM 2.5 benefits in its ozone RIA? EPA has routinelyincluded PM2.5 benefits estimates in its RIAs for almost all air-related regulations since1997 even when those regulations were not directly related to reducing PM2.5, callingthem “co-benefits.” Once it became clear that EPA could calculate PM2.5 mortality benefit estimates vastly larger than any non-PM benefits that it could generate, RIAs nolonger calculated benefits just from the pollutant that was the subject of a new regulation, but also benefits from incidental additional reductions in PM2.5 resulting from controls onthe subject pollutant.16 This practice has enabled EPA to claim that many new air-relatedregulations will have benefits greater than costs, but usually solely due to the estimates of PM2.5 co-benefits.
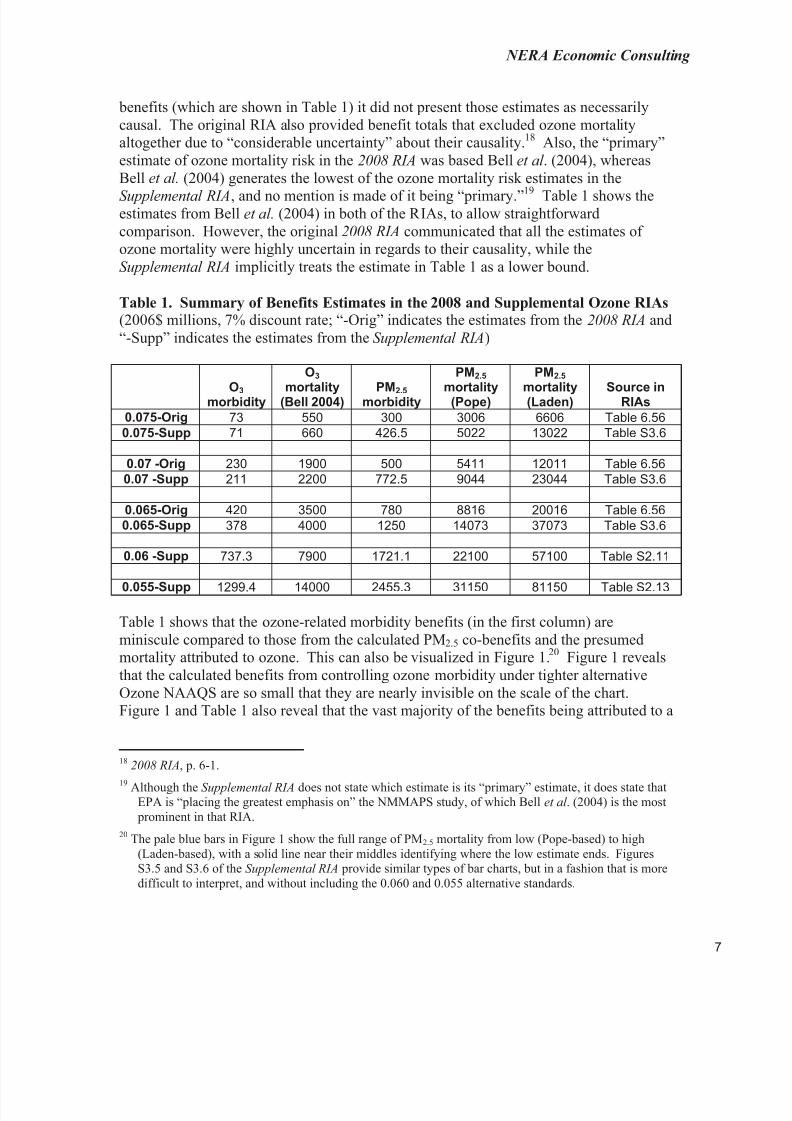
Table 1 summarizes monetized benefit estimates from the original 2008 RIA and theSupplemental RIA for several key benefit and co-benefit categories, using the 7%discount rate.17 Although the 2008 RIA did provide calculations of ozone mortality
now using in all of its RIAs to calculate co- benefits of PM2.5 reductions. This method does notestimate population-based changes in exposure, and thus is inconsistent with OMB Circular A-4 whichrequires risk assessments to estimate how regulations will change population-based exposure, andwhose exposure will be reduced.
15Supplemental RIA, p. S3-2.
16 The use of PM2.5 co-benefits had certainly appeared by the time of the proposed Regional Haze Rule thatfollowed closely on the heels of the first PM2.5 NAAQS in 1997. In that Regional Haze Rule RIA, positive net benefits could be calculated only because of the inclusion of mortality co-benefits from
further reduction of PM2.5 below the level of the then-new PM2.5 NAAQS.17 The RIA provides benefit estimates (but not cost estimates) using a 3% discount rate as well. I prefer to
use consistent discount rates for benefit-cost comparisons, but the conclusions in these comments would be the same using the 3% discount rate estimates. EPA generally references benefits using a 3% rate inits summary statements, which are about 9% higher than those using the 7% rate. Such preferentialreliance on the 3%-based benefits in summary statements helps inflate benefits in externalcommunications.
8/6/2019 Summary and Critique of the Benefits Estimates in the Regulatory Impact Analysis for the Ozone NAAQS Reconside…
benefits (which are shown in Table 1) it did not present those estimates as necessarilycausal. The original RIA also provided benefit totals that excluded ozone mortalityaltogether due to “considerable uncertainty” about their causality.18 Also, the “primary”estimate of ozone mortality risk in the 2008 RIA was based Bell et al . (2004), whereasBell et al. (2004) generates the lowest of the ozone mortality risk estimates in the
Supplemental RIA, and no mention is made of it being “primary.”19
Table 1 shows theestimates from Bell et al. (2004) in both of the RIAs, to allow straightforwardcomparison. However, the original 2008 RIA communicated that all the estimates of ozone mortality were highly uncertain in regards to their causality, while theSupplemental RIA implicitly treats the estimate in Table 1 as a lower bound.
Table 1. Summary of Benefits Estimates in the 2008 and Supplemental Ozone RIAs(2006$ millions, 7% discount rate; “-Orig” indicates the estimates from the 2008 RIA and“-Supp” indicates the estimates from the Supplemental RIA)
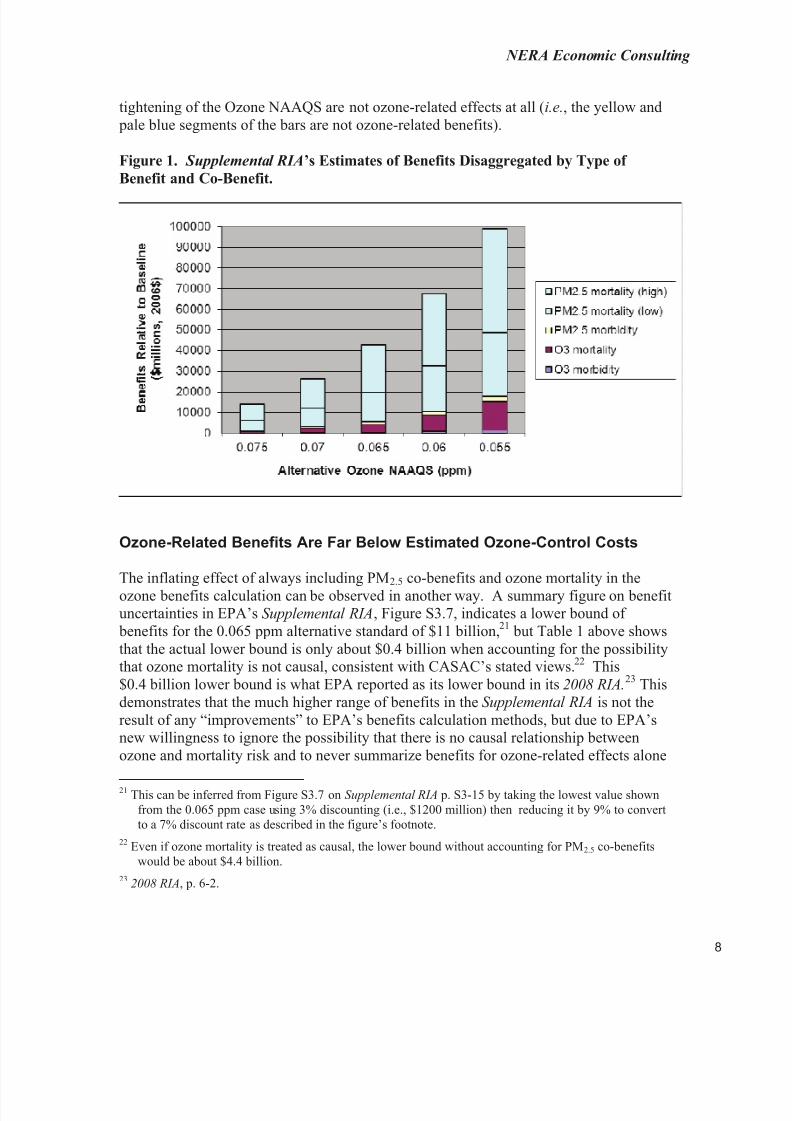
Table 1 shows that the ozone-related morbidity benefits (in the first column) areminiscule compared to those from the calculated PM2.5 co-benefits and the presumedmortality attributed to ozone. This can also be visualized in Figure 1.20 Figure 1 revealsthat the calculated benefits from controlling ozone morbidity under tighter alternativeOzone NAAQS are so small that they are nearly invisible on the scale of the chart.Figure 1 and Table 1 also reveal that the vast majority of the benefits being attributed to a
18 2008 RIA, p. 6-1.
19 Although the Supplemental RIA does not state which estimate is its “primary” estimate, it does state thatEPA is “placing the greatest emphasis on” the NMMAPS study, of which Bell et al . (2004) is the most prominent in that RIA.
20 The pale blue bars in Figure 1 show the full range of PM2.5 mortality from low (Pope-based) to high(Laden-based), with a solid line near their middles identifying where the low estimate ends. FiguresS3.5 and S3.6 of the Supplemental RIA provide similar types of bar charts, but in a fashion that is moredifficult to interpret, and without including the 0.060 and 0.055 alternative standards.
8/6/2019 Summary and Critique of the Benefits Estimates in the Regulatory Impact Analysis for the Ozone NAAQS Reconside…
tightening of the Ozone NAAQS are not ozone-related effects at all (i.e., the yellow and pale blue segments of the bars are not ozone-related benefits).
Figure 1. Supplemental RIA’s Estimates of Benefits Disaggregated by Type of
Benefit and Co-Benefit.
Ozone-Related Benefits Are Far Below Estimated Ozone-Control Costs
The inflating effect of always including PM2.5 co-benefits and ozone mortality in theozone benefits calculation can be observed in another way. A summary figure on benefituncertainties in EPA’s Supplemental RIA, Figure S3.7, indicates a lower bound of benefits for the 0.065 ppm alternative standard of $11 billion,21 but Table 1 above showsthat the actual lower bound is only about $0.4 billion when accounting for the possibilitythat ozone mortality is not causal, consistent with CASAC’s stated views.22 This$0.4 billion lower bound is what EPA reported as its lower bound in its 2008 RIA.
23 Thisdemonstrates that the much higher range of benefits in the Supplemental RIA is not theresult of any “improvements” to EPA’s benefits calculation methods, but due to EPA’snew willingness to ignore the possibility that there is no causal relationship betweenozone and mortality risk and to never summarize benefits for ozone-related effects alone
21 This can be inferred from Figure S3.7 on Supplemental RIA p. S3-15 by taking the lowest value shownfrom the 0.065 ppm case using 3% discounting (i.e., $1200 million) then reducing it by 9% to convertto a 7% discount rate as described in the figure’s footnote.
22 Even if ozone mortality is treated as causal, the lower bound without accounting for PM2.5 co-benefitswould be about $4.4 billion.
232008 RIA, p. 6-2.
8/6/2019 Summary and Critique of the Benefits Estimates in the Regulatory Impact Analysis for the Ozone NAAQS Reconside…
(i.e., without co-benefits also added in) as it did on pages 6-1 and 6-2 of its 2008 RIA.Although EPA does not state it, the Supplemental RIA’s lower bounds for ozone-related benefits when treating the ozone mortality effect as non-causal are as follows:
0.075 ppm alternative standard: $0.07 billion
0.070 ppm alternative standard: $0.21 billion
0.065 ppm alternative standard: $0.38 billion
0.060 ppm alternative standard: $0.74 billion
0.055 ppm alternative standard: $1.30 billion.
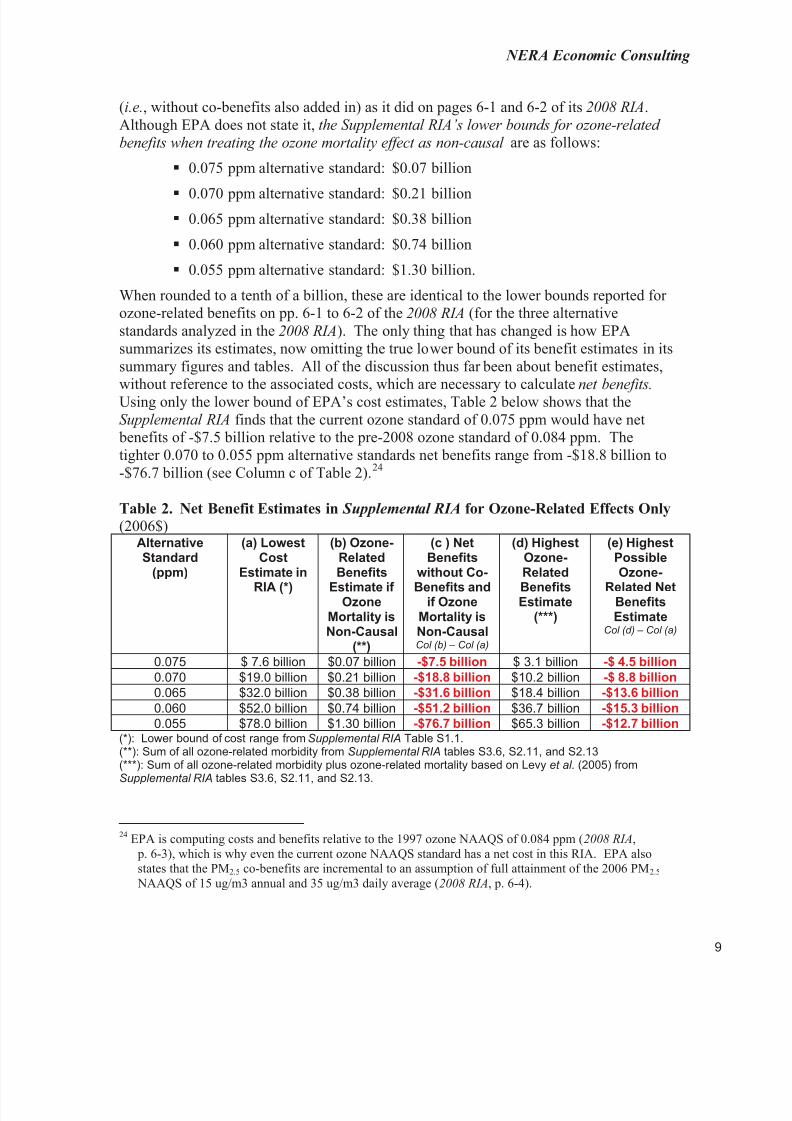
When rounded to a tenth of a billion, these are identical to the lower bounds reported for ozone-related benefits on pp. 6-1 to 6-2 of the 2008 RIA (for the three alternativestandards analyzed in the 2008 RIA). The only thing that has changed is how EPAsummarizes its estimates, now omitting the true lower bound of its benefit estimates in itssummary figures and tables. All of the discussion thus far been about benefit estimates,without reference to the associated costs, which are necessary to calculate net benefits.Using only the lower bound of EPA’s cost estimates, Table 2 below shows that theSupplemental RIA finds that the current ozone standard of 0.075 ppm would have net benefits of -$7.5 billion relative to the pre-2008 ozone standard of 0.084 ppm. Thetighter 0.070 to 0.055 ppm alternative standards net benefits range from -$18.8 billion to-$76.7 billion (see Column c of Table 2).24
Table 2. Net Benefit Estimates in Supplemental RIA for Ozone-Related Effects Only
(*): Lower bound of cost range from Supplemental RIA Table S1.1.(**): Sum of all ozone-related morbidity from Supplemental RIA tables S3.6, S2.11, and S2.13(***): Sum of all ozone-related morbidity plus ozone-related mortality based on Levy et al. (2005) fromSupplemental RIA tables S3.6, S2.11, and S2.13.
24 EPA is computing costs and benefits relative to the 1997 ozone NAAQS of 0.084 ppm (2008 RIA, p. 6-3), which is why even the current ozone NAAQS standard has a net cost in this RIA. EPA alsostates that the PM2.5 co-benefits are incremental to an assumption of full attainment of the 2006 PM2.5
NAAQS of 15 ug/m3 annual and 35 ug/m3 daily average (2008 RIA, p. 6-4).
8/6/2019 Summary and Critique of the Benefits Estimates in the Regulatory Impact Analysis for the Ozone NAAQS Reconside…
In fact, even if the very highest of the ozone mortality estimates in the RIA (i.e., those based on Levy et al . (2005)) are added into the ozone-related morbidity benefits, the totalozone-related benefits in the Supplemental RIA remain below the lower bound of EPA’sown cost estimates. The net benefits of the 0.075 ppm standard would be about
-$4.5 billion (relative to the pre-2008 ozone standard of 0.084 ppm), while the yet-tighter alternative standards (i.e., 0.070 through 0.055 ppm) have net benefits ranging from-$8.8 billion to -$12.7 billion (see Column e of Table 2). Use of any of EPA’s other,higher cost estimates would only make these net benefits more negative.
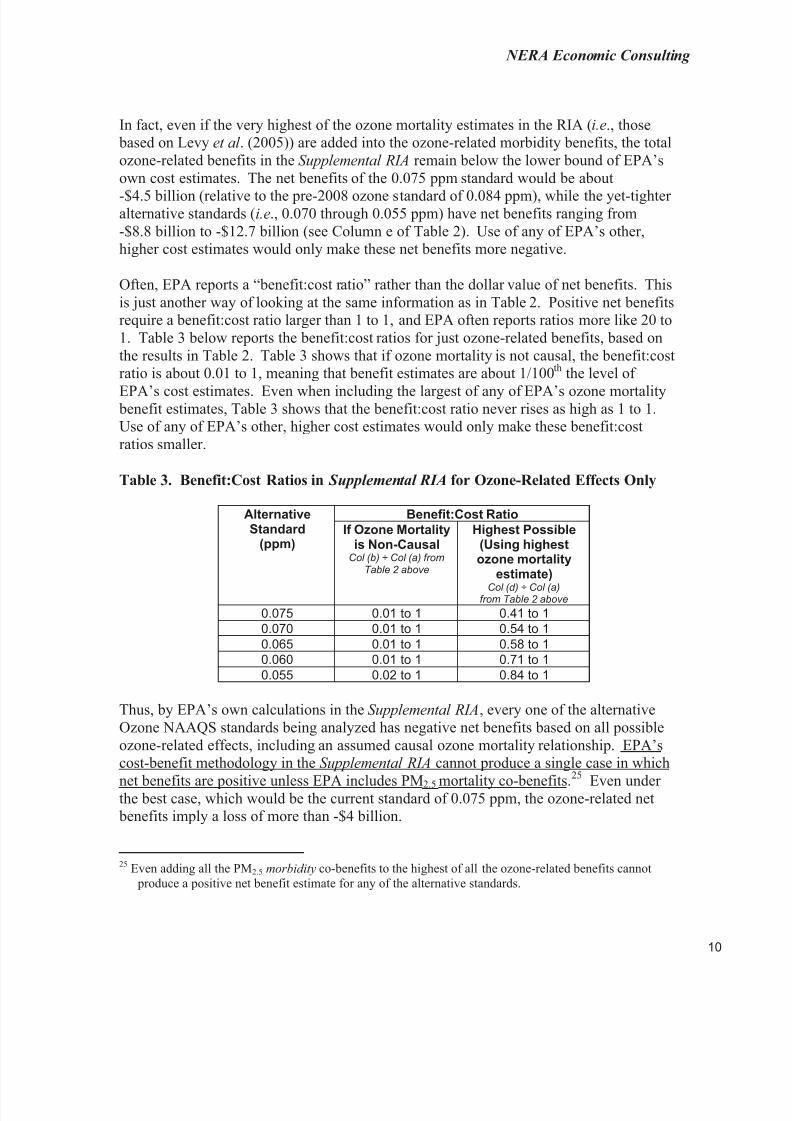
Often, EPA reports a “benefit:cost ratio” rather than the dollar value of net benefits. Thisis just another way of looking at the same information as in Table 2. Positive net benefitsrequire a benefit:cost ratio larger than 1 to 1, and EPA often reports ratios more like 20 to1. Table 3 below reports the benefit:cost ratios for just ozone-related benefits, based onthe results in Table 2. Table 3 shows that if ozone mortality is not causal, the benefit:costratio is about 0.01 to 1, meaning that benefit estimates are about 1/100th the level of
EPA’s cost estimates. Even when including the largest of any of EPA’s ozone mortality benefit estimates, Table 3 shows that the benefit:cost ratio never rises as high as 1 to 1.Use of any of EPA’s other, higher cost estimates would only make these benefit:costratios smaller.
Table 3. Benefit:Cost Ratios in Supplemental RIA for Ozone-Related Effects Only
Benefit:Cost RatioAlternativeStandard
(ppm)If Ozone Mortality
is Non-CausalCol (b) ÷ Col (a) from
Table 2 above
Highest Possible(Using highestozone mortality
estimate)
Col (d) ÷ Col (a)from Table 2 above
0.075 0.01 to 1 0.41 to 10.070 0.01 to 1 0.54 to 10.065 0.01 to 1 0.58 to 10.060 0.01 to 1 0.71 to 10.055 0.02 to 1 0.84 to 1
Thus, by EPA’s own calculations in the Supplemental RIA, every one of the alternativeOzone NAAQS standards being analyzed has negative net benefits based on all possibleozone-related effects, including an assumed causal ozone mortality relationship. EPA’scost-benefit methodology in the Supplemental RIA cannot produce a single case in which
net benefits are positive unless EPA includes PM2.5 mortality co-benefits.
25
Even under the best case, which would be the current standard of 0.075 ppm, the ozone-related net benefits imply a loss of more than -$4 billion.
25 Even adding all the PM2.5 morbidity co-benefits to the highest of all the ozone-related benefits cannot produce a positive net benefit estimate for any of the alternative standards.
8/6/2019 Summary and Critique of the Benefits Estimates in the Regulatory Impact Analysis for the Ozone NAAQS Reconside…
In conclusion, the only way that EPA’s Supplemental RIA can find that net benefits of atighter Ozone NAAQS might be positive is to include PM2.5 co-benefits – and in particular the PM2.5 mortality co-benefits. Even then, most of the net benefits estimatesremain negative. This can be seen in Table S1.1 of the Supplemental RIA, in which therange of net benefits (see last column) is approximately centered around zero, with both
negative and positive estimates in all cases, including the cases in which the highest of the ozone mortality risk estimates is employed (i.e., the rows labeled “Levy et al. 2005”).This tells us that EPA needs to assume not just ozone mortality causality, but also tocombine that with its high-end estimates of PM2.5 mortality risk in order to generate a positive net benefit for any of the alternative Ozone NAAQS.
PM2.5 Co-Benefits Are Inflated and Subject to Large Uncertainties
The need to rely on high-end PM2.5 mortality risk estimates evident in the Supplemental RIA would have been even more pronounced but for two of the changes to its benefitscalculations that EPA made when it “updated” the ozone RIA: the estimation of PM2.5
risks below the lowest measured level in the PM studies, and the use of a higher VSL.Figure 2 below compares the equivalent set of benefits estimates from the original 2008 RIA (labeled “-Orig” in the figure) with those from the Supplemental RIA (labeled“-Supp” in the figure) that were first shown in Figure 1 above. Figure 2 shows resultsonly for the standards 0.075, 0.070 and 0.065 ppm because the original 2008 RIA did notanalyze 0.060 or 0.055 ppm.
Figure 2. Comparison of Benefits Estimates in 2008 and Supplemental RIAs
8/6/2019 Summary and Critique of the Benefits Estimates in the Regulatory Impact Analysis for the Ozone NAAQS Reconside…
Figure 2 reveals that EPA’s “updated” assumptions for the reconsideration reinforced theresult that the reported benefits of the ozone standard are almost entirely due to non-ozone related impacts. That is, the largest change in estimated benefits between the 2008 RIA and the Supplemental RIA was an increase in the PM2.5 mortality benefit, further increasing the predominance of PM2.5 co-benefits over ozone benefits in the analysis.
This is consistent with EPA’s statement that the removal of the threshold in the PM2.5
mortality benefits calculation had by far the largest impact among the changes that itmade in the “update.”26 Other changes such as the increased VSL and the use of updated population projections in BenMAP affected the ozone mortality estimate in the same waythat they affected the PM2.5 mortality estimate, yet the ozone mortality estimates did notincrease in the same degree. That is, the heights of the maroon bars for ozone mortalityin Figure 2 increase only slightly between the original and supplemental estimates,whereas the heights of the pale blue PM2.5 mortality bars double.
EPA increased the VSL in 2020 by 17% from $7.9 million (2006$) in the 2008 RIA27 to
$8.9 million (2006$) in the Supplemental RIA.28 If nothing else had changed, all the
mortality benefits for both ozone and PM2.5 should have increased by 17% in theSupplemental RIA. The ozone mortality estimates do increase by an average of 17%which suggests that the changed population estimates and revised $/ton benefitsestimation method had no significant effect on EPA’s benefit estimates overall. Incontrast, the low and high PM2.5 mortality estimates have increased by 60% and 97%,respectively. By subtracting out the 17% increase due to VSL increase, one can infer thatEPA’s decision to now count PM2.5 benefits down to the lowest measured level increasedits low-end (Pope) PM2.5 mortality benefit estimates by about 40%, and its high-end(Laden) PM2.5 mortality benefit estimates by about 65%. The combined effect of removing the PM2.5 threshold and increasing the VSL estimate was to nearly double thehigh-end estimates of PM2.5 mortality from the 2008 RIA to the current “updated” RIA.
EPA takes the position that this doubling of co-benefits is appropriate to incorporate intothe RIA used for the ozone reconsideration although the reconsideration supposedly usesinformation available to the Administrator at the time of the original 2008 decision.
Why tighten an ozone regulation if the benefits are almost entirely attributable to PM2.5,
which is itself already subject to regulation that protects the public health with anadequate margin of safety? In pondering that question, one should also be informed thata string of questionable assumptions in the calculations of PM2.5 co-benefits exists,including the following:
The PM2.5 benefit estimates are due to small changes in PM2.5 starting at very low
initial concentrations of PM2.5, despite EPA’s own statement that “It is important tonote that as the stringency of the standards increases, we believe that the uncertainty
26Supplemental RIA, p. S3-17.
27 2008 RIA, p. 6-25.
28Supplemental RIA, p. S2-20.
8/6/2019 Summary and Critique of the Benefits Estimates in the Regulatory Impact Analysis for the Ozone NAAQS Reconside…
in the estimates of the costs and benefits also increases.”29 EPA states that the PM2.5
co-benefits in this RIA are all incremental to exact attainment of the 2006 PM2.5
standards,30 which means that 100% of the PM2.5 co-benefits are due to PM2.5
changes in areas where exposure levels are already in attainment with the PM2.5
NAAQS. Thus, all of the PM2.5 co-benefits calculated in the ozone RIA come from
changes in PM2.5 concentrations that EPA deemed to be too uncertain to consider when setting the PM2.5 NAAQS.
The possibility that PM2.5 associations reflect systematic errors rather than a causalrelationship (Smith, 2009).
The assumption that nitrate – which is the only PM2.5 constituent appreciably alteredin the ozone RIA’s co-benefit calculations – is equally as potent as PM2.5
constituents generally.31 This is increasingly unlikely as epidemiological evidencemounts that the culprit surrogate variable in the PM2.5 epidemiological literaturemay rather be vehicle, traffic, or noise-related.
The failure to use epidemiological relationships for PM2.5 that have been estimatedwith statistical controls for other co-pollutants. For example, the lower benefit bound that is based on the Pope study relies on a single-pollutant model, eventhough previous studies on that same cohort found that the PM2.5 coefficient becameinsignificant when estimated in a multi-pollutant model with SO2 (see Krewski et al.,2000). The upper bound benefit is based on Laden et al. (2006), which is a single- pollutant analysis that did not even rely on actual PM2.5 measurements.
The Ozone-Related Benefits Estimates Are Inflated and Not Credible
The ozone RIA’s emphasis on PM2.5 co-benefits makes it easy to give minimal scrutinyto the ozone benefit estimates themselves. However, the ozone mortality and morbidityestimates are also problematic.
First, the estimates of ozone-specific benefits are almost entirely based on a presumptionthat the few epidemiological studies of ozone mortality risk demonstrate a causal effectof ozone. This is a leap of faith that CASAC was not prepared to endorse. In their teleconference call of February 18, 2011, CASAC members wondered why there was somuch emphasis on ozone mortality in the charge questions EPA had posed. One member stated that CASAC’s original recommendation to tighten the ozone standard had not been based on ozone mortality risks and none dissented when another stated that the
29Supplemental RIA, p. S1-1.
30 2008 RIA, p. 6-4.
31 The Supplemental RIA states “PM co-benefits are derived primarily from reductions in nitrates(associated with NOx controls). As such, these estimates are strongly influenced by the assumption thatall PM components are equally toxic” (p. S1 -11).
8/6/2019 Summary and Critique of the Benefits Estimates in the Regulatory Impact Analysis for the Ozone NAAQS Reconside…
assumption of ozone mortality was “not ready for prime time.” Members noted that thiswas their view at the time that they performed their original review and it remains their view today of the 2008 body of evidence. The importance of these statements for theRIA cannot be overstated. If PM2.5 co-benefits and ozone mortality benefit calculationsare removed, the total benefits at each standard drop to about $0.2 billion for the
0.070 ppm alternative standard and to $0.7 billion for the 0.060 ppm alternative standardas compared to costs above $19 billion and $56 billion, respectively. Net benefits aresolidly in the negative by billions of dollars.
One need not dismiss the causality presumption in order to see such large decreases in the benefits in the RIA, however. As demonstrated in comments during the original 2008review of the Ozone NAAQS (Smith and Gibbs, 2007), almost all of the benefits beingassessed for reductions from the current standard are attributable to exposures on dayswhen peak ozone is very low. This follows from the fact that almost all of the estimatedrisk at attainment of the current standard comes from days when the 24-hour averageozone is below 0.04 ppm, as shown in Table 4 on the next page.32 Table 5, also on the
next page, shows that the vast majority of risk estimated for an alternative Ozone NAAQS of 0.064 ppm is associated with 24-hour average ozone below 0.040 ppm. Thus,almost all of the ozone mortality and morbidity benefit calculated by EPA in itsSupplemental RIA is from small changes in ozone concentrations starting from already-low ozone levels. Again, as EPA itself warns on p. S1-1 of its Supplemental RIA, “It isimportant to note that as the stringency of the standards increases, we believe that theuncertainty in the estimates of the costs and benefits also increases.”
The sensitivity shown in Tables 4 and 5 is highly important for another reason as well.The 0.040 ppm cut-off on a 24-hour average basis was selected because it is the level of “policy relevant background” (PRB) that EPA chose to use in its prior 1997 ozone risk
analysis. In the current benefits analysis, both for the original 2008 ozone RIA and theSupplemental RIA, EPA changed its PRB assumption to lower levels ranging from 0.014to 0.032 ppm (varying by city and month). These values were derived from runs of amodel known as GEOS-CHEM. Table 4 above shows that almost all of the increase inozone morbidity and mortality risk above the previous review cycle is attributable tochange in the PRB assumption and not to new epidemiological evidence indicating agreater degree of ozone potency than was known in 1997. The above sensitivity analysesare based on EPA’s Risk Analysis in support of the 2008 NAAQS decision (EPA, 2007)and not the RIA, but the same computations of benefits are done in the RIA and the samegeneral sensitivity to the PRB assumption must also exist in the RIA benefits estimates.Since the Risk Analysis focuses on cities with generally high ozone levels, one might
32 The analysis used to produce Tables 4 and 5 uses a 24-hour rather than an 8-hour daily maximumaverage. Although EPA has claimed in the past that the equivalent 8-hour max is about double the 24-hour average, detailed analysis of the data used by EPA demonstrates that this rule of thumb clearly andconsistently overstates the 8-hour maximum for 24-hour averages above about 0.030 ppm. The 8-hour maximum associated with a 24-hour average of 0.040 ppm varies by city but is less than 0.070 ppm andfrequently averages closer to 0.060 ppm (Smith, 2008a, 2008b).
8/6/2019 Summary and Critique of the Benefits Estimates in the Regulatory Impact Analysis for the Ozone NAAQS Reconside…
expect that an even greater sensitivity than shown in Table 4 pertains to the benefitsestimates in the RIA, which account for risks across the entire U.S. with on average lower ozone levels.
Table 4. Sensitivity of Quantitative Risk Estimates PRB Assumption at Exact
Attainment of a 0.074 ppm NAAQS (Average of 2002 and 2004 Air Quality Data)Numbers of Deaths
Estimated UsingGEOS-CHEM for PRB
Assumptions
Numbers of DeathsEstimated UsingPRB = 0.040 ppm
Assumption
Percent Reduction inRisk Estimate from
Change in PRBAssumption
Atlanta5.3 0.1 98%
Cleveland31.7 2.6 92%
Detroit30.2 0.7 98%
Houston17.8 0.7 96%
Los Angeles
28.6 0.0 100%Sacramento
9.5 0.1 99%St. Louis
3.4 0.2 96%
Source: Smith and Gibbs (2007) Appendix C.
Table 5. Sensitivity of Quantitative Risk Estimates PRB Assumption at Exact
Attainment of a 0.064 ppm NAAQS (Average of 2002 and 2004 Air Quality Data)
Numbers of DeathsEstimated Using
GEOS-CHEM for PRBAssumptions
Numbers of DeathsEstimated UsingPRB = 0.040 ppm
Assumption
Percent Reduction inRisk Estimate from
Change in PRBAssumption
Atlanta4.1 0.0 99%
Cleveland26.2 1.2 96%
Detroit23.0 0.2 99%
Houston12.7 0.2 98%
Los Angeles15.4 0.0 100%
Sacramento8.1 0.1 99%
St. Louis2.5 0.1 98%
Source: Smith and Gibbs (2007) Appendix C.
This is an important issue because the question of what level of ozone is actually background remains open to continuing study and discussion. Monitoring data do notsupport the GEOS-CHEM results used in the 2008 RIA. Indeed, monitoring data suggesta trend of rising background ozone levels. Also, new and enhanced GEOS-CHEM
8/6/2019 Summary and Critique of the Benefits Estimates in the Regulatory Impact Analysis for the Ozone NAAQS Reconside…
modeling efforts are purported to be predicting higher PRB levels.33 The evidence aboveis that even very small increments in the assumed PRB level will greatly reduce bothmortality and morbidity benefit estimates for ozone from those that have been reported inthe present ozone RIA.
Conclusion
The estimates of benefits in the ozone reconsideration RIA are little different from thosein its predecessor, the original 2008 RIA, despite significant differences in EPA’scommunication about those estimates. Although EPA represents the Supplemental RIAfor the ozone reconsideration as an update that has methodological improvements sincethe 2008 RIA, the changes that can be called methodological improvements have had nosignificant effect on the benefits estimates. Rather, the key changes are EPA’sunsupported decisions (1) to eliminate all recognition of the uncertainty in a causalrelationship between ozone and mortality, and (2) to calculate PM2.5 co-benefits down tothe lowest predicted PM2.5 level rather than to a lowest measured level in the
epidemiological studies that serve as the basis for EPA’s PM2.5 concentration-responserelationships. Neither of the latter two changes can be characterized as a methodological“improvement,” and neither is based on advice from EPA’s CASAC panel overseeing theozone reconsideration.
Even with EPA’s changes, however, the Supplemental RIA does not provide a cost- benefit basis for altering the Ozone NAAQS unless one includes estimates of mortalityco-benefits from changes in PM2.5 levels. That is, not one of EPA’s estimates of the benefits of reducing ozone to a tighter alternative ozone standard is as large as the costsof attaining that respective ozone standard – all have negative net benefits if based onozone benefits alone. Figure 3 on the next page illustrates the data that were presented in
Table 2 to summarize the Supplemental RIA’s estimates of the net benefits of each of thealternative ozone standards (relative to the standard of 0.084 ppm) when no PM2.5 co- benefits are included. Even using the highest estimate of ozone mortality benefit in theRIA combined with the lowest EPA cost estimate, the estimated net benefits of the 0.075 ppm standard are about -$4.5 billion relative to the 0.084 ppm standard while the yet-tighter alternative standards (i.e., 0.070 through 0.055 ppm) have estimated net benefitsranging from -$8.8 billion to -$12.7 billion. If one treats the ozone-mortality associationas non-causal, EPA estimates that the current ozone standard of 0.075 ppm would havenet benefits of -$7.5 billion and the yet-tighter alternative standards of 0.070 through0.055 ppm would range from -$18.8 billion to -$76.7 billion. In fact, if there is no causalrelationship between ozone and mortality risk, the net benefits estimates for standards
tighter than 0.075 ppm remain negative even with the inclusion of the highest of EPA’sPM2.5 mortality and morbidity co-benefits and using the low end of its cost range.
33 See, for example, Oltmans et al. (2008), Wang et al. (2009) and Cooper et al. (2010).
8/6/2019 Summary and Critique of the Benefits Estimates in the Regulatory Impact Analysis for the Ozone NAAQS Reconside…
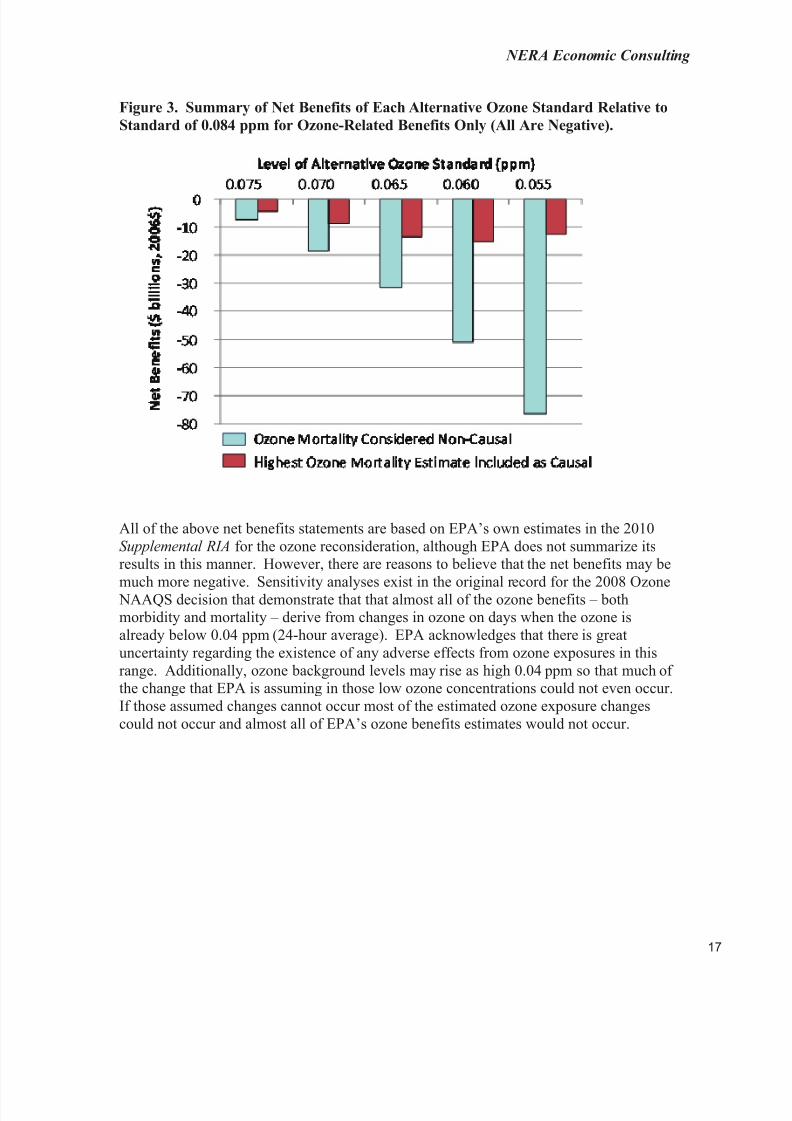
Figure 3. Summary of Net Benefits of Each Alternative Ozone Standard Relative to
Standard of 0.084 ppm for Ozone-Related Benefits Only (All Are Negative).
All of the above net benefits statements are based on EPA’s own estimates in the 2010Supplemental RIA for the ozone reconsideration, although EPA does not summarize itsresults in this manner. However, there are reasons to believe that the net benefits may be
much more negative. Sensitivity analyses exist in the original record for the 2008 Ozone NAAQS decision that demonstrate that that almost all of the ozone benefits – bothmorbidity and mortality – derive from changes in ozone on days when the ozone isalready below 0.04 ppm (24-hour average). EPA acknowledges that there is greatuncertainty regarding the existence of any adverse effects from ozone exposures in thisrange. Additionally, ozone background levels may rise as high 0.04 ppm so that much of the change that EPA is assuming in those low ozone concentrations could not even occur.If those assumed changes cannot occur most of the estimated ozone exposure changescould not occur and almost all of EPA’s ozone benefits estimates would not occur.
8/6/2019 Summary and Critique of the Benefits Estimates in the Regulatory Impact Analysis for the Ozone NAAQS Reconside…
American Chemistry Council. 2009. Comments on EPA’s Proposed Rule National Emissions Standards for Hazardous Air Pollutants from the Portland Cement
Manufacturing Industry, 74 FR May 6, 2009, Docket EPA-HQ-OAR-2002-0051.Submitted to Docket as EPA-HQ-2002-0051-2849, September 4. Available at:http://www.regulations.gov/#!documentDetail;D=EPA-HQ-OAR-2002-0051-2849.
Bell, M.L., A. McDermott, S.L. Zeger, J.M. Samet, F. Dominici. 2004. “Ozone andShort-Term Mortality in 95 US Urban Communities, 1987-2000.” JAMA, 292(19):2372-8.
Bell, M.L., F. Dominici, and J.M. Samet. 2005. “A MetaͲanalysis of TimeͲseries Studies
of Ozone and Mortality with Comparison to the National Morbidity, Mortality, and Air
Pollution Study.” Epidemiology. 16(4): p. 436Ͳ45.
Cooper O.R., D.D. Parrish, A. Stohl, M. Trainer, P. Nédélec, V. Thouret, J.P. Cammas,S.J. Oltmans, B.J. Johnson, D. Tarasick, T. Leblanc, I.S. McDermid, D. Jaffe, R. Gao, J.Stith, T. Ryerson, K. Aikin, T. Campos, A. Weinheimer, M.A. Avery. 2010. “IncreasingSpringtime Ozone Mixing Ratios in the Free Troposphere over Western North America,” Nature 463:344-348.
Huang Y., F. Dominici, M. Bell. 2005. “Bayesian Hierarchical Distributed Lag Models
for Summer Ozone Exposure and CardioͲRespiratory Mortality.” Environmetrics, 16,
547Ͳ562.
Krewski D., R.T. Burnett, M. Goldberg, K. Hoover, J. Siemiatycki, M. Jerrett, M.
Abrahamowicz, W.H. White. 2000. Reanalysis of the Harvard Six Cities Study and the American Cancer Society Study of Particulate Air Pollution and Mortality. SpecialReport, Health Effects Institute, Cambridge, Massachusetts (July).
Laden, F., J. Schwartz, F.E. Speizer, and D.W. Dockery. 2006. “Reduction in FineParticulate Air Pollution and Mortality.” American Journal of Respiratory and Critical
Care Medicine 173:667Ͳ672.
Levy, J.I., S.M. Chemerynski, and J.A. Sarnat. 2005. “Ozone Exposure and Mortality:
an Empiric Bayes Metaregression Analysis.” Epidemiology. 16(4): p. 458Ͳ68.
National Research Council. 2008. Estimating Mortality Risk Reduction and Economic Benefits from Controlling Ozone Air Pollution. National Academies Press. Available at:http://books.nap.edu/catalog.php?record_id=12198&utm_medium=etmail&utm_source= National%20Academies%20Press&utm_campaign=New+from+NAP+4.29.08-May-7-2008&utm_content=Downloader&utm_term=
8/6/2019 Summary and Critique of the Benefits Estimates in the Regulatory Impact Analysis for the Ozone NAAQS Reconside…
Oltmans S.J., A.S. Lefohn, J.M Harris, D. Shadwick. 2008. “Background Ozone Levelsof Air Entering the West Coast of the US and Assessment of Longer-Term Changes,” Atmospheric Environment 42:6020-6038
Pope, C.A., III, R.T. Burnett, M.J. Thun, E.E. Calle, D. Krewski, K. Ito, and G.D.
Thurston. 2002. “Lung Cancer, Cardiopulmonary Mortality, and LongͲterm Exposure toFine Particulate Air Pollution.” Journal of the American Medical Association
287:1132Ͳ1141.
Schwartz, J. 2005. How Sensitive is the Association between Ozone and Daily Deaths to
Control for Temperature? Am J Respir Crit Care Med . 171(6): 627Ͳ31.
Smith, A.E. 2009. “Comments on the External Review Draft of EPA’s ‘Risk Assessment to Support the Review of the PM Primary National Ambient Air QualityStandards’,” prepared for Utility Air Regulatory Group, American Petroleum Instituteand American Chemistry Council, submitted to PM Docket as part of UARG Comments,
November 8.
Smith, A.E. 2008a. Letter to Ms. Lucinda Minton Langworthy (reviewing data in memodated November 27, 2007 from Abt Associates that was placed in Ozone NAAQS Docketafter end of comment period), letter submitted to docket by UARG, Docket # EPA-HQ-OAR-2005-7004, January 9, 2008. Available at:http://www.regulations.gov/#!documentDetail;D=EPA-HQ-OAR-2005-0172-7004.1.
Smith, A.E. 2008b. Supplemental data related to Smith (2008a) added to Docket # EPA-HQ-OAR-2005-7051 on February 4, 2008. Available at:http://www.regulations.gov/#!documentDetail;D=EPA-HQ-OAR-2005-0172-7051.1
Smith, A.E. and B. Gibbs. 2007. “Comments On EPA’s Proposed Rule To Revise The National Ambient Air Quality Standards For Ozone (72 Fr 37818).” prepared for UtilityAir Regulatory Group, American Petroleum Institute and American Chemistry Council ,submitted to Ozone Docket as part of UARG Comments, October 9.
Sunstein, C.R. 2004. “Lives, Life Years, and Willingness to Pay,” Columbia Law Review, 104(1):205-252.
U.S. Environmental Protection Agency. 2010. Regulatory Impact Analysis for the Reconsideration of the 2008 Ozone National Ambient Air Quality Standard . January.
Available at: http://www.epa.gov/ttnecas1/ria.html.
U.S. Environmental Protection Agency. 2009. Proposed NO2 NAAQS Regulatory Impact Analysis (RIA). EPA/OAQPS/HEID/ABCG July 2.Available at: http://www.epa.gov/ttn/ecas/regdata/RIAs/proposedno2ria.pdf ͘
8/6/2019 Summary and Critique of the Benefits Estimates in the Regulatory Impact Analysis for the Ozone NAAQS Reconside…
U.S. Environmental Protection Agency. 2008. Final Ozone NAAQS Regulatory Impact Analysis. EPA-452/R-08-003, March. Available at:http://www.epa.gov/ttnecas1/regdata/RIAs/452_R_08_003.pdf .
U.S. Environmental Protection Agency. 2007. Ozone Health Risk Assessment for
Selected Urban Areas. EPA-452/R-07-009, July. Available at:http://www.epa.gov/ttn/naaqs/standards/ozone/data/ozone_ra_final_tsd_7-2007.pdf .
Wang H., D.J. Jacob, P. Le Sager, D.G. Streets, R.J. Park, A.B. Gilliland, A. vanDonkelaar. 2009. “Surface Ozone Background in the US: Canadian and MexicanPollution Influences,” Atmospheric Environment 43:1310-1319.


![Federal No. andRegulations...EPA ' ¯ ¯ EPA) NAAQS. {' "" ¯ is-)-\[] ¯ ¯ [¯ ¯ ¯ ¯ ¯ ¯ ¯ (." +),,• ...](https://static.documents.pub/doc/80x56/5ece9c4fad639c66df582bc6/federal-no-andregulations-epa-epa-naaqs-is-.jpg)


