30
DECEMBER 2018

WHAT THE IPCC SPECIALREPORT ON GLOBALWARMING OF 1.5°CMEANS FOR CITIES
URBANPOLICYMAKERS
S U M M A R Y F O R
DECEMBER 2018

Copyright © 2018. All rights reserved.
<http://doi.org/10.24943/SCPM.2018>
This publication translates the key scientific findings and policy observations of the IPCC Special Report on Global Warming of 1.5°C for officials and policymakers of the world’s cities and urban areas. It does not necessarily reflect the views of the IPCC or member governments.
Photo credits
Cover, back cover: aapsky/Shutterstock.comP. 7: Wojciech Dziadosz/Shutterstock.comP. 8: fuyu liu/Shutterstock.comP. 15: Action Sports Photography/Shutterstock.comP.18: ArtNat/Shutterstock.comP. 19: Leo_nik/Shutterstock.comP. 22: Olga Kot Photo/Shutterstock.comP. 24: Por Sean Hsu/Shutterstock.comP. 26: f11photo/Shutterstock.com
II. WHY DO CITIES MATTER? 15
III. IS THE URBAN TRANSITION FEASIBLE? 18
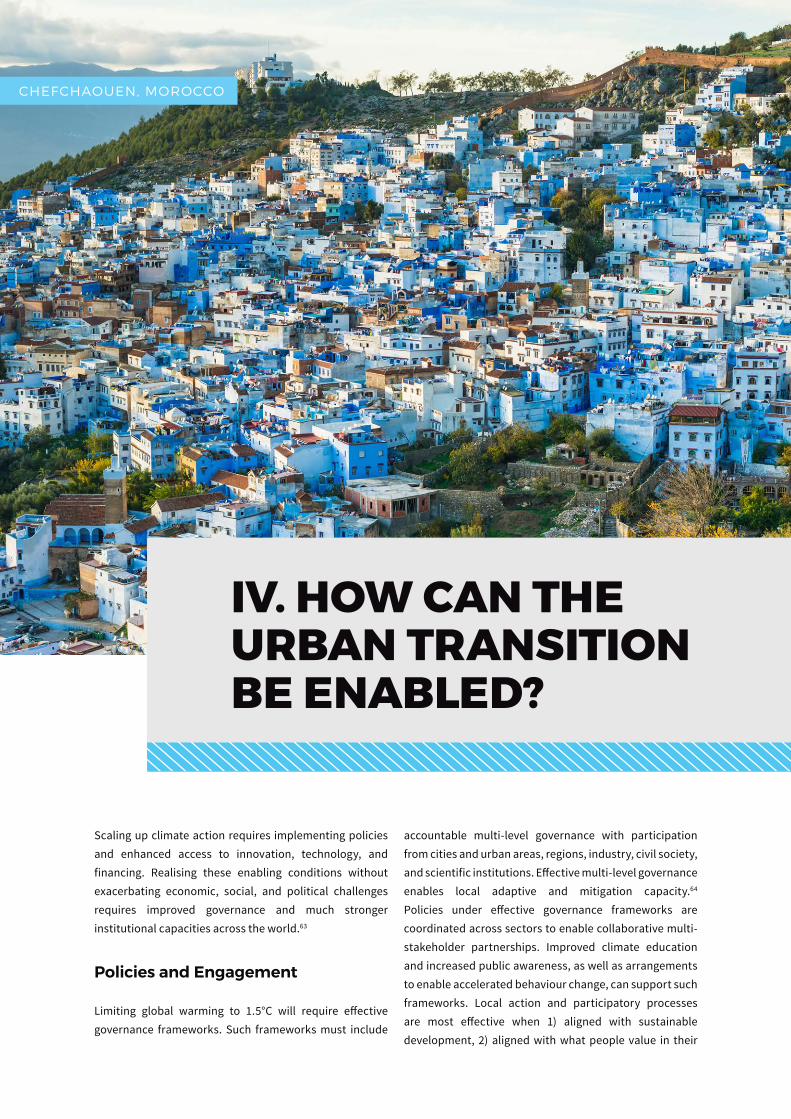
IV. HOW CAN THE URBAN TRANSITION BE ENABLED? 22
V. CAN THIS BE PAID FOR? 24
CONCLUSION 26
I. SR1.5: AN INTRODUCTION AND OVERVIEW 7
ENDNOTES 28
COVER NOTE 6
ACKNOWLEDGEMENTS 27
TABLE OF CONTENTS

Amir Bazaz (India)SR1.5 Contributing Author – Chapter 4SUP Lead AuthorIndian Institute for Human Settlements
Paolo Bertoldi (Italy/EU)SR1.5 Lead Author – Chapter 4SUP Lead AuthorEuropean Commission Joint Research Centre
Marcos Buckeridge (Brazil)SR1.5 Lead Author – Chapter 4SUP Lead AuthorUniversity of São Paulo
Anton Cartwright (South Africa)SR1.5 Lead Author – Chapter 4SUP Lead AuthorAfrican Centre for Cities
Heleen de Coninck (Netherlands/EU)SR1.5 Coordinating Lead Author – Chapter 4SUP Coordinating Lead AuthorRadboud University
François Engelbrecht (South Africa)SR1.5 Lead Author – Chapter 3SUP Lead AuthorCouncil for Scientific and Industrial Research
Daniela Jacob (Germany/EU)SR1.5 Coordinating Lead Author – Chapter 3SUP Lead AuthorClimate Service Center Germany
Jean-Charles Hourcade (France/EU) SR1.5 Lead Author – Chapter 4 SUP Lead AuthorCentre International de Recherche sur l’Environnement et de Développement
Ian Klaus (USA)SUP Coordinating Lead AuthorChicago Council on Global Affairs
Kiane de Kleijne (Netherlands/EU)SR1.5 Contributing Author – Chapter 4SUP Lead AuthorRadboud University
Shauib Lwasa (Uganda)IPCC Expert Reviewer SUP Lead AuthorMakerere University
Claire Markgraf (USA)SUP Lead AuthorC40 and Global Covenant of Mayors for Climate & Energy
Peter Newman (Australia)SR1.5 Lead Author – Chapter 4SUP Lead AuthorCurtin University
Aromar Revi (India)SR1.5 Coordinating Lead Author – Chapter 4SUP Coordinating Lead AuthorIndian Institute for Human Settlements
Joeri Rogelj (Austria/UK/Belgium/EU)SR1.5 Coordinating Lead Author – Chapter 2SUP Lead Author International Institute for Applied Systems Analysis Grantham Institute Imperial College London
Seth Schultz (USA)SR1.5 Lead Author – Chapter 4SUP Coordinating Lead AuthorUrban Breakthroughs
Drew Shindell (USA)SR1.5 Coordinating Lead Author – Chapter 2SUP Lead AuthorDuke University
Chandni Singh (India)SR1.5 Contributing Author – Chapter 4SUP Lead AuthorIndian Institute for Human Settlements
William Solecki (USA)SR1.5 Coordinating Lead Author – Chapter 1SUP Coordinating Lead AuthorCUNY Institute for Sustainable Cities
Linda Steg (Netherlands/EU)SR1.5 Lead Author – Chapter 4SUP Lead AuthorUniversity of Groningen
Henri Waisman (France/EU)SR1.5 Coordinating Lead Author – Chapter 5SUP Lead AuthorInstitut du Développement Durable et des Relations Internationales
AUTHORS
Zach BaumerCity of Austin, USA
Deb CailesCity of Melbourne, Australia
Lia CaironeCity of New York, USA
Yoonjin ChoCity of Seoul, South Korea
Sergi DelgadoCity of Barcelona, Spain
Yann FrançoiseCity of Paris, France
Ares GabàsCity of Barcelona, Spain
Patricia HimschootCity of Buenos Aires, Argentina
Neda KostandinovicCity of Barcelona, Spain
Bahram DehghanCity of Frederikshavn, Denmark
Dana KochnowerCity of New York, USA
Lykke LeonardsenCity of Copenhagen, Denmark
Dan NielsenCity of Edmonton, Canada
Kate NobleCity of Melbourne, Australia
Cathy OkeCity of Melbourne, Australia
Firdaous OussidhoumCity of Chefchaouen, Morocco
Toni PujolCity of Barcelona, Spain
Debra RobertsCity of Durban, South Africa
Irma SoldevillaCity of Barcelona, Spain
Irma VentayolCity of Barcelona, Spain
ADVISORS: CITY PRACTITIONERS & POLICYMAKERS
Summary for Urban Policymakers
6 // 30
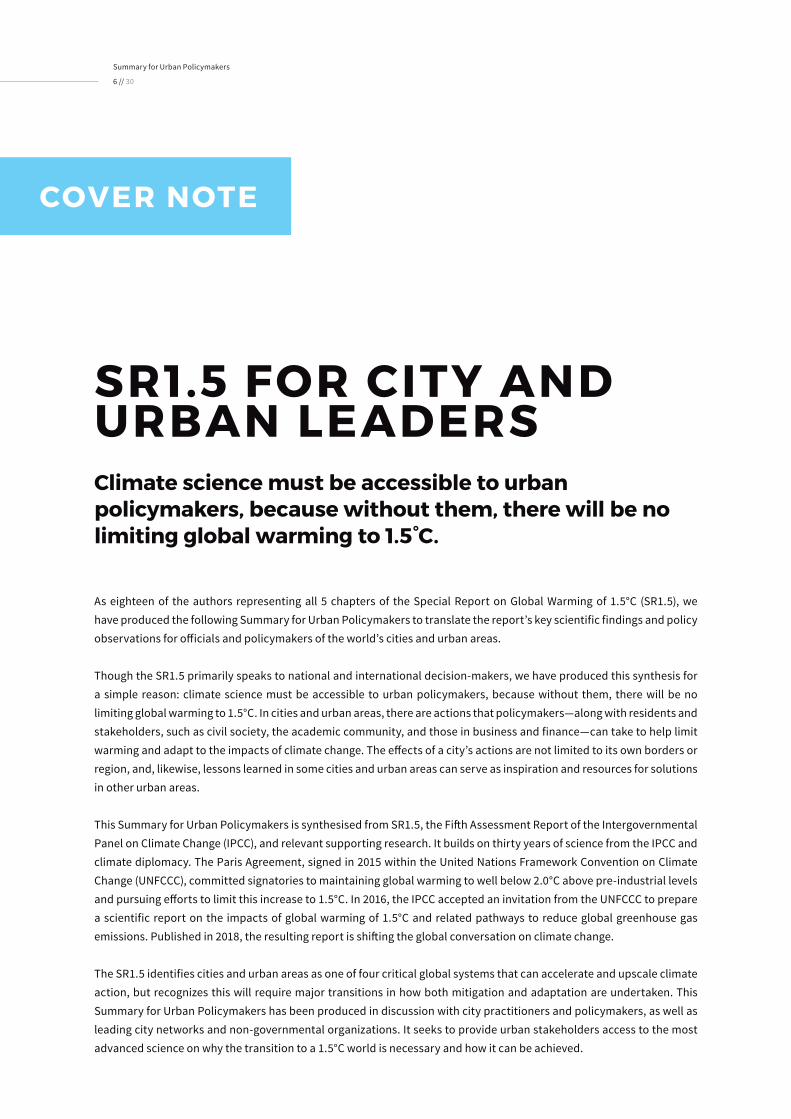
SR1.5 FOR CITY AND URBAN LEADERS Climate science must be accessible to urban policymakers, because without them, there will be no limiting global warming to 1.5°C.
As eighteen of the authors representing all 5 chapters of the Special Report on Global Warming of 1.5°C (SR1.5), we have produced the following Summary for Urban Policymakers to translate the report’s key scientific findings and policy observations for officials and policymakers of the world’s cities and urban areas.
Though the SR1.5 primarily speaks to national and international decision-makers, we have produced this synthesis for a simple reason: climate science must be accessible to urban policymakers, because without them, there will be no limiting global warming to 1.5°C. In cities and urban areas, there are actions that policymakers—along with residents and stakeholders, such as civil society, the academic community, and those in business and finance—can take to help limit warming and adapt to the impacts of climate change. The effects of a city’s actions are not limited to its own borders or region, and, likewise, lessons learned in some cities and urban areas can serve as inspiration and resources for solutions in other urban areas.
This Summary for Urban Policymakers is synthesised from SR1.5, the Fifth Assessment Report of the Intergovernmental Panel on Climate Change (IPCC), and relevant supporting research. It builds on thirty years of science from the IPCC and climate diplomacy. The Paris Agreement, signed in 2015 within the United Nations Framework Convention on Climate Change (UNFCCC), committed signatories to maintaining global warming to well below 2.0°C above pre-industrial levels and pursuing efforts to limit this increase to 1.5°C. In 2016, the IPCC accepted an invitation from the UNFCCC to prepare a scientific report on the impacts of global warming of 1.5°C and related pathways to reduce global greenhouse gas emissions. Published in 2018, the resulting report is shifting the global conversation on climate change.
The SR1.5 identifies cities and urban areas as one of four critical global systems that can accelerate and upscale climate action, but recognizes this will require major transitions in how both mitigation and adaptation are undertaken. This Summary for Urban Policymakers has been produced in discussion with city practitioners and policymakers, as well as leading city networks and non-governmental organizations. It seeks to provide urban stakeholders access to the most advanced science on why the transition to a 1.5°C world is necessary and how it can be achieved.
COVER NOTE

Summary for Urban Policymakers
7 // 30
The Special Report on Global Warming of 1.5°C (SR1.5)1 is one of the most scrutinised public scientific reports of the early 21st century. Based on an assessment of over six thousand recent scientific papers and documents, its production included three rounds of review and responses to over forty thousand comments by national governments, non-governmental organizations, city networks, civil society, and experts from all regions of the world.
The rigor of the science behind SR1.5 is matched by its arresting findings. Climate change represents a grave threat to the planet. The world has already warmed by 1.0°C above pre-industrial levels due to human activities and is experiencing the related impacts. Every tenth of a degree matters. At the current rate of warming of 0.2°C per decade, global warming will reach 1.5°C between 2030 and 2052.2
I. SR1.5: AN INTRODUCTION AND OVERVIEW
KATOWICE, POLAND

Summary for Urban Policymakers
8 // 30
The scale of action needed is now clear. In order to limit global warming at any level, we must reach zero global carbon dioxide (CO2) emissions. The total amount of CO2 emitted until we reach the threshold of zero global emissions largely determines the amount of warming to which we are committed. Limiting global warming to 1.5°C depends on significant reductions in greenhouse gas (GHG) emissions over the coming decades. If global CO2 emissions reach zero in thirty years,3 there is a one-in-two chance4 of limiting warming to 1.5°C. To increase this probability to a two-in-three chance, CO2 emissions must be reduced to zero in twenty years.5 In addition, there must be deep reductions in emissions of methane, black carbon, fluorinated gases, and nitrous oxide (see Fig. 1 & 2).6
The urgency of acting now is also clear. Climate action is more likely to limit warming to 1.5°C, and is less expensive overall, the sooner it is pursued. Each year we delay the start of emission reductions, the window to reach zero emissions is reduced by approximately two years on a pathway to remaining below 1.5°C.8 Some communities and urban areas have already started reducing their emissions. Most communities, including cities and regions, however, need to raise their ambition to be in line with 1.5°C.9
Future Pathways
Emission pathways are scientific projections of our possible futures based on the direction of the world economy, demographic trends, and global energy and land use. It is useful to think of two categories of pathways. The first involves keeping global temperature at or just below 1.5°C throughout the rest of the century and is called ‘no overshoot’. The second category consists of ‘overshoot pathways’ in which temperatures temporarily exceed 1.5°C before returning to 1.5°C by 2100. If this temporary exceedance is up to 0.1°C, this is called ‘limited overshoot’. If the exceedance is more than 0.1°C, this is called ‘higher overshoot’.10
Pathways that limit global warming to 1.5°C, most of which still involve overshoot, require significant changes in four systems: energy, land use and ecosystems, urban and infrastructure, and industry.11 These pathways also require at least some use of carbon dioxide removal (CDR)12 to neutralize emissions from sources for which no mitigation measures have yet been identified (e.g., airplane travel).13
The world has already warmed by 1.0°C above pre-industrial levels due
to human activities and is experiencing related impacts.
+1°C / 2017 +1.5°C / 2030 - 2052
At the current rate of warming of 0.2°C per decade, global warming will reach 1.5°C
between 2030 and 2052.

Figure 1. Limiting Global Warming to 1.5°C Depends on Limiting Both Cumulative CO2 Emissions and Future Non-CO2 Emissions
Figure 1 | At the present rate of warming, global temperatures are projected to reach 1.5°C around 2040. As modeled here, keeping temperatures to 1.5°C by the end of the century requires reducing CO2 emissions to net zero and reducing future emissions of non-CO2 radiative forcers (i.e., agents such as methane, fluorocarbons, and nitrous oxide that influence how much heat is absorbed by Earth versus being radiated back to space). CO2 is long-lived in the atmosphere, and it has a cumulative effect on climate change over a long time span. Non-CO2 radiative forcers are typically shorter-lived, but may also have a greater climate impact than CO2 in the short term. The faster emissions are reduced, the higher the probability of global temperatures being kept to 1.5°C by the end of the century. At the time that net zero emissions are reached, the cumulative CO2 emissions in the atmosphere will determine the amount of warming the world will experience. There are three scenarios modeled above:
The grey plume shows the likely7 range of warming if CO2 emissions decline from 2020 to hit net zero in 2055 (corresponds to the grey lines in 1b and 1c). This scenario also requires that net non-CO2 radiative forcing stays on its current path until 2030 and then declines (corresponds to grey line in panel 1d).
The blue plume shows the implications of faster CO2 reductions that reach net zero in 2040 (corresponds to the blue line in 1b), which results in overall lower cumulative CO2 emissions (blue line in 1c). Under this scenario, faster CO2 reductions means a higher probability of limiting warming to 1.5°C.
The purple plume shows CO2 emissions declining to net zero by 2055, but no reduction of non-CO2 radiative forcing after 2030 (corresponds to the purple line in graph D). This results in a lower probability of limiting warming to 1.5°C.
Source: Modified from SR1.5, Summary for Policymakers Figure SPM.1
3 000
2 000
1 000
0
3
2
1
0
1a. Observed and projected global temperature change based on different emissions scenarios
Observed monthly global mean surface temperature
Estimated anthropogenic
warming to date and likely range
Global warming relative to 1850-1900 (°C)
CO2 emissions decline from 2020 to reach net zero in 2055 or 2040
Cumulative CO2 emissions in pathways reaching net zero in 2055 and 2040
Non-CO2 radiative forcing or
1980 2020 2060 2100 1980 2020 2060 2100
1.5
1b. Stylized net global CO2 emission pathways Billion tonnes CO2 per year (GtCO2/yr)
Faster immediate CO2 emission reductions limit cumulative CO2 emissions shown in panel (c).
Maximum temperature rise is determined by cumulative net CO2 emissions and net non-CO2 radiative forcing due to methane, nitrous oxide, aerosols and other anthropogenic forcing agents.
1c. Cumulative net CO2 emissionsBillion tonnes CO2 (GtCO2)
1d. Non-CO2 radiative forcing pathwaysWatts per square metre (W/m2)
60
50
40
30
20
10
01980 2020 2060 2100
1960 1980 2000 2020
2017
2040 2060 2080 2100
2.0
1.0
0.5
0
The orange dashed line beginning at 2017 indicates that if current rates of warming continue, the world will reach 1.5°C around 2040. The orange horizontal bar indicates the likely range (between 2030 and 2052)
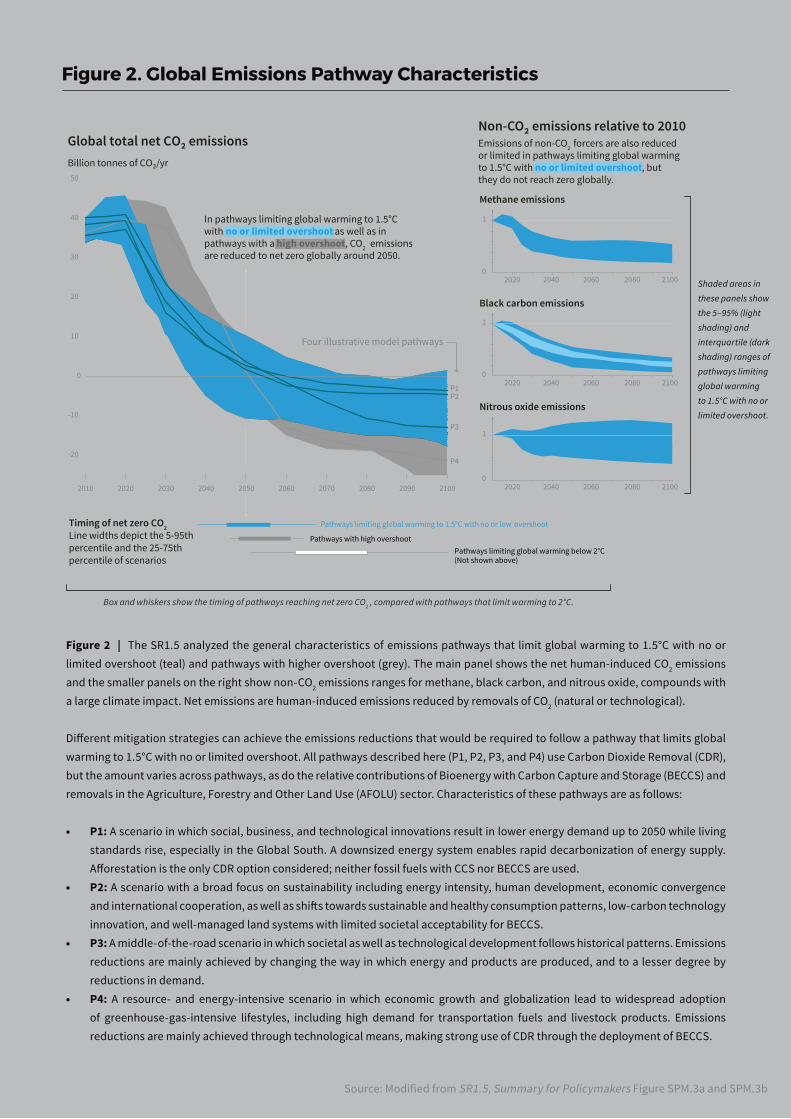
Figure 2. Global Emissions Pathway Characteristics
2010 2020 2030 2040 2050 2060 2070 2080 2090 2100
-20
-10
0
10
20
30
40
50
Black carbon emissions
Nitrous oxide emissions
Methane emissions
Emissions of non-CO2 forcers are also reduced or limited in pathways limiting global warming to 1.5°C with no or limited overshoot, but they do not reach zero globally.
Non-CO₂ emissions relative to 2010
Billion tonnes of CO₂/yr
2020 2040 2060 2080 21000
1
2020 2040 2060 2080 21000
1
2020 2040 2060 2080 21000
1
Four illustrative model pathways
In pathways limiting global warming to 1.5°C with no or limited overshoot as well as in pathways with a high overshoot, CO2are reduced to net zero globally around 2050.
P1P2
P3
P4
Pathways with high overshootPathways limiting global warming below 2°C(Not shown above)
Pathways limiting global warming to 1.5°C with no or low overshoot
Global total net CO₂ emissions
Timing of net zero CO2Line widths depict the 5-95th percentile and the 25-75th percentile of scenarios
Figure 2 | The SR1.5 analyzed the general characteristics of emissions pathways that limit global warming to 1.5°C with no or limited overshoot (teal) and pathways with higher overshoot (grey). The main panel shows the net human-induced CO2 emissions and the smaller panels on the right show non-CO2 emissions ranges for methane, black carbon, and nitrous oxide, compounds with a large climate impact. Net emissions are human-induced emissions reduced by removals of CO2 (natural or technological).
Different mitigation strategies can achieve the emissions reductions that would be required to follow a pathway that limits global warming to 1.5°C with no or limited overshoot. All pathways described here (P1, P2, P3, and P4) use Carbon Dioxide Removal (CDR), but the amount varies across pathways, as do the relative contributions of Bioenergy with Carbon Capture and Storage (BECCS) and removals in the Agriculture, Forestry and Other Land Use (AFOLU) sector. Characteristics of these pathways are as follows:
• P1: A scenario in which social, business, and technological innovations result in lower energy demand up to 2050 while living standards rise, especially in the Global South. A downsized energy system enables rapid decarbonization of energy supply. Afforestation is the only CDR option considered; neither fossil fuels with CCS nor BECCS are used.
• P2: A scenario with a broad focus on sustainability including energy intensity, human development, economic convergence and international cooperation, as well as shifts towards sustainable and healthy consumption patterns, low-carbon technology innovation, and well-managed land systems with limited societal acceptability for BECCS.
• P3: A middle-of-the-road scenario in which societal as well as technological development follows historical patterns. Emissions reductions are mainly achieved by changing the way in which energy and products are produced, and to a lesser degree by reductions in demand.
• P4: A resource- and energy-intensive scenario in which economic growth and globalization lead to widespread adoption of greenhouse-gas-intensive lifestyles, including high demand for transportation fuels and livestock products. Emissions reductions are mainly achieved through technological means, making strong use of CDR through the deployment of BECCS.
Source: Modified from SR1.5, Summary for Policymakers Figure SPM.3a and SPM.3b
Shaded areas in
these panels show
the 5–95% (light
shading) and
interquartile (dark
shading) ranges of
pathways limiting
global warming
to 1.5°C with no or
limited overshoot.
Box and whiskers show the timing of pathways reaching net zero CO2 , compared with pathways that limit warming to 2°C.

Exceeding the 1.5°C global warming limit, even if only temporarily, will lead us into a highly uncertain world. Such an overshoot will push a number of natural and human systems beyond their limits of adaptation and into possible futures about which we have limited scientific knowledge and no institutional or governance experience.
The world beyond 1.5°C
Summary for Urban Policymakers
11 // 30
Drought frequency and intensity could increase in many regions, including the Mediterranean and Southern Africa.23
y Food insecurity increases at 2.0°C compared with 1.5°C.24 The risk of malnutrition in already stressed regions — including those within, for example, Southern Africa, South-East Asia, and South America — is expected to rise due to projected impacts on crop nutrition content and yield and livestock. Vital fisheries and aquaculture face increasing risk from ocean warming, acidification, and climate impacts in deltas and coastal zones.25
y Natural systems degrade substantially at higher global temperatures with expected irreversible impacts on some species and ecosystems. The number of insect species projected to lose their habitat, for example, is tripled at 2.0°C compared with 1.5°C. The number of plant species projected to lose their habitat is doubled. Ninety-nine percent of all corals would be lost at 2.0°C, while more than 10% of existing coral have a chance of surviving if temperatures stabilise at 1.5°C.26 Ecosystem loss has repercussions for regional and global food security, forests, and water systems.
y There are impacts at 2.0°C compared with 1.5°C about which we still have significant knowledge gaps. These include effects at the local level, as well as linkages between climate risks, poverty, equity, and well-being. The scientific community and local, regional and national levels of government could help fill these gaps and enable local action through research and better access to high-quality, relevant data.
Possible Impacts
Exceeding the 1.5°C global warming limit, even if only temporarily, will lead us into a highly uncertain world. Such an overshoot will push a number of natural and human systems beyond their limits of adaptation14 and into possible futures about which we have limited scientific knowledge and no institutional or governance experience. Temporarily exceeding the 1.5°C limit will disrupt basic social and economic activities around the world with much of the population in the Global South suffering the most extreme consequences.15 Some human and natural systems (e.g., coral reefs) will be unable to adapt to these temperatures and their many implications.16
The 2015 Paris Agreement marked an historic step in global coordination on climate adaptation and mitigation. Yet the current global commitments are not sufficient to prevent temperature rise above 2.0°C, let alone 1.5°C. Estimates of average temperature increases under current national commitments range from 2.9°C to 3.4°C relative to preindustrial levels by the end of the century.17
The impacts of the average temperature warming by more than 1.5°C are clear and specific:
y Human death and illness are expected to increase in pathways with warming greater than 1.5°C due to risks directly attributable to climate change, such as: exacerbated urban heat islands, amplification of heat waves, extreme weather volatility, floods, droughts, coastal inundation, and an increase in vector-borne diseases like malaria and dengue fever.18
y Limiting global warming to 1.5°C versus 2.0°C could reduce the population exposed to climate risks and related poverty by as much 457 million people.19 Relatedly, migration from already marginal agriculture-dependent communities could increase as temperatures rise and water stress increases.20 Some cities are experiencing migration from rural areas that are already experiencing 1.5°C warming.21
y Water stress increases at 2.0°C versus 1.5°C. Though there will be considerable variation by region, the overall global population suffering water scarcity at 2.0°C is projected to be double that at 1.5°C.22

Figure 3 | Various natural and human systems will feel the impacts of global warming at different temperature levels. For example, at current levels of warming – around 1.0°C – there is already evidence of severe and widespread effects on warm water corals. Because cities and their residents rely on managed and natural ecosystems for necessities including food, trade, or economic development and protection from natural forces; climate impacts across many sectors and systems will be felt by urban centers around the world.
The impact/risk assessments outlined above are based on existing literature, which content experts used to evaluate temperatures at which levels of impact and/or risk are very high (VH), high (H), moderate (M), or undetectable. Note that risk is the probability of something happening while impact is the outcome of climate change on a sector/system.
The selection of systems is not intended to be comprehensive, but rather illustrative of a variety of systems that are affected by global warming.
Figure 3. Impacts and Risks to Select Natural and Human Systems at Different Levels of Global Warming
Risk is the probability of something happening (e.g., loss of coral reefs) while impact is the outcome of climate change on a sector/system.
0
1.0
1.5
2.0
Glob
al m
ean
surfa
ce te
mpe
ratu
re ch
ange
re
lativ
e to
pre
-indu
stria
l lev
els (
oC)
Purple indicates very high risks of severe impacts/risks and the presence of significant
irreversibility or the persistence of climate-related hazards, combined with limited ability to adapt
due to the nature of the hazard or impacts/risks.
Yellow indicates that impacts/risks are detectable and attributable to climate change
with at least medium confidence.
Red indicates severe and widespread impacts/risks.
Heat-related morbidity
and mortality
Level of additionalimpact/risk due
to climate change
Warm water corals
Terrestrialecosystems
Tourism
2006-2015
HVH
VH
M
H
M
H
H
H
M
H
H
M
M
H
M
H
M
H
M
H
M
H
Impacts and risks for selected natural, managed and human systems
Confidence level for transition: L=Low, M=Medium, H=High and VH=Very high
Mangroves Small scale low latitude
fisheries
Arcticregion
Coastal flooding
Fluvial flooding
Crop yields
White indicates that no impacts are detectable and attributable to climate change.
Undetectable
Moderate
High
Very high
Source: Modified from SR1.5, Summary for Policymakers Figure SPM.2
Summary for Urban Policymakers
13 // 30
Routes Forward
There is no historical precedent for the scale of socio-cultural, economic, and technological change needed to limit warming to 1.5°C, but routes forward are emerging.27 Regarding both mitigation and adaptation, there are actions to be taken immediately by cities and governments at all levels, as well as by urban residents and stakeholders, such as civil society, the academic community, and those in business and finance.
Adaptation pathways describe how people, communities, and systems adapt in a dynamic, iterative, and flexible manner to the impacts of climate change. Because the impacts of 1.5°C will be felt differentially across systems, sectors, and geographies, those adaptation pathways will also vary. Implementing adaptation policies will
require addressing vulnerabilities based on political, economic, social, and cultural factors. This will require local knowledge and an understanding of the varied stakeholders. As such, pathways are often context-specific and require a range of expertise.28
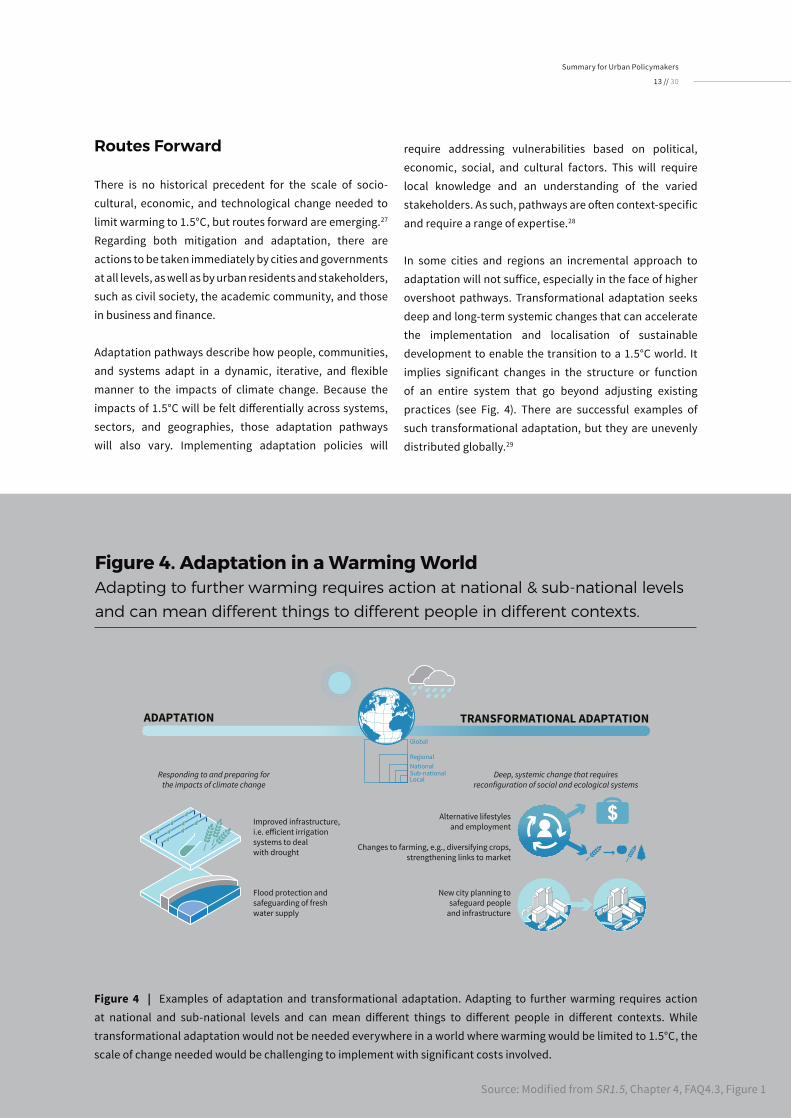
In some cities and regions an incremental approach to adaptation will not suffice, especially in the face of higher overshoot pathways. Transformational adaptation seeks deep and long-term systemic changes that can accelerate the implementation and localisation of sustainable development to enable the transition to a 1.5°C world. It implies significant changes in the structure or function of an entire system that go beyond adjusting existing practices (see Fig. 4). There are successful examples of such transformational adaptation, but they are unevenly distributed globally.29
Improved infrastructure, i.e. efficient irrigation systems to deal with drought
Global
RegionalNationalSub-nationalLocal
Responding to and preparing for the impacts of climate change
Deep, systemic change that requires reconfiguration of social and ecological systems
Flood protection and safeguarding of fresh water supply
Alternative lifestylesand employment
Changes to farming, e.g., diversifying crops, strengthening links to market
New city planning to safeguard people
and infrastructure
TRANSFORMATIONAL ADAPTATIONADAPTATION
$
Figure 4. Adaptation in a Warming WorldAdapting to further warming requires action at national & sub-national levels
and can mean different things to different people in different contexts.
Figure 4 | Examples of adaptation and transformational adaptation. Adapting to further warming requires action at national and sub-national levels and can mean different things to different people in different contexts. While transformational adaptation would not be needed everywhere in a world where warming would be limited to 1.5°C, the scale of change needed would be challenging to implement with significant costs involved.
Source: Modified from SR1.5, Chapter 4, FAQ4.3, Figure 1
Summary for Urban Policymakers
14 // 30
In order for 1.5°C-consistent pathways to be feasible, enabling conditions must be created that allow for transformational systemic change to energy, land and ecosystems, urban and infrastructure, and industrial systems. These conditions are not determined by any single organization, government, or level of government. They must be the product of actions by and between international organizations, countries, regions, cities, and a wide array of stakeholders.30
The actions of individuals, households, and organisations influence the feasibility of 1.5°C-consistent pathways. Reducing vulnerability and exposure, facilitating universal access to basic services and safe housing, and taking precautionary actions like investing in climate insurance can facilitate adaptation at the local level. This is true for
mitigation as well.31 For instance, the uptake of renewable energy sources, low emission technology, and energy efficient appliances can mitigate emissions, as can reduced energy use, and dietary changes (particularly reducing meat and dairy consumption).32
All 1.5°C-consistent pathways require action in and by cities, often in partnership with regional and national governments. Officials and stakeholders can enable adaptation and mitigation actions while furthering sustainable development. The multiple pathways to the future will be determined in no small part by the actions of engaged officials and stakeholders who can influence urban economies, urban form and infrastructure, the critical connectivity between urban and rural areas, and behavioural choices.
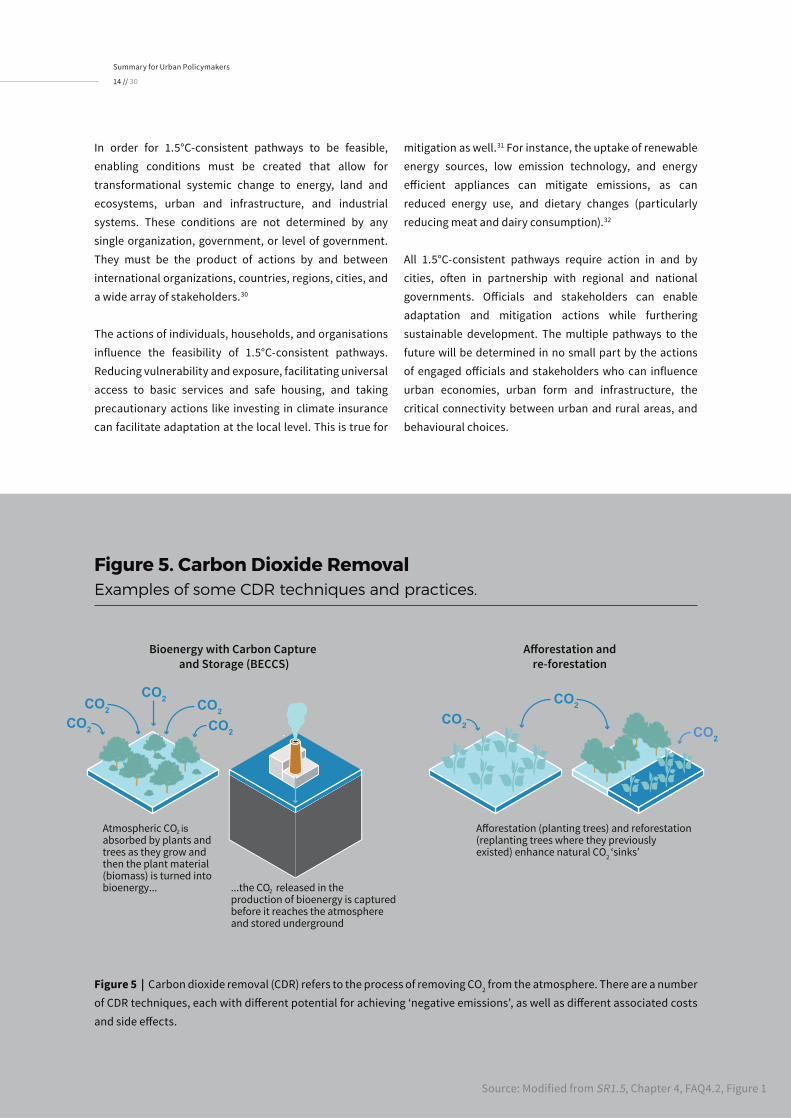
Atmospheric CO2 is absorbed by plants and trees as they grow and then the plant material (biomass) is turned into bioenergy...
Afforestation (planting trees) and reforestation (replanting trees where they previously existed) enhance natural CO2 ‘sinks’
...the CO2 released in the production of bioenergy is captured before it reaches the atmosphere and stored underground
CO2
CO2
CO2 CO2
CO2
CO2 CO2
Bioenergy with Carbon Capture and Storage (BECCS)
Afforestation andre-forestation
CO2
CO2
CO2
Figure 5. Carbon Dioxide RemovalExamples of some CDR techniques and practices.
Figure 5 | Carbon dioxide removal (CDR) refers to the process of removing CO2 from the atmosphere. There are a number of CDR techniques, each with different potential for achieving ‘negative emissions’, as well as different associated costs and side effects.
Source: Modified from SR1.5, Chapter 4, FAQ4.2, Figure 1

Summary for Urban Policymakers
15 // 30CHAPEL HILL, UNITED STATES
Curbing global warming to 1.5°C will require rapid advancements in how societies develop and navigate transitions in four systems: energy, land and ecosystems, urban and infrastructure, and industry. The urban system, and urbanisation, is a factor in each of the other necessary system transitions. Pursuit of transitions in these four systems will require urban expertise, multi-level governance, and an understanding of the critical interdependencies between urban, peri-urban, and rural areas. The Fifth Assessment Report of the IPCC contained text and literature necessary to help fully grasp the role urban issues will play in curbing warming to 1.5°C, and is cited to complement the SR1.5 content.
The Necessary Transitions
Urban areas are home to more than fifty percent of the world’s population and are the site of most of its built assets and economic activity.33 By 2050, the population in urban areas is expected to increase by 2.5 to 3 billion and comprise two-thirds of the world population.34 For the next three decades, nearly seventy million residents will move to urban areas every year. The majority of these new residents will live in small- to medium-sized cities in the developing world.35
II. WHY DO CITIES MATTER?
Summary for Urban Policymakers
16 // 30
The anticipated growth in urban population will require extensive (re-)construction of urban infrastructure and buildings. On average, urban land cover is expanding at twice the rate of urban population growth.36 Without deliberate policy interventions to curb urban sprawl, the expected increase in urban areas during the first thirty years of the 21st century will exceed that of all human history, with consequent impacts on emissions.37
Urban expansion will be a key determinant of emissions across multiple sectors. Such growth can also be the catalyst for adopting new technologies, buildings, and infrastructure that have low or near zero-emissions and are adapted to expected future climate change. Early action in this space is important and cost-effective as the long service life of infrastructure and buildings makes them prone to energy and emissions lock-in that are more expensive to change.38
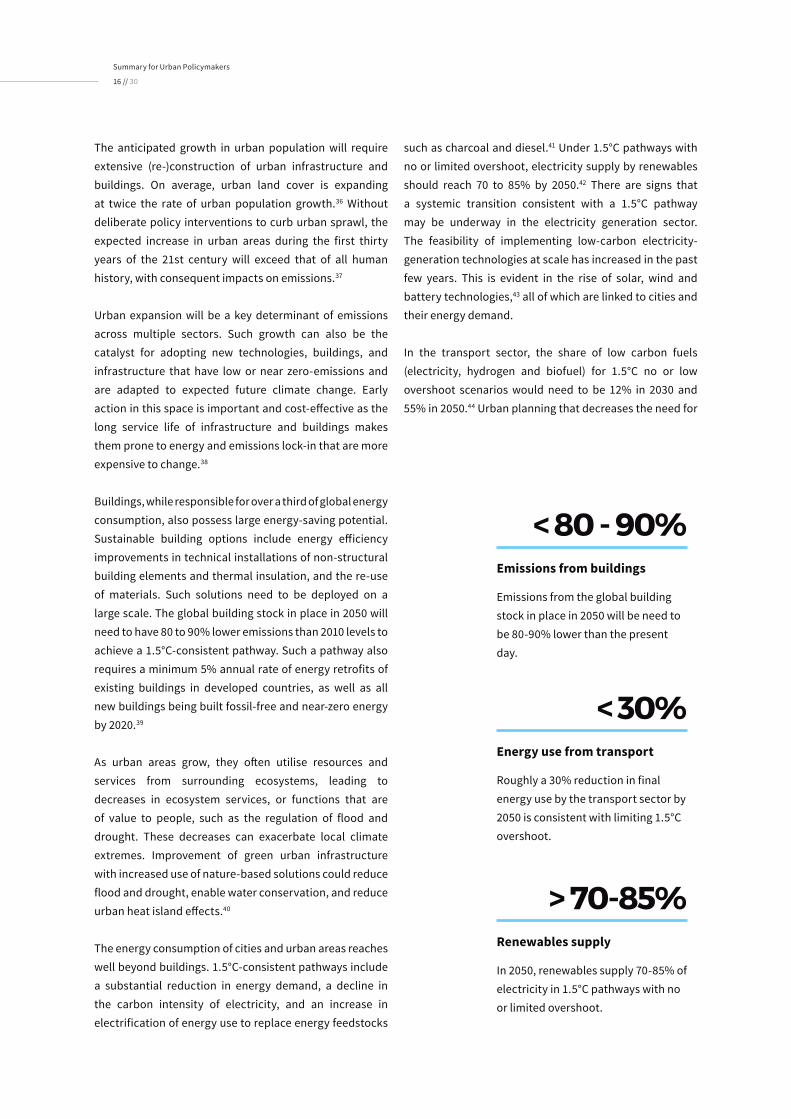
Buildings, while responsible for over a third of global energy consumption, also possess large energy-saving potential. Sustainable building options include energy efficiency improvements in technical installations of non-structural building elements and thermal insulation, and the re-use of materials. Such solutions need to be deployed on a large scale. The global building stock in place in 2050 will need to have 80 to 90% lower emissions than 2010 levels to achieve a 1.5°C-consistent pathway. Such a pathway also requires a minimum 5% annual rate of energy retrofits of existing buildings in developed countries, as well as all new buildings being built fossil-free and near-zero energy by 2020.39
As urban areas grow, they often utilise resources and services from surrounding ecosystems, leading to decreases in ecosystem services, or functions that are of value to people, such as the regulation of flood and drought. These decreases can exacerbate local climate extremes. Improvement of green urban infrastructure with increased use of nature-based solutions could reduce flood and drought, enable water conservation, and reduce urban heat island effects.40
The energy consumption of cities and urban areas reaches well beyond buildings. 1.5°C-consistent pathways include a substantial reduction in energy demand, a decline in the carbon intensity of electricity, and an increase in electrification of energy use to replace energy feedstocks
such as charcoal and diesel.41 Under 1.5°C pathways with no or limited overshoot, electricity supply by renewables should reach 70 to 85% by 2050.42 There are signs that a systemic transition consistent with a 1.5°C pathway may be underway in the electricity generation sector. The feasibility of implementing low-carbon electricity-generation technologies at scale has increased in the past few years. This is evident in the rise of solar, wind and battery technologies,43 all of which are linked to cities and their energy demand.
In the transport sector, the share of low carbon fuels (electricity, hydrogen and biofuel) for 1.5°C no or low overshoot scenarios would need to be 12% in 2030 and 55% in 2050.44 Urban planning that decreases the need for
Emissions from the global building stock in place in 2050 will be need to be 80-90% lower than the present day.
Emissions from buildings
< 80 - 90%
Roughly a 30% reduction in final energy use by the transport sector by 2050 is consistent with limiting 1.5°C overshoot.
Energy use from transport
< 30%
In 2050, renewables supply 70-85% of electricity in 1.5°C pathways with no or limited overshoot.
Renewables supply
> 70-85%
Summary for Urban Policymakers
17 // 30
carbon-intensive transportation in the long-term—such as compact, pedestrianised cities and towns—plays an important role in limiting future emissions. Such planning, coupled with policies that encourage improved fuel efficiency; zero emission vehicles; and modal shifts toward walking, cycling, public transport, and shorter commute distances, is key to decarbonisation. Key co-benefits of reducing the carbon intensity of transport in cities include reduced air pollution, congestion and road fatalities, and improved health outcomes from more active travel and cleaner air.45
The urban and industrial systems are intertwined through a number of connections and interdependencies, including economic activity, tax income and employment. The necessary materials for mobility, housing, buildings, and food all create connections and dependencies between cities and industry. An industrial-urban symbiosis often exists when urban areas are connected to industrial parks and/or clusters within their boundaries, for example, through the exchange of heat, waste, materials, or water.46 Increased rates of materials recycling and the substitution of high-carbon intensity products with those made up of renewable materials could advance industrial transitions in urban areas.47
If overshoot happens, cities, working with peri-urban and rural areas, would need to go beyond these systems transitions to become sites for CDR (see Fig. 5). This would require cities to become sinks for carbon and use various technologies to absorb and sequester carbon. This would also require more planting of urban forests, organic urban agriculture, and much greater use of sustainably-sourced wood in construction. Natural systems such as coastal, wetland, and river systems would also need to be employed to sequester carbon.48
Urban adaptation may also be accelerated by greater emphasis on ecosystem-based adaptation, green infrastructure, and the use of natural systems to sequester carbon in urban areas.49 Green infrastructure in particular can have adaptation and mitigation co-benefits. The context-appropriate development of green spaces, protecting ecosystem services and developing nature-based solutions, can increase the set of available urban adaptation options.50
Technological innovations and
lifestyle changes
Existing technological innovations can be deployed to limit global warming. For example, enabling smart-grids and shared micro-grid technologies while at the same time creating public awareness of the environmental impact of energy choices may help shift carbon-intensive energy consumption patterns. Such options can be deployed relatively quickly and at scale. Their effects can be amplified by the density of cities and urban areas.51
New technologies can similarly be used to shift consumption and resource-use patterns. In the transit sector, for example, information and communication technologies (ICT) can optimize public transportation efficiency, enable vehicle sharing, and decrease idling or parking requirements.52 Enabling new technologies to take hold, however, often requires policies that combine support for research and development, incentives for market uptake, and cooperation between governments and enterprises.53
Certain urban lifestyle choices, like walking and cycling, can lower energy demand and enable emissions reductions while facilitating sustainable development. Commitment and coordination will be needed to overcome socio-cultural, environmental, market, and economic barriers to far-reaching behaviour change.
There are sizable co-benefits from emission reductions, including higher productivity and job creation, better health and life expectancy for citizens, improved air quality, more walkable and livable cities, and lower vulnerability and greater resilience to extreme events, including fires, floods, and hurricanes.54
Urban action and policy must serve as an accelerant for transitions in energy and industrial systems, land, and ecosystems. Limiting global warming to 1.5°C thus turns, at least in part, on the feasibility of urban actions and policies. The experiences of cities and regions that have successfully navigated some of these systems transitions could be used as an example for cities that are preparing and planning for them. But with increasing urbanisation, ongoing urban-rural linkages, and the nature of the four systems themselves, no transition required to curb warming to 1.5°C can happen in isolation.

Summary for Urban Policymakers
18 // 30SEOUL, SOUTH KOREA
Time is running short. Despite the ongoing work by many city governments, NGOs, and networks,55 and the recent rapid mobilisation of new technologies and innovative practices, the long delay in transformational climate action since the launch of the UNFCCC in 1992 has dramatically reduced the implementation window to limit warming to 1.5°C.
The SR1.5 recognises that there is no simple ‘yes‘ or ‘no’ answer to the feasibility of limiting warming to 1.5°C. The feasibility of adaptation and mitigation options deployed in pursuit of 1.5°C-consistent pathways will depend on
geophysical, environmental, ecological, technological, economic, social, cultural, and institutional factors.56 The process of urban leaders evaluating any proposed action (including the factors mentioned above) is done through a multi-dimensional feasibility assessment, while the evaluation of synergies and trade-offs identifies the resulting positive and negative effects of any such action or policy priorities.
Cities have the potential to aggregate these factors in ways that enhance the feasibility of 1.5°C pathways.57 Examples of urban mitigation options that currently display high
III. IS THE URBAN TRANSITION FEASIBLE?

Summary for Urban Policymakers
19 // 30
multi-dimensional feasibility include: solar photovoltaics and wind associated with battery storage; bioenergy; energy efficiency; efficient appliances; electric vehicles, better public transport, and local shared mobility; non-motorised transport; low-energy buildings; reduced food wastage; ecosystem restoration; and more sustainable land-use and urban planning.58
A number of urban adaptation options also have high multi-dimensional feasibility. These include conservation agriculture, efficient irrigation, green infrastructure and ecosystem services, community-based adaptation, and appropriate building codes and standards.59
Positive synergies, such as increased cost-effectiveness, can be found as a result of combining adaptation and mitigation options. For example, reforestation, urban and spatial planning, and land and water management are options that can enhance both climate change mitigation and adaptation. On the other hand, multiple tradeoffs can limit the speed of and potential for scaling up. Urban densification, for example, may enhance mitigation by reducing emissions, but increase adaptation challenges by intensifying heat island effects and inhibiting restoration of local ecosystems.60
The potential for 1.5°C-consistent pathways differs between and within regions and nations due to different development contexts and starting points. The seventeen Sustainable Development Goals (SDGs) agreed to by nations in 2015 as part of the 2030 Agenda for Sustainable Development provide another way to assess synergies and trade-offs between pathways and sustainable development. Most pathways have robust synergies with the SDGs of health, clean energy, cities and communities, and sustainable consumption and production (SDGs 3, 7, 11, and 12, respectively). However, some of the mitigation options that might be deployed within 1.5°C-consistent pathways could have negative impacts on the SDGs of poverty (1), hunger (2), and water (6) and can create risks for development, especially in economies that are primarily dependent on fossil fuels.61
Knowledge gaps exist for the feasibility of individual adaptation and mitigation options. They also remain around the feasibility of pathways, which comprise multiple individual options that interact through synergies and trade-offs. When feasibility assessments are localised, they can assist national and local governments in developing a pragmatic action plan to join up adaptation and mitigation action.62
Multi-dimensional feasibility
The SR1.5 recognises that there is no simple ‘yes‘ or ‘no’ answer to the feasibility of limiting warming to 1.5°C. The feasibility of adaptation and mitigation options deployed in pursuit of 1.5°C-consistent pathways will depend on geophysical, environmental, ecological, technological, economic, social, cultural, and institutional factors. The process of urban leaders evaluating any proposed action (including the factors mentioned above) is done through a multi-dimensional feasibility assessment, while the evaluation of synergies and trade-offs identifies the resulting positive and negative effects of any such action or policy priorities.

ABSENCE OF BARRIERS NO EFFECT POTENTIAL BARRIERS INSUFFICIENT LITERATURE
Barriers to feasibility
Figure 6. Feasibility Assessment of Urban-Relevant Adaptation Options
ENERGY SYSTEM TRANSITIONS
Power infrastructure,
including water
Depends on existing power infrastructure, all generation sources and with intensive water requirements.
URBAN & INFRASTRUCTURE SYSTEM TRANSITIONS
Sustainable land-use &
urban planning
Depends on nature of planning systems and enforcement mechanisms.
Sustainable water
management
Balancing sustainable water supply and rising demand especially in low-income countries.
Green infrastructure
& ecosystem services
Depends on reconciliation of urban development with green infrastructure.
Building codes & standards
Adoption requires legal, educational, and enforcement mechanisms to regulate buildings.
Disaster risk management
Requires institutional, technical, and financial capacity in frontline agencies and government.
INDUSTRIAL SYSTEM TRANSITIONS
Intensive industry
infrastructure resilience
& water management
Depends on intensive industry, existing infrastructure and using or requiring high demand of water.
ECONOMIC
ADAPTATION
OPTIONSYSTEM
TECHNOLOGICAL
INSTITUTIONAL
SOCIO-CULTURAL
ENVIRONMENTAL
GEOPHYSICAL
CONTEXT
Figure 6 & 7. Feasibility Assessment of Urban-Relevant Adaptation and Mitigation Options
The SR1.5 provided detailed feasibility assessments, using a similar frame and a common method. This is the first time that such a climate feasibility assessment has been attempted and is an important step forward to support implementation. When localised, this global feasibility assessment can assist national and local governments do the following: identify key options that can enable system transitions, begin prioritising implementation actions for feasible options, identify conditions that will enable accelerated implementation, and identify synergies and trade-offs between adaptation and mitigation, which can support a pragmatic action plan. It can also help define knowledge gaps and hence priorities for action research.
The feasibility assessment used three steps to assess the multi-dimensional feasibility of 1.5°C-relevant mitigation and adaptation options that have seen considerable development since 2014.
y First, each mitigation and adaptation option was assessed along relevant indicators grouped around six feasibility dimensions: economic, technological, institutional, socio-cultural, environmental/ ecological, and geophysical.
y Second, for each option, the overall feasibility for each of the dimensions was assessed as the mean of the combined scores of the relevant underlying indicators. These were classified into four groups, each with a distinctive colour shading. Dark shading indicates few feasibility barriers; moderate shading indicates some barriers; and light shading indicates that multiple barriers may block implementation for a particular feasibility dimension. No shading means there is insufficient literature available to make an assessment. The context column indicates how the assessment might change if contextual factors are different.
y Third, a three-step process of independent validation by authors was undertaken to make this assessment as robust as possible.
Source: Modified from SR1.5, Chapter 4, Table 4.12

ABSENCE OF BARRIERS NO EFFECT POTENTIAL BARRIERS INSUFFICIENT LITERATURE
Barriers to feasibility
ENERGY SYSTEM TRANSITIONS
Solar PVCost-effectiveness affected by solar irradiation and incentive regime.
Bioenergy
Depends on availability of biomass such as municipal solid waste and capability to collect it. Distributional effects depend on the agrarian (or other) system used to produce feedstock.
Electricity storage
Batteries universal but grid flexible resources vary with area’s level of development.
LAND & ECOSYSTEM TRANSITIONS
Reduced food wastage &
efficient food production
Will depend on the combination of individual and institutional behaviour.
Dietary shiftsDepends on individual behaviour, education, cultural factors and institutional support.
URBAN & INFRASTRUCTURE SYSTEM TRANSITIONS
Land-use & urban planning
Varies with urban fabric, not geography or economy; requires capacitated local government and legitimate tenure system.
Electric cars and buses
Varies with degree of government intervention; requires capacity to retrofit ‘fuelling’ stations.
Sharing schemes
Historic schemes and universal new ones depend on ICT status; undermined by high crime and low levels of law enforcement.
Public transport
Depends on presence of existing ‘informal’ taxi systems, which may be more cost effective and affordable than capital intensive new build schemes, as well as local government capabilities.
Non-motorised transport
Viability rests on linkages with public transport, cultural factors, climate and geography.
Aviation & shipping
Varies with technology, governance and accountability.
Smart GridsVaries with economic status and presence or quality of existing grid.
Efficient appliances
Adoption varies with economic status and policy framework.
Low/zero-energy buildings
Depends on size of existing building stock and growth of building stock.
INDUSTRIAL SYSTEM TRANSITIONS
Energy efficiency
Potential and adoption depends on existing efficiency, energy prices and interest rates, as well as government incentives.
Bio-based & circularity
Faces barriers in terms of pressure on natural resources and biodiversity. Product substitution depends on market organisation and government incentivisation.
ECONOMIC
MITIGATION
OPTIONSYSTEM
TECHNOLOGICAL
INSTITUTIONAL
SOCIO-CULTURAL
ENVIRONMENTAL
GEOPHYSICAL
CONTEXT
Source: Modified from SR1.5, Chapter 4, Table 4.11
Figure 7. Feasibility Assessment of Urban-Relevant Mitigation Options
Summary for Urban Policymakers
22 // 30CHEFCHAOUEN, MOROCCO
Scaling up climate action requires implementing policies and enhanced access to innovation, technology, and financing. Realising these enabling conditions without exacerbating economic, social, and political challenges requires improved governance and much stronger institutional capacities across the world.63
Policies and Engagement
Limiting global warming to 1.5°C will require effective governance frameworks. Such frameworks must include
accountable multi-level governance with participation from cities and urban areas, regions, industry, civil society, and scientific institutions. Effective multi-level governance enables local adaptive and mitigation capacity.64 Policies under effective governance frameworks are coordinated across sectors to enable collaborative multi-stakeholder partnerships. Improved climate education and increased public awareness, as well as arrangements to enable accelerated behaviour change, can support such frameworks. Local action and participatory processes are most effective when 1) aligned with sustainable development, 2) aligned with what people value in their
IV. HOW CAN THE URBAN TRANSITION BE ENABLED?

Summary for Urban Policymakers
23 // 30
locality, and 3) when local and regional governments are supported by national governments.
Local governments have coordinated and developed effective local responses by ensuring community engagement, including minorities, in participatory decision-making.65 However, this coordination is limited by institutional capacity, which is an even greater challenge at the city level than at the national government level. Non-state actors such as civil society and international funding agencies, among others, have set up several transnational climate governance initiatives that share experiences to accelerate climate responses and to draw economic and development benefits from them. Membership in climate networks, national and transnational city networks, and knowledge networks is a driver of mitigation and adaptation plans in cities.66 Strong political leadership and agency can overcome barriers to policy implementation and conflicting interests, particularly when supported by citizens and civil society.67
Implementing 1.5°C-relevant strategies requires well-functioning legal frameworks together with clearly defined mandates, rights, and responsibilities.68 Lack of institutional capacity for effective land-use planning and infrastructure development, for example, can result in unplanned, informal urban settlements that are vulnerable to climate impacts. However, such settlements provide the opportunity to choose climate resilient and low-carbon structures, as they are not yet locked in to high emissions infrastructure.69 Independent institutions that monitor, report, and review progress on implementation of climate policy can further enable transition to a low-emission world.70
Transitioning urban systems to a lower-carbon intensity and more climate resilient future can be enabled through accelerated technological innovation, deployment, and upkeep. Cities are often convergence points for technological, behavioural, and institutional experiments. Such innovation can cut across sectors and scales of governance.71 Policy mixes at a community or provincial level, for example, not merely at the national level, are especially effective in addressing climate innovation challenges.72 This applies to utilizing ready-to-use technologies as well as those in earlier stages of development. Governments can avoid ‘picking winners’ by developing a portfolio of technological options and by collaborating more broadly with the industrial sector and society, including cities, which can be testing grounds
of different social, institutional, and technological innovations.73
GHG emission reductions can be enabled by the rapid progress of general purpose technologies to include ICT, artificial intelligence, the Internet-of-Things, nanotechnologies, biotechnologies, and robotics. This can include initiatives by and with the private sector. Incentivising consumers to own or purchase cars, however, could increase GHG emissions and exacerbate other health and environmental problems. Urban planning policies, technology standards, efficiency regulations, and carbon taxes can help limit such increases. The deployment of general purpose technologies in mass or non-motorised transit systems can also limit an uptake in car use.74
Technology development and transfer is most effective when adapted to local circumstances.75 New technologies are often demonstrated in cities. Technology transfer can reduce financing costs, encourage indigenous technology, and improve abilities to to operate, adapt and innovate technology globally. The cost of mitigation can be lessened and contributions increased, especially from developing countries, via international technology cooperation.76
Political cycles present a challenge to action, and mandates matter. Public acceptance can enable or prevent policy and system changes. The public’s perceived fairness of the decision-making process and the expected consequences of policies or changes has an important effect on this acceptance. Effective policy trials, including at the urban level, can build public support for climate policy, as can city networks.77
Individual climate action is driven by multiple motivations. Individuals not only consider the financial consequences of actions, but are also motivated by positive social, emotional and collective consequences. Social influence strategies, community approaches, and tailored information and feedback provision can enhance an individual’s motivation to act. Policy approaches fall short of their true potential when their psychological implications are overlooked and when no account is taken of citizen’s values, worldviews, and ideologies.78

Summary for Urban Policymakers
24 // 30
No single approach to financing can reach the investment level necessary to limit warming to 1.5°C. The scale of necessary investments is well the beyond fiscal capacity of countries most at risk, let alone cities.
While cities produce about three-fourths of global economic output, their resource bases often remain weak. Current intergovernmental fiscal arrangements place most tax authority and revenue in the hands of national or provincial governments. Such fiscal and budgetary
arrangements constrain local climate action and limit the ability to raise and leverage private financial resources to address sustainable development and climate investments.79
In principle, there is no lack of capital in the global financial system to support the required climate action. But current committed investments fall short of the capital needed to enable a 1.5°C transition. Tentative commitments of climate finance in support of the Paris
V. CAN THIS BE PAID FOR?
UDAIPUR, INDIA

Summary for Urban Policymakers
25 // 30
Tentative commitments of climate finance in support of
the Paris Agreement amount to approximately USD 100 billion
per year by 2020.
$100 bl. / 2020 $2.4 tr. / 2016 - 2035
In the energy system alone, an estimated annual average
investment of around USD 2.4 trillion between 2016 and 2035 is needed to
keep warming below 1.5°C.
Agreement amount to approximately USD 100 billion per year by 2020. In the energy system alone, an estimated annual average investment of around USD 2.4 trillion between 2016 and 2035 is needed to keep warming below 1.5°C. Including other, non-energy infrastructure but excluding adaptation, this would amount to about 2.5% of the world’s total investments. Reaching this level involves both an increase in, and redirection of, investment given that 2% of world GDP would be invested into polluting and emitting infrastructure over the same period in a world with unchecked climate change.80 Cities, like industry and national governments, also need to prepare for stranded assets, and try to avoid them where they can.
Government policies can encourage the mobilisation of private funds by lowering the risk of low-emission and adaptation investments. Directing public investment towards mitigation and adaptation can mobilise institutional investors, asset managers, and development or investment banks. Financial regulators, such as central banks, can change the rules of the game, for instance, by requiring climate stress testing. Commercial financing may be viable only for a limited set of technical options, while debt financing could exacerbate ongoing economic
and development challenges. New forms of public-private partnerships can help ameliorate financial risk, including at the sub-national level. The strategic goal is to promote a portfolio shift towards long-term low-emission assets, and away from potential stranded fossil-fuel based assets, using a mix of financial and banking systems and institutional investor intermediation.81
A re-imagining of global and local financial frameworks and interactions could help address these gaps. A range of sub-sovereign and international transfers and financing mechanisms, innovative policy packages, incentives, and guarantees need to be structured, successfully tested, institutionalised, and scaled up. Such a re-imagination will require a wide range of new institutional and regulatory arrangements, including those developed between local and national governments, as well as public-private partnerships.82
Such a re-thinking will require the filling of significant knowledge gaps as it comes to climate financing, both globally and locally. These include gaps around avoided risks, loss and damage, as well as adaptation costs and finance.

Summary for Urban Policymakers
26 // 30
AN OPPORTUNITY THAT MUST BESEIZED OVER THE NEXT TWO DECADES.
The impacts of climate change will be experienced in the next decades by the world’s 8 billion people, most of them in cities. Urban policymakers play a key role in adapting to and driving solutions to climate change, but they must act fast and cannot do it alone.
The impacts of and solutions to climate change will be experienced by the entire world in the next decades, with upwards of 70% of the global population living in cities and urban areas. Unchecked, climate change will subject global and local ecosystems to increasing levels of risk, threatening to undo much of the economic and social progress, albeit uneven, since the end of World War II and the formation of the United Nations. Many of these risks will coalesce in cities and urban areas.
Cities are key implementers of policy steps to meet this challenge and exhibit the necessary political leadership to do so.83 Urban systems have the power to amplify or reduce the impacts associated with 1.5°C of warming or any breaching of that threshold. Successful city-level climate action strategies are at work today, and they are being advanced regionally and internationally through city networks. Some cities are within regions that have already exceeded 1.5°C and have been forced to adapt, affording them experiences that can be shared with, adapted for, or replicated in other cities. But city action alone will not be sufficient.
Limiting warming to 1.5°C will require immediate action within and across sectors, as well as multilevel governance. It will require rapid and far-reaching systems transitions in energy and industry, land use and ecosystems, urban and infrastructure, linked to the implementation of the SDGs. Cities offer many of the most readily-available, feasible, and cost-effective options for these transitions.
The tools are at hand. We possess the material basis and policy solutions for transformations and system changes in the direction of greater sustainability, inclusion, and resilience. Urban policymakers must seize the opportunity to meet the defining challenge of the planet, not in the distant future but, as the SR1.5 makes clear, within the next two decades.
CONCLUSION
RIO DE JANEIRO, BRAZIL
ACKNOWLEDGEMENTS
The authors would like to thank all the organizations, cities, and individuals that participated in this project for all their support and insight. Special thanks to the Global Covenant of Mayors for Climate and Energy and C40 Cities Climate Leadership Group for the invitation and facilitation of this report. Thanks also goes to Bloomberg Philanthropies and the Rockefeller Brothers Foundation for providing the resources and facilities to convene the lead authors. Special thanks to Ian Klaus and Claire Markgraf for their tireless commitment and coordination.
SPONSORS
The following are gratefully acknowledged for sponsoring development of the Summary for Urban Policymakers document:
CONVENERS
The following organizations convened the development of the Summary for Urban Policymakers document:
Philanthropy for an Interdependent World

ENDORSEMENTS

1. Full title: ‘Global Warming of 1.5°C - An IPCC special report on the impacts of global warming of 1.5°C above pre-industrial levels and related global greenhouse gas emission pathways, in the context of strengthening the global response to the threat of climate change, sustainable development, and efforts to eradicate poverty.’
2. SR 1.5, Chapter 1, Section 1.2.1; Chapter 1, Section 1.2.4.
3. Rounded to the nearest five years.
4. As a result of the uncertainty in the climate response, emission pathways can only provide a level of probability for warming remaining below a temperature limit (SR1.5, Chapter 1, Section 1.2.3).
5. SR1.5, Chapter 2, Section 2.2.2.
6. SR1.5, Chapter 2, Section 2.3.3.
7. When used by the IPCC, the word ‘likely’ indicates a probability of 66% or greater.
8. SR1.5, Chapter 1, Section 1.2.3.
9. SR1.5, Cross-Chapter Box 13 in Chapter 5; SR1.5, Cross-Chapter Box 9 in Chapter 4; Chapter 4 Executive Summary.
10. SR1.5, Chapter 1, Section 1.2.3; SR1.5, Chapter 2, Section 2.1.3; SR1,5, Chapter 2, Table 2.1.
11. SR1.5, Chapter 4, Section 4.3.1; SR1.5, Chapter 4, Section 4.3.2; SR1.5, Chapter 4, Section 4.3.3; SR1.5, Chapter 4, Section 4.3.4.
12. CDR use includes bioenergy with carbon dioxide capture and storage, a technological method of producing negative carbon emissions by using biomass (e.g., fast-growing trees, crops, or other plants that extract carbon dioxide from the atmosphere as they grow) for energy generation then capturing and storing the CO2 emitted during this process, typically within geological formations.
13. SR1.5, Chapter 4, Section 4.3.7.
14. SR1.5, Cross-Chapter Box 12 in Chapter 5.
15. The terms ‘Global North’ and ‘Global South’ are used in this report to connote a variety of factors that distinguish societies (cultural, social, economic, political, environmental, etc.). These are not necessarily reflected in other commonly-used development or income-based classifications.
16. SR1.5, Chapter 3, Section 3.4.13.
17. SR1.5, Cross-Chapter Box 11 in Chapter 4.
18. SR1.5, Chapter 3, Section 3.4.7.
19. SR1.5, Chapter 5 Executive Summary.
20. SR1.5, Chapter 3, Section 3.4.10.
21. SR1.5, Chapter 4, Section 4.3.5; Chapter 4, Table 4.4.
22. SR1.5, Chapter 3, Section 3.4.2.
23. SR1.5, Chapter 3, Section 3.4.2.
24. SR1.5, Cross-Chapter Box 6 in Chapter 3.
25. SR1.5, Chapter 3, Section 3.4.4.
26. SR1.5, Cross-Chapter Box 11 in Chapter 4.
27. SR1.5, Chapter 4, Section 4.2.2.
28. SR1.5. Chapter 4, Section 4.2.2.
29. SR1.5, Chapter 4, Section 4.2.2; SR1.5, FAQ 4.3.
30. SR1.5, Chapter 4, Section 4.4.1.
31. SR1.5, Chapter 4, Table 4.8.
32. SR1.5, Chapter 4, Section 4.3.2 or 5; SR1.5, Chapter 4, Table 4.8.
33. IPCC, Climate Change 2014: Impacts, Adaptation, and Vulnerability. Contribution of Working Group II to the Fifth Assessment Report of the Intergovernmental Panel on Climate Change (AR5, WGII), Chapter 8.
34. IPCC, Climate Change 2014: Mitigation of Climate Change. Contribution of Working Group III to the Fifth Assessment Report of the Intergovernmental Panel on Climate Change (AR5, WGIII), Chapter 12.
35. AR5, WGIII, Chapter 12; SR1.5, Chapter 4, Section 4.3.3.
36. AR5, WGIII, Chapter 12.
37. AR5, WGIII, Chapter 12.
38. AR5, WGIII, Chapter 12.
39. SR1.5, Chapter 4, Section 4.3.3.
40. SR1.5, Chapter 4, Section 4.3.3; SR1.5, Chapter 4, Table 4.2.
41. SR1.5, Chapter 5, Section 5.4.1.
42. SR1.5, Chapter 4, Table 4.1.
43. SR1.5, Chapter 4, Section 4.3.1; Section 4.5.2; SPM Section C2.2.
44. SR1.5, Chapter 4, Table 4.1.
45. SR1.5, Chapter 4, Section 4.3.3.
46. SR1.5, Chapter 5, Section 5.4.1.
47. SR1.5, Chapter 4, Section 4.3.4.
48. SR1.5, Chapter 5, Table 5.2.
49. SR1.5, Chapter 4, Section 4.3.3.
50. SR1.5, Chapter 4, Section 4.3.3; Table 4.2.
51. SR1.5, Chapter 4, Section 4.3.1; Section 4.3.3.
52. SR1.5, Chapter 4, Section 4.3.3; Cross-Chapter Box 13 in Chapter 5.
53. SR1.5, Chapter 4, Section 4.4.4.
54. AR5 WGIII, Chapter 12, SR1.5, Chapter 4, Section 4.3.3
55. SR1.5, Chapter 4, Section 4.4.1.
56. SR 1.5 elaborates on the multiple dimensions of feasibility: (i) capacity of physical systems to support the option (geophysical feasibility); (ii) availability of sufficient natural systems and resources to support implementation (environmental-ecological feasibility); (iii) degree to which required technologies are developed and available for large-scale deployment (technological feasibility); (iv) necessary economic and financial conditions (economic feasibility); (v) options for behaviour change, public acceptability of proposed changes, and implications for human well-being and health (social/cultural feasibility); and (vi) governance, institutional capacities, and political support (institutional feasibility).
57. SR1.5, Cross-Chapter Box 3 in Chapter 1.
58. SR1.5, Chapter 4, Section 4.5.2.
59. SR1.5, Chapter 4, Section 4.5.3.
60. SR1.5, Chapter 4, Section 4.5.4.
61. SR1.5, Figure SPM.4.
62. SR1.5, Chapter 4, Section 4.6; Box 4.13.
63. SR1.5, Chapter 4, Section 4.4.
64. SR1.5, Chapter 4, Section 4.4.1.
65. SR1.5, Chapter 4, Section, 4.4.3; SR1.5, Chapter 4, Box 4.1.
66. SR1.5, Chapter 4, Section 4.4.1
67. SR1.5, Chapter 4, Section 4.4.1.
68. SR1.5, Chapter 4 Section 4.4.2.
69. AR5, WGIII, Ch.8.
70. SR1.5, Chapter 4 Section 4.4.2.
71. SR1.5, Chapter 4 Executive Summary.
72. SR1.5, Chapter 4 Section 4.4.1; Section 4.4.4.
73. SR1.5, Chapter 4 Section 4.4.4.
74. SR1.5, Chapter 4 Section 4.4.4.
75. SR1.5, Chapter 5 Section 5.6.1.
76. SR1.5, Chapter 4 Section 4.4.4
77. SR1.5, Chapter 4 Section 4.4.1; Box 4.1
78. SR1.5, Chapter 4 Section 4.4.3
79. SR1.5, Chapter 4, Section 4.4.2.
80. SR1.5, Chapter 2, Section 2.5.2; SR1.5, Chapter 4, Section 4.4.5; SR1.5, Chapter 4, Box 4.8. Figures in 2010 USD.
81. SR1.5, Chapter 4 Section 4.4.5.
82. SR1.5, Chapter 1 Section 1.4; SR1.5, Chapter 4, 4.2.2; SR1.5, Chapter 4, Section 4.4.1; SR1.5, Section 4.4.3; SR1.5, Chapter 4, Section 4.4.5; SR1.5, Chapter 4, Section 4.5.3; SR1.5, Chapter 5, Section 5.4.1; SR1.5, Chapter 5, Section 5.6.2; SR1.5, Chapter 5, Box 5.3.
83. SR1.5, Chapter 4, Box 4.1.
ENDNOTES

SUMMARY FOR URBANPOLICYMAKERS
WHAT THE IPCC SPECIAL REPORT ON GLOBAL WARMING OF 1.5°C MEANS FOR CITIES.
Contact


